

1. Define the liquidity-budget decision
An endowment liquidity budget is the governed allocation of cash and executable liquid resources across spending distributions, capital calls, collateral, debt service, operating contingencies and portfolio rebalancing. It translates a long-term investment strategy into a schedule of obligations and funding sources. The budget must show who can use each source, when it becomes available and which other claim has priority.
The decision differs from setting a cash target. A single cash percentage does not reveal whether resources are unrestricted, whether securities can be sold without breaching policy, whether a credit line remains drawable during stress or whether one asset has been counted against several obligations. The budget instead assigns resources to horizons and preserves a minimum reserve after all higher-priority uses.
The board should approve the liquidity architecture, minimum coverage standards and authority to take actions. Management should operate within those limits, update the forecast and escalate when a trigger is crossed. The investment committee should see the connection between new private commitments and the institution's spending and collateral needs before approving either a commitment programme or a material allocation change.
The required output is a decision record. It should state the opening liquidity position, forecast uses, eligible sources, central and adverse outcomes, warning thresholds, actions, owners and evidence date. This record makes the trade-off between mission support and illiquidity visible before market conditions impose it.
2. Connect spending policy to cash delivery
An endowment spending rule usually determines the amount transferred to the operating institution. Common designs apply a percentage to a moving average of market value, use a hybrid of prior spending and market value, or combine floors and ceilings. These designs can reduce year-to-year volatility, yet the approved distribution still needs cash on scheduled dates.
The investment portfolio may earn a positive total return while producing insufficient cash. Private-asset appreciation raises reported value without creating a distribution. Public equities can be liquid, while selling them after a market fall may lock in losses and increase the private-asset percentage. A spending rule should therefore be accompanied by a cash-delivery plan rather than treated as a funding mechanism.
The plan should separate the annual policy amount from the monthly or quarterly settlement pattern. A USD 600 million annual distribution can create different liquidity demands if it is paid evenly, front-loaded for an academic year, or adjusted through supplemental appropriations. Treasury should map actual dates, currencies, restricted-fund eligibility and operational cut-offs.
NACUBO reported that 657 participating US institutions spent USD 33.4 billion from endowments in fiscal 2025 and recorded an average effective spending rate of 4.9 per cent [1]. These figures provide sector context. They do not determine a prudent rate or liquidity reserve for an individual institution.
3. Distinguish accounting value from spendable liquidity
Endowment assets can be divided by donor restriction, governing instrument, legal form, investment vehicle, currency and settlement characteristics. The total balance is therefore not a single pool available for any purpose. A board can overestimate resilience when it views market value without mapping these constraints.
Restricted endowment funds may support only specified activities. Permanent endowment can preserve capital subject to applicable law and governing documents. Funds functioning as endowment can have internal withdrawal rules. Unitised investment pools may distribute value to many underlying funds while the central investment office manages one portfolio. The liquidity budget must preserve these relationships.
The UK Charity Commission explains that trustees of permanent endowment must balance current income and future growth and, where authorised, may use a total-return approach that allocates investment return between current application and continuing investment [9][10]. US institutions also operate within donor intent, governing documents and applicable state law, often informed by prudent-management statutes. Legal advice remains institution-specific.
The practical control is a source-eligibility matrix. Each resource should identify the owning entity, restriction, permitted use, notice period, settlement time, haircut, currency, encumbrance, operational account and approving authority. Only the amount available for the relevant use within the relevant horizon belongs in liquidity coverage.
4. Treat private assets as a funding schedule
Private equity, venture capital, private credit, infrastructure, real estate and natural-resources funds create contractual and contingent cash flows. The endowment commits capital first. Managers call that capital over time, distribute proceeds when investments are realised or refinanced, and report valuations that may lag public markets.
The current net asset value measures funded exposure. Unfunded commitments measure remaining callable capital. Neither amount alone describes liquidity. A mature private portfolio can generate distributions that support new calls and spending. The same portfolio can become a net cash user when exits slow, follow-on needs rise or managers deploy existing commitments faster.
Calls and distributions should be forecast separately by fund, vintage and strategy. Netting them too early hides the scale and timing of gross obligations. A year with USD 500 million of calls and USD 520 million of distributions appears to provide USD 20 million, while a three-month delay in distributions can create a substantial cash requirement.
IMF analysis notes that closed-end private funds generally limit investor redemptions, reducing liquidity transformation within the fund, while capital calls and other connections can transfer liquidity needs to end investors [12]. The endowment's liquidity problem is therefore concentrated in its own obligation schedule and ability to realise other assets.
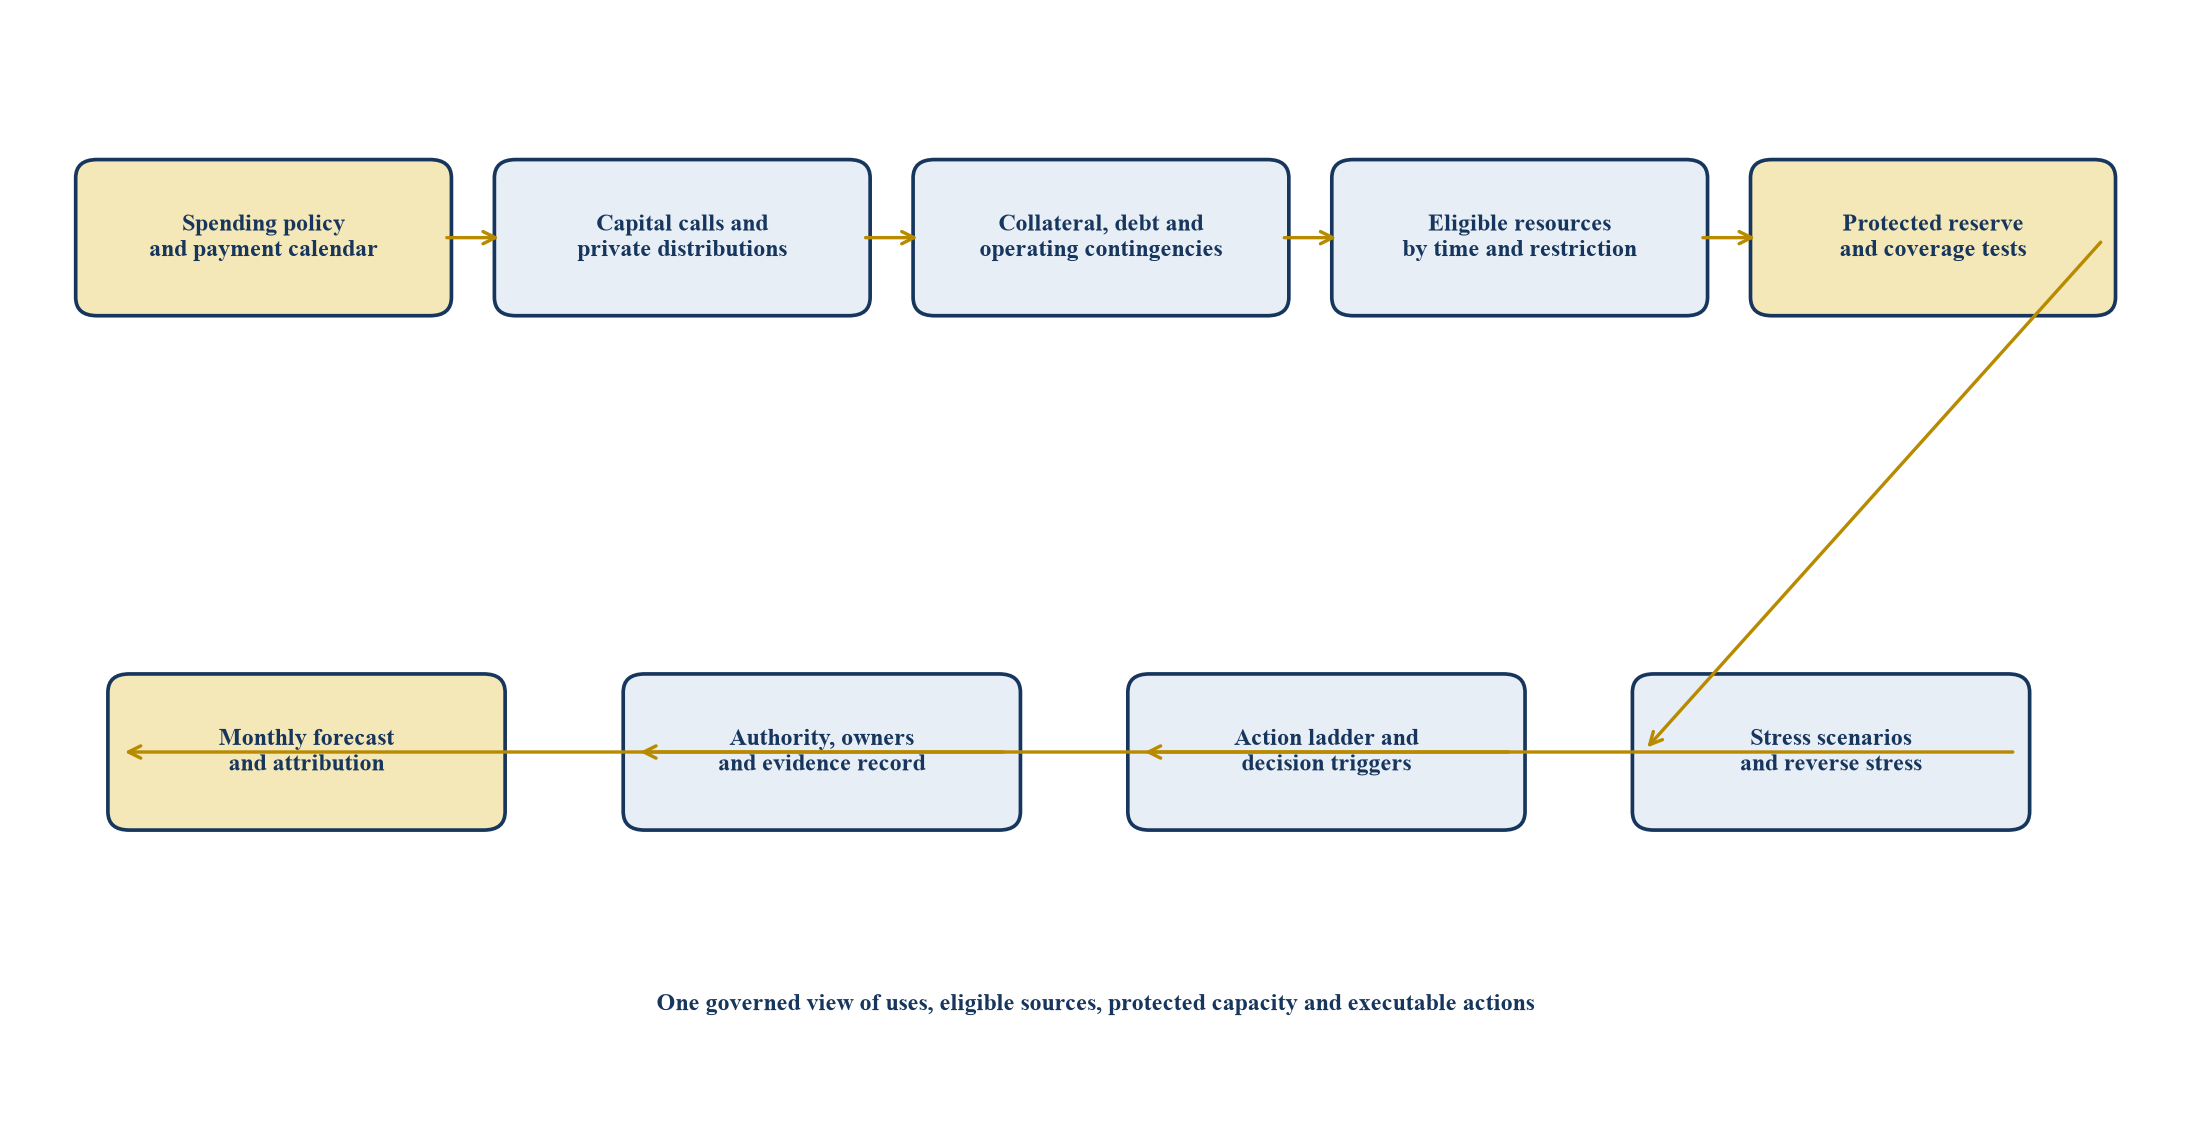
The framework connects mission spending and portfolio obligations to legally available resources, stress capacity and governed actions.
5. Ground the budget in current institutional evidence
The 2025 NACUBO-Commonfund study represented USD 944.3 billion of endowment assets. The dollar-weighted allocation included 16.8 per cent private equity, 12.2 per cent venture capital and 15.4 per cent marketable alternatives [1][2]. The mix confirms that private strategies are material to institutional portfolios, while the published aggregates do not reveal any one institution's contractual cash-flow risk.
Large universities show how deeply endowment spending can support operations. Harvard reported that fiscal 2025 endowment distributions contributed nearly 40 per cent of annual operating revenue, while its published portfolio included 41 per cent private equity and 3 per cent cash [3][4]. Princeton reported a USD 1.8 billion payout and a 5.37 per cent spending rate for fiscal 2025 [5]. Stanford reported a USD 1.946 billion endowment payout and a USD 40.787 billion year-end endowment [6]. Yale states that its endowment contributes roughly one third of the annual operating budget [7].
These disclosures demonstrate operating dependence and portfolio complexity. They do not establish the liquidity reserves, callable commitments, restriction profiles or action capacity of another institution. The appropriate budget must be built from the institution's own records and governing obligations.
The evidence also supports a governance conclusion. An endowment can have strong long-term performance and still face a short-horizon cash constraint. The board should assess liquidity through dated uses and executable sources rather than through reputation, scale or reported return alone.
6. Define the hypothetical endowment
The worked case assumes a USD 12.0 billion endowment invested through a central pool. The annual spending distribution is USD 600 million, equal to 5.0 per cent of opening market value. The distribution provides 24 per cent of the institution's operating revenue and is paid in twelve monthly instalments.
Private assets have a reported net asset value of USD 4.20 billion, equal to 35.0 per cent of the investment pool. Unfunded commitments total USD 1.80 billion. The endowment expects USD 520 million of private capital calls and USD 480 million of private distributions during the next twelve months under the central case.
Cash and short-duration government securities total USD 900 million. Restriction, settlement and operating-reserve tests leave USD 720 million available within five business days for the uses in the liquidity budget. A further USD 1.20 billion of high-quality public securities is assumed saleable within ten business days after stress haircuts. A committed bank line provides USD 300 million, subject to its terms and continuing availability.
The endowment also maintains currency hedges and other derivatives. The central collateral allowance is USD 90 million, rising to USD 260 million in the combined stress. Every figure is hypothetical and exists only to illustrate the method.
| Item | Illustrative assumption | Liquidity significance | Evidence required in practice |
|---|---|---|---|
| Total endowment market value | USD 12.0bn | Portfolio denominator and mission base | Custodian, administrator and ledger reconciliation |
| Annual spending distribution | USD 600m | Recurring mission cash use | Approved spending policy and payment calendar |
| Operating-revenue support | 24% | Institutional dependence | Audited finance records and current budget |
| Private-asset net value | USD 4.20bn | Illiquid funded exposure | Manager statements and valuation review |
| Unfunded commitments | USD 1.80bn | Callable contractual exposure | Executed agreements and commitment register |
| Central twelve-month calls | USD 520m | Forecast private funding use | Fund-level call curves and manager guidance |
| Central twelve-month distributions | USD 480m | Forecast private cash source | Evidence-ranked realisation schedule |
| Five-day eligible resources | USD 720m | First liquidity tier | Legal eligibility, cash and settlement proof |
| Ten-day public-asset capacity | USD 1.20bn | Second liquidity tier after haircut | Position, market-depth and settlement analysis |
| Committed bank line | USD 300m | Contingent bridge capacity | Executed facility and draw-condition review |
| Central collateral allowance | USD 90m | Short-notice cash use | Derivative and currency stress model |
Every amount, percentage, timing assumption and threshold is an illustrative management input rather than observed institutional data, a forecast or investment advice.
7. Build a complete uses register
The uses register should include every material claim on liquid resources over the budget horizon. It begins with approved spending distributions, signed capital commitments, debt service, known capital expenditure, derivative collateral, tax, operating reserves and contractual grants. It also includes contingent uses whose probability or timing can change under stress.
Each use needs an amount, currency, earliest date, latest date, legal priority, probability, evidence source, owner and update frequency. Capital calls should be represented at gross amount before expected distributions. Collateral should use current positions and stress sensitivities. Spending should use the actual transfer schedule rather than an annual average.
The register should avoid double counting. An operating reserve transferred to a separate entity can cease to be available for investment calls. A committed acquisition or construction programme can consume assets that remain visible in the investment account until settlement. A currency hedge can protect economic value while creating collateral needs.
The finance and investment teams should reconcile the register monthly. Material differences between forecast and actual dates should be attributed to specific drivers. A forecast that is consistently right in annual total and wrong in monthly timing remains unsuitable for liquidity control.
8. Rank resources by legal and operational availability
Liquidity begins with resources that can be used, transferred and settled within the required horizon. Cash in the correct entity and currency normally forms the first tier. Short-duration government securities, money-market instruments and unencumbered high-quality public assets can form later tiers after applying settlement periods and stress haircuts.
The budget should distinguish market liquidity from institutional liquidity. A security can trade daily while sale proceeds remain unavailable for a restricted purpose. A separately managed account can hold liquid assets while operational authority or collateral arrangements delay access. A line of credit can be legally committed while financial covenants or draw conditions limit practical use.
Every source should be assigned once. Resources reserved for derivative collateral should not also cover spending and capital calls. Assets required to preserve a minimum public-equity allocation should be shown as contingent rather than freely available. Securities lending collateral, encumbered assets and pending settlement amounts need explicit treatment.
The result is a time-bucketed source ladder. It identifies cash available today, within five days, within ten days, within thirty days and over longer periods. Each tier is recorded net of haircut, tax, transaction cost, currency conversion and competing claims.
9. Map restrictions before aggregation
Endowment pools often combine thousands of underlying funds. The investment office may manage them collectively, while spending permissions and beneficiary purposes remain separate. A central liquidity figure can therefore conceal a mismatch between where cash sits and where the obligation arises.
The restriction map should link each underlying fund or legal pool to permitted spending, investment participation, withdrawal terms and available reserves. It should identify permanently restricted capital, temporarily restricted resources, quasi-endowment, unrestricted reserves and funds held by related foundations or special entities.
The model can aggregate only after testing transferability. A surplus in one restricted pool cannot automatically fund another pool's deficit. Inter-entity loans, internal advances or unit redemptions require documented authority, pricing, accounting and repayment terms. The board should not assume that organisational affiliation creates legal availability.
The map also improves investment design. A fund with predictable annual spending and limited replenishment may require a different liquidity sleeve from a fund whose distributions are small relative to assets. Pooling can remain efficient while the budget preserves underlying claims.
10. Forecast capital calls by vintage and strategy
Capital-call forecasts should begin with the commitment register. Each fund line should show committed capital, paid-in capital, unfunded balance, investment-period end, recallable distributions, expected extensions, notice requirements, currency and recent manager guidance.
Historical call patterns can provide a calibration range. They should not replace current evidence. New buyout funds may call over several years, private-credit funds may deploy faster, infrastructure funds may draw against project milestones and co-investments can require cash on transaction timetables. Fund-level subscription facilities can delay investor calls and create a later concentration.
The forecast should use central, accelerated and maximum-operational cases. The maximum legal unfunded amount may be too conservative for ordinary planning, while it remains relevant to contractual exposure. The accelerated case should reflect plausible manager behaviour, overlapping successor vintages and correlated deployment.
Management should compare actual calls with the forecast every month. Variance should be attributed to deployment speed, recallable capital, facility repayment, foreign exchange and scope changes. The next commitment decision should use the updated call curve rather than the original underwriting schedule.
11. Forecast distributions through an evidence ladder
Private distributions can arise from asset sales, refinancings, dividends, loan repayments and public-market exits. Their timing is less controllable than a contractual spending date or capital-call notice. The liquidity budget should therefore rank distribution evidence.
Tier one can include cash already received or contractually due without material closing conditions. Tier two can include signed transactions with remaining conditions and manager-confirmed near-term repayments. Tier three can include active sale processes, expected refinancings and manager estimates. Tier four includes statistical run rates and modelled exit assumptions.
Only the strongest tiers should support short-horizon obligations. Lower-confidence distributions remain useful for multi-year planning and should be reduced or delayed in stress. This approach prevents an optimistic exit calendar from financing hard spending and call commitments.
The forecast should preserve gross distributions by strategy and vintage. A broad percentage of net asset value can obscure a mature fund approaching realisation, a venture portfolio dependent on public listings or a credit portfolio with contractual repayments. Evidence quality matters as much as amount.
12. Integrate the operating institution
Endowment liquidity cannot be managed separately from the institution's cash system. The operating budget determines distribution dates and can create supplemental calls during disruption. Working capital, debt covenants, capital projects, payroll cycles, philanthropy and external funding can all affect the investment pool.
The finance team should provide a rolling operating forecast and identify which shocks can increase reliance on the endowment. Examples include lower enrolment, delayed grants, reduced donations, emergency expenditure or higher borrowing costs. The investment team should show the capacity and cost of meeting those needs.
Harvard reported that endowment distributions represented 37 per cent of university revenue in fiscal 2025, with variation across schools [4]. Princeton reported that investment income remained central to its operating finances [5]. The lesson is institutional dependence, not a recommended payout rate.
The board should approve a protocol for extraordinary distributions. The protocol should define who requests funding, what evidence is required, how donor and legal constraints are checked, which investment actions are permitted and how future spending or allocation decisions are reconsidered.
13. Build the five-year liquidity bridge
The liquidity bridge starts with opening eligible resources and adds expected investment cash inflows, operating contributions and facility availability. It deducts spending distributions, capital calls, collateral, debt service, fees and other approved uses. Closing eligible resources become the next period's opening balance after adjusting for restrictions and policy floors.
The bridge should retain monthly detail for the next twelve to eighteen months and annual or quarterly detail thereafter. Short-horizon detail supports operations. Longer-horizon projections reveal the cumulative effect of commitment pacing, spending and exit assumptions.
The worked case assumes central calls of USD 520 million in year one, gradually falling as existing vintages mature, with new commitments creating later calls. Central private distributions rise from USD 480 million to USD 650 million as realisations normalise. Annual spending grows at 3 per cent. These assumptions are illustrative.
The bridge is a control model rather than a valuation forecast. Its purpose is to identify when resources can fall below the board's minimum, what causes the shortfall and which action has enough lead time to prevent it.
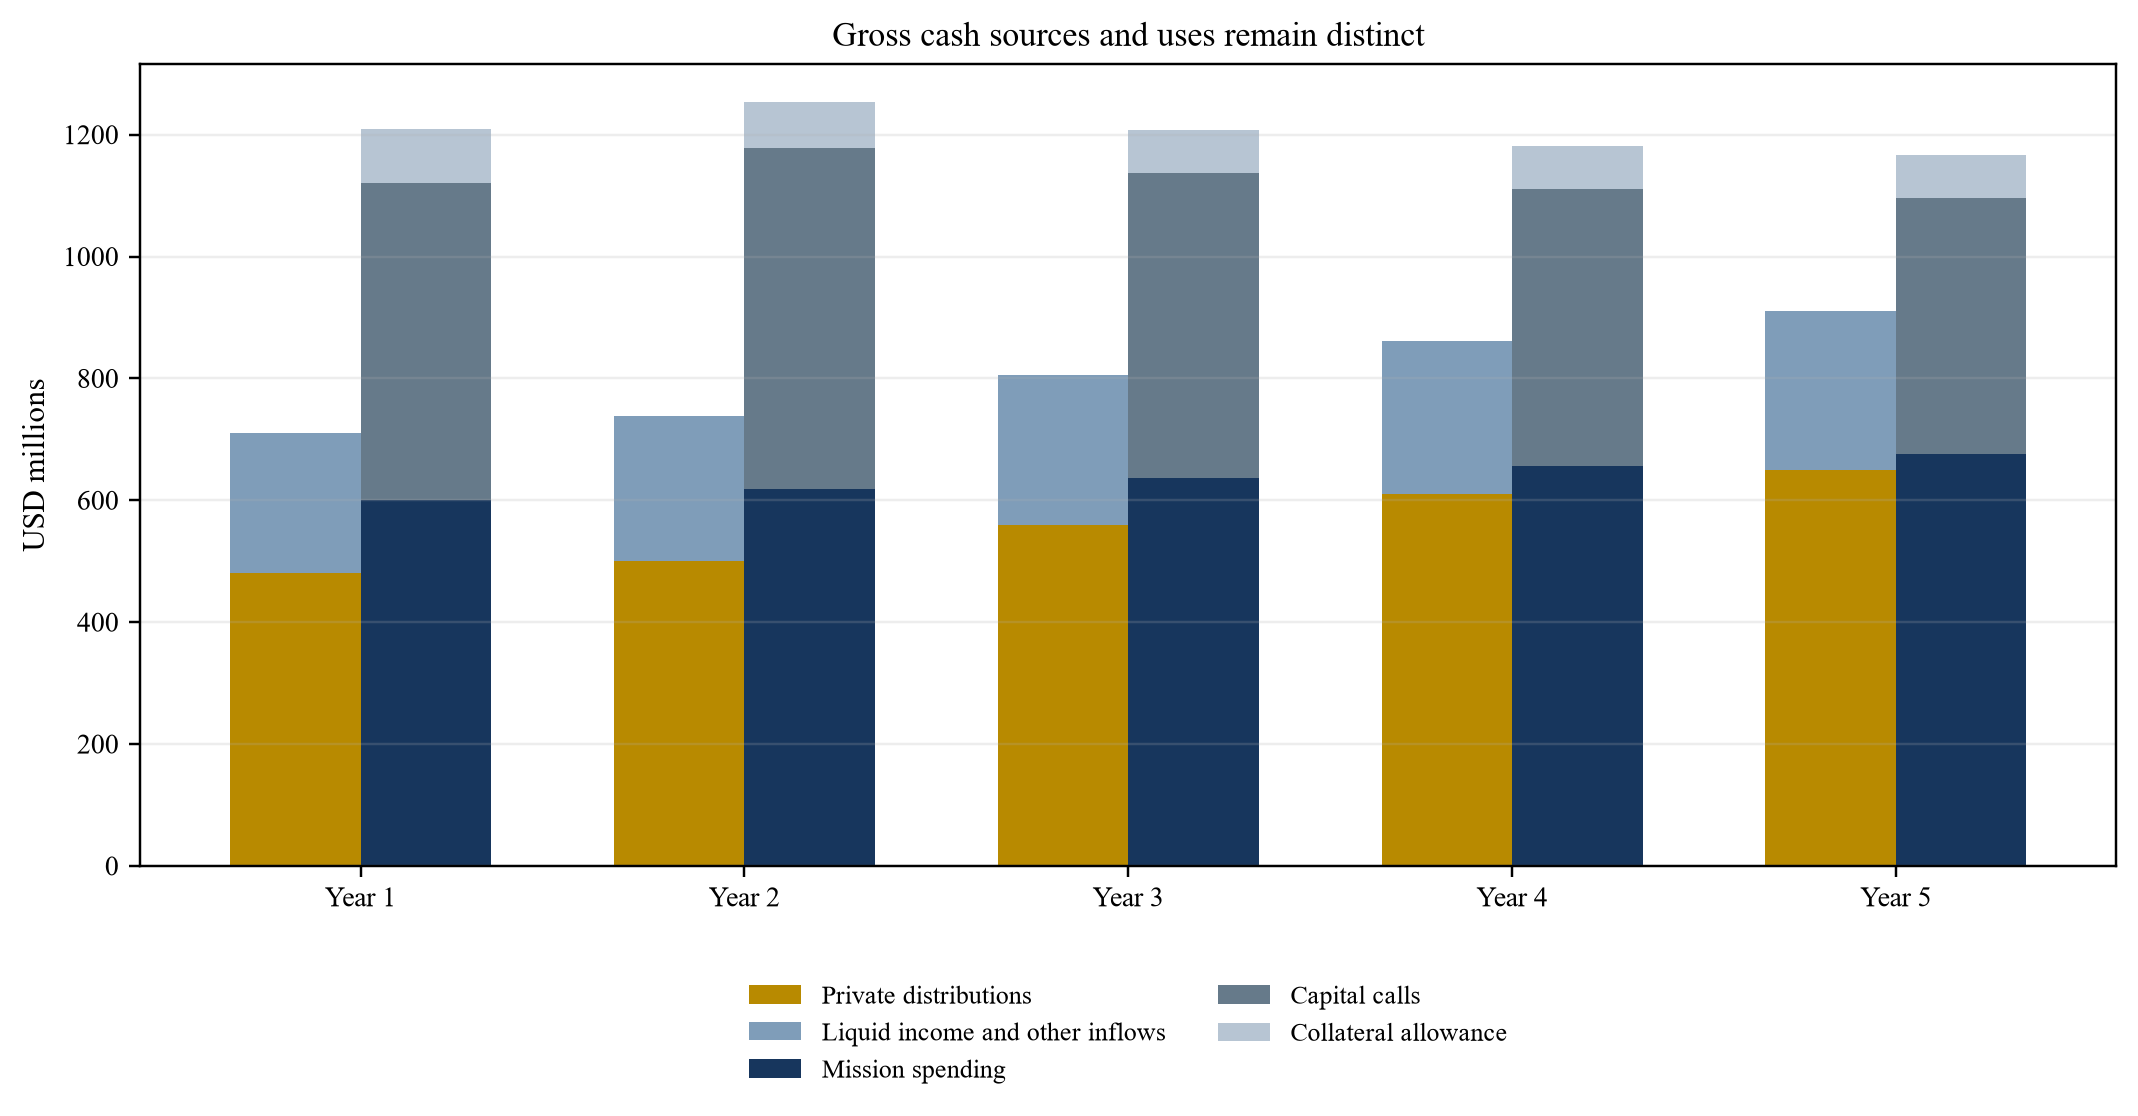
Illustrative annual cash flows show why private distributions, capital calls and mission spending should remain visible as gross amounts.
14. Define protected liquidity and coverage ratios
The protected reserve is the amount the institution intends to preserve after funding forecast uses. It can be expressed as months of spending, a percentage of market value or a coverage ratio. The strongest design connects the reserve to actual obligations and stressed access.
One useful measure divides eligible resources within the chosen horizon by stressed uses over the same horizon. Eligible resources are net of restrictions, haircuts and prior claims. Stressed uses include spending, calls, collateral and other obligations. A ratio above one indicates coverage in the model, while it does not prove market access or legal availability.
The worked case sets a board floor of 1.25 times for twelve-month stressed uses and a warning level of 1.50 times. These thresholds are hypothetical. The institution should calibrate its own standards to dependence on endowment distributions, access to borrowing, private-market concentration, operating volatility, governance speed and risk tolerance.
Coverage should be shown with and without contingent facilities. A credit line can bridge timing, while it introduces interest cost, maturity, covenant and refinancing risk. The board should see whether the portfolio remains resilient if the line is reduced, unavailable or needed by the operating institution at the same time.
15. Stress distributions, calls and public markets together
A credible stress should combine variables that can move together. A private-exit slowdown can reduce distributions while managers continue calling committed capital. A fall in public markets can shrink the liquid pool and raise the private-asset percentage before private valuations adjust. Currency moves can create collateral needs. Operating pressure can increase requested spending.
The central case is a planning reference. The delayed-distribution case reduces private distributions by 50 per cent for two years and defers part of the recovery. The accelerated-call case advances 30 per cent of selected future calls into the next eighteen months. The combined case adds a 25 per cent public-market fall, a USD 260 million collateral requirement and a temporary 8 per cent increase in mission spending.
The assumptions are illustrative and should not be presented as probabilities. An institution should calibrate stresses from contractual terms, historical drawdowns, manager behaviour, operating sensitivities and current market conditions. Separate scenarios can test legal restrictions, bank-line withdrawal, foreign-exchange disruption and settlement failure.
The model should also perform reverse stress. It asks how far distributions can fall, calls can accelerate or public assets can decline before the minimum reserve is breached. Reverse stress converts an abstract risk appetite into observable trigger distances.
| Scenario | Private distributions | Capital calls | Public-market and collateral shock | Management purpose |
|---|---|---|---|---|
| Central | Evidence-ranked base schedule | Fund-level central call curves | Normal haircuts; USD 90m collateral allowance | Operating plan and annual pacing |
| Delayed exits | 50% reduction in years 1-2; recovery deferred | Central call curves continue | Normal market values and haircuts | Test dependence on private realisations |
| Accelerated calls | Central distribution schedule | 30% of selected later calls advanced into 18 months | Normal market values; higher settlement demand | Test overlapping deployment and notice risk |
| Combined stress | 60% reduction in years 1-2 | Accelerated calls | 25% public-market fall; USD 260m collateral; 8% temporary spending increase | Test action capacity under correlated pressure |
Scenario values are illustrative management assumptions. They are not probabilities, forecasts or observed endowment results.
16. Model the denominator effect and rebalancing demand
Public assets are marked frequently. Private valuations often arrive quarterly and with a lag. A sharp fall in listed markets can therefore reduce total endowment value before private values adjust. The reported private-asset percentage rises even if the private portfolio has not generated cash or increased in economic value.
The denominator effect creates two liquidity pressures. The endowment may need to rebalance into public risk assets while private calls continue, and policy limits may constrain new private commitments or require corrective action. Selling liquid assets to fund calls can increase the private percentage further.
The liquidity budget should model market values and cash flows together. It should show the allocation after a public-market shock, after private valuation adjustments and after planned calls and distributions. Rebalancing should be treated as a use of liquidity rather than an automatic residual.
Management can respond by widening tactical ranges within approved authority, slowing new commitments, using liquid derivatives, changing the sequencing of rebalancing or considering secondary sales. Each action has cost, risk and governance implications. The board should approve the hierarchy before a stress event.
17. Control collateral and currency liquidity
Endowments use currency hedges, interest-rate derivatives and other instruments to manage risk or implement exposures. These positions can create short-notice collateral requirements even when their long-term economic purpose remains sound. The liquidity budget should include them at portfolio level.
The collateral model should identify current variation margin, initial margin, thresholds, eligible collateral, settlement currency, custodian process, counterparty concentration and intraday demands. It should apply correlated market moves rather than isolated sensitivities. Currency depreciation can coincide with public-market losses and delayed private distributions.
The FSB recommends robust liquidity preparedness for margin and collateral calls and emphasises governance, stress testing and contingency planning [14]. Its work on non-bank leverage also highlights the potential for leverage to amplify stress through market and institutional interconnections [15]. These principles support a reserve that is operationally segregated from ordinary spending and calls.
The institution should conduct periodic collateral drills. The test should trace a margin notice through approval, asset mobilisation, currency conversion, settlement and record reconciliation. A modelled resource is not dependable until the operating chain can deliver it within the contractual deadline.
18. Design an action ladder before liquidity is scarce
The action ladder ranks interventions by lead time, cost, reversibility and governance requirement. Early actions can include cancelling discretionary investment purchases, retaining private distributions, increasing cash from maturing securities and reducing the next commitment cycle. Later actions can include drawing facilities, selling public assets, using derivatives for temporary exposure and pursuing private-market secondary transactions.
Each action needs a trigger, owner, approving body, execution time, capacity, expected cost and constraints. The ladder should recognise interactions. Drawing a credit line can preserve assets but reduce future borrowing capacity. Selling public assets can meet cash needs while worsening the private-allocation percentage. A secondary sale can reduce unfunded commitments but crystallise a discount.
Actions should be tested against the institution's real governance calendar. A board approval that takes six weeks cannot solve a collateral need due tomorrow. Delegated authority should therefore cover predefined actions within limits, with prompt reporting and retrospective review.
The endowment should preserve options during normal conditions. Facility maturities, counterparty capacity, settlement accounts, data quality and legal documentation can be maintained before stress. Preparedness has value even when the action is never used.
19. Govern new private commitments through the budget
Every new commitment changes the future use schedule. The investment case should therefore include its effect on unfunded commitments, forecast calls, strategy concentration, currency, policy range and stressed liquidity coverage. Expected return should not substitute for funding capacity.
The committee can approve an annual commitment band with gates. The lower bound preserves programme continuity and vintage diversification. The central amount reflects the strategic path and current evidence. The upper bound is available only when liquidity coverage, allocation headroom, data quality and operating forecasts remain within limits.
Commitments should pause when the combined-stress coverage ratio falls below the board floor, underlying records are unreconciled, restriction maps are incomplete or planned actions cannot restore capacity within the required horizon. A pause is a governance response to evidence rather than a prediction about private-market returns.
The institution should also account for recycling, recallable distributions, co-investments, successor-fund timing and potential extensions. A headline commitment amount can understate effective callable exposure when these features are excluded.
20. Use facilities as bridges with explicit exit plans
Credit facilities can bridge timing between calls, distributions and asset sales. They can reduce operational friction and avoid selling assets on an unfavourable day. Their capacity should be measured after legal conditions, financial covenants, entity access, maturity and competing institutional needs.
The budget should show coverage before and after the facility. Management should identify the repayment source and maximum period outstanding. A facility that funds recurring structural deficits becomes part of the capital structure rather than a temporary liquidity tool.
The combined stress should test reduced line availability, higher borrowing cost and simultaneous operating demand. The institution should also test whether drawing the line affects ratings, covenants, donor relationships or future capital-market access.
Facility documentation should align with the action ladder. Draw authority, notice, permitted use, representations, reporting and settlement accounts should be understood before the line is needed. Treasury should conduct periodic operational tests where permitted.
21. Evaluate secondary sales as a governed option
A private-market secondary sale can generate cash, reduce unfunded commitments, reshape strategy exposure or create policy headroom. It can also involve discounts, selection effects, confidentiality, consent, transaction costs and loss of future upside. It should appear in the action ladder with realistic execution timing.
The decision should assess cash proceeds and avoided future calls together. A sale of a mature interest may generate near-term cash while giving up expected distributions. A sale of a younger fund can reduce unfunded exposure but attract a different price. Portfolio sales can improve execution certainty and reduce flexibility.
The endowment should prepare data, ownership records, transfer restrictions and valuation analysis in advance. Market soundings require controls over confidentiality and conflicts. The board should define the circumstances in which a sale supports portfolio objectives rather than merely covering a planning failure.
Harvard's 2025 investment letter described private-equity secondary activity as intentional portfolio management [3]. That institution-specific disclosure illustrates a possible tool. It does not establish price, motive or suitability for another endowment.
22. Apply a decision scorecard
The committee needs a concise scorecard that preserves the evidence behind the recommendation. It should cover spending coverage, twelve-month stressed liquidity, collateral capacity, unfunded concentration, private allocation headroom, operating dependence, facility availability, restriction mapping and action readiness.
Each measure should have a current value, warning level, breach level, trend, evidence date, owner and required response. A green overall label should never obscure a red component. The scorecard should show the consequence of the proposed commitment or extraordinary distribution before and after approval.
The scorecard should distinguish policy compliance from resilience. An endowment can remain within its strategic allocation and still have weak short-horizon coverage. It can also hold ample cash while an unreconciled restriction prevents use. Both conditions require action.
| Measure | Illustrative warning | Illustrative breach | Required response |
|---|---|---|---|
| Twelve-month combined-stress coverage | Below 1.50x | Below 1.25x | Reduce planned uses; activate action ladder; escalate to board |
| Five-day collateral coverage | Below 1.75x | Below 1.25x | Mobilise eligible collateral; reduce exposures; test facility |
| Private assets as percentage of total | Within 2 points of upper policy bound | Above upper policy bound | Restrict commitments; approve rebalancing plan |
| Unfunded commitments to eligible ten-day resources | Above 1.50x | Above 2.00x | Recalibrate call stress; increase liquid capacity |
| Distribution forecast confidence | More than 30% from low-confidence tiers | More than 50% from low-confidence tiers | Exclude weaker proceeds from near-term coverage |
| Restriction and ownership reconciliation | Open differences over 30 days | Material unresolved eligibility | Remove disputed resources from coverage |
| Action readiness | One key action untested | No executable action within breach horizon | Convene committee and remediate authority or documentation |
Thresholds are hypothetical and require institution-specific calibration and approval.
23. Establish governance and delegated authority
The board owns the spending policy, strategic allocation, risk appetite and minimum liquidity standards. The investment committee governs commitments and portfolio actions. The chief investment officer maintains the investment forecast. Finance and treasury own operating cash, collateral execution, facilities and settlement. Legal and compliance confirm restrictions and authority.
These roles should be documented in a responsibility matrix. Decisions should identify who prepares, challenges, approves, executes and records each action. The matrix should cover ordinary operation, warning conditions and breaches.
Delegated authority should be specific. Management can be permitted to sell defined liquid assets, retain distributions, draw an approved facility or adjust commitment timing within stated limits. Larger reallocations, extraordinary spending and secondary sales can remain reserved for the board or committee.
The governance record should include assumptions, source dates, model changes, dissent, conflicts and follow-up actions. This record supports fiduciary oversight and allows the institution to learn from forecast variance without rewriting the original decision.
24. Monitor actual outcomes and forecast error
The liquidity budget should be refreshed monthly and after material events. Actual calls, distributions, spending, collateral, asset sales and facility changes should be loaded from reconciled records. The model should compare actual dates and amounts with the approved forecast.
Variance attribution should distinguish manager timing, exit delay, market movement, operating change, currency, restriction correction and model error. Persistent bias should change future assumptions. A distribution forecast that repeatedly arrives late should receive a lower evidence weight.
The board dashboard should show opening coverage, movements, closing coverage, forecast changes and actions. It should preserve gross flows and avoid a single net-liquidity number. Trends in unfunded commitments, private-asset concentration and low-confidence distributions are leading indicators.
Data controls matter. Manager statements, capital notices, custodian positions, bank balances, derivative exposures and finance records should reconcile to named owners. Material unresolved differences should reduce eligible resources or increase uses until resolved.
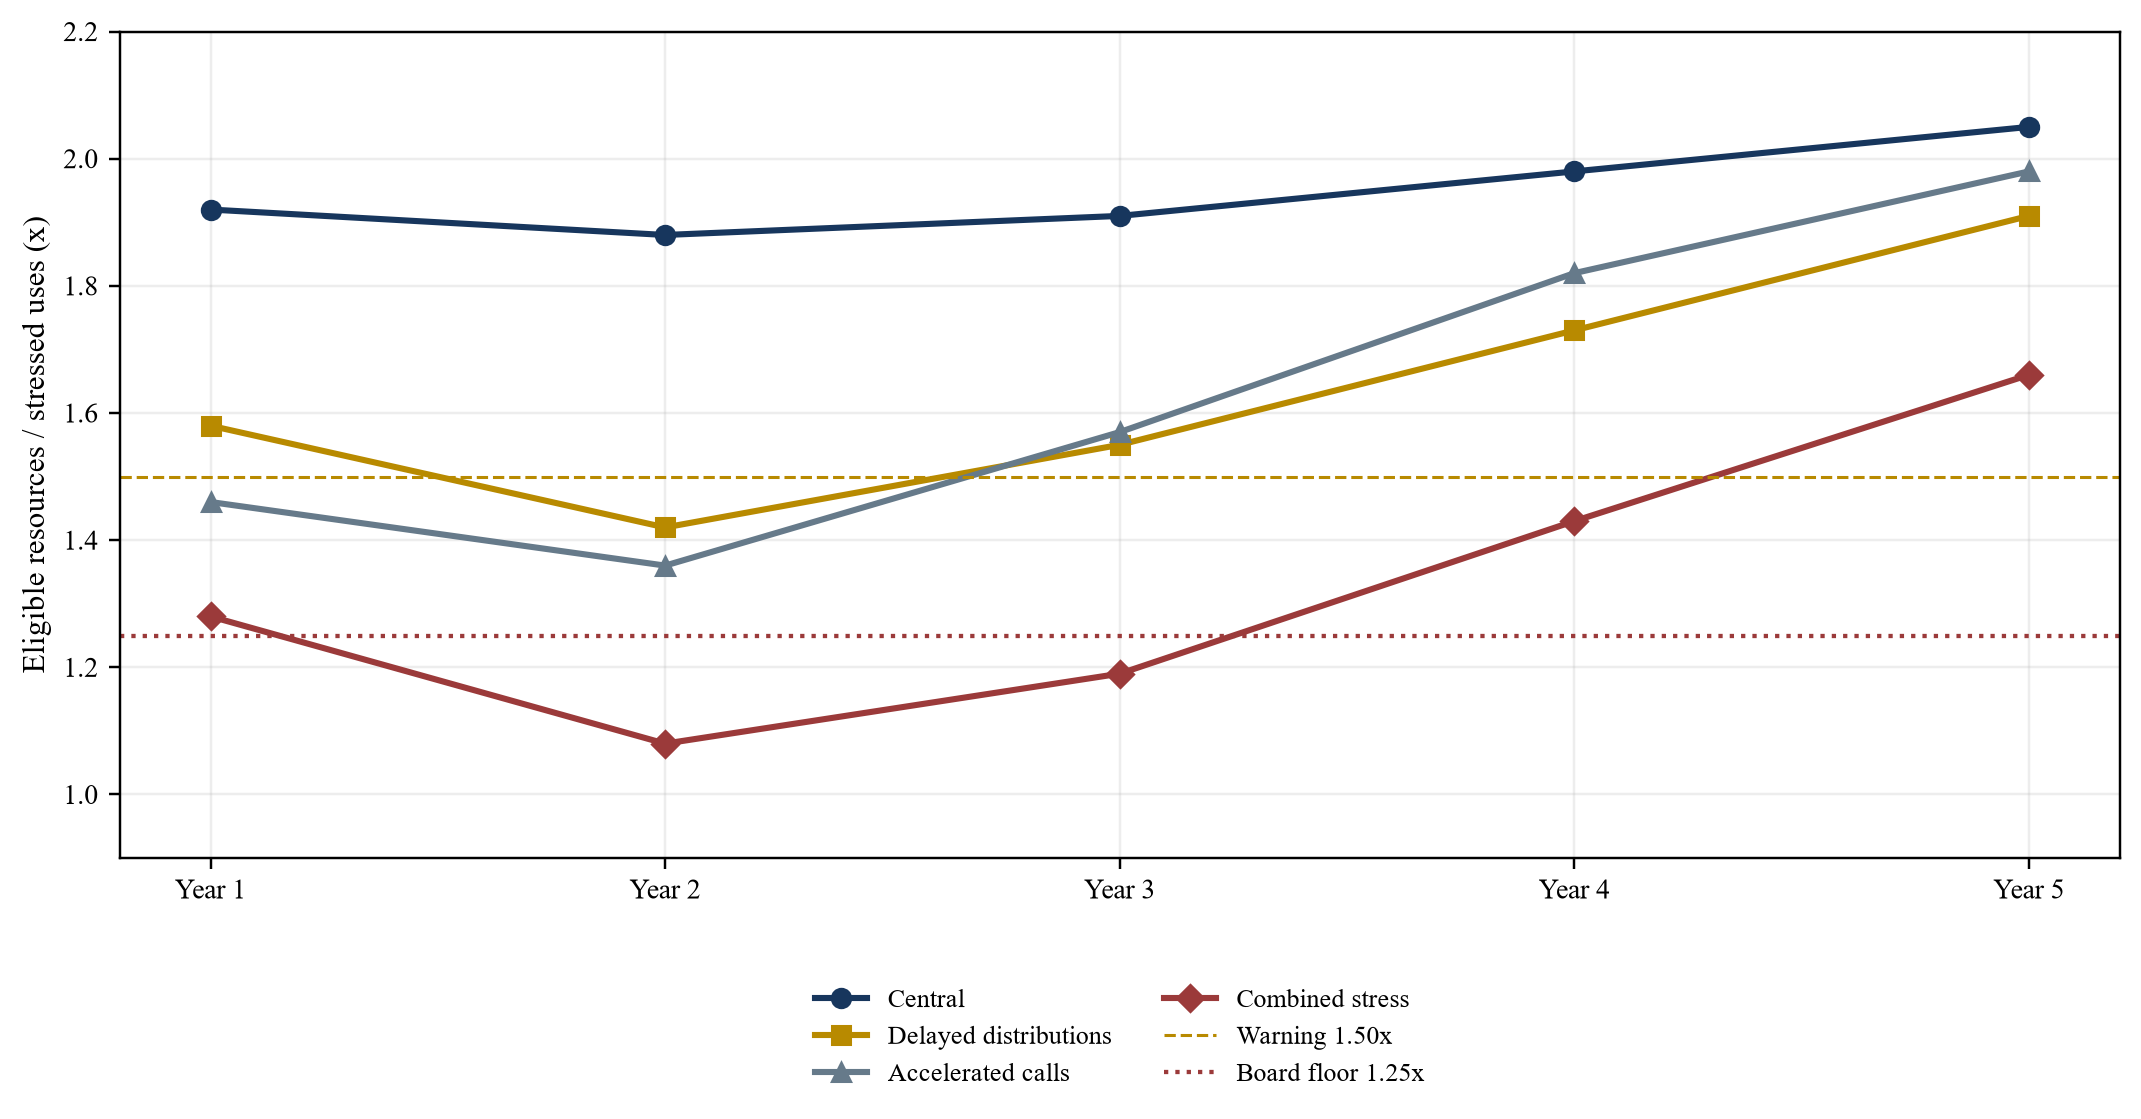
Illustrative coverage ratios show how delayed distributions and correlated stresses can erode headroom before the board floor is breached.
25. Implement the framework over ninety days
The first thirty days establish the evidence base. The institution reconciles investment positions, unfunded commitments, call notices, distribution history, spending schedules, collateral exposures, facilities, restrictions and operating forecasts. Owners resolve differences and record remaining limitations.
Days thirty-one to sixty build the monthly and five-year bridges. Management calibrates call and distribution ranges, maps resources by availability, defines the protected reserve and runs central, adverse and reverse stresses. Legal, finance, treasury, investment and risk teams challenge the assumptions.
Days sixty-one to ninety establish governance. The board approves thresholds, the action ladder, delegated authority and reporting. Treasury conducts a collateral and facility dry run. The investment committee tests a commitment decision through the model. Finance tests an extraordinary-spending request.
The implementation ends with an operating cycle rather than a static report. Monthly reconciliation, quarterly committee review, annual policy calibration and event-driven refreshes keep the budget aligned with the institution's obligations and portfolio.
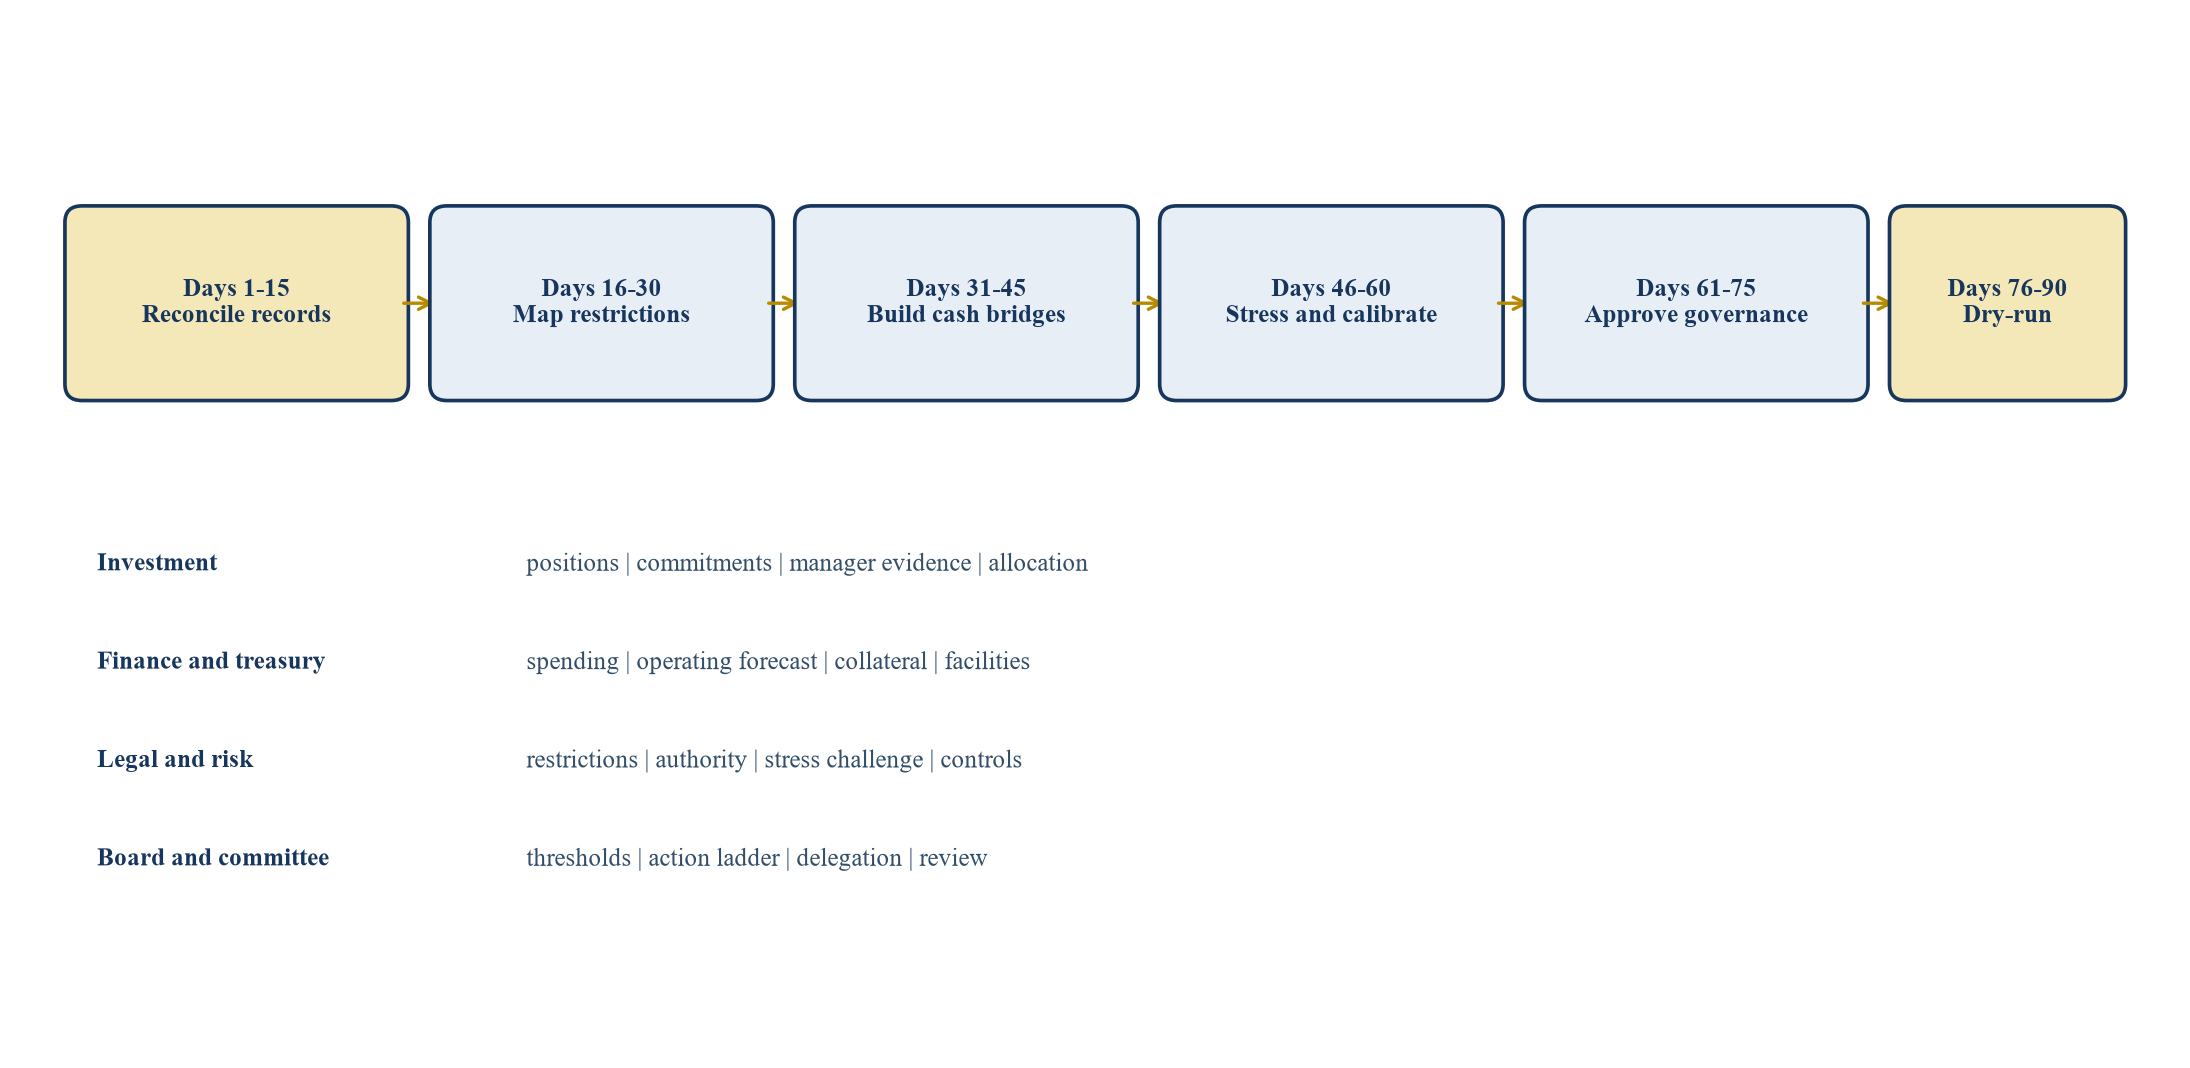
The implementation sequence moves from evidence reconciliation to modelling, stress testing, governance approval and operating assurance.
26. Control predictable failure modes
The first failure is treating the spending formula as cash. The control is a dated payment schedule funded through specific eligible sources. The second failure is netting calls against forecast distributions. The control is a gross-flow bridge and independent stress factors.
The third failure is counting restricted or operationally unavailable assets. The control is a legal-entity and restriction matrix with evidence-based haircuts. The fourth failure is counting one resource several times. The control is a source-allocation ledger that assigns priority and prevents duplication.
The fifth failure is assuming a facility will always remain available. The control is a no-facility stress, executed documentation review and repayment plan. The sixth failure is reacting after coverage falls below the floor. The control is a warning threshold, reverse-stress distance and actions with realistic lead times.
The seventh failure is measuring liquidity only through market values. The control is an operational test of accounts, approvals, settlement and collateral delivery. The eighth failure is leaving the investment and finance teams with separate forecasts. The control is one governed record reconciled to both portfolios and the operating budget.
| Failure mode | Consequence | Control response | Evidence of operation |
|---|---|---|---|
| Spending formula treated as cash | Distribution due without funded source | Dated cash-delivery plan | Monthly source-to-payment reconciliation |
| Calls netted against weak distribution forecasts | Shortfall when exits move later | Gross-flow forecast and confidence ladder | Call and distribution variance report |
| Restricted assets counted as available | Legal or donor breach | Restriction and entity matrix | Current legal eligibility sign-off |
| One source assigned to several uses | Overstated coverage | Priority-based source ledger | Duplicate-allocation exception report |
| Facility assumed continuously available | Missing bridge capacity | No-facility stress and repayment plan | Executed terms and periodic draw test |
| Action begins after floor breach | Forced execution and value loss | Warning triggers and delegated authority | Timed liquidity simulation |
| Market liquidity assumed operationally available | Settlement failure | End-to-end mobilisation drill | Successful cash and collateral test |
| Investment and finance forecasts diverge | Conflicting decisions | One governed liquidity record | Joint monthly approval and audit trail |
The controls are a proposed governance design and require adaptation to the institution's legal, operational and investment arrangements.
27. Limitations and conclusion
This paper provides a governance and cash-flow framework for endowment liquidity. It does not determine a suitable spending rate, strategic allocation, return objective, legal treatment, donor restriction, accounting value, tax position, facility size, manager selection or transaction price for any institution.
The worked case is hypothetical. Asset values, private exposures, spending, calls, distributions, collateral, facilities, stress factors, coverage ratios and decision thresholds are illustrative management assumptions. They are not observed endowment results, probabilities, forecasts or investment advice.
An endowment can fund a dependable mission and maintain a long-term private-asset programme when it budgets liquidity as a scarce institutional resource. Spending, capital calls, collateral, operating contingencies and rebalancing should share one dated uses register. Cash, securities, facilities and private distributions should enter coverage only after testing restriction, timing and executability.
The practical result is a board-approved system that identifies headroom before a breach, connects new commitments to future cash demands and provides actions that can be executed within the relevant horizon. The endowment retains long-term investment flexibility because short-term obligations are governed explicitly.
Sources
- National Association of College and University Business Officers, US Higher Education Endowments Report Stable Returns, Increase Spending to USD 33.4 Billion in FY25, 12 February 2026, accessed 17 September 2026, Read the primary source
- National Association of College and University Business Officers, Public NCSE Tables, 2026, accessed 17 September 2026, Read the primary source
- Harvard Management Company, Message from the Chief Executive Officer and Portfolio Strategy, fiscal year 2025, accessed 17 September 2026, Read the primary source
- Harvard University Financial Administration, Harvard's Endowment, accessed 17 September 2026, Read the primary source
- Princeton University, Report of the Treasurer 2024-2025, updated 5 January 2026, accessed 17 September 2026, Read the primary source
- Stanford University, FY25 Annual Financial Report, 2025, accessed 17 September 2026, Read the primary source
- Yale Investments, The Endowment, accessed 17 September 2026, Read the primary source
- Stanford University, Investment and Withdrawal Guidelines for Funds Functioning as Endowment, updated 1 July 2023, accessed 17 September 2026, Read the primary source
- Charity Commission for England and Wales, Investing Charity Money: Guidance for Trustees, accessed 17 September 2026, Read the primary source
- Charity Commission for England and Wales, Total Return Investment for Permanently Endowed Charities, updated 14 June 2023, accessed 17 September 2026, Read the primary source
- Uniform Law Commission, Uniform Prudent Management of Institutional Funds Act, accessed 17 September 2026, Read the primary source
- International Monetary Fund, The Rise and Risks of Private Credit, Global Financial Stability Report, April 2024, accessed 17 September 2026, Read the primary source
- Bank for International Settlements, The Rise of Private Markets, 10 December 2021, accessed 17 September 2026, Read the primary source
- Financial Stability Board, Liquidity Preparedness for Margin and Collateral Calls: Final Report, 10 December 2024, accessed 17 September 2026, Read the primary source
- Financial Stability Board, Leverage in Non-Bank Financial Intermediation: Final Report, 9 July 2025, accessed 17 September 2026, Read the primary source
- Financial Stability Board, Report on Vulnerabilities in Private Credit, 6 May 2026, accessed 17 September 2026, Read the primary source
- International Monetary Fund, Global Financial Stability Report: Enhancing Resilience amid Global Trade Uncertainty, April 2025, accessed 17 September 2026, Read the primary source
- US Securities and Exchange Commission, Private Fund Advisers, accessed 17 September 2026, Read the primary source
