

1. Define the equity decision
Revenue-quality work should begin with the decision facing the board and investors. A primary raise, secondary sale, strategic investment, acquisition or internal capital allocation each requires a different view of growth, funding need, control and evidence. The assessment should state the proposed proceeds, use of funds, runway, operating milestone, valuation range and decision date.
The central question is whether the FinTech can convert customer activity into durable cash contribution under credible regulatory and risk controls. Volume growth alone is incomplete. The investment case should show which revenues recur, which depend on incentives, how fraud and credit losses behave, where automation lowers cost, and how much capital is needed before the next independently observable milestone.
2. Establish a controlled evidence base
The analysis should reconcile signed customer contracts, product terms, pricing schedules, processor and network reports, bank statements, general ledger records, billing data, transaction-level activity, fraud systems, dispute logs, compliance cases, cloud invoices and workforce records. Each metric should have an owner, source, definition, cut-off and reconciliation status.
Management dashboards are useful operating tools, yet they may contain changed definitions, duplicated transactions or estimated allocations. Investor reporting should preserve the original source, transformation logic and exceptions. A metric dictionary should distinguish statutory measures, management measures and transaction-specific adjustments. Unsupported adjustments should remain visible until evidence is supplied.
Table 1. Revenue-quality evidence ledger
| Measure | Primary evidence | Essential control |
|---|---|---|
| payment or lending volume | processor, bank or servicing records | reconcile successful, reversed and pending activity |
| gross and net revenue | contracts, invoices and ledger | map principal-versus-agent treatment and deductions |
| incentives | campaign, wallet and ledger records | match eligibility, redemption and expiry |
| fraud and disputes | case system, scheme reports and recoveries | reconcile incident, loss and recovery dates |
| credit loss | receivable and lending ledger | cohort, delinquency and write-off roll-forward |
| compliance cost | case volumes, payroll, vendors and advisers | allocate direct and incremental cost consistently |
Definitions and evidence requirements should be adapted to the company, products and applicable accounting and regulatory perimeter.
3. Define the transaction and customer perimeter
A FinTech may operate several products, entities, licences and geographies. The model should identify which legal entities, products, customer groups and revenue streams are included in the financing story. Intercompany revenue, pass-through amounts and discontinued activities should be separately identified. Currency translation and reporting cut-offs should be consistent.
Customer identity matters because a platform can serve consumers, merchants, lenders, banks and enterprises under different economics. A merchant-acquiring take rate cannot be compared directly with lending yield or software subscription revenue. The perimeter should allow investors to see product-level economics without losing the consolidated cash requirement.
4. Build the revenue taxonomy
The taxonomy should distinguish transaction fees, subscriptions, interchange, lending yield, origination fees, servicing fees, foreign-exchange spread, data or software revenue and other consideration. Each stream should state the customer, contractual trigger, billing basis, settlement timing, refund right and accounting treatment.
Gross presentation can overstate economic scale when the FinTech acts as an agent or passes substantial amounts to networks, banks or partners. IFRS 15 requires an entity to assess whether it controls the promised good or service before transfer. The diligence model should reconcile reported gross revenue to net revenue and cash retained, while qualified accountants determine the applicable accounting conclusion.
The taxonomy should also show timing. Subscription revenue may be recognised over a service period, transaction revenue at an event, and some fees only when a performance obligation is satisfied. Refund rights, variable consideration and contractual penalties may constrain the amount recognised. A buyer or investor should be able to trace every material line from commercial contract to operational event, invoice, ledger entry and cash settlement. Any manual journal, top-side adjustment or unallocated balance should appear in an exceptions schedule with its preparer, reviewer and resolution date. This discipline helps separate a scalable revenue engine from growth created by accounting presentation, timing or one-off commercial arrangements.
5. Reconcile volume to recognised revenue
Gross payment volume or loan originations should be bridged to monetised activity. The bridge should remove failed, reversed, refunded, internal, promotional and otherwise non-billable transactions. It should then apply contractual pricing, minimums, tiers, waivers and foreign-exchange rules before reconciling to invoices and the ledger.
This bridge exposes whether growth comes from genuine customer use or from changes in classification. It also reveals revenue leakage from incorrect pricing, unbilled activity and operational exceptions. Monthly and cohort views should be retained because annual aggregation can hide deteriorating monetisation.
Reconciliation should operate in both directions. A top-down bridge explains ledger revenue through products and customers; a bottom-up bridge rebuilds expected revenue from eligible transactions and contracted pricing. Differences can arise from settlement timing, foreign exchange, minimum fees, rebates, rounding, tax, reversals or missing identifiers. Material differences require root-cause analysis rather than an unexplained reconciling line. Repeating the exercise for cash receipts establishes whether billed economics translate into liquidity. This is particularly important for rapid-growth platforms where changes in routing, processors or product configuration can create silent leakage before monthly reporting identifies it.
6. Measure gross and net take rate
Gross take rate is generally calculated as gross revenue divided by the relevant transaction volume. Net take rate deducts processor, network, interchange, partner and other directly variable costs appropriate to the business model. The denominator and deductions should be defined explicitly.
A falling take rate can reflect deliberate movement toward larger customers, competitive repricing or mix shift. It can also indicate weak pricing power. The board should compare contracted, realised and net take rate by product, geography, channel and customer cohort. Averages should be weighted transparently and reconciled to the underlying transaction population.
Price-volume-mix analysis provides the next layer. Price measures changes in contractual and realised yield for comparable activity; volume measures the effect of more eligible activity; mix captures changes between products, customers and markets. Cross-selling should be separately visible so an apparent pricing improvement is not simply movement into a higher-yield but higher-risk product. Management should identify whether discounts are temporary, conditional or embedded in a renewal. Where enterprise contracts include tiered pricing, the model should calculate marginal economics at forecast volumes because growth can lower the average take rate even when the customer relationship becomes more valuable.
7. Separate durable pricing from incentives
Cashback, fee holidays, referral awards, free transfers and merchant subsidies can accelerate acquisition. The investment case should show the gross economic price, customer-paid price, incentive funded by the FinTech, incentive funded by a partner and post-incentive retention. Incentives should be matched to the customers and transactions they influence.
A durable cohort maintains activity after the incentive ends and produces a positive contribution after direct risk and service costs. The analysis should compare incentivised and non-incentivised cohorts, with acquisition channel and customer characteristics controlled where possible. Management should label forecasts and causality assumptions clearly.
Incentive accounting and operating analysis should use the same event ledger. The company should record offer, eligibility, award, redemption, expiry, funding party and related transaction. This prevents redeemed incentives from being compared with all offered incentives or from being assigned to the wrong period. A test cohort should include an observation window long enough to capture post-promotion behaviour, disputes and loss emergence. The board should also examine repeated incentive users, referral loops and abusive behaviour. A programme that increases registered users while reducing risk-adjusted contribution should be redesigned before its growth is used in an equity narrative.
8. Construct the revenue-quality bridge
The revenue-quality bridge connects reported revenue to recurring, cash-converting contribution. It begins with recognised revenue and separately shows pass-through amounts, temporary incentives, refunds, disputes, fraud, credit loss, processor cost, cloud and model cost, support and compliance. The result should reconcile to ledger and cash movement.
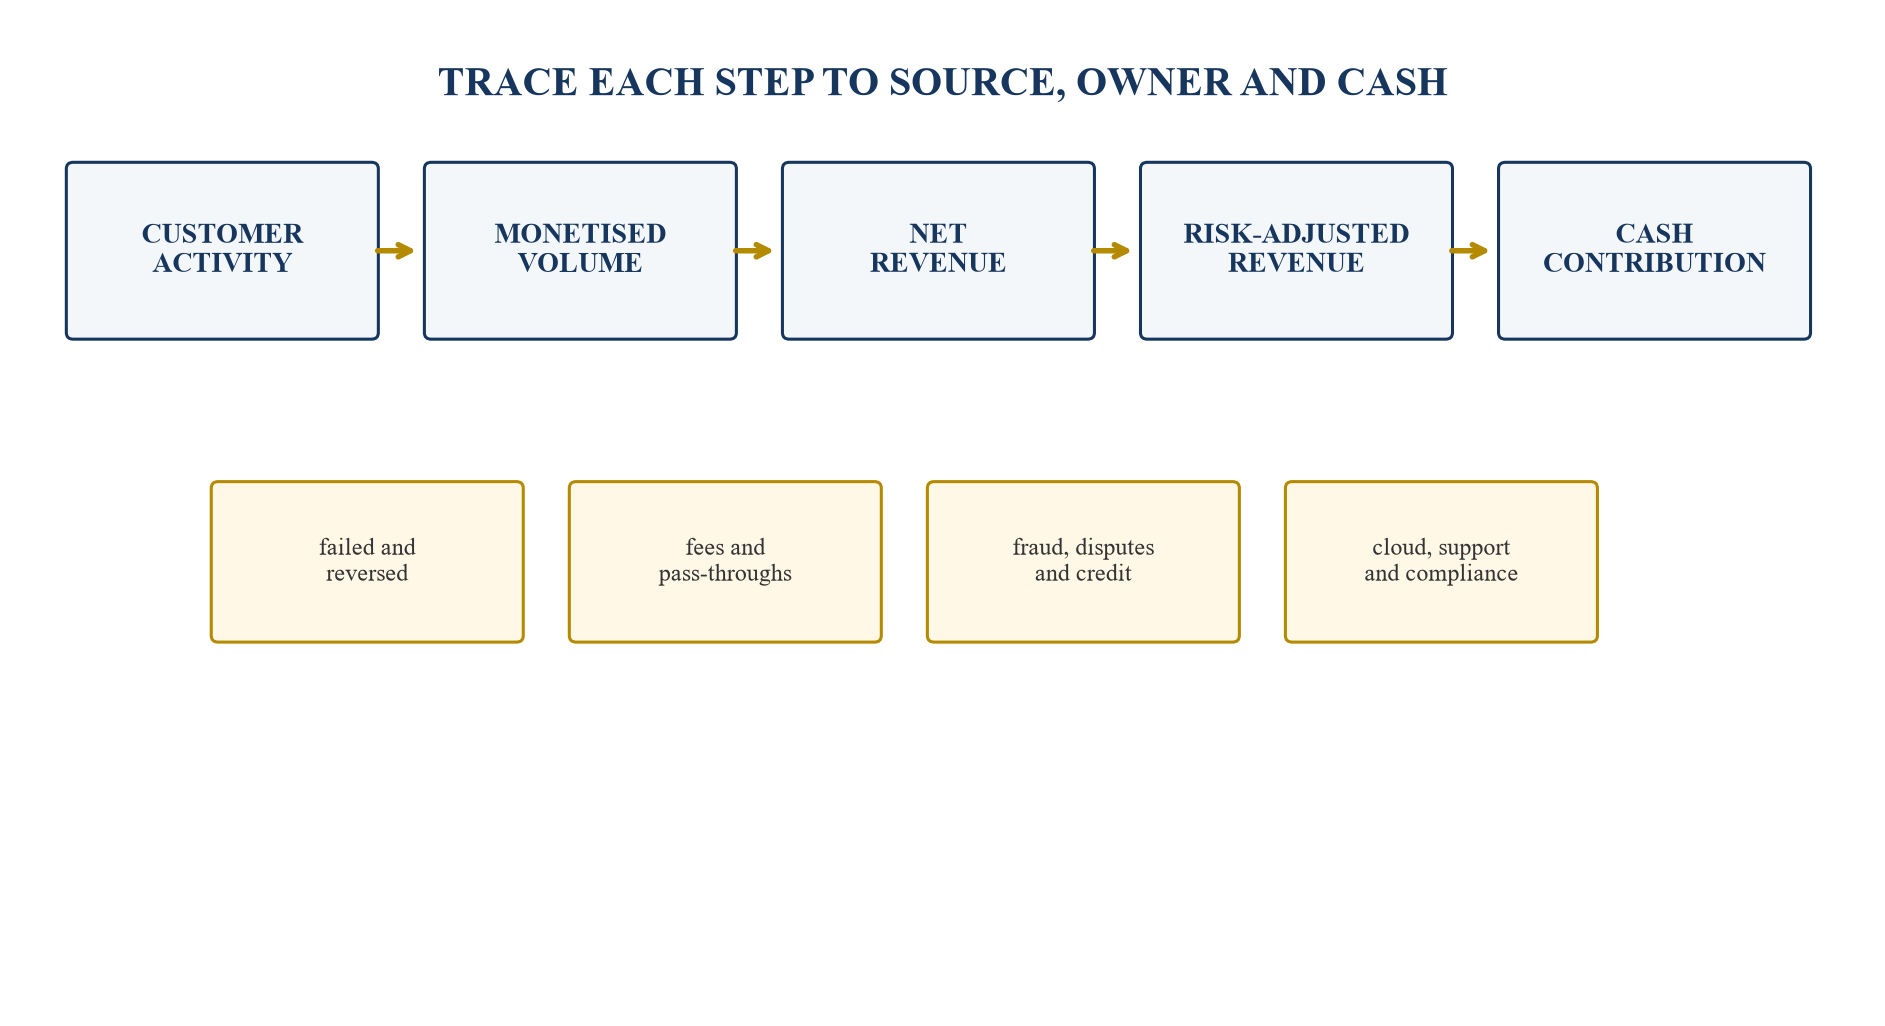
The bridge is an analytical framework; company-specific values require reconciliation to operational, accounting and cash records.
The bridge should retain both reported and adjusted views. Adjustments may support transaction analysis, but they should not rewrite accounting records. Each adjustment needs a definition, evidence, period, owner and explanation of whether it recurs.
Quality adjustments should be symmetrical. If unusual fraud, remediation or migration costs are removed, unusual revenue, partner credits and favourable settlements should also be isolated. Run-rate adjustments require an effective date, contracted evidence and a capacity test. Future savings should not be combined with historical results. A monthly bridge over at least one complete operating cycle allows investors to see seasonality and settlement effects. Management, finance, risk and product owners should sign off the same bridge so the transaction narrative cannot drift away from the operating record.
9. Analyse customer cohorts
Cohorts should be created using a stable event such as first funded transaction, first paid subscription or origination month. For each cohort, the model should track active customers, volume, gross revenue, net revenue, incentives, fraud, service cost and contribution over time.
Cohort analysis separates calendar growth from customer maturation. A business can report rising total revenue while recent cohorts retain poorly. Conversely, falling aggregate take rate can accompany improving contribution if larger, lower-priced customers require less service and create stronger cash retention. Both customer-count and revenue-weighted retention should be shown.
Cohort definitions should resist operational changes. Merging accounts, changing customer identifiers or moving activity between products can manufacture retention unless the lineage is preserved. The model should identify dormant, reactivated and migrated customers and should show organic expansion separately from acquired books. Where outcomes mature slowly, as in lending or disputes, early cohorts provide more reliable evidence than recent ones. Recent cohorts should use leading indicators with a stated uncertainty range. The comparison should control for geography, channel, product and risk mix before management attributes improvement to AI or a new commercial policy.
10. Build the take-rate cohort matrix
The matrix should display realised take rate by acquisition cohort and months since activation. Contracted pricing, incentives and mix changes should be presented alongside the realised result. Exceptions caused by one large customer or a settlement correction should be identified.
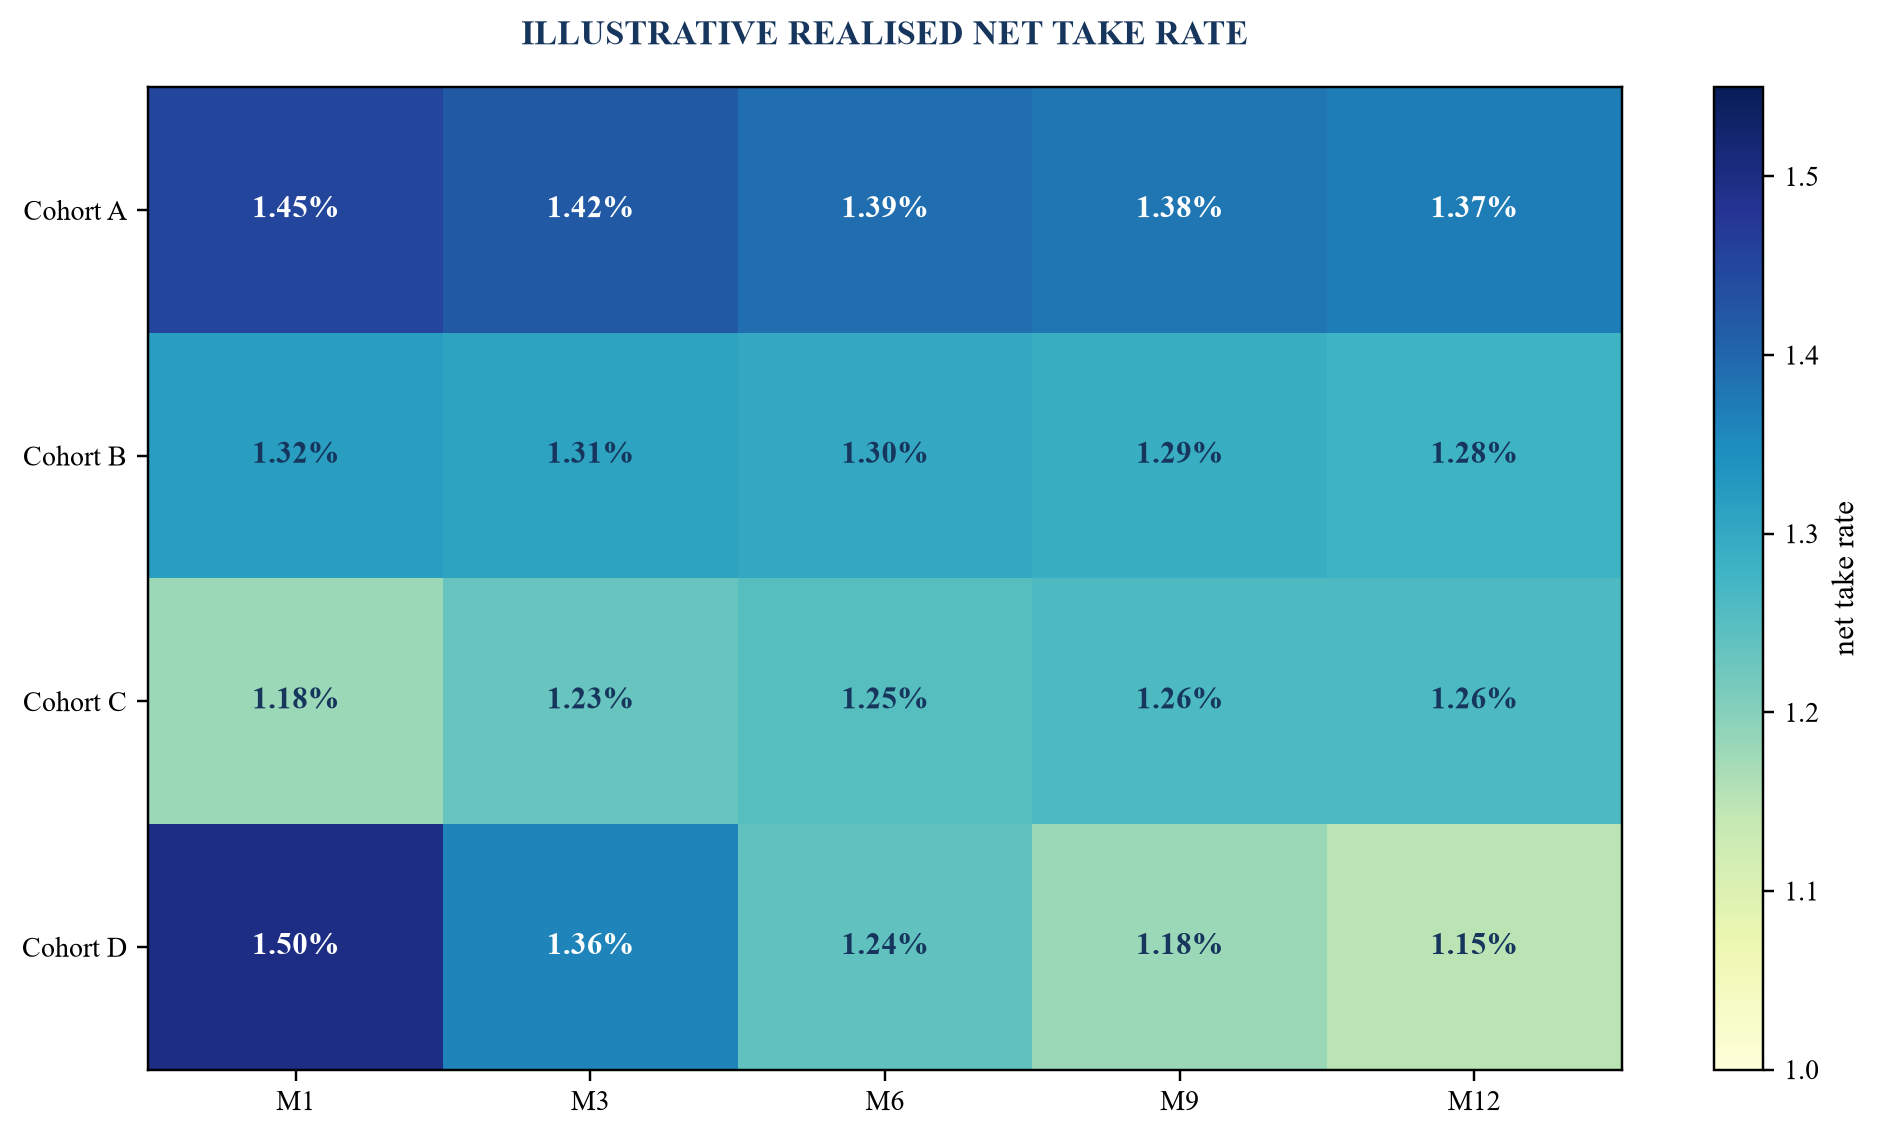
Values are illustrative and do not represent a company, market benchmark or valuation conclusion.
The values in a transaction model should use company evidence. Figure 2 illustrates the method and should not be interpreted as a market benchmark. A declining cohort should trigger review of customer mix, repricing, incentives, routing, refunds and competitive pressure.
11. Test concentration and contract durability
Revenue concentration should be measured by customer, platform, sponsor bank, processor, merchant category and geography. The model should identify termination rights, pricing resets, minimum commitments, most-favoured-customer clauses, service levels and change-of-control provisions.
Concentration can support efficient growth when a customer is embedded and contracted. It can create valuation risk when revenue depends on a few renegotiable relationships or one infrastructure provider. Investors should see revenue at risk under contract expiry, repricing, volume decline and partner termination scenarios.
Economic concentration extends beyond customer revenue. A FinTech may depend on one sponsor bank for account access, one processor for routing, one network for acceptance, one data provider for onboarding or one cloud region for critical operations. The diligence model should calculate contribution and liquidity under the loss or repricing of each dependency. Contract duration alone does not eliminate risk if a counterparty has broad suspension rights or if service migration exceeds available runway. Mitigation should be evidenced through tested alternatives, technical portability, regulatory permissions and realistic implementation cost.
12. Reconcile billing, settlement and cash
Recognised revenue does not automatically equal cash collected. The analysis should bridge invoice, receivable, settlement balance, safeguarded customer funds, restricted cash and operating cash. Settlement timing, reserves, rolling holds and chargeback exposure should be included.
This reconciliation is especially important where a FinTech receives and remits funds on behalf of customers. Client money and operating liquidity should remain clearly separated. Cash conversion should be measured after working-capital movements and restricted balances under the applicable regulatory and contractual framework.
The cash bridge should identify settlement assets and liabilities by counterparty, ageing and currency. Negative timing can emerge when customers receive funds before a processor, lender or network settles, while positive timing can reverse during stress or rapid contraction. Chargeback reserves and rolling holds may increase as volume or perceived risk rises. A weekly liquidity model should therefore complement monthly financial statements. It should model peak settlement exposure, weekends, holidays, currency mismatches, failed counterparties and restricted balances, with escalation triggers approved by treasury and the board.
13. Map fraud exposure
Fraud should be segmented by product, channel, geography, customer type, attack method and point in the transaction lifecycle. Attempted fraud, prevented fraud, gross loss, recoveries, customer reimbursement and final net loss are distinct measures. The loss owner and accounting period should be explicit.
Attack behaviour changes as controls change. A lower observed loss rate can result from better detection, tighter approval or a temporary shift in attacker behaviour. Diligence should consider approval rate, customer friction, manual-review queues and control circumvention alongside the loss ratio.
Loss attribution should follow the full event lifecycle. The original transaction, authentication method, model score, rule outcome, reviewer action, customer contact, dispute, reimbursement, recovery and final write-off should share a durable identifier. This enables analysis of which controls prevented loss and which merely shifted it. Fraud operations should distinguish first-party misuse, account takeover, authorised push-payment fraud, merchant abuse, synthetic identity and operational error because they require different data and interventions. Aggregate performance can conceal a serious deterioration in one attack class.
14. Build the fraud-loss waterfall
The waterfall should begin with attempted value and show rule or model declines, step-up verification, customer abandonment, approved fraudulent activity, recoveries, reimbursements and net loss. Volume and incident counts should both be retained because a small number of large events can distort value-based rates.
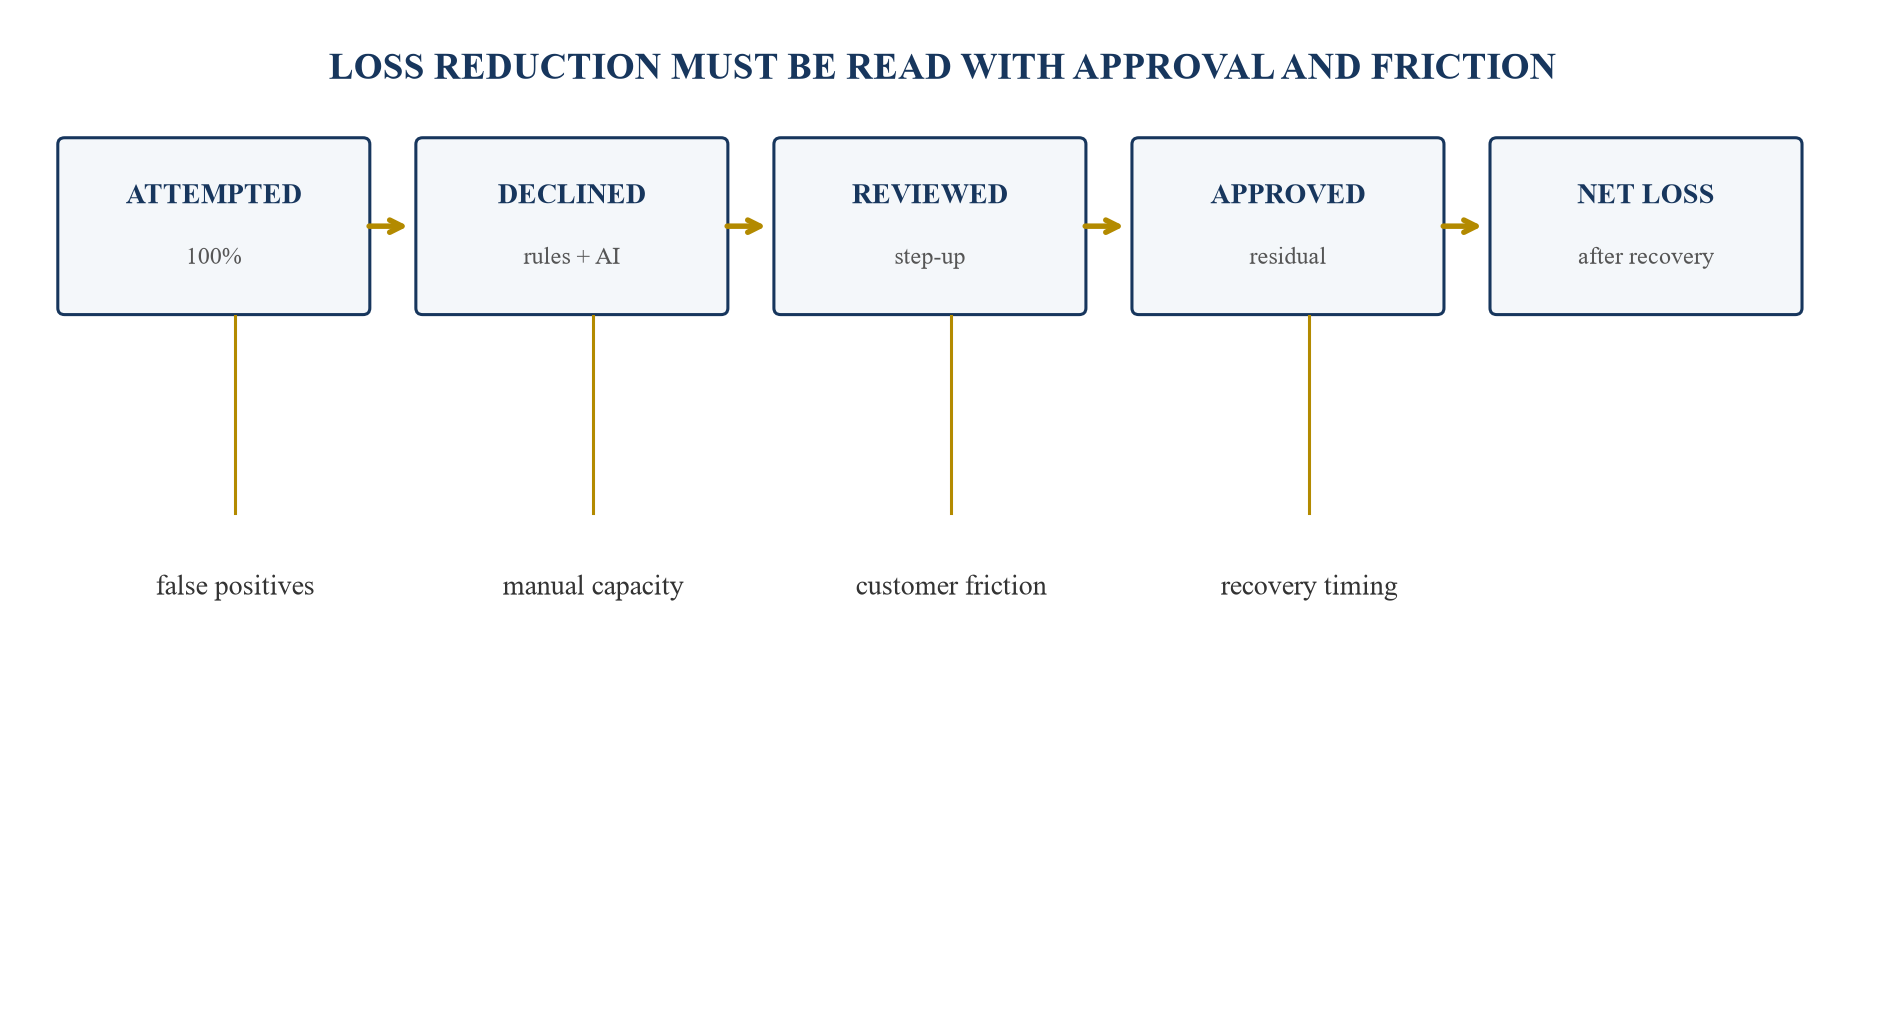
The waterfall should use company incident, decision, recovery and customer-outcome evidence.
15. Quantify false positives
A false positive occurs when a legitimate customer or transaction is incorrectly flagged. Its economic cost can include abandonment, support contacts, manual review, delayed settlement, lost lifetime value and reputational harm. The model should distinguish a confirmed false positive from a case that remains unresolved.
Precision, recall and false-positive rate should be interpreted with the business base rate. A model can report high accuracy while performing poorly on a rare fraud class. Threshold changes should be reviewed through losses, approval, friction, investigator workload and protected-customer outcomes.
16. Measure model lift with a counterfactual
Reported savings from AI should compare observed outcomes with a credible baseline. Suitable designs may include a controlled holdout, champion-challenger model, phased rollout, matched cohort or time-series analysis adjusted for mix and external changes. The method and limitations should be documented.
Multiplying all prevented transactions by face value can overstate benefit because some attempts would have failed elsewhere, been recovered or been stopped by existing rules. Benefit should reflect incremental avoided loss, incremental revenue retained and incremental operating cost saved, less model, data, review and remediation cost.
The counterfactual should be selected before results are reviewed where feasible. Holdouts need ethical and risk controls; champion-challenger designs need comparable traffic allocation; phased rollouts need adjustment for seasonality and attacker adaptation. Statistical confidence, observation delay and sample size should be disclosed. A model may create value by improving ranking even if final decisions remain human. In that case, benefit should be measured through investigator productivity and case outcomes. The finance owner should reconcile quantified benefit to ledger or cash outcomes and should reject double counting between loss prevention, labour capacity and revenue retention.
17. Monitor model drift
Data drift describes changing input distributions; concept drift describes changing relationships between inputs and outcomes. Both can weaken a model after deployment. Monitoring should cover input stability, performance by segment, calibration, outcome delays, override rates, customer complaints and emerging attack types.
Revalidation should be triggered by material product, geography, data, vendor, policy or threat changes. A model inventory should record purpose, owner, version, training data, validation, deployment date, thresholds, dependencies, limitations and retirement plan. Critical decisions require accountable human oversight consistent with applicable expectations.
Monitoring thresholds should be linked to an action plan. A breach may trigger investigation, threshold adjustment, rollback, enhanced review, customer remediation or suspension. Overrides deserve separate attention: increasing human overrides can indicate drift, weak calibration or changing business policy. The organisation should preserve input, output and decision records sufficiently to reproduce material outcomes within legal and privacy constraints. Independent validation should challenge conceptual soundness, data, implementation, performance and limitations. Board reporting should focus on material customer, financial and regulatory consequences instead of an undifferentiated inventory count.
18. Separate automation from workforce displacement
Automation benefit should be measured at task and process level. A reduction in handling time may increase capacity without reducing cash cost. The financial model should distinguish time released, vacancies avoided, contractor spend removed, service-level improvement, error reduction and actual payroll change.
Redeployment can create value through higher sales, faster onboarding or stronger control. These benefits need evidence through output and outcome measures. The equity story should avoid treating theoretical labour hours as cash savings. Implementation, change management, quality assurance and exception handling should be included.
Process mapping should identify waiting time, rework, hand-offs and control points before technology is introduced. Automating a poorly designed process can move errors faster and conceal them from reviewers. Baseline service levels and error rates should be captured before deployment. Following deployment, the company should measure work received, work completed correctly, work escalated and work repeated. Capacity released should be assigned to a planned outcome with accountable ownership. Where roles change, training, access, segregation of duties and performance measures should be updated so operational benefit remains sustainable.
19. Model customer-support economics
AI assistants can classify requests, retrieve information, draft responses and complete low-risk actions. The analysis should measure containment, first-contact resolution, handling time, escalation, repeat contact, complaint, error and customer satisfaction. Automated containment alone can reward unresolved interactions.
The cost model should include model inference, retrieval infrastructure, software licences, human review, content maintenance, monitoring and incident remediation. Higher-quality service can support retention, yet the relationship should be tested through cohorts rather than assumed.
Customer-support AI should use an approved knowledge base with effective-date control and escalation for uncertain, regulated or high-impact questions. Hallucinated fees, eligibility or complaint guidance can create direct customer harm. Quality sampling should include rare and adverse interactions, multiple languages and accessibility needs. The company should trace whether automated responses lead to resolution, repeat contact, formal complaint or financial adjustment. If service quality improves, the financial benefit may appear through retention, lower rework or avoided compensation; each pathway requires evidence and should not be added together without reconciliation.
20. Analyse onboarding and conversion
Onboarding should be mapped from visit or referral through identity checks, risk assessment, account approval, funding and first successful use. Drop-off, time, manual touch, exception reason and customer segment should be measured at each stage.
AI may improve document extraction or anomaly detection. It may also create unexplained declines or inconsistent outcomes. Conversion improvement should be evaluated after fraud, compliance, complaints and subsequent customer quality. A rapid approval that produces weak or risky accounts does not create sustainable value.
Funnel analysis should distinguish customer-controlled delay, internal processing delay and third-party delay. Manual-review reasons should use a stable taxonomy, allowing the company to target document quality, data access, policy ambiguity or staff capacity. An AI change should be compared with a contemporaneous baseline and reviewed by customer segment. Higher approval among one group can coexist with deterioration elsewhere. The economic measure is funded, retained and compliant customer contribution after acquisition and onboarding cost, not completed applications. Regulatory and customer-consent requirements should be mapped before new data or automated decisions enter the process.
21. Map compliance obligations to operating work
The compliance map should connect each licence, product, geography and customer type to policies, controls, monitoring, reporting, training, assurance and accountable owners. It should distinguish business-as-usual obligations from remediation and expansion expenditure.
AI governance belongs within this map. CBUAE’s 2026 guidance highlights accountability, fairness, transparency, human oversight, data quality, privacy, security and consumer protection. DFSA’s 2025 survey reported accelerating adoption alongside governance gaps. Firm-specific applicability requires regulatory advice and evidence.
The obligation register should identify rule source, jurisdiction, regulated entity, product, control owner, evidence, testing frequency, breach threshold and reporting route. It should be updated when the business enters a new market, changes a product or introduces a model into a material decision. Policies alone are insufficient evidence; the diligence review should inspect execution through samples, monitoring, issue logs and board reporting. Historic remediation should be linked to root cause and closure testing. A growth plan should include the compliance capacity and supervisory engagement required before launch, avoiding a forecast that assumes revenue before legal and operational readiness.
22. Build the compliance-cost map
Compliance cost should be analysed by driver: customer onboarding, ongoing monitoring, transaction alerts, sanctions, investigations, regulatory reporting, complaints, model governance, cybersecurity, privacy and assurance. Direct payroll, technology, data, advisers and remediation should be reconciled to the ledger.
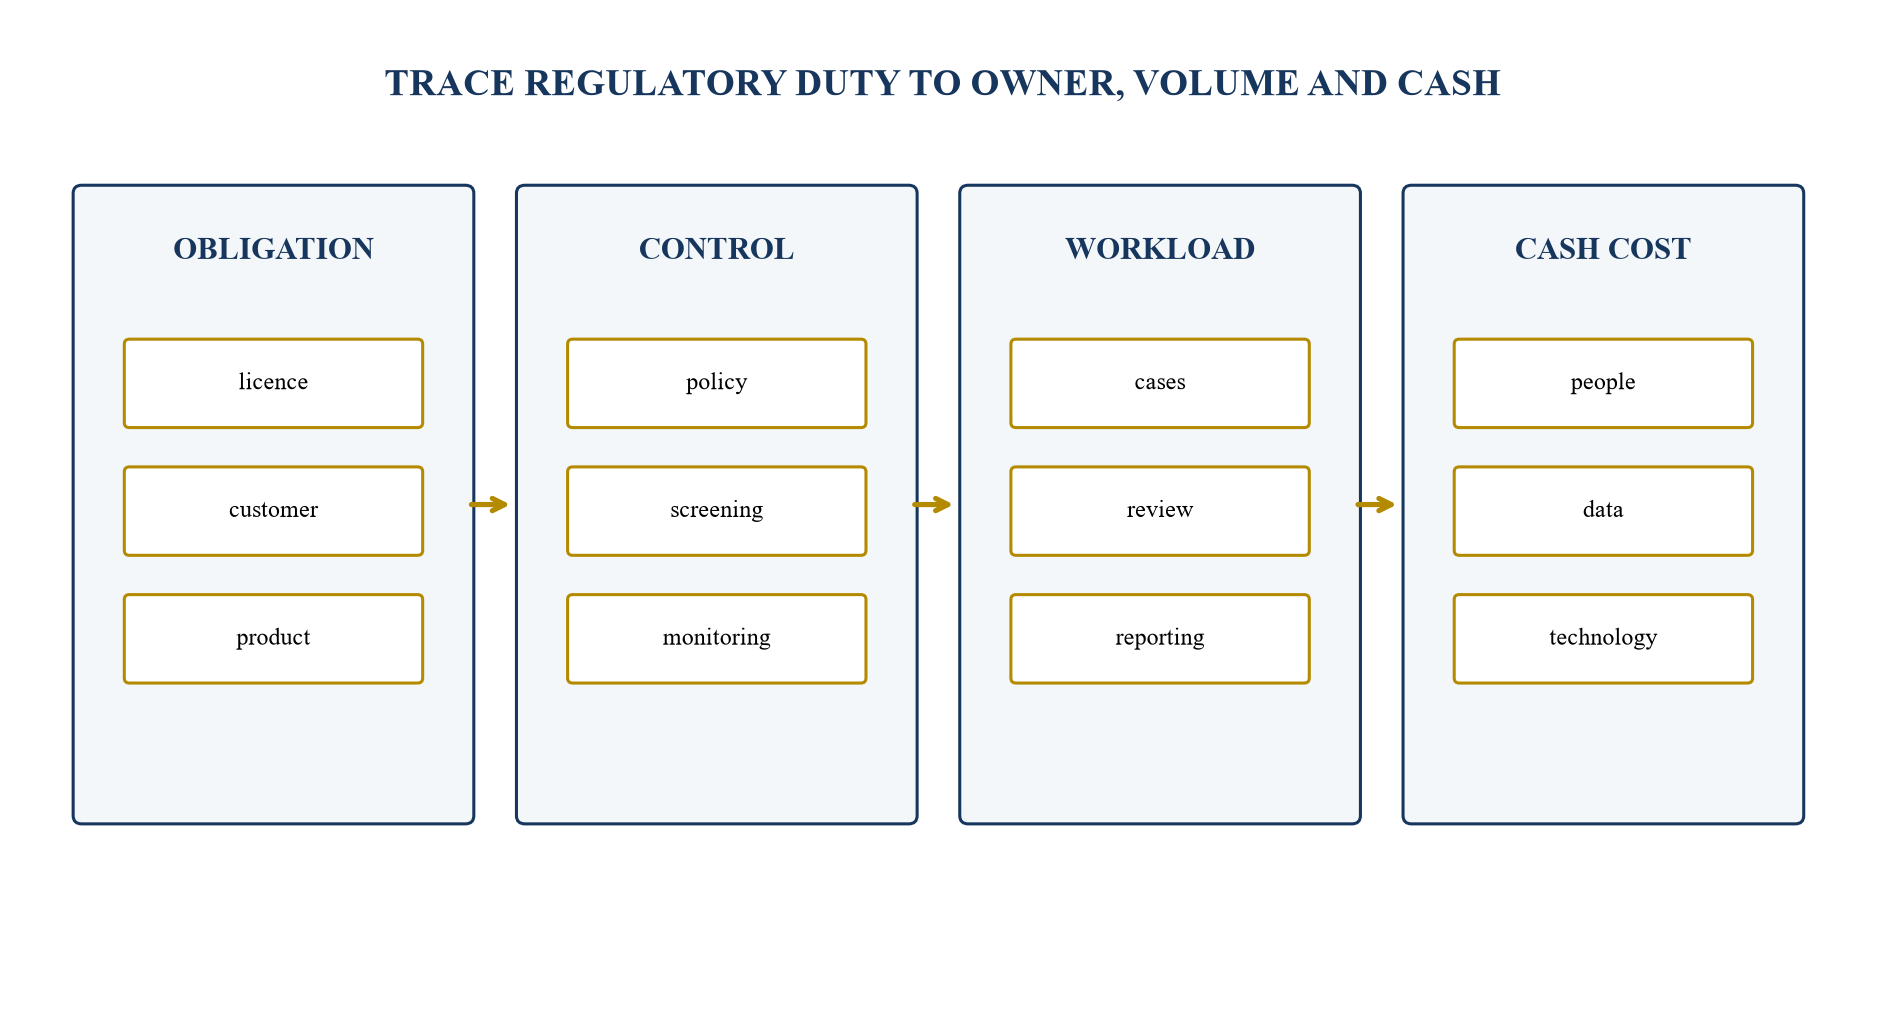
Applicability and cost depend on legal entity, licence, product, jurisdiction, workload and supervisory expectations.
The cost map should identify scale effects. Some control costs grow with customers or transactions, some step up when a new licence or geography is added, and some remain fixed within a capacity range. Backlogs and deferred remediation represent operating risk even when current cash cost appears low.
Capacity modelling should translate forecast customers and transactions into alerts, cases, reviews, reports and quality checks. Productivity assumptions should be supported by observed handling times and complexity. A lower average handling time may reflect closure of easy cases while complex cases accumulate. The model should include training, leave, supervision and quality assurance rather than assume all paid hours are productive. Technology expenditure should be mapped to the controls it supports, with duplicate platforms and manual workarounds visible. This provides a more credible view of the funding needed for compliant scale.
23. Measure alert productivity
For financial-crime and fraud operations, alert count alone says little. The model should track alerts per transaction, cases opened, true findings, time to disposition, ageing, escalation, reports filed, quality exceptions and outcomes. Threshold and data changes should be logged.
AI can improve prioritisation and network detection. BIS Project Hertha emphasises labelled data, feedback loops and explainability. An investor should see whether productivity gains are independently validated and whether investigators can understand, challenge and document the result.
Alert productivity should be separated from effectiveness. Closing more alerts per analyst is useful only when material activity remains detected and decisions meet quality standards. Sampling should cover closed, escalated and missed populations. Outcome feedback should return to rules and models in a controlled manner so investigator decisions do not create unreviewed bias. Metrics should identify data-source outages and latency because apparent alert reductions may arise from missing feeds. A transaction plan should recognise remediation cost if historical monitoring coverage was incomplete.
24. Address fairness and customer outcomes
Models should be evaluated for performance and outcomes across relevant customer groups, within lawful data and governance boundaries. Approval, decline, pricing, fraud flag, complaint and remediation patterns may reveal unequal effects. Small sample sizes and missing attributes should be disclosed.
Fairness assessment requires a defined policy objective, suitable metrics and qualified review. It should not be reduced to one score. The equity case should account for remediation, customer restitution, supervisory action and trust damage under adverse outcomes.
Customer outcome governance should connect model monitoring with complaints, appeals and human review. Customers should receive understandable information where required, and staff should have authority and evidence to correct errors. The company should test whether opt-outs or alternative pathways are feasible for material decisions under applicable guidance. Data used for fairness testing may itself be limited or sensitive; the methodology and limitations should therefore be documented. Investor diligence should examine whether product growth depends on outcomes that could become unsustainable when governance matures.
25. Govern data quality and lineage
Every critical metric and model feature should have documented origin, permitted use, transformation, retention and access. Transaction identifiers should connect customer, event, decision, settlement, dispute, loss and accounting records without uncontrolled manual joins.
Missing labels, delayed outcomes and inconsistent identifiers can distort AI performance and revenue analysis. The diligence pack should quantify completeness, duplication, reconciliation breaks and manual overrides. Data debt is an operating and valuation issue because it increases control cost and limits reliable scale.
Data-quality controls should operate at ingestion, transformation and consumption. They should test schema, range, uniqueness, timeliness, referential integrity and reconciliation to authoritative totals. Corrections need traceable approval rather than silent overwriting. Model features and management metrics should use controlled versions so historical results remain reproducible. Privacy, purpose limitation and retention requirements may restrict how data is combined; those constraints should be designed into architecture and operating procedures. A buyer or investor should see the cost and timeline to resolve material data debt before relying on a high-growth forecast.
26. Assess third-party dependency
FinTech operations may depend on cloud providers, model vendors, data suppliers, processors, sponsor banks, networks and compliance platforms. Contracts should be reviewed for service levels, pricing, audit rights, data location, subcontracting, security, incident support, portability, termination and change of control.
Concentration can increase implementation speed while creating outage, repricing and negotiation risk. The financial model should include minimum commitments, usage tiers, migration cost and a credible exit plan. Critical outsourced decisions remain subject to the FinTech’s accountability under applicable rules.
Dependency mapping should include fourth parties where a critical vendor relies on another provider. The company should know which products and customers are affected by each dependency and which recovery objectives apply. Incident history, resilience tests and contractual remedies should be reviewed against actual architecture. An exit plan should specify data export, model replacement, parallel running, regulatory notice, customer communication and cost. A generic statement that another vendor exists does not establish substitutability if integration and validation exceed available liquidity.
27. Analyse cloud and model unit cost
AI cost should be linked to business activity. Relevant drivers may include tokens, model calls, feature computation, storage, data acquisition, monitoring, human review and peak capacity. Costs should be allocated to products and customer cohorts using a consistent method.
Unit cost can fall through model routing, caching, smaller models and process redesign. Price reductions from suppliers should be treated as scenario inputs until contracted or observed. Savings should be tested against quality, latency, resilience, security and vendor concentration.
Usage economics should be measured per completed business outcome as well as per technical call. A cheaper model that requires more retries, review or remediation can increase total cost. The model-routing policy should assign tasks according to risk and quality requirements, with controlled fallback when a provider fails. Forecasts should distinguish contracted prices, observed optimisation and proposed engineering work. Capitalised development, operating cloud cost and third-party licences should be treated consistently under applicable accounting policies. Sensitivities should cover volume spikes, currency, supplier repricing and loss of promotional credits.
28. Reconcile contribution margin
Contribution margin should begin with net revenue and deduct the costs that vary meaningfully with customer activity and risk. These may include processor and network fees, incentives, fraud, credit loss, cloud, model inference, customer support and compliance operations. The definition should be consistent across periods.
The model should show contribution by product, geography, customer and cohort. Positive blended contribution can conceal loss-making growth. Corporate overhead and investment expenditure should remain separately visible so investors can bridge contribution to EBITDA, operating cash flow and funding need.
Management should define which costs are truly variable within the decision horizon. Compliance and support often behave as step costs because capacity is added in teams or systems. Technology can contain fixed commitments and variable usage. The bridge should therefore show current contribution and marginal contribution at forecast scale. Shared costs should use transparent allocation drivers and should also be shown unallocated so the economics are not created by arbitrary distribution. Reconciliation to operating cash flow should explain working capital, capital expenditure, taxes and financing items.
Table 2. Contribution-margin bridge
| Bridge item | Analytical question | Evidence test |
|---|---|---|
| net revenue | what price is retained after pass-throughs? | contracts, invoices and ledger |
| incentives | which acquisition or retention behaviour was purchased? | customer-level campaign match |
| fraud and disputes | what loss remains after recovery? | incident-to-cash roll-forward |
| credit loss | how do cohorts season? | delinquency and write-off vintage |
| technology | which cost scales with activity? | vendor invoice and usage record |
| service and compliance | what work is required per active customer? | workload, capacity and payroll |
Cost classification should follow a consistent management definition and reconcile to statutory and cash reporting.
29. Evaluate revenue retention
Gross revenue retention should exclude expansion and show the effect of churn and contraction. Net revenue retention includes expansion from retained customers. Both require stable customer and product definitions. Reactivations, acquisitions and migrations should be treated consistently.
For transaction businesses, active volume retention and take-rate retention provide useful supporting views. A customer may remain active while shifting volume or obtaining lower pricing. Retention should therefore connect activity, price, contribution and cash rather than rely on account status.
Contract expansion should be separated into more usage of the same product, adoption of another product and price change. Cross-sell can increase revenue while introducing new risk or support cost. Logo retention may appear strong when dormant customers remain technically open; an activity threshold should therefore be defined and tested. Cohort retention should be presented gross of acquisitions and with consistent currency treatment. Where a platform serves both enterprises and consumers, retention measures should reflect the economic unit that management can actually influence.
30. Test acquisition efficiency
Customer acquisition cost should include attributable sales, marketing, referral, incentive, onboarding and implementation expenditure. Payback should use contribution after risk and service cost, with a clear treatment of fixed capacity and shared spend.
Channel cohorts should be compared on conversion, activation, retention, fraud, support demand and contribution. Growth purchased through temporary subsidies or affiliates may have a different quality from embedded distribution. Management forecasts should label assumed lifetime and future margin explicitly.
The acquisition model should identify cash timing. Commissions and incentives may be paid before revenue is collected, creating a liquidity requirement even when lifetime value appears attractive. Payback should be measured using realised contribution and a survival curve, with uncertainty for young cohorts. Brand expenditure and general market development may not be attributable to individual customers; it should remain visible outside the channel calculation. A board should compare organic, partnership, enterprise-sales and paid-acquisition routes on capital efficiency and control over the customer relationship.
31. Build the operating forecast
The forecast should model customers, activity, price, incentives, loss, direct cost, headcount, capital expenditure, working capital and cash by product and geography. Drivers should connect to historical evidence and stated commercial actions. Model changes should be version-controlled.
Base, downside and upside cases should vary a coherent set of operating conditions. The downside should include slower activation, take-rate compression, higher fraud or credit loss, compliance step-up, delayed automation and funding slippage. Liquidity should remain adequate under the board-approved downside or the financing plan should change.
Forecast governance should record assumptions, sources, owner and last validation. Operational drivers should feed the financial statements without uncontrolled plugs. Balance sheet and cash-flow effects should follow growth, including receivables, settlement balances, reserves, capitalised development and regulatory capital where applicable. The model should identify the minimum cash point and the date at which management must act. Scenario responses may include reducing incentives, delaying expansion, repricing, raising earlier or changing the funding instrument. Their feasibility should be tested before they are treated as mitigation.
32. Separate proof from aspiration
Each claimed AI benefit should be classified as deployed and measured, deployed with limited evidence, in pilot, contracted, designed or conceptual. Only measured outcomes should enter the historical bridge. Forecast benefits should have owners, milestones, investment requirements and validation methods.
This classification helps prevent a product roadmap from being capitalised mentally as present value. It also shows investors where fresh equity creates a verifiable step change. Claims should be revised when monitoring contradicts the original assumption.
An evidence register should link each benefit claim to baseline, intervention, population, period, metric, result, cost, reviewer and decision. Results from a pilot should identify whether production infrastructure, controls and customer behaviour are comparable. Scaling can change latency, data quality, attack response and unit cost. The investment case should show the amount and timing of expenditure required to move from pilot to controlled production. Benefits that depend on another unbuilt system should be sequenced and probability-weighted rather than presented as immediate run rate.
33. Connect operations to valuation
Valuation should triangulate methods appropriate to the company’s maturity and economics. Revenue multiples may be useful for comparison, but they should be read with growth, retention, take rate, contribution, loss, concentration, compliance and cash need. Discounted cash flow requires supportable long-term assumptions and sensitivity.
Comparable companies should be selected by business model, geography, regulatory perimeter, growth and margin rather than a broad FinTech label. Transaction premiums and private-market discounts need fact-specific analysis. Qualified valuation advice may be required for a formal conclusion.
Revenue quality can affect both forecast cash flow and the risk investors assign to it. Better retention, lower concentration and proven control may support a more credible growth duration or lower execution discount. The same benefit should not be reflected twice through both improved cash flow and a higher multiple without justification. Valuation should also incorporate fresh capital, existing debt, preference rights, options and other dilution. Scenario outputs should show pre-money, post-money and fully diluted stakeholder outcomes so the financing decision connects enterprise quality with ownership.
34. Build the valuation sensitivity
The sensitivity should connect operating drivers to enterprise and equity value. It should show how changes in sustainable net revenue, contribution margin, growth, discount rate, terminal economics, fraud and compliance affect the result. Net debt, restricted cash, preference rights and dilution should then bridge to stakeholder value.
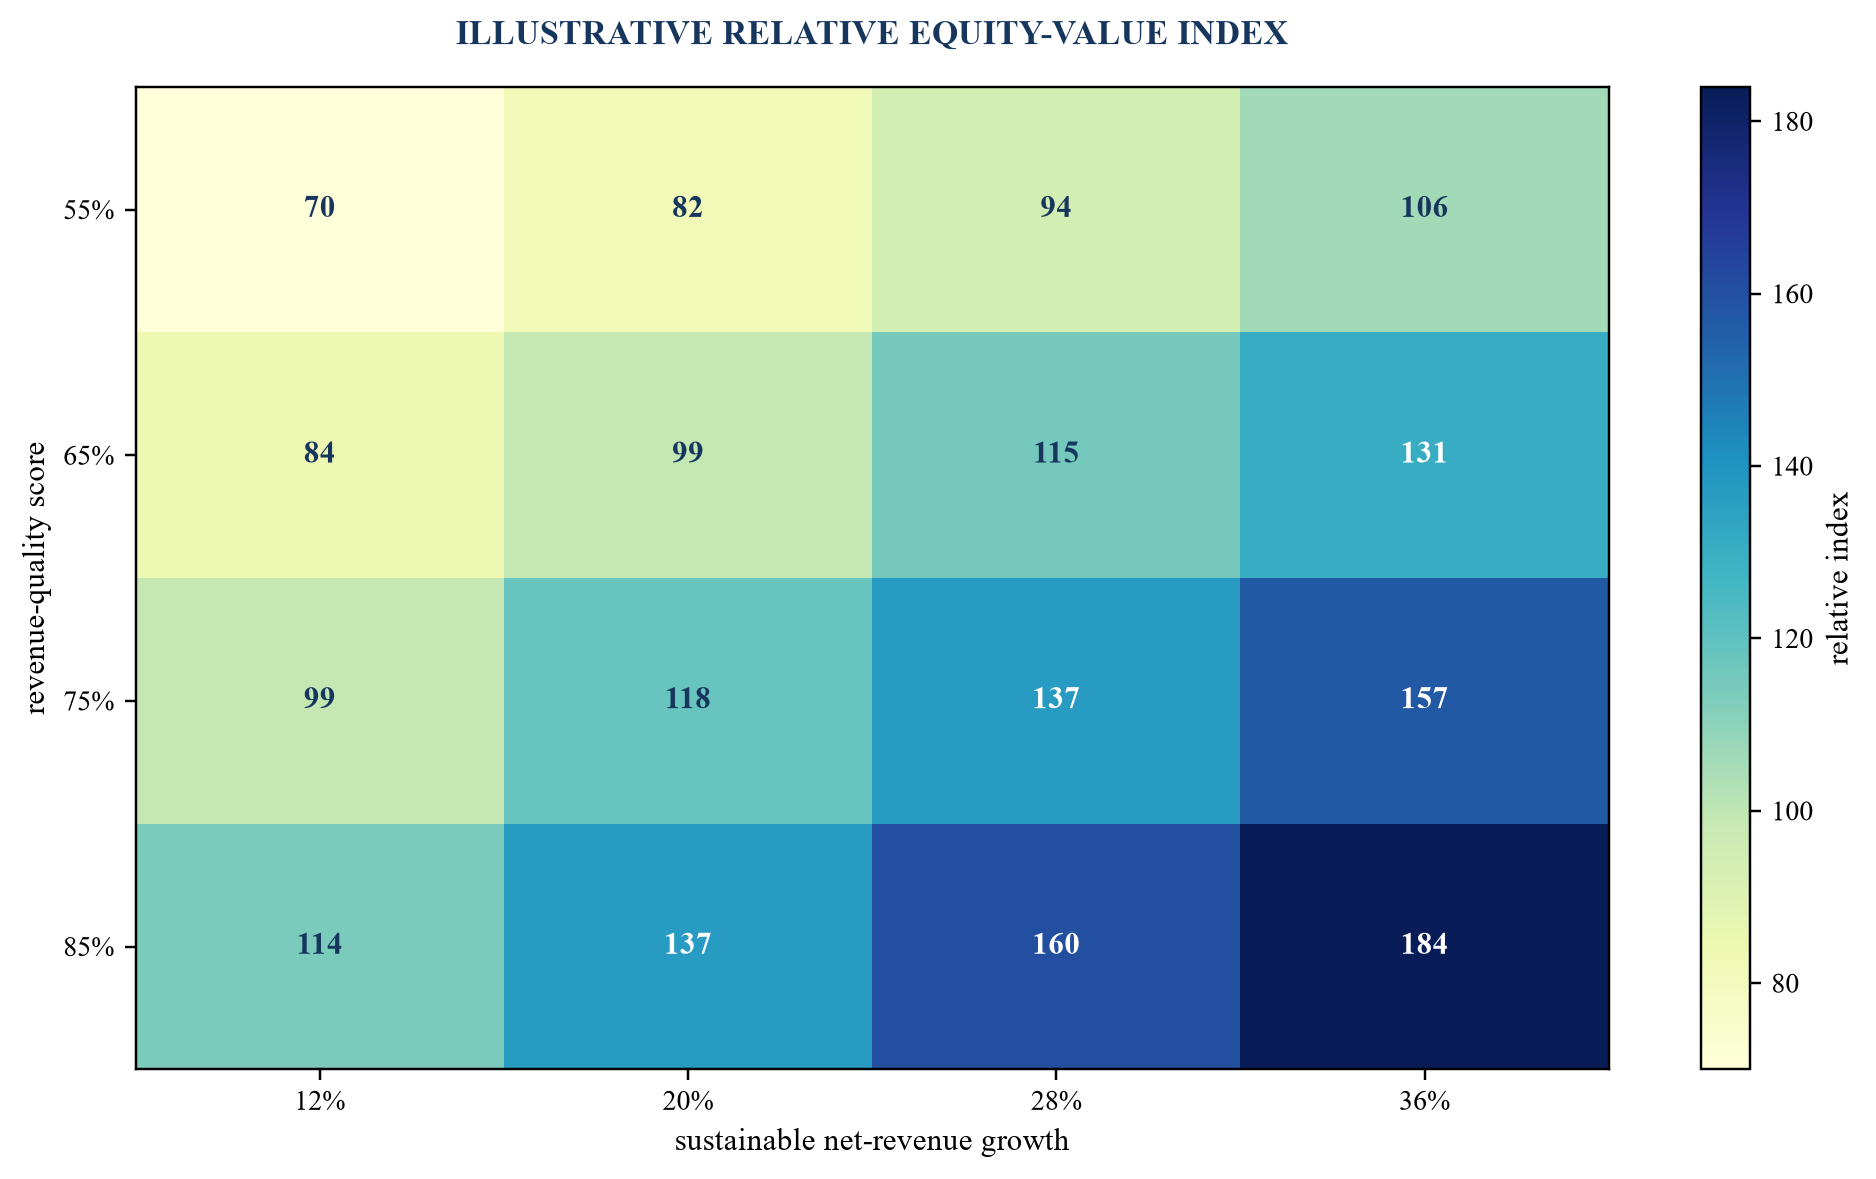
Values are illustrative relative indices; they are not a valuation opinion or market forecast.
Figure 5 is an analytical illustration, not a valuation opinion. Company-specific inputs should be supported by evidence and reviewed against market and transaction conditions at the valuation date.
Sensitivity analysis should focus on variables management and investors genuinely debate. A two-dimensional table can be supplemented with a scenario waterfall showing the contribution of retention, take rate, loss, cost and funding dilution. Correlated assumptions should move together; slower growth may reduce loss and support cost, while a rapid enterprise expansion may lower take rate and improve retention. Reverse stress testing can identify the combination of deterioration that exhausts liquidity or breaches the board’s minimum return. This helps define operating triggers and financing headroom.
35. Score revenue quality
A scorecard can organise evidence across recurrence, price durability, retention, concentration, contribution, cash conversion, fraud, compliance, data, model governance and forecast reliability. Scores should point to underlying evidence and should not replace investment judgement.
Table 3. Revenue-quality scorecard
| Dimension | Strong evidence | Warning signal |
|---|---|---|
| monetisation | contracted and realised pricing reconcile | unexplained gross-to-net movement |
| retention | stable cohort activity and contribution | headline growth masks contraction |
| risk | losses, false positives and recoveries reconciled | savings inferred without counterfactual |
| compliance | obligations, workload and capacity mapped | growing backlog or deferred remediation |
| AI governance | inventory, validation and accountable owner | undocumented model or vendor dependency |
| cash | settlement and operating cash reconcile | restricted or customer funds treated as liquidity |
Evidence thresholds and weights should be approved for the company and transaction under review.
Weights should reflect the company and transaction. A lending FinTech may place greater weight on credit vintages; a payments platform may emphasise take rate, fraud and processor concentration. The scorecard should retain dissent and unresolved evidence requests.
Scoring guidance should define the evidence required for each grade. An unresolved material exception should cap the relevant score even when management expects a favourable outcome. Scores should be refreshed at each diligence checkpoint and changes explained. The investment committee should receive the underlying evidence, not only a composite number. The scorecard is most useful as a routing tool: weak retention may trigger cohort diligence, weak governance may trigger validation and legal work, and weak cash conversion may change the amount or structure of capital offered.
36. Design the diligence data room
The data room should include corporate and licence records, financial statements, management accounts, customer contracts, revenue and transaction exports, pricing, incentives, concentration, fraud, disputes, credit, compliance, model inventory, validation, data governance, cybersecurity, vendors, workforce, forecasts and board materials.
Files should be indexed, dated, access-controlled and linked to the operating model. Sensitive customer and security data should be minimised and handled under applicable law and agreed protocols. Redaction should preserve the facts required for review.
37. Prepare the investor narrative
The narrative should explain the customer problem, regulated operating model, durable revenue engine, AI-enabled advantage, evidence, funding use, milestones and risks. Every important claim should link to a source or clearly labelled forecast. The narrative should reconcile with the model and data room.
Investor materials should explain trade-offs. Tighter fraud controls can reduce loss and approval; compliance investment can increase near-term cost and enable credible scale; enterprise customers can lower take rate and improve retention. Transparent trade-offs strengthen decision quality.
38. Link proceeds to value-inflection milestones
Use of proceeds should map to specific commercial, product, regulatory, risk and financial milestones. Each milestone needs an owner, cost, timing, dependency, success measure and evidence package. The funding plan should include contingency and liquidity reserve.
Milestones could include a contracted customer cohort reaching positive contribution, a validated fraud model improving loss without unacceptable false positives, a completed regulatory expansion, or a verified reduction in unit service cost. The board should avoid milestones defined solely as expenditure completed.
39. Run the ninety-day equity-readiness sprint
The first thirty days should reconcile evidence and definitions. Days thirty-one to sixty should validate cohorts, losses, compliance workload, automation benefit, forecast and valuation sensitivities. Days sixty-one to ninety should resolve material exceptions, approve the equity story and prepare the controlled data room.
Table 4. Ninety-day equity-readiness plan
| Period | Core work | Decision output |
|---|---|---|
| days 1 to 30 | evidence ledger, metric dictionary and perimeter | approved historical baseline |
| days 31 to 60 | cohort, fraud, compliance, AI and cash analysis | validated operating model |
| days 61 to 90 | scenarios, valuation, materials and data room | launch, revise or defer decision |
| ongoing | monthly monitoring and exception closure | current financing evidence |
Timing depends on evidence availability, issue severity, governance and transaction requirements.
The sprint should end with an explicit board decision and unresolved-issue register. Transaction readiness is a maintained operating capability rather than a one-off presentation exercise.
40. Conclusion
FinTech AI revenue quality is the ability to convert customer activity into durable, risk-adjusted and cash-converting economics under credible governance. It requires a common evidence model spanning contracts, transactions, accounting, fraud, compliance, technology and customers.
AI can improve conversion, loss prevention, service and compliance productivity. Its equity value depends on incremental measured outcomes after false positives, model cost, drift, oversight and remediation. A controlled revenue-quality bridge, cohort view, fraud waterfall, compliance map and valuation sensitivity allow boards and investors to distinguish operating proof from aspiration and to fund the next verifiable value milestone.
Table 5. Board decision checklist
| Question | Required evidence | Board action |
|---|---|---|
| is revenue durable? | contract, cohort, pricing and retention bridge | approve or challenge forecast |
| does AI create incremental value? | counterfactual, cost and validation | scale, revise or stop use case |
| are fraud and customer outcomes controlled? | loss, false-positive and complaint evidence | set risk appetite and remediation |
| can compliance scale? | obligation, workload, capacity and cost map | fund capacity and governance |
| does the valuation reflect quality and cash need? | scenarios, sensitivity and capital structure | approve financing parameters |
| is the company transaction-ready? | reconciled data room and exception register | launch, defer or change route |
The checklist supports governance and does not replace professional legal, accounting, tax, regulatory, valuation or investment advice.
References
- Central Bank of the UAE, Guidance Note on Consumer Protection and Responsible Adoption and Use of Artificial Intelligence and Machine Learning, https://rulebook.centralbank.ae/en/rulebook/guidance-note-consumer-protection-and-responsible-adoption-and-use-artificial-intelligence
- Dubai Financial Services Authority, AI Survey 2025, https://www.dfsa.ae/news/new-dfsa-ai-survey-generative-ai-adoption-has-nearly-tripled-within-difc-last-12-months-governance-continues-develop
- Bank for International Settlements Innovation Hub, Project Noor, https://www.bis.org/project/noor
- Bank for International Settlements Innovation Hub, Project Hertha, https://www.bis.org/publications/project-hertha-identifying-financial-crime-patterns-real-time-retail-payment-systems
- Bank for International Settlements, Intelligent financial system: how AI is transforming finance, https://www.bis.org/publ/work1194.htm
- Bank for International Settlements, Annual Economic Report 2025, Chapter III, https://www.bis.org/publ/arpdf/ar2025e3.pdf
- Committee on Payments and Market Infrastructures, Enhancing cross-border payments: addressing fraud, https://www.bis.org/cpmi/pietf/fraud_report_2026.pdf
- Financial Stability Board, The Financial Stability Implications of Artificial Intelligence, https://www.fsb.org/2024/11/the-financial-stability-implications-of-artificial-intelligence/
- Financial Action Task Force, Opportunities and Challenges of New Technologies for AML/CFT, https://www.fatf-gafi.org/en/publications/Digitaltransformation/Opportunities-challenges-new-technologies-aml-cft.html
- Financial Action Task Force, Risk-Based Approach Guidance for the Banking Sector, https://www.fatf-gafi.org/en/publications/Fatfrecommendations/Risk-based-approach-banking-sector.html
- European Banking Authority and European Central Bank, Joint report on payment fraud, https://www.eba.europa.eu/publications-and-media/press-releases/eba-and-ecb-publish-joint-report-payment-fraud
- European Banking Authority, Guidelines on ICT and security risk management, https://www.eba.europa.eu/regulation-and-policy/internal-governance/guidelines-ict-and-security-risk-management
- European Union, Artificial Intelligence Act, https://eur-lex.europa.eu/eli/reg/2024/1689/oj
- National Institute of Standards and Technology, AI Risk Management Framework, https://www.nist.gov/itl/ai-risk-management-framework
- International Organization for Standardization, ISO/IEC 42001 Artificial intelligence management systems, https://www.iso.org/standard/81230.html
- OECD, OECD AI Principles, https://oecd.ai/en/ai-principles
- IFRS Foundation, IFRS 15 Revenue from Contracts with Customers, https://www.ifrs.org/issued-standards/list-of-standards/ifrs-15-revenue-from-contracts-with-customers/
- IFRS Foundation, IFRS 9 Financial Instruments, https://www.ifrs.org/issued-standards/list-of-standards/ifrs-9-financial-instruments/
- IFRS Foundation, IFRS 7 Financial Instruments Disclosures, https://www.ifrs.org/issued-standards/list-of-standards/ifrs-7-financial-instruments-disclosures/
- IFRS Foundation, IAS 7 Statement of Cash Flows, https://www.ifrs.org/issued-standards/list-of-standards/ias-7-statement-of-cash-flows/
- IFRS Foundation, IFRS 13 Fair Value Measurement, https://www.ifrs.org/issued-standards/list-of-standards/ifrs-13-fair-value-measurement/
- International Valuation Standards Council, International Valuation Standards, https://www.ivsc.org/standards/
- UK Information Commissioner's Office, Artificial intelligence and data protection, https://ico.org.uk/for-organisations/uk-gdpr-guidance-and-resources/artificial-intelligence/
- UK Financial Conduct Authority, AI and financial services, https://www.fca.org.uk/firms/innovation/artificial-intelligence
- U.S. Securities and Exchange Commission, Financial reporting manual and revenue recognition resources, https://www.sec.gov/corpfin/cf-manual
- Central Bank of the UAE, Financial Stability Report 2025, https://www.centralbank.ae/media/p2rpafum/cbuae-fsr-report_2025_en.pdf
