

1. Introduction
Private capital has become a significant channel for financing companies, infrastructure and real assets. The Bank for International Settlements describes private-market activity as an ecosystem led by institutional investors and alternative asset managers, with long-horizon institutions providing most of the capital.[1] The International Monetary Fund has documented the expansion of private credit and the role of illiquid fund structures in financing borrowers that may have limited access to public markets.[2] These structures can align long-duration assets with patient capital. They can also make the price of liquidity difficult to observe.
The challenge is especially relevant in the Gulf. The region combines large sovereign and institutional pools of capital, deepening exchanges, active private transactions, ambitious infrastructure programmes and a growing set of alternative strategies. The IMF has called for deeper GCC bond markets, broader institutional participation and action on structural impediments including low liquidity and settlement infrastructure.[3] Public-market development therefore coexists with opportunities whose exit routes, trading depth and cash-flow timing vary materially.
Investment committees often ask whether a private strategy offers enough return to justify a long lock-up. The available evidence may include a target internal rate of return, a multiple of invested capital, quarterly valuations and selected comparable funds. Each measure answers part of the question. Internal rate of return is sensitive to cash-flow timing. A multiple ignores time. Quarterly net asset values may be appraisal-based. Peer quartiles can carry selection, reporting and vintage bias. A liquid benchmark can be poorly matched to the underlying risk.
The term liquidity premium needs a controlled definition. This paper uses the term to mean the net compensation that remains after matching cash-flow dates to a replicable liquid alternative and accounting for material differences in leverage, beta, valuation, fees, cash drag, concentration and exit friction. The result belongs to a specific investor, strategy, vintage and measurement period. It is not a permanent regional constant.
This definition creates a disciplined decision sequence. Reconstruct the investor's actual cash flows. Select the liquid alternative available at each date. Calculate several return measures. Test the value under an early sale. Adjust for risks that the benchmark does not capture. Compare the residual with the institution's approved hurdle and liquidity capacity. The process converts a broad narrative into an auditable allocation decision.
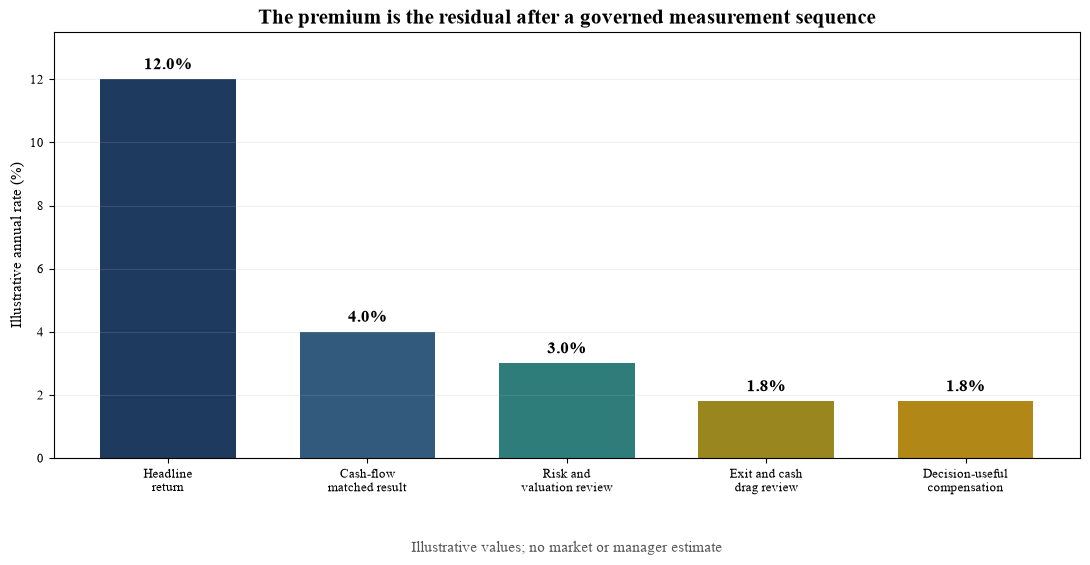
Author framework. Each layer should be calculated from verified cash flows and documented assumptions.
2. What institutions mean by a liquidity premium
Liquidity has several dimensions. Market liquidity concerns the ability to trade an asset promptly, in size and near an observable price. Funding liquidity concerns the ability of the investor or borrower to meet cash obligations. Contractual liquidity concerns redemption, transfer, notice, gate and lock-up terms. Valuation liquidity concerns the frequency and reliability with which an asset can be priced. A private investment can score differently across all four.
The economics of illiquidity are also multi-layered. Lerner and Schoar modelled transfer restrictions in private equity as a screening mechanism that attracts investors with a low probability of liquidity shocks.[4] Nadauld, Sensoy, Vorkink and Weisbach used secondary transactions to study the cost borne when private-equity investors seek liquidity. Their sample showed that discounts and buyer-seller return differences were associated with asymmetric information and market depth.[5] Vayanos showed theoretically that the preference for liquidity can rise with volatility, making liquidity premia state-dependent.[6]
These findings support three governance conclusions. First, the cost of illiquidity changes through the cycle. A calm-period estimate can understate the value of liquidity in stress. Second, liquidity compensation can accrue to the party able to provide capital when others need an exit. Third, an investor's ability to earn the premium depends on its own liabilities, governance speed and reserve capacity.
The return on an illiquid strategy includes more than compensation for the lock-up. Private credit may earn spread for credit loss, complexity, documentation, origination and monitoring. Private equity may earn returns from leverage, operating change, multiple movement and selection. Infrastructure can earn construction, regulatory, demand and counterparty compensation. Real estate can earn development, leasing and asset-management returns. A rigorous framework separates these sources before attributing a residual to illiquidity.
The relevant decision metric is therefore investor-specific. A sovereign institution with stable inflows, substantial liquid reserves and long liabilities can tolerate a different lock-up from an operating company, family office or pension plan with near-term distributions. The same fund can have a positive value for one institution and a weak value for another once liquidity capacity and opportunity cost are included.
Table 1. Four dimensions of liquidity and their observable evidence
| Dimension | Core question | Observable evidence | Stress indicator |
|---|---|---|---|
| Market liquidity | Can the position be sold in size near an observable price? | Trading value, bid-offer spread, free float, depth and block activity | Wider spreads, lower depth or suspended trading |
| Funding liquidity | Can the investor meet calls and obligations without a forced sale? | Cash, committed facilities, inflows, unfunded commitments and collateral | Accelerated calls and delayed distributions |
| Contractual liquidity | What do the legal terms permit? | Lock-up, notice, gate, transfer consent, extension and redemption terms | Gate, extension, consent delay or transfer restriction |
| Valuation liquidity | How quickly and reliably can fair value be established? | Valuation policy, external evidence, frequency, model inputs and back-testing | Stale marks, model dispersion or delayed reporting |
The dimensions should be recorded separately. A single liquid or illiquid label can conceal material differences.
3. The GCC liquid reference market
A GCC liquidity-premium analysis needs an investable public reference. Regional labels alone are insufficient because trading depth differs by exchange, security, sector and ownership structure. Benchmark providers apply free-float, size, liquidity and accessibility requirements to define an investable universe.[7] The selected liquid alternative should represent the economic risk that the private asset replaces in the portfolio.
Official exchange data demonstrate meaningful public-market scale. Saudi Exchange reported 2025 year-end market capitalisation of SAR 8.82 trillion and annual traded value of SAR 1.30 trillion.[8] Abu Dhabi Securities Exchange reported 2025 market capitalisation of AED 3.13 trillion, traded value of AED 385 billion and institutional participation representing 78 percent of total trading value.[9] Dubai Financial Market reported AED 61 billion of traded value in the first quarter of 2026, average daily traded value of AED 1.03 billion and institutional investors representing 70 percent of trading value.[10]
These system-level figures establish that Gulf listed markets can support institutional activity. They do not prove that every security can absorb an institutional exit without price impact. Market capitalisation can be concentrated in large issuers, while free float and average daily value may be smaller. A private-company comparison to a broad exchange index can therefore overstate the liquidity and diversify the economic risk incorrectly.
The benchmark protocol should start with the position's cash-flow engine. A private GCC bank investment may be compared with a liquid regional financials basket. A logistics platform with international customers may require a blend of GCC transport and global logistics securities. A contracted infrastructure asset may require a listed infrastructure or bond reference plus duration adjustment. A venture investment may need a public technology or growth reference, recognising that replication remains imperfect.
Currency also matters. Most GCC currencies maintain pegs or close links to the US dollar, while Kuwait follows a basket arrangement. A USD-based institution can still experience differences in local-currency cash flow, hedging cost, convertibility, dividend timing and benchmark construction. Benchmark documentation should identify the return currency, total-return treatment, tax assumptions, rebalancing and hedge policy.
Table 2. Official indicators for selected GCC public markets
| Market | Reference period | Reported market capitalisation | Reported trading measure | Institutional participation |
|---|---|---|---|---|
| Saudi Exchange | Full year 2025 | SAR 8.82 trillion at year end | SAR 1.30 trillion annual share value traded | Not used in this paper |
| Abu Dhabi Securities Exchange | Full year 2025 | AED 3.13 trillion at year end | AED 385 billion annual trading value | 78% of trading value |
| Dubai Financial Market | First quarter 2026 | AED 897 billion at quarter end | AED 61 billion quarterly traded value; AED 1.03 billion average daily | 70% of trading value |
Sources are the respective exchanges. Periods differ and figures should not be converted into a comparative turnover ranking without consistent average-market-capitalisation data.
4. The measurement architecture
The measurement stack begins with cash flows. Contributions, distributions, fees, recallable distributions, subscription-line effects, tax, hedging and residual value must be captured on the date recognised by the investor. The fund's marketing return can be retained for reconciliation, yet the institution should calculate its own net result from its ledger.
Three common measures serve different purposes. Internal rate of return calculates the discount rate that sets the net present value of cash flows to zero. It incorporates timing and can be distorted by early distributions, subscription facilities and multiple roots. Total value to paid-in capital divides distributions plus remaining value by paid-in capital. It is intuitive and ignores duration. Distributed value to paid-in capital focuses on realised proceeds. These measures are useful controls and cannot establish the liquid opportunity cost on their own.
Kaplan and Schoar introduced a public market equivalent that discounts private contributions and distributions using the realised public-market return over the same dates.[11] A ratio above one indicates that the discounted value of distributions and residual value exceeds the discounted value of contributions. The metric is sensitive to benchmark choice and implicitly embeds assumptions about systematic risk.
Direct alpha converts benchmark-adjusted cash flows into an annualised result. Korteweg and Nagel showed that private-market performance evaluation is challenging because payoffs are infrequent, skewed, dependent and realised over varying horizons; their work generalises the PME framework and highlights the importance of risk adjustment.[12] An institution should therefore report PME and direct alpha alongside leverage, beta and concentration evidence.
A newer investor-portfolio equivalent uses the investor's own portfolio return rather than a broad market portfolio to discount private cash flows.[13] This can be decision-useful when the true alternative is a policy portfolio or a liquid opportunity set with asset-owner-specific constraints. The policy should pre-approve both a strategy benchmark and an investor-opportunity benchmark.
The final layer is the exit test. A private mark becomes decision-useful when it is tested against a plausible transfer price, timing and cost. Secondary bids, comparable transactions, independent valuations and contractual transfer terms can inform the test. Where no evidence exists, the institution should use a range and record the assumption as an estimate.
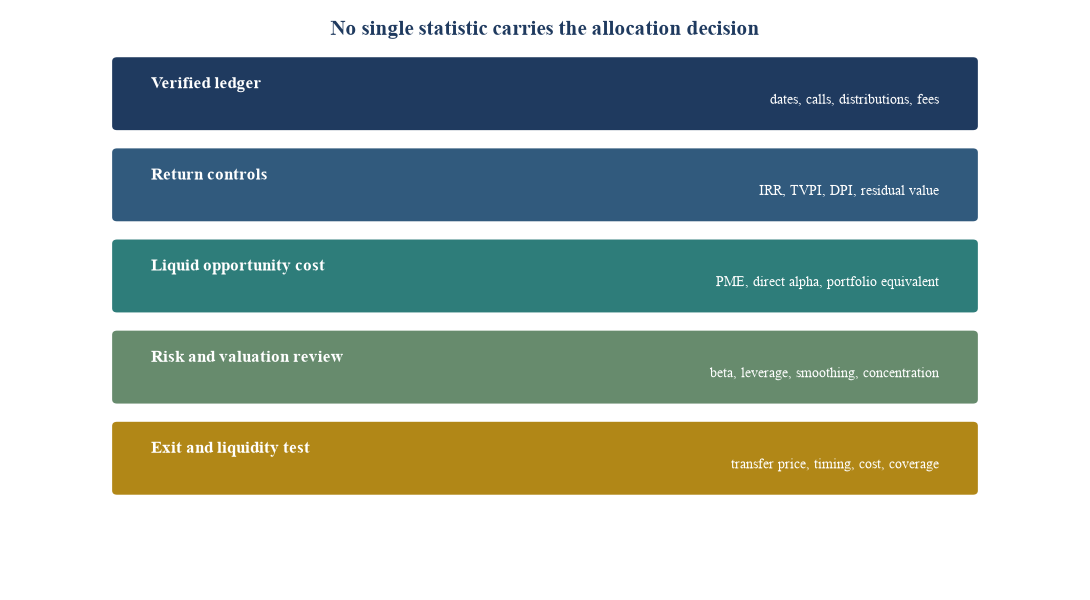
Author framework. Each layer answers a different performance or liquidity question.
5. Reconstructing the cash-flow record
Cash-flow integrity is the first gating test. The institution should reconcile the manager statement, custodian record, capital-account statement and general ledger. Timing differences should be documented. A contribution funded through a subscription facility can delay the investor cash outflow and increase reported internal rate of return without changing the underlying enterprise outcome. The analysis should show results with actual investor dates and with an economic-date adjustment where the data permit.
Fees require look-through. Management fees, carried interest, transaction fees, broken-deal costs, fund expenses, special-purpose-vehicle costs, hedging and taxes can appear in different places. ILPA's Performance Template seeks to standardise performance metrics and contribution-distribution data; the 2025 methodology update reflects continuing efforts to improve comparability.[14] An investor should map its ledger into a consistent template even when the manager uses a different presentation.
Residual value is the largest source of uncertainty in a young fund. The analysis should separate realised value from unrealised value and show the percentage of total value supported by a current external transaction, observable comparable, discounted cash-flow model or manager judgement. A premium based mainly on residual value has a different evidence quality from one supported by distributions.
The data model also needs unfunded commitments and recallable distributions. These items affect the capital still at risk and the liquidity reserve. The portfolio dashboard should show original commitment, paid-in capital, distributions, current net asset value, unfunded commitment, recallable amount and expected call schedule.
Table 3. Minimum data specification for a liquidity-premium ledger
| Field | Required granularity | Primary evidence | Control question |
|---|---|---|---|
| Cash-flow date and amount | Daily, by currency and transaction type | Bank, custodian and capital statement | Does the investor ledger reconcile to the manager? |
| Contribution purpose | Investment, fee, expense or recall | Capital notice and statement | Are fees and economic investment separated? |
| Distribution type | Return of capital, gain, income or recallable | Distribution notice | Is realised value classified consistently? |
| Residual value | Position and valuation date | Valuation report and portfolio schedule | How much is observable versus modelled? |
| Fees and carry | Gross-to-net bridge | LPA, statement and expense report | Does net performance include all investor costs? |
| Benchmark level | Every cash-flow date | Documented total-return series | Was the liquid alternative available and replicable? |
| Unfunded commitment | Current and expected schedule | Manager notice and pacing plan | Can the portfolio meet calls under stress? |
| Transfer evidence | Bid, discount, consent and cost | Secondary indication and legal terms | What proceeds could an exit plausibly deliver? |
The institution should preserve source documents and the reconciliation owner for every field.
6. Benchmark selection and risk matching
Benchmark choice can dominate the apparent premium. A broad GCC equity index may be suitable for a diversified listed-equity allocation. It can be weak for a floating-rate private loan, contracted infrastructure asset or growth-company portfolio. The benchmark committee should document the economic exposure, duration, leverage, currency and investable alternative before the first commitment.
The first test is replicability. The institution should be able to buy the reference exposure at each private cash-flow date in the assumed size, currency and legal form. The second test is economic similarity. Revenue, sector, duration and credit risk should resemble the private strategy. The third test is risk similarity. Leverage, downside, seniority and concentration should be considered. The fourth test is governance consistency. The same protocol should apply across managers and vintages.
Private credit illustrates the problem. A benchmark based on government bonds can exaggerate spread compensation because it excludes credit and complexity. A leveraged-loan or high-yield benchmark may be closer, yet a bespoke senior-secured Gulf loan can have different recovery, covenant and duration characteristics. The analysis can use a blended liquid reference with documented weights and a separate reserve for unspanned risk.
Private equity presents another challenge. Public comparable companies may be larger, more diversified and more liquid than the portfolio companies. Leverage can differ. Sector and vintage exposure can shift. Research has shown that average private-equity performance varies by dataset, time and fund, with wide heterogeneity across managers and vintages.[11][15] The benchmark should be set before outcomes are known to reduce selection bias.
The investor-opportunity benchmark adds a second perspective. If the policy alternative is a diversified liquid portfolio, the cash flows can be discounted using that portfolio's return. This measures whether the illiquid investment improved the actual institutional opportunity set. The strategy benchmark and policy benchmark should be reported side by side rather than blended after the fact.
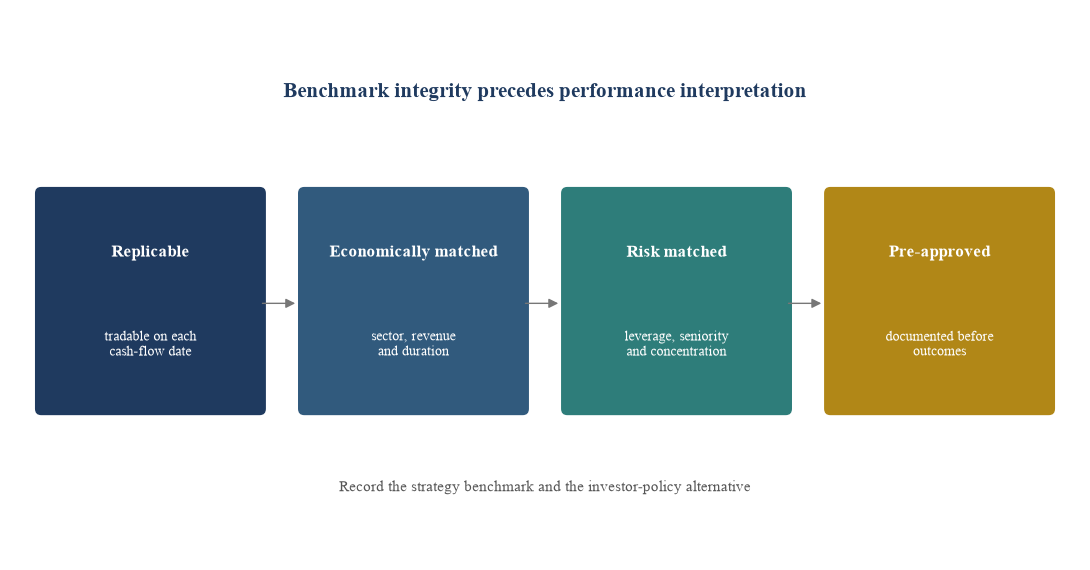
Author framework. A benchmark should pass every gate before it is used for PME or direct alpha.
7. Worked hypothetical cash-flow example
Consider a hypothetical ten-year private-market investment. The investor contributes USD 20 million at inception, USD 30 million in year one, USD 25 million in year two and USD 10 million in year three. Distributions begin in year four and total USD 175 million by year ten. Total contributions are USD 85 million. The resulting distributed multiple is 2.06 times, with no residual net asset value assumed at year ten.
Using the dated annual cash flows, the net internal rate of return is approximately 11.96 percent. The headline result appears to exceed an 8 percent liquid benchmark by nearly four percentage points. This difference is a useful first observation and remains incomplete because contributions and distributions occur at different times.
The Kaplan-Schoar calculation discounts every contribution and distribution by the realised benchmark accumulation factor. The present value of hypothetical distributions is USD 96.91 million and the present value of contributions is USD 77.15 million. The ratio is 1.26. The investment therefore produces 26 percent more benchmark-discounted value than the liquid reference over the cash-flow sequence.
An approximate direct alpha can be expressed by annualising the logarithm of the PME over an assumed 6.5-year effective capital horizon. The result is about 3.5 percent per year. A production calculation should use the exact dated cash flows and a documented direct-alpha method. The 6.5-year horizon used here is an illustrative simplifying assumption.
The 3.5 percent is still not a pure liquidity premium. The private strategy may carry greater leverage, concentration, beta, valuation uncertainty and implementation cost than the benchmark. The institution can apply pre-approved governance reserves or use a formal risk model where sufficient data exist. In the example, illustrative deductions of 0.7 percentage points for leverage and beta mismatch, 0.5 for valuation uncertainty and smoothing, and 0.5 for cash drag and exit friction leave 1.8 percentage points of decision-useful compensation.
Every number in this example is hypothetical. The calculations demonstrate method and do not describe any GCC fund, transaction, manager or expected return.
Table 4. Hypothetical ten-year private-market cash flows
| Year | Contribution | Distribution | Net cash flow | Cumulative net cash flow |
|---|---|---|---|---|
| 0 | 20 | 0 | -20 | -20 |
| 1 | 30 | 0 | -30 | -50 |
| 2 | 25 | 0 | -25 | -75 |
| 3 | 10 | 0 | -10 | -85 |
| 4 | 0 | 5 | 5 | -80 |
| 5 | 0 | 10 | 10 | -70 |
| 6 | 0 | 20 | 20 | -50 |
| 7 | 0 | 35 | 35 | -15 |
| 8 | 0 | 45 | 45 | 30 |
| 9 | 0 | 35 | 35 | 65 |
| 10 | 0 | 25 | 25 | 90 |
USD millions. All values are illustrative and assume no residual value after year ten.
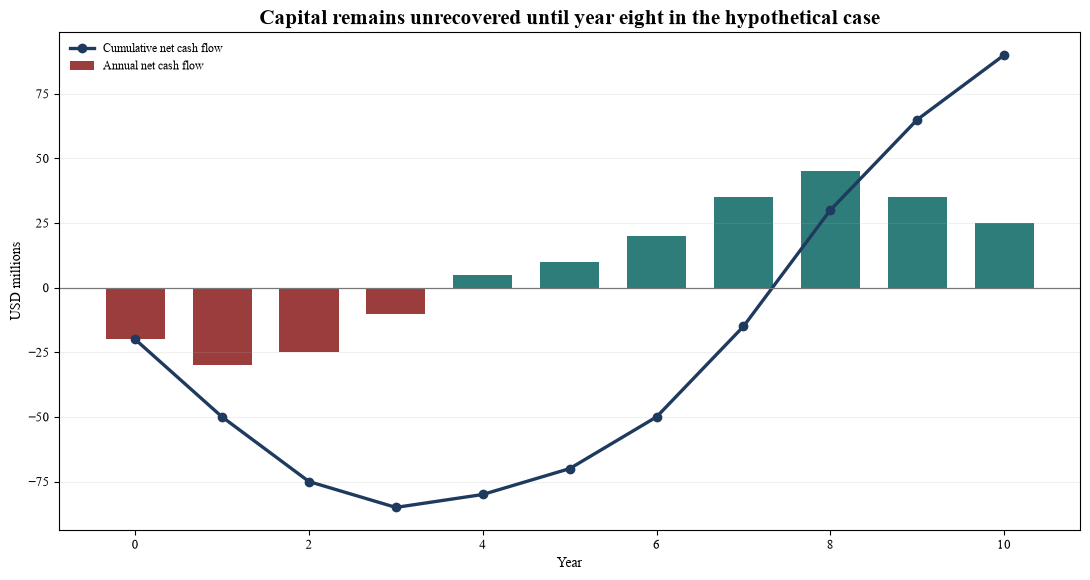
USD millions. The series is illustrative and does not represent a fund or client portfolio.
8. Decomposing the apparent premium
The decomposition begins with leverage. A private buyout portfolio can carry operating-company and fund-level leverage that exceeds the public benchmark. A private credit strategy can earn spread while accepting borrower leverage, covenant and recovery risk. Comparing either strategy with an unlevered or lower-risk index can mislabel risk compensation as illiquidity compensation.
Manager skill is a separate source. Selection, sourcing, governance, operational improvement, restructuring and exit execution can create value. Kaplan and Schoar found large heterogeneity in private-equity fund outcomes and persistence in manager performance in their historical sample.[11] Manager dispersion matters to the allocation decision because the institution may not receive the median strategy outcome.
Complexity and information can also command a return. Bespoke documentation, small transaction size, uncertain diligence, specialist regulation or limited intermediation can reduce competition. These conditions overlap with illiquidity and should be identified separately where evidence allows. A lender receiving covenants, security and monitoring rights can earn compensation for work and downside protection as well as for capital duration.
Valuation smoothing affects measured volatility and correlation. The European Central Bank has noted that uncertainty in private-asset valuations can hide losses and make reported volatility appear lower.[16] An apparent diversification benefit can therefore include a measurement effect. The institution should compare reported marks with public-market movements, operating performance, financing conditions and realised exits.
Cash drag belongs in the net result. Capital reserved for calls can earn less than the strategic benchmark. Recycled distributions, notice periods and currency hedges create additional effects. A liquidity premium that ignores the cost of maintaining callable cash can overstate the contribution to the total portfolio.
The decomposition should be shown as a range when data are limited. Formal estimates can be used where robust cash flows, comparables and risk models exist. Management assumptions should be identified in the investment paper and approved by the committee.
Table 5. Return-source decomposition
| Return source | Evidence needed | Potential misclassification | Governance treatment |
|---|---|---|---|
| Credit and market risk | Losses, spreads, duration, beta and downside | Risk premium described as liquidity premium | Match benchmark risk and retain loss reserve |
| Leverage | Company, asset, fund and subscription-line debt | Leveraged return compared with lower-risk public index | Show leverage-adjusted sensitivity |
| Manager skill | Gross-to-net bridge, attribution and realised exits | Selection or operations described as structural premium | Separate alpha and persistence evidence |
| Complexity and information | Diligence burden, documentation and competition | Work premium merged with lock-up compensation | Record resource cost and repeatability |
| Valuation smoothing | Mark policy, comparables, lag and back-testing | Low reported volatility treated as diversification | Unsmooth or apply valuation-quality reserve |
| Cash drag and pacing | Reserve yield, call timing and distributions | Portfolio implementation cost omitted | Include total-portfolio cash cost |
| Exit friction | Transfer consent, discount, time and fees | Residual value treated as fully realisable | Apply secondary-exit test |
The table defines analytical categories. It does not prescribe a universal adjustment size.
9. The secondary-exit test
The strongest evidence about the value of liquidity can appear when an investor seeks an exit. Private-equity secondary research has found that many transactions occur below stated net asset value and that buyer-seller performance differences vary with fund age, information asymmetry and market depth.[5] Historical results from a global proprietary sample cannot be transferred directly to a Gulf portfolio. They establish the relevance of transaction price as a liquidity-cost signal.
The exit test should be performed even when no sale is planned. The institution can request indicative pricing from qualified counterparties, review comparable secondary transactions, examine transfer restrictions and estimate tax, legal and execution cost. A range is more credible than a single unsupported discount.
The discount should be connected to time. A position marked at 100 and sold at 85 experiences an immediate 15 percent loss relative to the mark. A buyer paying 85 needs approximately 5.6 percent annual appreciation over three years to reach 100 before considering other cash flows. At a 25 percent discount, the annual appreciation needed over three years is about 10.1 percent. This arithmetic shows why apparent buyer returns can include the price paid for providing liquidity.
Exit capacity depends on more than price. General-partner consent, right of first refusal, confidentiality, sanctions screening, investor eligibility, vehicle-level leverage and tax can affect timing and certainty. The dashboard should distinguish executable proceeds from a theoretical valuation.
For direct assets, the test can use a sale process, refinancing capacity or listed-comparable bridge. For private credit, it can use a transfer quotation, expected recovery and settlement analysis. For real estate, it can use broker evidence, transaction cost and time to complete. The evidence standard should match the decision materiality.
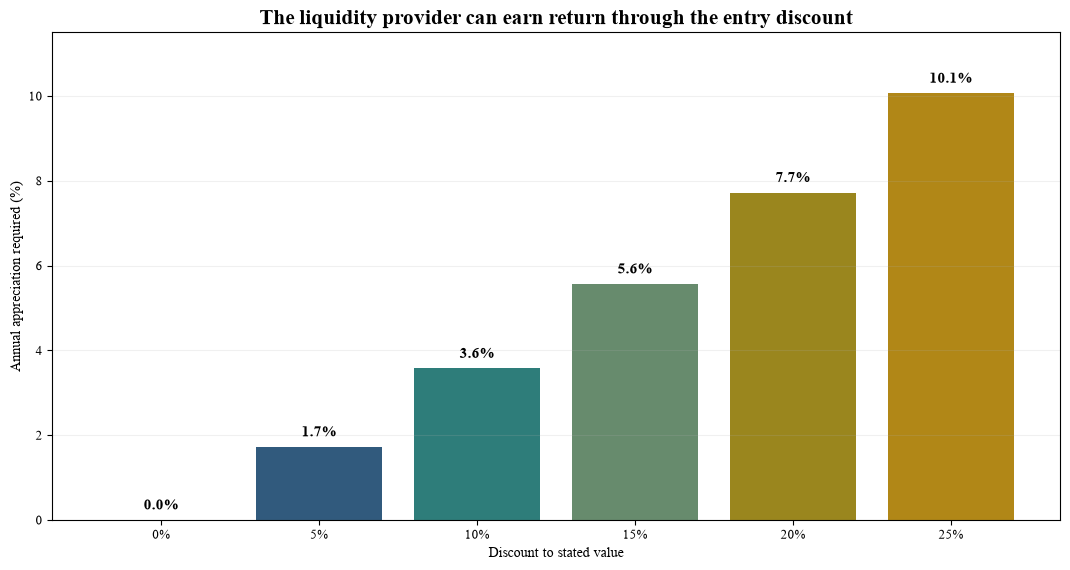
Illustrative arithmetic assumes no interim cash flows, fees or value change other than recovery from purchase price to stated value.
10. Valuation quality and reported volatility
Private assets are valued less frequently than exchange-traded securities. The valuation may rely on comparable-company multiples, precedent transactions, discounted cash flow, broker opinions or independent appraisal. Each method can be appropriate. The governance risk arises when stale inputs, optimistic forecasts or slow recognition of market change make the reported path appear smoother than the underlying economics.
Valuation quality should be scored across evidence recency, observability, model sensitivity, independence and back-testing. A recent arm's-length transaction offers different evidence from a model anchored to a prior financing round. A contracted infrastructure asset can support a discounted-cash-flow valuation, yet discount rate, terminal value, operating performance and counterparty assumptions remain material.
Quarterly performance should be reported in realised and unrealised components. The committee should see distributed value, current net asset value, change in the mark, operating contribution, leverage change, multiple change and currency effect. A liquidity premium supported mainly by unrealised multiple expansion warrants a different confidence level from one supported by cash distributions.
Back-testing closes the loop. The institution should compare the last carrying value with the price achieved at sale or refinancing. Persistent positive or negative differences can reveal valuation bias, process delay or conservative policy. Results should be segmented by manager, strategy, country, asset type and market regime.
The valuation reserve used in the liquidity-premium bridge is a governance device rather than an accounting adjustment. It prevents the allocation paper from treating modelled value as equivalent to cash. The reserve can reduce as evidence becomes more observable and distributions are realised.
11. Liquidity budget and stress coverage
An institution earns a liquidity premium only if it can remain invested through stress. The portfolio therefore needs a liquidity budget. The budget should combine cash, saleable public assets, committed facilities, expected inflows, expected distributions, capital calls, collateral needs and operating obligations. Haircuts and timing assumptions should be pre-approved.
Unfunded commitments are contingent claims on liquidity. Calls can accelerate when investment opportunities rise or subscription facilities mature. Distributions can slow when exit markets weaken. These events can occur together. The stress should therefore combine higher calls, lower distributions, lower public-asset proceeds and wider currency or collateral needs.
Consider a hypothetical institution with USD 35 million of cash and USD 65 million of expected twelve-month private distributions against USD 60 million of expected calls. Baseline coverage is 1.67 times. A stress with distributions reduced by half and calls increased by 20 percent produces USD 67.5 million of sources against USD 72 million of calls, or 0.94 times coverage. The institution would need additional liquid assets, a facility or reduced commitments.
This example shows why a strategy-level return can look attractive while the total-portfolio decision remains weak. A forced secondary sale can crystallise the very discount the institution expected to earn as a patient buyer. Liquidity budgeting protects the ability to hold the asset and makes the assumed premium attainable.
The policy should define a minimum stressed coverage ratio, maximum unfunded commitments, concentration by expected call year and escalation triggers. Facilities can support timing and should not substitute for solvency or recurring operating cash. The dashboard should show facility capacity, covenants, maturity and collateral.
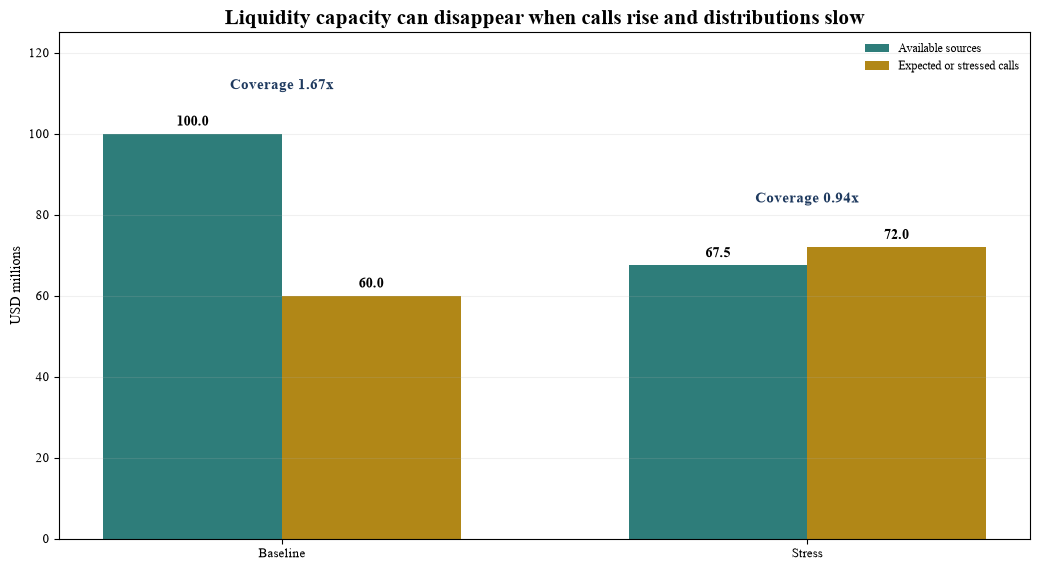
USD millions. Baseline and stress figures are illustrative and do not represent a client portfolio.
12. Decision scorecard and implementation roadmap
The allocation paper should state the expected net compensation, the evidence supporting it and the liquidity conditions required to earn it. A decision scorecard can use six gates: data integrity, benchmark integrity, net cash-flow performance, risk and valuation quality, exit capacity and portfolio coverage. A failed gate triggers remediation, a smaller allocation or rejection.
The committee should approve a required liquidity compensation by strategy. The threshold can reflect the liquid alternative, complexity, governance resource, concentration and liability profile. A private-credit threshold can differ from a venture, infrastructure or real-estate threshold. The policy should also specify a confidence band because private-market evidence is rarely precise.
Measurement continues after commitment. Quarterly reporting should show IRR, TVPI, DPI, PME, direct alpha, realised versus unrealised value, benchmark performance, valuation quality, exit evidence, unfunded commitments and stressed coverage. Vintage and manager attribution should be preserved. Results should be re-underwritten when the benchmark, strategy, legal terms, leverage or liquidity capacity changes materially.
A 100-day implementation can be practical. During days 1 to 20, reconcile the exposure universe and approve definitions. During days 21 to 45, rebuild cash flows and map benchmarks. During days 46 to 70, calculate metrics, score valuations and collect exit evidence. During days 71 to 90, build the liquidity stress and decision bridge. During days 91 to 100, obtain committee approval, assign owners and set the review calendar.
The process requires clear accountability. Investment teams own underwriting and manager evidence. Finance or operations owns ledger reconciliation. Risk owns challenge, benchmark consistency and stress. Legal owns transfer and liquidity terms. The investment committee owns thresholds, exceptions and capital allocation.
Table 6. Institutional decision scorecard
| Gate | Required evidence | Pass condition | Escalation trigger |
|---|---|---|---|
| Data integrity | Reconciled cash flows, fees, carry and residual value | Ledger and manager record agree or differences are explained | Unreconciled balance or missing cost |
| Benchmark integrity | Replicable, economic and risk-matched liquid alternative | Benchmark approved before outcome review | Post-hoc benchmark change |
| Net compensation | PME, direct alpha and investor-policy equivalent | Expected and realised range clears hurdle | Compensation below threshold |
| Risk and valuation | Leverage, concentration, valuation score and back-test | Material risks and reserves are explicit | Stale marks or unsupported assumptions |
| Exit capacity | Transfer terms, timing, discount and costs | Executable or governed range is documented | No credible route or severe discount |
| Portfolio liquidity | Calls, distributions, reserves and facilities under stress | Stressed coverage exceeds policy minimum | Coverage breach or concentrated call year |
Thresholds should be calibrated to the institution's mandate and approved before commitment.
13. Limitations
The framework does not estimate a single GCC liquidity premium. Public data do not provide a complete, unbiased cash-flow history for every private strategy, manager and vintage in the region. Private transactions can be confidential. Secondary indications can be sparse. Benchmark replication can remain imperfect.
The worked calculations use annual cash flows, an 8 percent benchmark and a 6.5-year effective horizon. Exact dated cash flows would produce different results. The governance reserves are illustrative management assumptions created to demonstrate a decision bridge. They are not empirical estimates.
Exchange-level trading and market-capitalisation data describe market scale and participation. They do not establish security-level liquidity, price impact or a comparison across exchanges with different reporting periods and market structures. Production analysis requires security-level evidence and consistent periods.
PME, direct alpha and investor-portfolio equivalents depend on benchmark selection and risk assumptions. Valuation adjustment and secondary-exit ranges require judgement. The framework should therefore present ranges, sources and sensitivity rather than a false point estimate.
14. Conclusion
The GCC liquidity premium is a measurement problem and a portfolio-governance problem. A headline return cannot show what an institution earned for surrendering liquidity. The answer requires timed net cash flows, a replicable liquid alternative, risk and valuation review, an exit test and a total-portfolio liquidity budget.
The worked example shows the progression. A 11.96 percent internal rate of return becomes a 1.26 public market equivalent and an approximate 3.5 percent annual direct alpha against the hypothetical benchmark. Illustrative reserves reduce the decision-useful compensation to 1.8 percent. The final figure belongs to the assumptions, benchmark and investor in the example.
Institutional discipline turns the concept into policy. Approve the benchmark and hurdle before commitment. Reconcile the ledger. Separate realised and unrealised value. Test a secondary exit. Maintain stressed capital-call coverage. Track outcomes by strategy, manager and vintage.
An institution that can hold through stress may capture value from patient capital. The ability to hold is a measurable portfolio resource. The premium should be approved, monitored and earned with evidence.
References
- Bank for International Settlements, The Rise of Private Markets, BIS Quarterly Review, December 2021. https://www.bis.org/publ/qtrpdf/r_qt2112e.htm
- International Monetary Fund, Global Financial Stability Report, Chapter 2: The Rise and Risks of Private Credit, April 2024. https://www.imf.org/-/media/files/publications/gfsr/2024/april/english/ch2.pdf
- International Monetary Fund, The Managing Director's Remarks at GCC Ministerial Meeting, 2 October 2025. https://www.imf.org/en/news/articles/2025/10/02/sp100225-md-opening-remarks-gcc-ministerial-meeting
- Josh Lerner and Antoinette Schoar, The Illiquidity Puzzle: Theory and Evidence from Private Equity, NBER Working Paper 9146, 2002. https://www.nber.org/papers/w9146
- Taylor D. Nadauld, Berk A. Sensoy, Keith Vorkink and Michael S. Weisbach, The Liquidity Cost of Private Equity Investments: Evidence from Secondary Market Transactions, NBER Working Paper 22404, 2016. https://www.nber.org/papers/w22404
- Dimitri Vayanos, Flight to Quality, Flight to Liquidity, and the Pricing of Risk, NBER Working Paper 10327, 2004. https://www.nber.org/papers/w10327
- MSCI, Index Methodology resources, including Free Float and Liquidity Data Methodologies, accessed August 2026. https://www.msci.com/indexes/index-resources/index-methodology
- Saudi Exchange, Annual Statistical Report 2025, 1 January 2026. https://www.saudiexchange.sa/wps/portal/saudiexchange/newsandreports/issuer-news/news-details/%21ut/p/z1/tZJPc4IwEMU_Sw89MllAIB6x06IOVFFB4eKEEG1aCIipdvrpG7WH6vin05nmtC_z3uxufkEpmqFUkA1fEskrQQqlk9SeW64NRhfDwJv4OoSx4-M4nOjQa6EYpSgtKkoKhhLS7FRNeY6SxYK2wXKoluWYaa12bmhZRi0NY8s0clhQYpk7NxWyli8okSQn2_dizsQ9rIn2Lfd13XDK1kTkXORMVftLwbaHoiTNG5MHSeUPqRlg2KCDXvIKTY8XwYFnQ_jshgPDscCLAaXX9zzJw3hoQfg0DEwfRuCB_bs8XDjuzf6JyjsXDa5qsOFsiyJRNaXiNt497fQhmIfR40hl_0yoC6h_azb1SfjrapW6imYlJPuQaPbvONPjqQZu21FA-h2v57smtp1Twxnix4YzSPeGK8zGTKC6LLFZalE0--wELMOBbPf4cHn3BQGYULc%21/?uri=nm%3Aoid%3AZ6_5A602H80O8MG60QNAQO2750GV0
- Abu Dhabi Securities Exchange, ADX Transformative Year and Market Leadership, 6 January 2026. https://www.adx.ae/about-adx/media/adx-news/adx-market-leadership-2025-growth
- Dubai Financial Market, Strong Q1 2026 Performance with Average Daily Trading Value Exceeding AED 1 Billion, 30 April 2026. https://feeds.dfm.ae/documents/2026/Apr/30/95f84609-e2b1-4402-b3a2-cec0e316e795/DFM%20Q1%202026%20PRL%20%20%20English.Pdf.pdf
- Steven Kaplan and Antoinette Schoar, Private Equity Performance: Returns, Persistence and Capital, NBER Working Paper 9807, 2003. https://www.nber.org/papers/w9807
- Arthur Korteweg and Stefan Nagel, Risk-Adjusting the Returns to Venture Capital, NBER Working Paper 19347, 2013. https://www.nber.org/papers/w19347
- Arthur Korteweg, Stavros Panageas and Anand Systla, Private Equity for Pension Plans? Evaluating Private Equity Performance from an Investor's Perspective, NBER Working Paper 33194, 2024. https://www.nber.org/papers/w33194
- Institutional Limited Partners Association, Performance Template Granular Methodology, version 1.1, April 2025. https://ilpa.org/resources-tools/resource-library/ilpa-performance-template-granular-methodology-v-1-1/
- Alexander Ljungqvist and Matthew Richardson, The Cash Flow, Return and Risk Characteristics of Private Equity, NBER Working Paper 9454, 2003. https://www.nber.org/papers/w9454
- European Central Bank, Private Markets, Public Risk? Financial Stability Implications of Alternative Funding Sources, Financial Stability Review, May 2024. https://www.ecb.europa.eu/press/financial-stability-publications/fsr/special/html/ecb.fsrart202405_03~bc23a48dbc.en.html
About the Author
Chennakeshav Adya, Independent Researcher
Chennakeshav Adya writes on private capital, investment governance, corporate finance and transaction execution. This paper is independent research for general information. It is not investment, legal, tax, accounting, valuation or regulatory advice.
Appendix A. Core Formulas: Public market equivalent
For cash-flow dates t, contributions C(t), distributions D(t), residual value NAV(T) and benchmark accumulation factor I(T)/I(t):
KS-PME = [sum of D(t) divided by I(t), plus NAV(T) divided by I(T)] / [sum of C(t) divided by I(t)]
A value above 1.00 indicates that benchmark-discounted distributions and residual value exceed benchmark-discounted contributions. The result depends on the selected benchmark and treatment of dates, currency, tax and residual value.
Direct alpha
Direct alpha applies the public benchmark accumulation factor to each private cash flow and calculates an internal rate of return on the benchmark-adjusted series. The exact implementation should be documented and reproduced independently.
Liquidity coverage
Twelve-month liquidity coverage = stressed available cash and liquid proceeds, plus stressed inflows and distributions, divided by stressed capital calls, collateral and operating obligations.
Appendix B. Investment Committee Questions: Questions before committing capital
1. Which liquid exposure would the institution buy if this private strategy were unavailable? 2. Is the benchmark replicable on every expected cash-flow date and in the institution's reporting currency? 3. Which part of expected return compensates credit, market, leverage, complexity, skill and illiquidity? 4. How much of the case depends on unrealised value or multiple expansion? 5. What is the estimated transfer price and time to exit under normal and stressed conditions? 6. Which legal provisions can delay, restrict or price an exit? 7. What cash must be reserved for calls, fees, hedging, collateral and operating obligations? 8. Does stressed coverage remain above policy minimum when calls accelerate and distributions fall? 9. Which team owns cash-flow reconciliation, benchmark governance, valuation challenge and transfer analysis? 10. Which event triggers re-underwriting, allocation reduction or secondary sale preparation?
