

1. Introduction
An institutional allocation requires more than an attractive opportunity set. The investment committee needs a defensible answer to five questions: what belongs in the market, how performance is measured, which risks are being accepted, whether the evidence is reliable and how the allocation can be implemented. In mature public markets, established indices, continuous prices and standardised disclosures support those questions. Private markets require a different architecture because assets are not continuously traded, cash flows occur at irregular intervals, valuations are model-dependent and portfolio outcomes remain sensitive to manager selection, vintage and exit conditions.
The Gulf Cooperation Council adds a second layer of complexity. The region contains six national markets, multiple financial centres, different legal and regulatory regimes, substantial public and family ownership, rapidly expanding private-capital ecosystems and sectors whose economics are closely connected to government policy, infrastructure programmes and energy markets. A global private-market benchmark can provide context while failing to explain whether a GCC allocation is investable for a particular institution.
The term investability gap describes the distance between an opportunity that appears economically attractive and an exposure that can pass institutional governance. The gap can arise from missing cash-flow history, inconsistent valuation, a short realised track record, concentration, limited exit evidence, uncertain legal structure, reporting weakness, liquidity burden or incomplete operating controls. The gap belongs in the benchmark because those conditions affect the decision, monitoring cost and confidence attached to reported performance.
Current regional development makes the question timely. DIFC reported more than 440 wealth and asset-management firms in its ecosystem in October 2025 and described growing strategic importance for private equity, private credit, real estate, infrastructure, hedge funds and digital assets.[1] The IMF stated in October 2025 that deeper GCC markets would benefit from a broader institutional investor base, stronger infrastructure and the removal of structural impediments including low liquidity.[2] The OECD's 2026 UAE investment-policy review documents substantial foreign-investment growth while also identifying variation in regulation and implementation across jurisdictions.[3] These sources describe a market that is expanding while its institutional information architecture continues to develop.
This paper proposes an allocator-led benchmark architecture. It begins with established global standards and adds transparent GCC classifications, evidence diagnostics and implementation measures. It does not manufacture a historical market return where complete data do not exist. It defines the information, controls and governance required to produce decision-useful comparisons now and a credible regional benchmark over time.
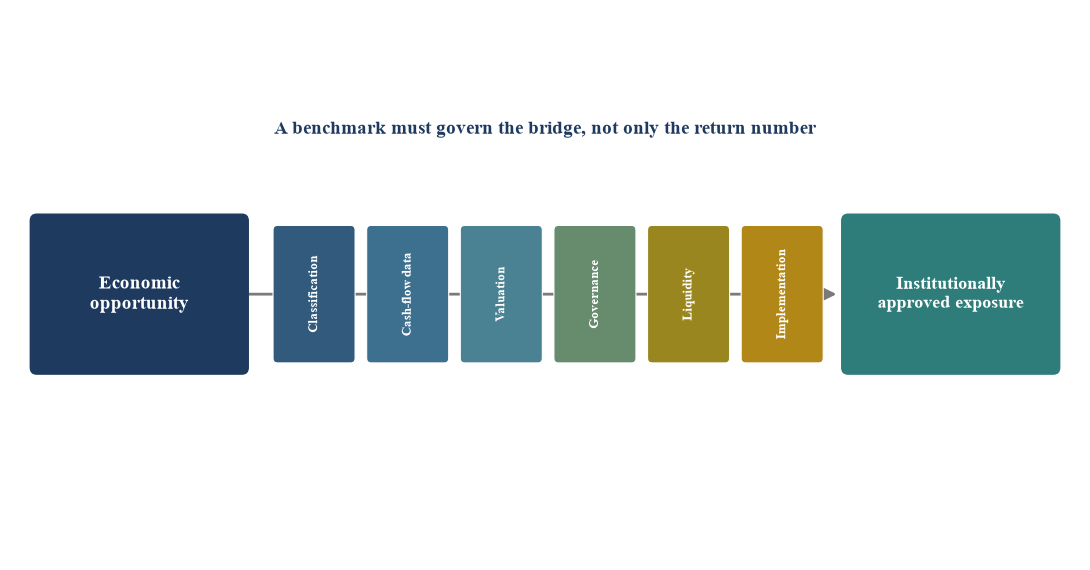
Author framework. The bridge dimensions are diagnostic categories; they do not represent measured market scores.
2. What a benchmark must accomplish
A benchmark can serve several purposes, and design begins by naming the purpose. An allocator may need a policy reference for strategic asset allocation, a peer comparison for manager selection, a performance yardstick, a denominator for incentive assessment, a pacing input or an early-warning diagnostic. One measure cannot perform every role without loss of meaning. A policy benchmark should be stable and investable enough to guide allocation. A peer universe should be sufficiently granular to compare similar strategies. A performance benchmark needs consistent cash-flow and valuation rules. A risk diagnostic needs measures that explain concentration, liquidity and evidence confidence.
IOSCO's Principles for Financial Benchmarks provide an organising foundation. The principles address governance, benchmark quality, methodology, accountability, conflicts, data sufficiency, transparency, review and cessation.[4] They were written for financial benchmarks generally, and their logic is directly relevant to a private-market architecture. The administrator should define what is measured, why the input data are sufficient, how discretion is controlled, how errors are handled and how users are informed when a methodology changes.
The proposed architecture separates four layers. The first layer defines the eligible universe and its taxonomy. The second measures cash-flow and valuation performance. The third measures investability conditions that influence confidence, cost and implementation. The fourth governs publication, revisions and use. Users can view each layer separately and combine them for a stated decision.
Table 1. Benchmark purposes and design consequences
| Decision purpose | Required comparison | Minimum data | Principal limitation |
|---|---|---|---|
| Strategic allocation | GCC exposure versus policy alternatives | Long horizon, net cash flows, risk and liquidity | Short regional histories can create unstable conclusions |
| Manager selection | Like-for-like strategy and vintage peers | Fund terms, cash flows, valuation and portfolio detail | Selection and survivorship bias can distort peer sets |
| Performance review | Fund and portfolio results versus public and private references | Dated contributions, distributions and residual value | Interim valuations are not realised outcomes |
| Pacing and liquidity | Commitments, calls, distributions and NAV evolution | Cash-flow timing, unfunded commitments and scenarios | Market dislocation can break historical pacing patterns |
| Governance diagnostic | Reporting, valuation, controls and decision rights | Policies, verification and exceptions | Evidence quality requires judgement and documentation |
| Market development | Participation, sectors, exits and institutional readiness | Consistent contributor and transaction data | Coverage can change as the ecosystem expands |
A benchmark administrator should publish the intended uses and warn against uses that the available evidence cannot support.
The benchmark should avoid two common errors. The first is false precision: producing a point estimate whose confidence is much weaker than its presentation implies. The second is conceptual mixing: adjusting reported returns for governance, liquidity or country risk until users cannot distinguish observed cash flows from analyst judgement. A better design publishes return measures and investability diagnostics alongside each other. The investment committee can then apply its own policy weights and thresholds.
3. Universe, taxonomy and inclusion rules
The benchmark universe should be defined by exposure rather than marketing label. A fund domiciled in the region may invest globally. A fund domiciled elsewhere may have predominantly GCC assets. A portfolio company can earn revenue across several countries while holding critical licences, assets or contracts in one jurisdiction. The administrator therefore needs a documented exposure test.
A practical starting rule classifies an investment as GCC-focused when a stated majority of invested capital, portfolio enterprise value, revenue, operating assets or contractual cash-flow exposure falls within GCC countries. The administrator should choose the relevant test for each strategy and publish it. Private credit may be classified by obligor and collateral exposure. Infrastructure may require asset location, concession jurisdiction and offtaker exposure. Real estate may use asset location. Buyout and growth investments may use operating revenue, enterprise value and headquarters together. Venture capital may require separate reporting for legal domicile, operating base and end-market exposure.
The taxonomy should then segment strategy, geography, vintage, size, stage, sector, currency, structure and realisation status. Strategy categories should be economically meaningful: buyout, growth, venture, private credit, special situations, infrastructure and real estate should remain separate until data support more detailed subgroups. A pooled all-private-markets number can be published as a broad market indicator while institutional decisions usually require the underlying segments.
Inclusion rules need a reporting lag and a minimum information set. Eligible observations should include dated contributions and distributions, period-end residual value, fees or a clear gross-versus-net designation, strategy and vintage, currency, valuation date and an evidence-quality record. An observation with missing inputs can remain in a coverage register while being excluded from calculations that require those inputs. Exclusion reasons should be counted and disclosed so users can see whether the published benchmark represents the intended market.
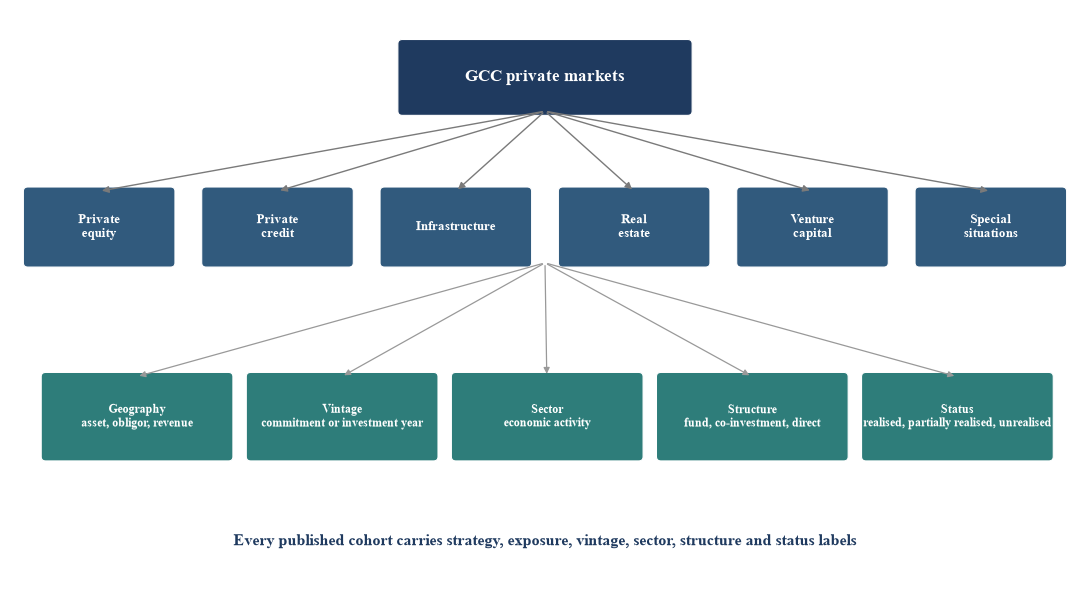
Author framework. Subcategories should be published only when contributor coverage protects both statistical usefulness and confidentiality.
4. Performance measures that can coexist
Private-market performance needs several measures because each answers a different question. Internal rate of return incorporates timing and expresses an annualised discount rate, yet it can be sensitive to early cash flows and reinvestment assumptions. Total value to paid-in capital measures distributions plus residual value relative to paid-in capital, while distributed value to paid-in capital isolates realised proceeds and residual value to paid-in capital isolates the remaining valuation. These multiples are intuitive while omitting the time value of money.
The Kaplan-Schoar public market equivalent compares private-market cash flows with equivalently timed investments in a selected public index.[5] A value above one indicates that the private investment produced more terminal value than the public-market alternative under the method. The result depends on the chosen index, currency treatment, timing and whether reported cash flows are gross or net. Direct alpha translates a public-market-relative cash-flow comparison into an annualised measure.[6] It can improve portfolio-level interpretation while retaining dependence on the selected public reference.
The Global Investment Performance Standards provide an ethical framework centred on fair representation and full disclosure.[7] The 2020 standards expanded their relevance to asset owners, pooled funds and alternative strategies. CFA Institute's 2025 asset-owner survey found that 41 percent of respondents either required or asked about GIPS compliance when selecting managers for illiquid asset classes.[8] That result supports an institutional benchmark that records reporting discipline as part of the evidence environment.
ILPA's 2025 Performance Template standardises fund and portfolio performance metrics and corresponding cash flows. ILPA states that it should be used on a go-forward basis for funds commencing operations on or after 1 January 2026.[9] A GCC benchmark can align its input schema with that template, reducing duplicate reporting requests and allowing regional analysis to connect with global limited-partner workflows.
Table 2. Core performance measures and their decision use
| Measure | Simplified definition | Primary use | Key caution |
|---|---|---|---|
| IRR | Discount rate that sets cash-flow net present value to zero | Timing-sensitive fund return | Can be affected by early distributions and financing |
| TVPI | Distributions plus residual value divided by paid-in capital | Total value multiple | Includes unrealised valuation and ignores duration |
| DPI | Distributions divided by paid-in capital | Realised cash return | Young funds can look weak before harvesting |
| RVPI | Residual value divided by paid-in capital | Remaining value | Depends on valuation quality and exit feasibility |
| PME | Private cash flows compared with a public-index alternative | Opportunity-cost comparison | Depends on index, timing, currency and method |
| Direct alpha | Annualised public-market-relative cash-flow return | Portfolio optimisation and relative return | Requires complete cash flows and a defensible index |
No measure is sufficient by itself. Reported figures should identify currency, fees, valuation date, methodology and data coverage.
The benchmark should publish net-of-fee measures whenever the decision concerns the limited partner's outcome. Gross results can support portfolio-company or strategy analysis if clearly separated. Subscription credit facilities and other financing can alter the timing of capital calls and therefore reported IRR. The administrator should require a financing disclosure and, when data permit, show performance with and without the facility effect.
Currency treatment must also be explicit. GCC currencies have different exchange-rate arrangements, and many private-market transactions use US dollars. A global institution may evaluate returns in US dollars, euros, sterling or another base currency. The benchmark should retain local-currency cash flows, identify transaction currency and publish conversion methodology. It should avoid treating a currency peg as equivalent to the absence of currency, convertibility or policy risk.
5. Valuation and data-quality governance
Interim private-market performance depends on residual value. A benchmark that accepts valuations without governing their basis can amplify reporting differences between managers. The 2025 IPEV Valuation Guidelines describe best practice for fair-value measurement across private equity, venture capital, infrastructure, credit and related private-capital investments. The guidelines are effective for quarterly reporting periods beginning on or after 1 April 2026 and supersede the 2022 edition.[10]
The benchmark should require each residual value to carry a valuation date, methodology, principal inputs, currency, last transaction date, external review status and material-event assessment. It should record whether the valuation uses market multiples, discounted cash flow, recent transaction price, asset value, scenario analysis or another method. Method changes should be explained. Stale valuations should remain visible through an ageing indicator rather than being silently treated as current.
Data quality should be assessed at observation level. A fund can have complete audited annual data and preliminary quarterly estimates. A direct investment can have detailed operating data and limited market comparables. The benchmark should preserve that distinction. It can publish coverage ratios, the share of NAV based on preliminary estimates, the age of valuations and the portion of cash flows independently reconciled.
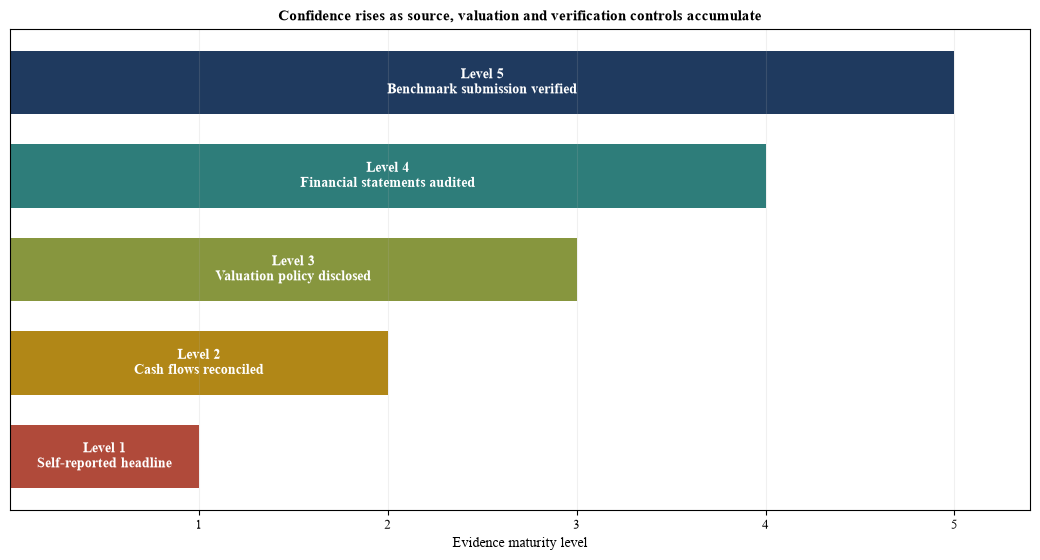
Author framework. A higher evidence level strengthens confidence in the observation; it does not certify future performance.
Table 3. Minimum valuation and data controls
| Control | Required record | Publication treatment | Governance response |
|---|---|---|---|
| Source provenance | Contributor, system, date and responsible officer | Coverage disclosure | Reject anonymous or untraceable inputs |
| Cash-flow reconciliation | Contributions, distributions, fees and dates | Reconciliation ratio | Resolve breaks before performance calculation |
| Valuation basis | Method, inputs, date and currency | Method distribution | Review changes and stale observations |
| Financial review | Audit or assurance status | Assurance coverage | Flag preliminary and unaudited periods |
| Material events | Post-valuation changes and known exits | Event note | Update or explain the reporting lag |
| Revision history | Original value, revised value, reason and approval | Revision statistics | Publish material corrections |
| Contributor conflicts | Ownership and commercial relationships | Conflict statement | Apply recusal and independent review |
The administrator can impose stricter controls for publication cohorts that are used for compensation or formal policy benchmarking.
6. The investability scorecard
Performance tells an institution what the reported portfolio produced. Investability tells it whether the exposure can be approved, implemented, monitored and exited within policy. The scorecard proposed here contains six dimensions: data and valuation, governance and reporting, legal and structural clarity, liquidity and exit evidence, portfolio concentration, and implementation capacity.
Each dimension should be scored from documented criteria. A score of one indicates that essential evidence is missing. A score of two indicates partial evidence with material unresolved gaps. A score of three indicates an institutionally usable baseline with disclosed limitations. A score of four indicates strong controls and recurring evidence. A score of five indicates independently tested, consistently applied practice with clear exception management. The score is a diagnostic, not a credit rating or forecast.
The scorecard should preserve raw dimension scores. A weighted composite can be calculated for a named institution after its policy weights are approved. A pension fund, insurer and family office can assign different importance to liquidity, reporting, legal structure and concentration. The benchmark administrator should not disguise those policy choices as universal market facts.
Table 4. GCC private-market investability scorecard
| Dimension | Evidence considered | Weak condition | Strong condition |
|---|---|---|---|
| Data and valuation | Cash flows, valuation method, audit, ageing | Headline return with limited source detail | Reconciled cash flows and governed fair-value process |
| Governance and reporting | Decision rights, conflicts, frequency, exceptions | Informal reporting and unclear accountability | Defined oversight, recurring reports and exception log |
| Legal and structural clarity | Jurisdiction, ownership, control, enforceability | Unresolved structure or key rights | Documented structure and qualified advice |
| Liquidity and exit evidence | Realisations, transfer rights, market depth, duration | Exit thesis depends on untested assumptions | Multiple executable routes and observed realisations |
| Concentration and resilience | Asset, sector, customer, sponsor and country exposures | One risk dominates portfolio outcome | Limits, scenarios and funded mitigation |
| Implementation capacity | Access, diligence, custody, tax, operations and monitoring | Allocation cannot be executed or monitored reliably | Named operating model and tested controls |
Criteria are illustrative. Institutions should approve weights and minimum thresholds before reviewing named opportunities.
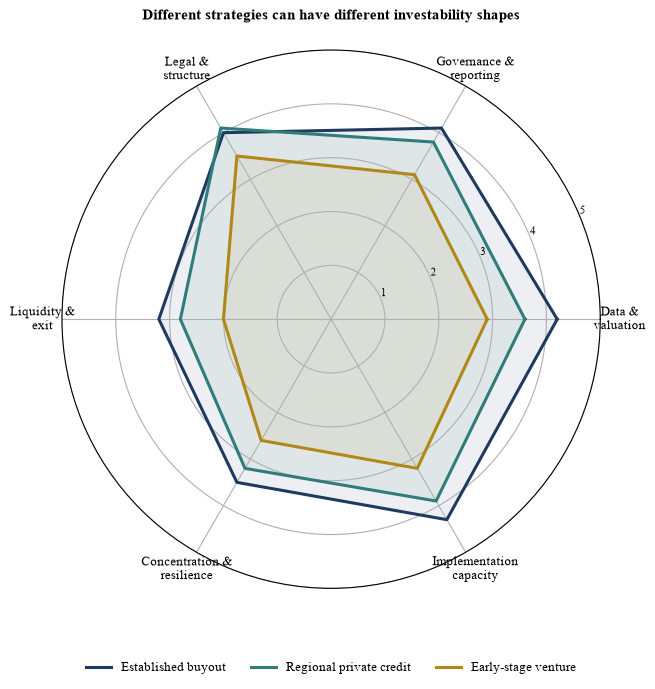
Hypothetical scores only. The chart demonstrates diagnostic shape; it does not represent a fund, client or market estimate.
7. Regional risk without opaque return adjustments
Regional relevance matters, yet it should enter transparently. The OECD identifies the UAE's strong foreign-investment performance and also notes that decentralised implementation can create variation in licensing, administration and regulatory access across Emirates.[3] The IMF highlights GCC market-depth, liquidity and infrastructure challenges alongside diversification progress.[2] These conditions should inform segmentation, scenarios and investability diagnostics.
The benchmark can publish exposure attributes for jurisdiction, sector, currency, government-related counterparties, offtakers, customers, sponsors and exit routes. It can also publish scenario measures such as a delayed-exit case, valuation-multiple compression, higher funding cost, lower distribution pace and key-counterparty stress. Each scenario should show its assumptions rather than converting them into a hidden country-risk deduction.
Country and jurisdiction classifications should remain sufficiently granular. A GCC aggregate can support regional allocation while national and financial-centre differences affect legal structure, tax, insolvency, licensing, custody and exit. An investment spanning several jurisdictions should disclose the location of assets, obligors, holding entities and cash flows.
Sector concentration also needs attention. Infrastructure, real estate, financial services, energy, logistics and technology can respond differently to rates, government spending, commodity cycles and regulation. An institution may deliberately seek those exposures. The benchmark's role is to show the concentration and its performance contribution, leaving the policy judgement to the asset owner.
8. An illustrative allocator portfolio
Consider a hypothetical institution evaluating a USD 300 million GCC private-market programme over five years. The proposed allocation includes established buyout funds, regional private credit, digital infrastructure, real estate co-investments and venture capital. The figures below demonstrate the framework and do not describe a client, manager, transaction or forecast.
The committee first sets policy weights. Net performance and PME receive 30 percent of the evaluation, evidence quality receives 20 percent, liquidity and exit receive 20 percent, governance and structure receive 20 percent, and implementation capacity receives 10 percent. The committee also sets minimum conditions: no exposure below an evidence score of three, no unresolved legal red flag and no strategy whose downside liquidity need exceeds the programme's reserve.
The buyout allocation has the strongest evidence and implementation scores, while its expected access is constrained. Private credit offers contracted cash flows and stronger current income, while concentration, enforcement and refinancing require transaction-level review. Digital infrastructure has a long-duration opportunity set and significant power, construction, technology and offtake dependencies. Real estate co-investments offer asset visibility while increasing concentration and governance demands. Venture capital offers option value with the weakest realised history and longest uncertainty around exits.
Table 5. Hypothetical portfolio decision dashboard
| Strategy | Proposed commitment | Evidence score | Liquidity and exit score | Implementation score | Committee disposition |
|---|---|---|---|---|---|
| Established buyout | USD 90m | 4.2 | 3.2 | 4.3 | Proceed to manager diligence |
| Regional private credit | USD 75m | 3.6 | 2.8 | 3.9 | Proceed with concentration limits |
| Digital infrastructure | USD 60m | 3.4 | 2.7 | 3.5 | Phase after technical diligence |
| Real estate co-investment | USD 45m | 3.3 | 2.9 | 3.6 | Approve transaction by transaction |
| Venture capital | USD 30m | 2.9 | 2.0 | 3.2 | Build watchlist; evidence threshold unmet |
All figures are illustrative assumptions. Expected values are not market observations and should not be used for an investment decision.
The benchmark changes the conversation. Venture capital is not rejected because its headline return is low; the hypothetical programme holds because the evidence threshold is unmet. Digital infrastructure is not approved solely because the regional investment thesis is strong; technical dependencies and exit conditions shape pacing. Private credit is not treated as a uniform yield sleeve; obligor and collateral concentration determine the size of the exposure.
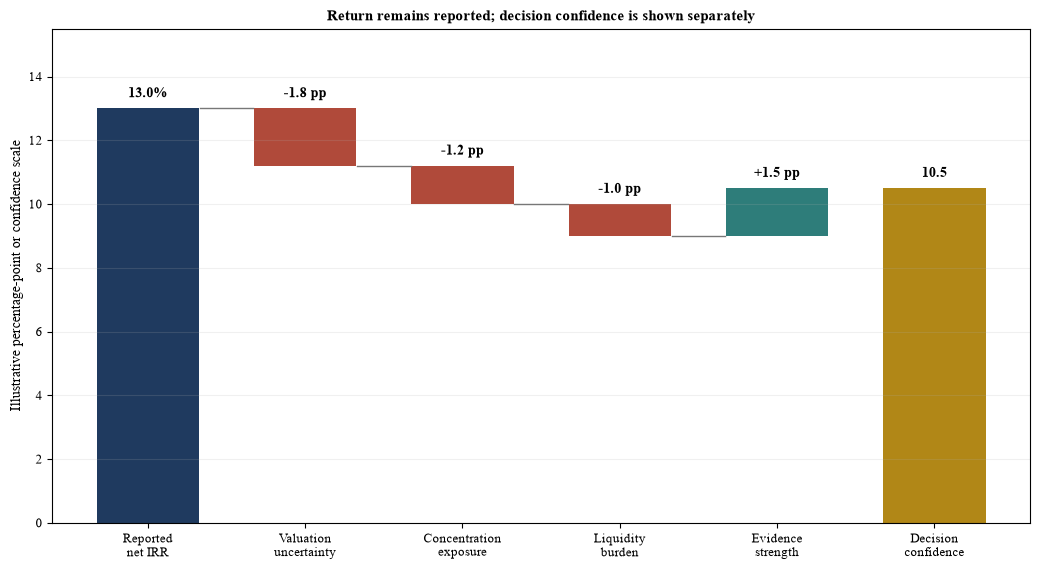
Illustrative management model. Percentage points and confidence deductions are invented solely to demonstrate presentation architecture.
9. Governance of the benchmark
A benchmark earns institutional use through governance. The administrator should publish its mandate, ownership, committees, conflicts policy, methodology, contributor agreement, data controls, calculation calendar, revision policy and complaint process. Material methodological changes should follow consultation and provide historical impact analysis when feasible.
An oversight committee should include allocator, manager, valuation, data, risk and regional-market expertise. Members should disclose interests and recuse themselves where necessary. A methodology committee should review classifications, calculation rules, coverage and model changes. A data-control function should reconcile submissions, investigate outliers and maintain the revision log. Independent assurance can be introduced as the dataset and intended use mature.
Confidentiality requires deliberate design. Private-market contributors will not supply transaction-level data if publication can reveal a fund or portfolio company. Aggregation thresholds, cohort minimums, publication lags, access controls and contributor agreements should protect confidential information. Small cohorts should be suppressed or combined according to published rules.
The benchmark should also have a cessation and transition plan. If a cohort loses sufficient coverage, publication can be suspended with an explanation. Historical series should remain accessible with version labels. Users should receive enough notice to change policy references or incentive arrangements.
Table 6. Benchmark governance calendar
| Frequency | Governance activity | Output | Accountable body |
|---|---|---|---|
| Quarterly | Data reconciliation, outlier review and cohort test | Controlled calculation file and exception log | Data-control function |
| Quarterly | Valuation-ageing and material-event review | Evidence and revision report | Valuation panel |
| Semi-annual | Taxonomy, methodology and coverage assessment | Methodology note | Methodology committee |
| Annual | Conflict declarations and policy review | Governance statement | Oversight committee |
| Annual | Contributor and user consultation | Consultation response | Administrator |
| Event-driven | Error, methodology or market-structure change | Correction or transition notice | Administrator and oversight chair |
The timetable is a proposed operating model. Publication frequency should reflect data availability and contributor capacity.
10. A staged implementation roadmap
The architecture should mature in stages because data coverage cannot be assumed. Stage one is an internal allocator diagnostic. The institution maps existing and proposed exposures, standardises cash-flow records, applies the taxonomy and scores evidence. This stage can improve decisions without claiming to represent the regional market.
Stage two is a contributor consortium. Participating asset owners, managers, administrators and advisers agree a common data dictionary, confidentiality rules and calculation methods. The consortium runs private parallel calculations and resolves classification and reconciliation issues. Coverage, missing-data and revision statistics are measured before publication.
Stage three is a controlled pilot. The administrator publishes broad cohorts with sufficient participation, methodology and limitations. It can begin with cash-flow and coverage statistics, then add performance series when the history and controls support them. Every published number carries an as-of date, currency, fee basis, cohort definition and coverage measure.
Stage four is an independently governed benchmark. Oversight, assurance, methodology consultation, contributor controls and transition procedures operate on a recurring calendar. Asset owners can decide whether the series is suitable for policy, manager evaluation or another stated use. Suitability remains a fiduciary and governance decision for the user.
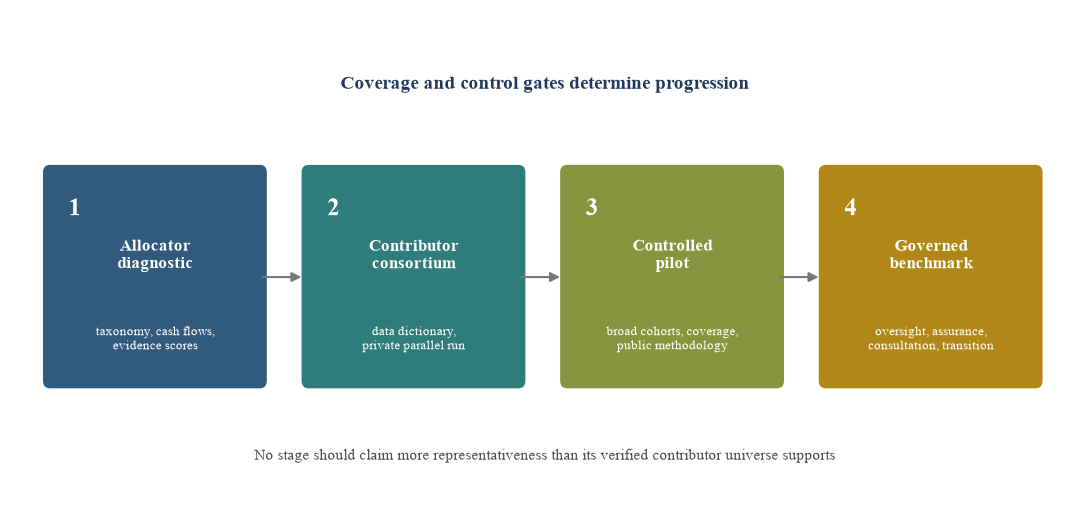
Author framework. Progress depends on contributor coverage, data rights, verification, governance and sustained operating resources.
11. Implications for asset owners, managers and market builders
Asset owners can use the framework before a regional index exists. They can request dated cash flows, separate gross and net results, test PME against an approved public reference, record valuation methods and map investability conditions. They can compare managers on a common evidence basis while preserving strategy and vintage differences. The output supports investment-committee challenge and identifies the work required before commitment.
Managers can reduce the investability gap by aligning reporting with widely used templates, maintaining a governed valuation process, disclosing financing effects, reconciling cash flows and explaining the bridge from operating performance to residual value. A manager with a short history cannot create mature realised data. It can strengthen the quality, consistency and transparency of the evidence it controls.
Regulators, financial centres and industry bodies can support common classifications, digital reporting standards, secure contribution mechanisms and consultation. The objective is not to prescribe an investment conclusion. It is to reduce avoidable friction and allow capital providers to distinguish market risk from information weakness.
Advisers can help institutions define policy benchmarks, select relevant public references, build the data dictionary, review implementation and translate findings into allocation and manager actions. Their role should preserve the accountability of the asset owner, administrator, valuation specialists and regulated professionals.
12. Limitations and research agenda
The framework is a design proposal. It does not contain a representative database of GCC private-market cash flows, and it does not estimate regional historical returns. The illustrative scores, portfolio, weights and bridge values were created to demonstrate presentation and governance. They should not be interpreted as market evidence.
Private-market datasets can suffer from self-selection, survivorship, backfill and appraisal bias. Coverage can favour larger managers or particular jurisdictions. Currency, valuation timing, fund structures and subscription facilities can reduce comparability. Public-market equivalents remain sensitive to the chosen index and do not remove every risk difference between public and private assets.
Future research should test the taxonomy against contributor data; compare exposure tests across strategies; measure valuation dispersion and staleness; examine exit, enforcement and distribution histories; and assess whether investability diagnostics explain allocation decisions, monitoring cost or realised outcomes. Research should also evaluate confidentiality thresholds that preserve useful segmentation.
13. Conclusion
The institutional challenge in GCC private markets is a gap between opportunity and decision infrastructure. Market growth, regulatory development and expanding alternatives ecosystems increase the need for transparent performance and investability evidence. A credible benchmark should show what is observed, what is valued, what is assumed and how the system is governed.
The proposed architecture starts with a stable universe and taxonomy. It combines IRR, value multiples, PME and direct alpha without treating one measure as complete. It applies valuation and data controls informed by IPEV, GIPS and ILPA standards. It publishes liquidity, concentration, governance and implementation diagnostics alongside returns. It uses IOSCO principles to shape administrator governance, methodology transparency, conflicts, accountability and transition.
The first useful product can be an internal allocator diagnostic. A regional public benchmark should emerge only after contributor coverage, historical depth, confidentiality controls and independent governance support the claim. That sequence can convert fragmented evidence into a decision system and help institutions evaluate GCC private markets with greater consistency, transparency and discipline.
References
- Dubai International Financial Centre, “DIFC's Future of Alternative Investments report underscores Dubai as gateway to diversified, high-growth markets for investors,” 9 October 2025. https://www.difc.com/whats-on/news/difcs-future-of-alternative-investments-report-underscores-dubai-as-gateway-to-diversifieds
- International Monetary Fund, “The Managing Director's Remarks at GCC Ministerial Meeting,” 2 October 2025. https://www.imf.org/en/news/articles/2025/10/02/sp100225-md-opening-remarks-gcc-ministerial-meeting
- OECD, Investment Policy Perspectives in the United Arab Emirates, 5 May 2026. https://www.oecd.org/en/publications/investment-policy-perspectives-in-the-united-arab-emirates_d83cbff3-en.html
- International Organization of Securities Commissions, Principles for Financial Benchmarks, July 2013. https://www.iosco.org/library/pubdocs/pdf/IOSCOPD415.pdf
- Steven N. Kaplan and Antoinette Schoar, “Private Equity Performance: Returns, Persistence, and Capital Flows,” Journal of Finance 60, 2005; NBER Working Paper 9807. https://www.nber.org/papers/w9807
- Oleg Gredil, Barry E. Griffiths and Rüdiger Stucke, “Benchmarking Private Equity: The Direct Alpha Method,” Journal of Corporate Finance, 2023. https://papers.ssrn.com/sol3/papers.cfm?abstract_id=4174563
- CFA Institute, Global Investment Performance Standards. https://rpc.cfainstitute.org/gips-standards
- CFA Institute, GIPS Standards Asset Owner Performance Survey Report, 19 May 2025. https://rpc.cfainstitute.org/research/surveys/2025/gips-standards-asset-owner-survey
- Institutional Limited Partners Association, ILPA Performance Template, 4 February 2025. https://ilpa.org/industry-guidance/templates-standards-model-documents/ilpa-templates-hub/ilpa-performance-template/
- International Private Equity and Venture Capital Valuation Board, International Private Equity and Venture Capital Valuation Guidelines, December 2025. https://www.privateequityvaluation.com/Portals/0/Documents/Guidelines/2025%20IPEV%20Valuation%20Guidelines.pdf
- Robert S. Harris, Tim Jenkinson and Steven N. Kaplan, “Private Equity Performance: What Do We Know?” Journal of Finance 69, 2014; NBER Working Paper 17874. https://www.nber.org/papers/w17874
- CFA Institute Research and Policy Center, Private Markets: Governance Issues Rise to the Fore, 2023. https://rpc.cfainstitute.org/sites/default/files/-/media/documents/survey/private-markets-governance-issues-rise-to-the-fore.pdf
About the Author
Chennakeshav Adya, Independent Researcher
Chennakeshav Adya writes on private capital, investment governance, corporate finance and transaction execution. This paper is independent research for general information. It is not investment, legal, tax, accounting, valuation or regulatory advice.
Appendix A. Data Dictionary: Minimum submission fields
- Contributor identifier, reporting entity and responsible officer.
- Fund or investment identifier, strategy, vintage, structure and legal domicile.
- GCC exposure test, countries, sectors, currencies and portfolio status.
- Dated contributions, distributions, fees and recallable amounts.
- Period-end NAV, valuation date, method, currency and assurance status.
- Commitment, unfunded commitment, borrowing and subscription-facility disclosure.
- Gross or net designation and fee treatment.
- Audit, reconciliation, material-event and revision status.
- Exit route, transfer constraints and realised-status information.
- Governance, reporting, legal, liquidity, concentration and implementation evidence.
Appendix B. Investment-Committee Checklist: Questions before adopting a benchmark
1. Which decision will the benchmark support? 2. Does the eligible universe match the institution's intended exposure? 3. Are strategy, vintage, geography, currency and fee basis visible? 4. What percentage of the intended market and portfolio is covered? 5. Are cash flows reconciled and residual valuations governed? 6. Which public index and currency treatment support PME or direct alpha? 7. How are subscription facilities and other financing effects disclosed? 8. Which observations are preliminary, stale, estimated or excluded? 9. How are conflicts, methodology changes, corrections and cessation governed? 10. Can the institution reproduce the calculation and explain it to its oversight body? 11. Do investability dimensions remain separate from reported return? 12. Which professional legal, tax, valuation, accounting or regulatory advice is required?
