

1. Define the acquisition decision
A port acquisition decision combines infrastructure, operating business, concession rights, customer relationships and public obligations. The buyer needs to determine the sustainable volume and earnings of the existing system, the capital required to maintain service, the point at which expansion becomes necessary, and the extent to which operational improvement is achievable under the concession and stakeholder structure.
The diligence question should be framed around usable service capacity. Nominal annual capacity is an engineering or planning figure. Usable capacity depends on the interaction of vessel arrivals, berth windows, crane intensity, yard dwell, gate peaks, rail or road evacuation, equipment availability, labour, weather, customs and customer behaviour. The weakest constrained process can determine the performance of the whole terminal.
The transaction model should link operational findings to price and terms. Evidence may support a lower throughput forecast, an earlier capital programme, a maintenance reserve, a concession condition, contingent consideration, a service-level covenant or an integration plan. The work should also identify upside that can be delivered through defined operating changes, with accountable owners, cost and timing.
The committee should define the decision before requesting data. A control acquisition, minority investment, concession transfer and platform merger require different evidence and governance. A control buyer may underwrite operating changes that require management authority. A minority investor may need reserved matters, information rights and an agreed capital plan before giving value to the same changes. A concession transfer may depend on authority consent and continuity obligations. Defining the decision route early prevents a technically detailed model from answering the wrong commercial question.
| Acquisition decision | Evidence required | Analytical output | Transaction response |
|---|---|---|---|
| Sustainable throughput | Vessel calls, moves, berth hours, yard dwell, gates and hinterland flows | Usable capacity range | Volume case and valuation adjustment |
| Maintainable earnings | Tariffs, contracts, throughput, productivity, cost and maintenance | EBITDA and cash bridge | Multiple, completion accounts and reserve |
| Expansion timing | Demand, bottlenecks, service levels, permits and delivery schedule | Trigger date and capex range | Price, funding plan and conditions |
| Concession value | Rights, term, tariffs, obligations, change control and handback | Risk-adjusted cash-flow period | Indemnity, consent or structure |
| Operational upside | Calibrated intervention scenarios | Probability-adjusted value | Integration plan or contingent value |
Each conclusion should be traceable to observed data, a calibrated model and an identified commercial consequence.
2. Establish the transaction perimeter
The buyer should map the entities, concessions, leases, licences, joint ventures, terminals, marine services, inland depots, equipment companies, information systems and shared services entering the transaction. A port platform can report consolidated results while key assets or obligations sit in separate concession companies, government entities or related parties.
The perimeter should identify ownership and control of quay walls, channels, dredging, breakwaters, cranes, yard land, utilities, gates, rail connections, tug and pilotage services, warehouses and digital infrastructure. The party responsible for a constraint may differ from the entity earning terminal revenue. This distinction affects both valuation and the ability to deliver an operating plan.
Every material contract should be linked to the relevant asset and flow. The list includes concession agreements, terminal-service contracts, shipping-line agreements, leases, equipment maintenance, labour, energy, technology, cyber services and intercompany arrangements. Change-of-control, assignment, data-use, performance, tariff and handback provisions can alter the economic perimeter.
3. Build the port system map
The system map should trace a vessel and cargo unit from approach to departure and onward transport. Marine stages include arrival planning, anchorage, pilotage, tug allocation, channel transit, berth assignment, mooring, cargo operations and departure. Landside stages include yard placement, customs or regulatory release, storage, gate appointment, truck or rail handling and empty-container management.
The map should identify queues, buffers, decision rights and information exchanges. Waiting at anchorage may arise from berth occupancy, tidal windows, labour, equipment, yard space, documentation or a shipping-line schedule change. A single aggregate waiting-time metric cannot establish the underlying cause.
The transaction team should also map service dependencies. An adjacent road, customs process, free-zone warehouse or power connection may sit outside the target's control while determining throughput. The investment case should state which dependencies are contractual, regulated, collaborative or assumed.
4. Define the digital twin
A port digital twin is a governed digital representation of the physical and operating system that connects current and historical data to models of behaviour. It can visualise status, replay events, test scenarios and estimate the consequences of decisions. The Maritime and Port Authority of Singapore describes its maritime digital twin as a shared environment combining real-time and historical data with simulation and modelling tools to test before investment [1].
The diligence twin should match the acquisition decision. A detailed three-dimensional rendering can be visually persuasive while adding little to a capacity or valuation test. A useful model represents the events, resources, rules and constraints that determine vessel time, cargo flow, cost, revenue and capital requirements.
The model should disclose its boundary and fidelity. It may cover the full port, one terminal, selected vessel classes or peak operating windows. It should distinguish observed inputs, derived fields, calibrated parameters, management assumptions and scenario choices. Outputs should carry version, model and data lineage.
Fidelity should increase only where it changes the transaction decision. A call-level discrete-event model may be necessary for berth conflicts and peak arrival patterns. A simpler flow model may be sufficient for annual demand screening. Yard and gate modules may require detailed event data when dwell and evacuation constrain service. The diligence team should record why each module exists, which decision it supports, and which uncertainty remains outside the model. This approach directs time toward material value questions and provides an auditable basis for relying on the outputs.
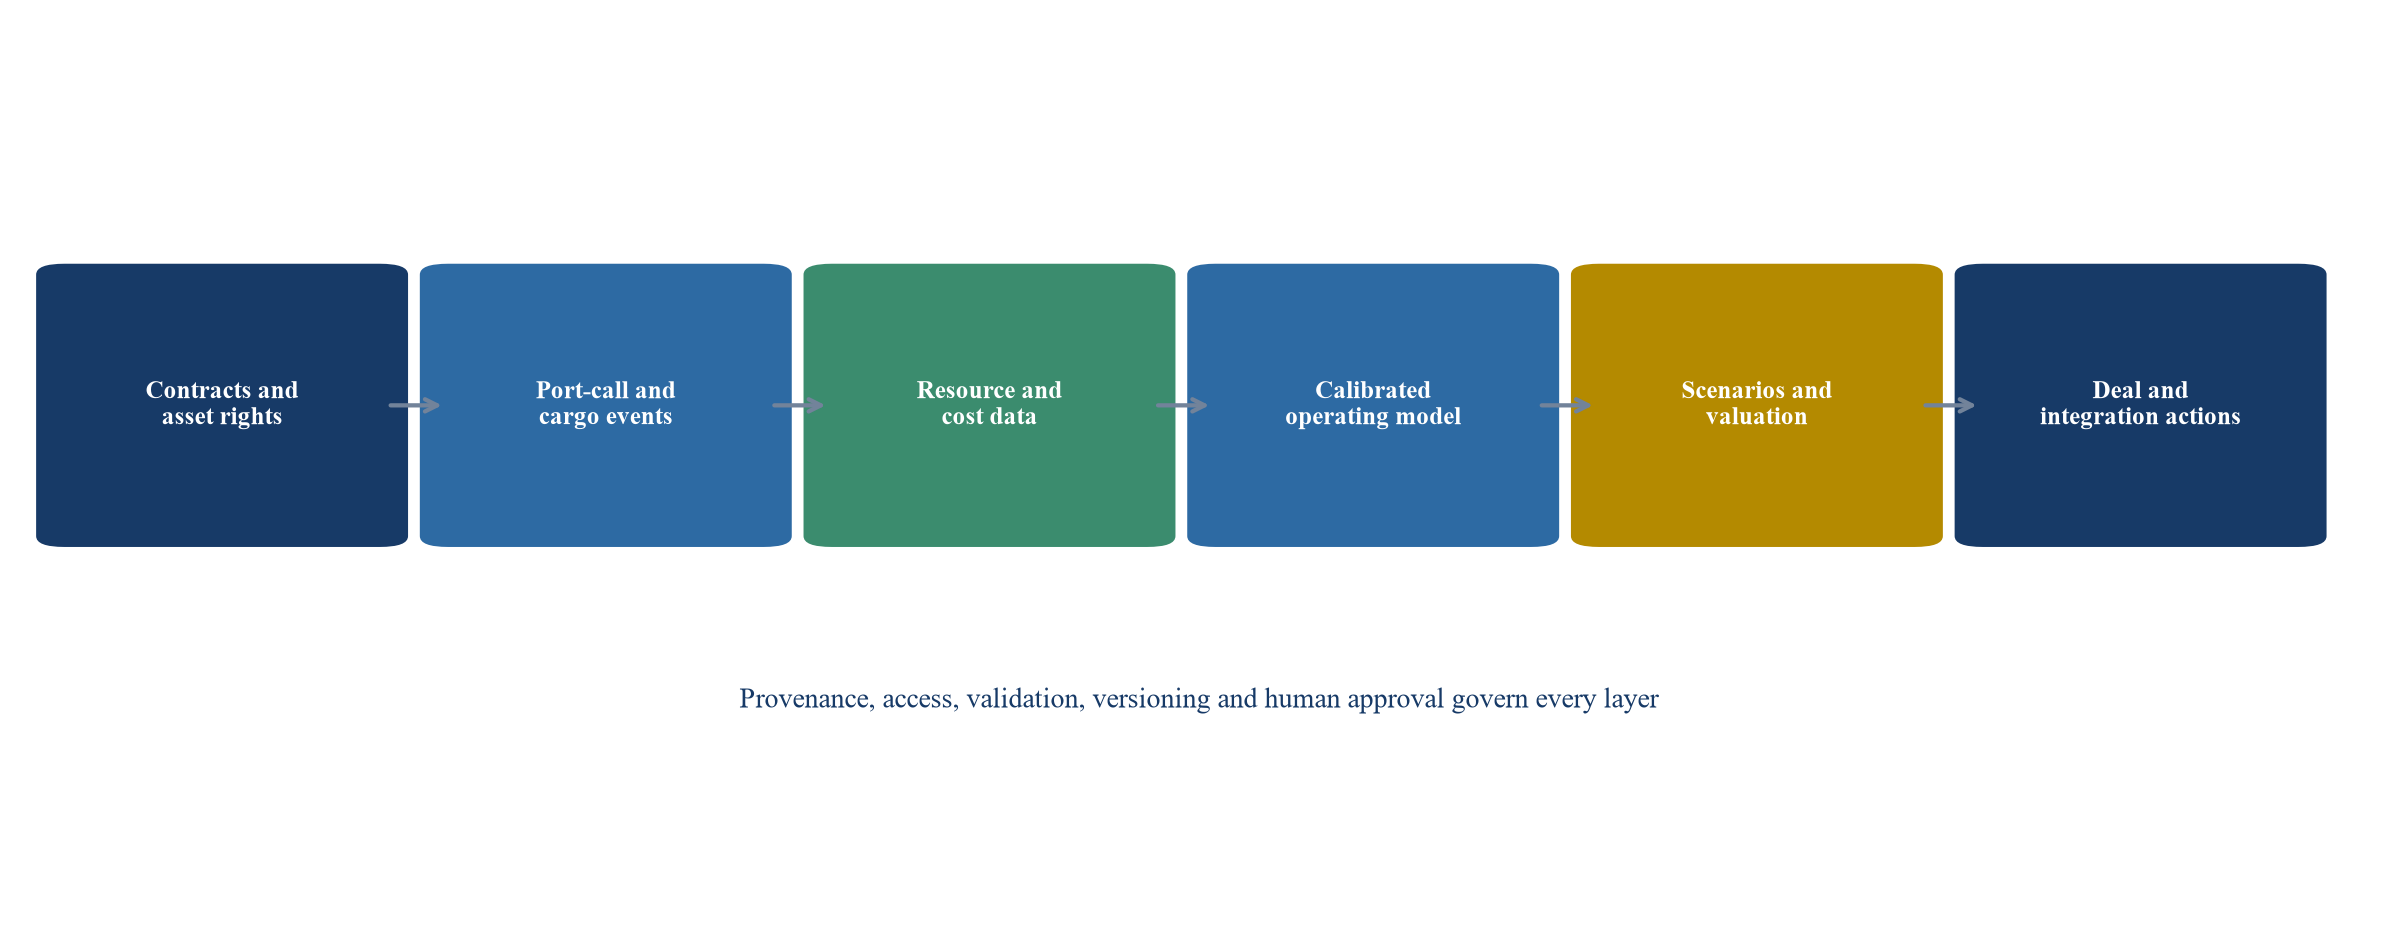
Transaction conclusions sit above a governed chain of source data, operational logic, calibration and scenario testing.
5. Establish trusted data lineage
Port systems may hold different versions of the same event. The terminal operating system records moves and equipment events; automatic identification system data records vessel positions; planning systems record intended windows; finance systems record billing; gate systems record truck activity; maintenance systems record availability. The team needs a controlled event model that preserves each source and explains reconciliation.
Source files should retain original timestamps, time zones, identifiers, units and revision history. Derived data should record the transformation, rule, code version and reviewer. A corrected vessel arrival time should not overwrite the original record. It should create an approved field with traceability.
Data gaps have economic meaning. Missing crane-event data can limit productivity analysis. Incomplete gate appointments can weaken yard-congestion attribution. The diligence report should state the affected period, asset, metric and decision, then apply a consequence such as a wider range, lower confidence or targeted condition.
6. Reconstruct the port-call timeline
The port-call timeline should connect estimated and actual arrival, anchorage, pilot boarding, channel entry, all-fast, crane start, operational completion, unberthing and port departure. The World Bank's Container Port Performance Index focuses on vessel time in port and uses administrative and statistical approaches to compare performance [2]. The acquisition analysis needs the underlying event detail rather than a rank alone.
Time should be decomposed into controllable and external components. Weather, channel restrictions and vessel readiness can affect a call. Berth planning, labour availability, crane assignment, equipment reliability and yard readiness can be influenced by the operator. The model should preserve competing causes where evidence is mixed.
The distribution matters. An average can hide severe tail performance for large vessels or peak days. The review should analyse percentiles by terminal, berth, service, vessel size, exchange size, customer and period. Persistent variability can require buffer capacity even when average utilisation appears moderate.
7. Test arrival and berth planning
Published schedules are uncertain. Vessels can arrive early or late, and several services can converge after disruption. The berth model should represent arrival distributions, priority rules, berth compatibility, tidal or draught restrictions, crane requirements, maintenance windows and contractual windows.
The first test should reproduce observed berth allocation and waiting patterns. The team should compare simulated and actual berth occupancy, anchorage time, shifting and idle windows. Differences should be investigated before scenario work. A model that understates arrival variability can overstate the benefit of schedule optimisation.
Scenario testing can assess revised windows, dynamic allocation, customer coordination and just-in-time arrival. The International Maritime Organization requires Maritime Single Windows for electronic ship-port information exchange from 1 January 2024 and promotes harmonised data standards through the IMO Compendium [3-5]. Regulatory data exchange can support the operating model while remaining distinct from commercial terminal systems.
8. Measure berth productivity
Berth productivity should connect gross berth time, operating time, crane intensity, crane moves, hatch sequence, equipment interruptions and labour. A headline moves-per-hour figure can be improved by assigning more cranes while reducing productivity per crane or creating downstream yard congestion. The model should preserve these trade-offs.
The buyer should compare productivity by vessel class, exchange size, service, crane type, shift and weather. It should identify the time lost to equipment failure, hatch change, lashing, restow, documentation, labour change, safety interruption and yard conflict. Each category needs a consistent definition.
Contractual productivity commitments should be reconciled with measurement rules. A customer contract may exclude specified delays or use net rather than gross measures. The operating model and revenue model should apply the same definition before estimating incentives, penalties or customer retention.
9. Model quay-crane and equipment availability
Crane capacity depends on rated capability, physical reach, maintenance, operator availability, interference and the mix of work. A fleet count does not establish usable capacity. The diligence team should reconstruct availability, planned and unplanned downtime, mean time between failures, repair duration and parts constraints.
Equipment condition should connect to the maintenance and capital programme. Deferred major maintenance can increase near-term EBITDA while creating reliability and cash risk. The buyer should distinguish routine operating expense, lifecycle maintenance and replacement capital.
Simulation can test crane allocation and resilience to outages. The benefit should be constrained by yard and labour capacity. A scenario that accelerates quayside moves but overwhelms yard transfer can shift delay rather than remove it.
10. Model the yard
Yard capacity depends on area, stacking density, container mix, dwell time, rehandles, equipment, segregation rules and retrieval reliability. A static slot count can materially overstate operating capacity. The twin should model occupancy by block and time, inbound and outbound peaks, empty containers, reefers, dangerous goods and customs status.
The core diligence question is whether the yard can absorb vessel and landside variability while meeting service levels. High average occupancy can create nonlinear congestion as placement choices narrow and rehandles rise. The model should test peak windows and disruption recovery rather than a steady annual average.
Dwell reduction may release capacity, but its delivery can depend on customers, customs, documentation and hinterland transport. The valuation case should allocate responsibility and cost. Improvements outside the operator's control should carry lower probability until supported by agreement or evidence.
11. Test gates and hinterland connections
Gate performance should be measured through appointment adherence, queue, transaction time, failed visits, peak arrivals and equipment or documentation exceptions. The analysis should distinguish terminal processing from road congestion outside the gate. It should also assess whether additional gate capacity would relieve the actual constraint.
Rail, inland waterway and depot connections can extend the effective port system. Their schedules, capacity, reliability and commercial terms affect yard dwell and customer choice. The system map should connect cargo release to final evacuation rather than ending at the terminal boundary.
The acquisition model should test the consequences of modal shift, new road restrictions, depot closure or rail expansion. These events can change both volume and the capital needed inside the terminal.
12. Separate demand from operational capacity
Port valuation requires both demand and capacity. A digital twin cannot create trade demand. The demand case should use commodity and route fundamentals, shipping-line networks, customer contracts, competing ports, inland economics and trade policy. UNCTAD's 2025 review describes maritime trade under uncertainty and identifies port performance and facilitation as important to competitiveness [6-7].
Demand should be segmented by cargo, route, customer, service and contestability. Captive hinterland demand has a different risk profile from transhipment that can move among hubs. Customer commitments should be tested for volume, price, duration, minimums, termination and network dependency.
The model should avoid circularity. Strong past throughput can reflect temporary congestion at a competitor, a customer incentive or disruption elsewhere. The forecast should identify the causal driver and its expected duration.
13. Define usable capacity
Usable capacity is the throughput range that the system can handle while meeting defined service, safety and resilience thresholds. It is lower than the theoretical maximum when variability, maintenance and recovery buffers are required. The threshold should include vessel waiting, berth-window reliability, yard occupancy, gate time and equipment availability.
The calculation should be scenario-specific. Capacity for a stable service mix can differ from capacity under larger vessels, greater transhipment, longer dwell or tighter customer windows. The buyer should not apply one terminal-wide number to every strategic case.
The output should show the binding constraint and the next constraint. Removing one bottleneck can expose another. This sequence determines the order and value of intervention.
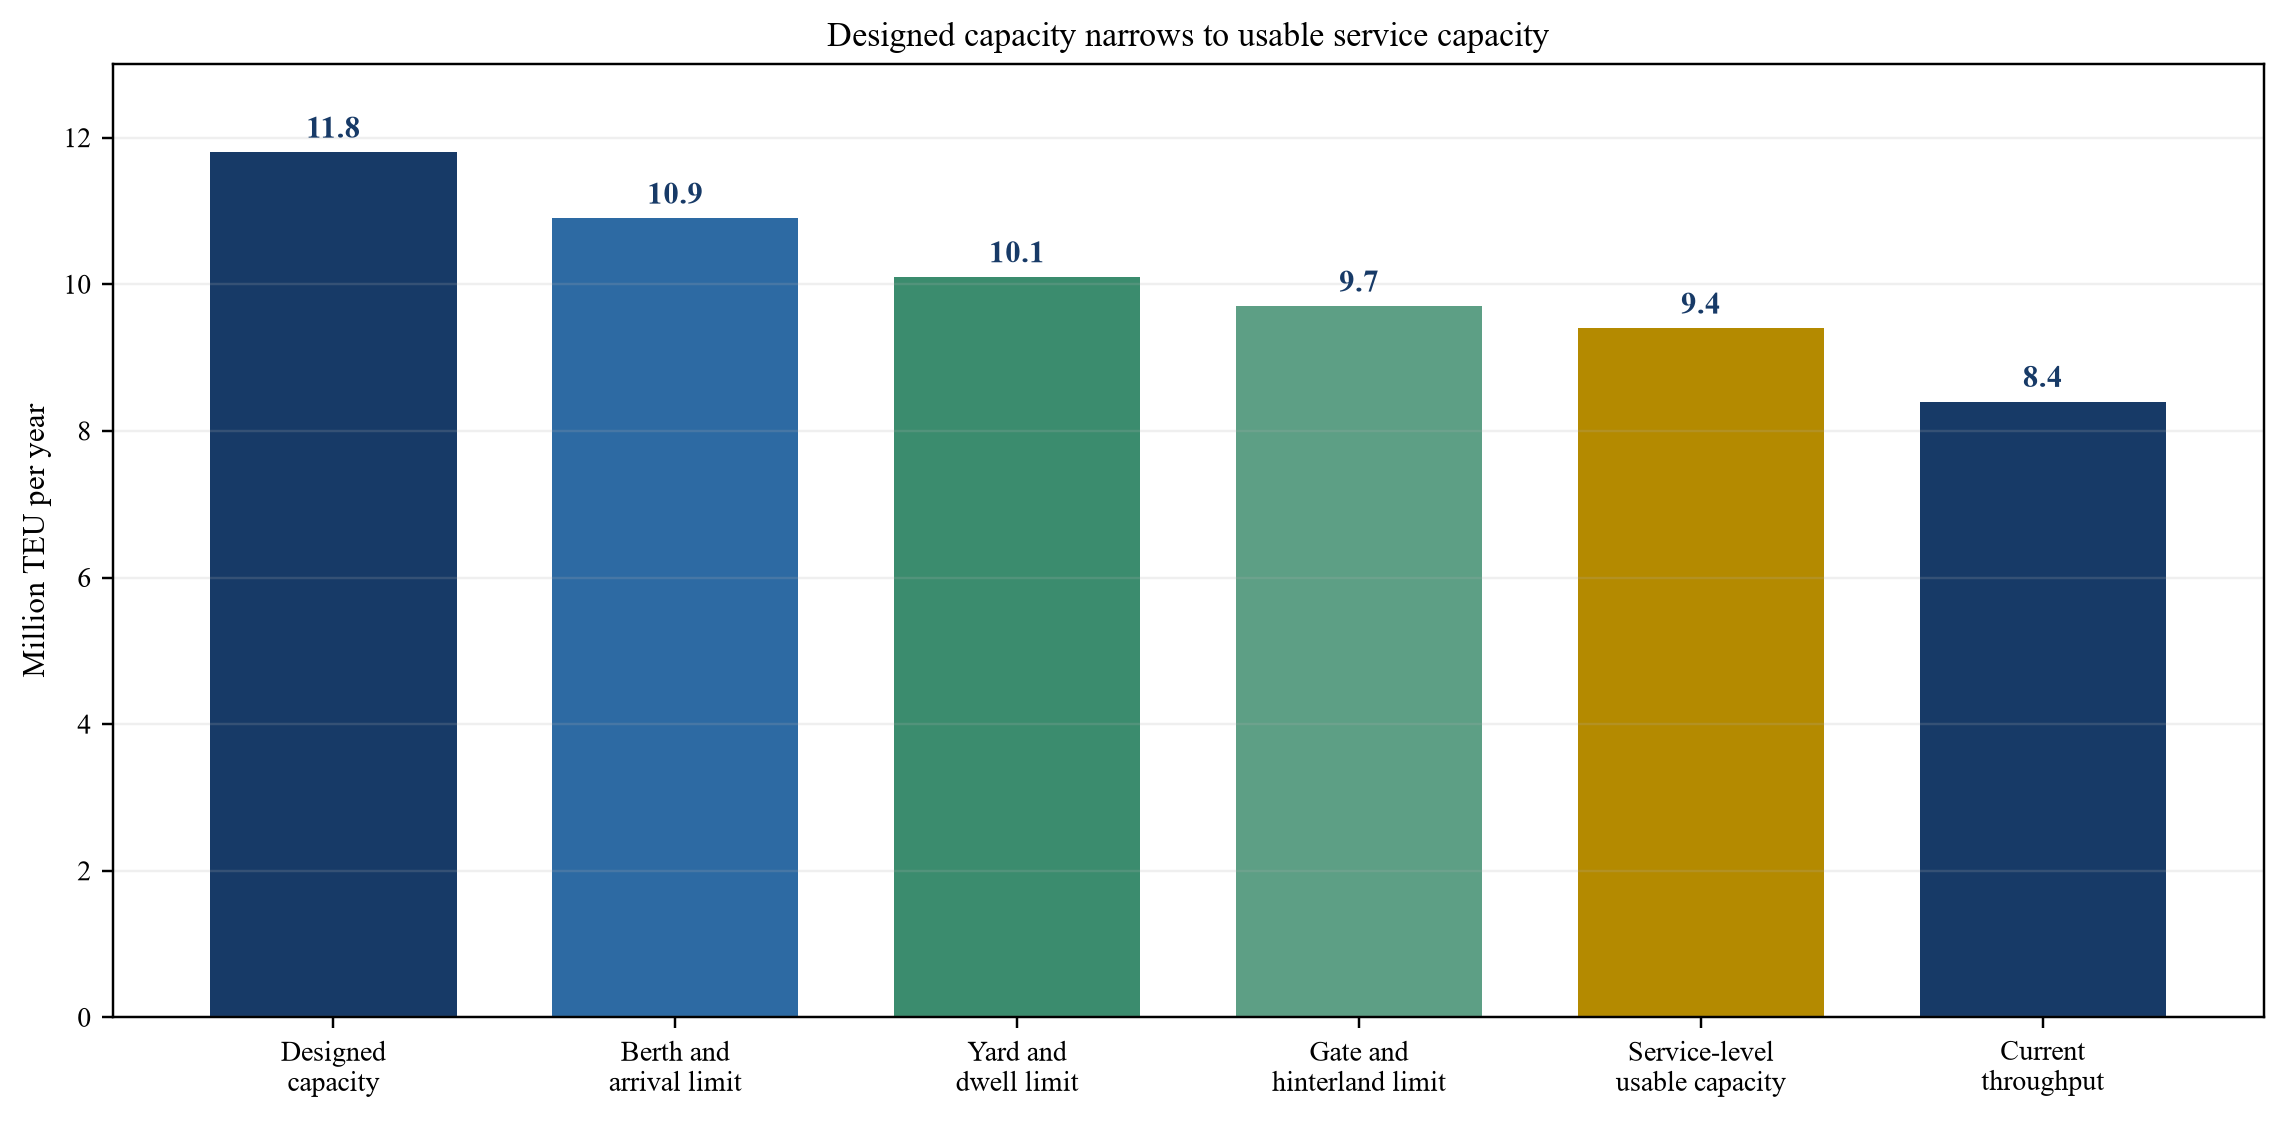
All values are management assumptions in million TEU and demonstrate the analytical method.
14. Identify nonlinear congestion
Queueing and congestion effects are nonlinear. As utilisation approaches the operating limit, small disruptions can create disproportionate waiting and recovery time. The buyer should therefore test the distribution of demand and service rather than applying a simple percentage to designed capacity.
Peak-window utilisation can be more informative than annual utilisation. A terminal at 71 per cent annual use may reach 88 per cent during contracted windows and experience repeated service failures. The digital twin should reproduce these peaks and test recovery after weather, equipment or schedule disruption.
The valuation consequence can be earlier expansion, lower customer retention, additional operating cost or reduced resilience. A congestion threshold should be linked to observed service deterioration and contract exposure.
15. Test customer concentration and network power
Shipping-line concentration should be analysed at group, alliance, service and route level. Several named customers may share network decisions or negotiate jointly. Vertical integration between shipping lines and terminal operators can change bargaining power and routing choices.
The review should calculate revenue, volume, contribution and capacity use by customer. A large customer can improve asset utilisation while receiving discounts, priority windows, dedicated equipment or capital commitments. The economics should reflect the full package.
Customer-retention scenarios should model both lost volume and released capacity. Replacement volume may have different price, dwell, route or peak characteristics. The model should test whether new cargo can use the same constrained windows.
16. Reconcile tariffs and revenue
Revenue should be reconstructed from tariff schedules, customer contracts, volume, service mix, storage, reefer, handling, marine or ancillary charges, rebates and minimums. Reported revenue per TEU can change because of mix rather than pricing power.
The model should distinguish regulated tariffs, negotiated contracts and pass-through items. It should identify indexation, caps, review rights and concession-sharing mechanisms. Revenue growth that requires approval should not be treated as automatic.
Operational scenarios should flow through the contract terms. Faster cargo evacuation may reduce storage revenue while releasing yard capacity and strengthening service. The valuation should capture the net effect rather than treating every efficiency gain as additional revenue.
17. Rebuild operating cost
Operating cost should be linked to activity and capacity. Labour, equipment energy, maintenance, leasing, information technology, security, dredging contributions and concession fees can respond differently to throughput. Fixed and variable labels should be tested against actual behaviour.
The digital twin can estimate resource hours and equipment use under each scenario. Finance should reconcile these outputs to the ledger and contracts. An operational saving requires a deliverable change to roster, equipment, energy or procurement rather than a modelled reduction alone.
Cost should include resilience. Reducing spare equipment or labour can improve a base case while increasing disruption loss. The investment committee should see expected cost and downside service effects together.
18. Assess maintenance and lifecycle capital
The buyer should establish asset condition, inspection history, remaining life, maintenance compliance, spares and replacement plans for cranes, yard equipment, pavement, rails, power, buildings and information systems. Maintenance deferral can transfer value from the future to reported earnings.
Lifecycle capital should be separated from growth capital. Replacement of an ageing crane may preserve capacity without adding volume. A digital platform upgrade may be necessary for cyber or vendor support. The transaction model should not classify these needs as discretionary expansion.
The capital schedule should connect to operating outages and delivery lead times. Several assets due for replacement in the same period can reduce capacity before expenditure produces benefit.
19. Model expansion alternatives
Expansion can involve berth extension, dredging, cranes, yard automation, new land, gate works, rail, power, information systems or an entirely new terminal. The twin should test staged alternatives against demand, service and constraint sequence.
Each option should include construction phasing and operational disruption. Capacity may decline during works. Permits, utility connections, land access, procurement and customer commitments can determine the schedule more than construction duration.
The World Bank's port guidance calls for demand forecasts, competing-port analysis and assessment of expansion and asset-renewal expenditure required to meet expected demand [8-10]. The buyer should use ranges and explicit triggers rather than a single fixed commissioning date.
20. Convert expansion timing into value
Expansion value depends on when capital is committed, when capacity becomes usable, the volume and price captured, the operating cost, concession term and residual rights. Deferring capital can create value when service is preserved. Delay can destroy value when congestion causes customer loss or construction misses the demand window.
The decision rule should link investment to leading indicators. These may include peak berth utilisation, berth-window reliability, yard occupancy percentiles, gate queue, contracted demand, equipment condition and permit readiness. A trigger should specify measurement and governance.
The model should calculate the economic value of each staged option under consistent discount rates and concession assumptions. It should also identify stranded capacity where customer or hinterland demand is insufficient.
Expansion alternatives should be compared as mutually exclusive investment paths rather than isolated projects. A new berth can shift the constraint to the yard. Additional cranes can increase peak transfers without improving vessel schedules. Yard automation can release land while adding technology dependency and implementation risk. An inland depot can move dwell outside the terminal while introducing rail or road coordination. The model should therefore show the system consequence, transition disruption and capital sequence for every option. The selected path should remain robust when demand, delivery dates and operating performance move together.
| Trigger | Evidence | Expansion implication | Deal implication |
|---|---|---|---|
| Peak berth utilisation exceeds tested threshold | Calibrated call and berth model | Advance berth or crane package | Capex reserve or price adjustment |
| Yard occupancy drives rehandles and service failures | Block-level occupancy and dwell | Dwell programme, automation or land | Delivery condition and operating plan |
| Contracted volume exceeds usable capacity | Executed customer commitments | Stage capacity before service start | Funding commitment and covenant |
| Equipment reliability falls below service requirement | Maintenance and failure records | Replacement capital | Debt-like item or completion account |
| Concession term cannot recover new capital | Rights, tariff and cash-flow model | Renegotiate term or reduce scope | Consent condition or lower value |
Thresholds are hypothetical and require calibration to the actual concession and service commitments.
21. Assess concession economics
The concession defines the period, services, tariff rights, fees, performance obligations, capital commitments, change control, security, termination, compensation and handback. These terms determine whether operational and expansion value belongs to the operator, authority, customers or a successor.
The buyer should model remaining term and extension rights under documented conditions. A terminal with strong demand can have limited acquisition value when major capital is required late in the term without compensation. Handback standards can create a material final-period obligation.
Change-of-control and lender rights should be verified. Required authority consent, performance security or requalification can affect execution. Public-interest obligations may constrain workforce, tariffs, service or asset use.
22. Assess competition and market structure
Port competition can occur among terminals within a port, among ports serving a common hinterland, and among regional hubs competing for transhipment. The relevant market can differ by cargo, route and customer. The OECD has examined competition in ports and port services, while the World Bank's 2025 toolkit addresses economic regulation and the balance between investment and market power [11-12].
The transaction review should identify ownership links among shipping lines, terminal operators, logistics providers and inland facilities. Horizontal consolidation can affect customer choice. Vertical integration can affect access, routing and information.
Competition and regulatory analysis should be led by qualified counsel and economists. The digital twin can test operational diversion and capacity effects, but it does not determine the legal market or transaction clearance.
23. Test technology architecture and interoperability
The twin depends on interfaces with terminal operating, vessel, gate, maintenance, finance, customer and authority systems. The buyer should inventory ownership, licences, vendors, support terms, APIs, data models, hosting and custom code. A visually impressive application can depend on fragile manual feeds or a single vendor.
Interoperability should be tested through actual message flows. The IMO Compendium promotes shared meaning across ship-port and authority data [4]. Commercial systems may require additional standards and mapping. The buyer should identify fields that are manually reconciled and data that cannot be used after change of control.
Technology debt should enter the capital and integration plan. Unsupported software, undocumented interfaces and weak test environments can impair both operations and the digital twin.
24. Assess cybersecurity and operational resilience
Port technology connects physical operations, customers and public authorities. A cyber event can interrupt gates, cranes, documentation or vessel coordination. The review should map critical systems, networks, identities, third parties, backups, recovery, incident response and physical fallback procedures.
Cyber testing should follow applicable law, authority rules and recognised standards. The IMO has highlighted cybersecurity considerations in maritime digitalisation and Maritime Single Window development [3-5]. The transaction team should separate verified control evidence from policy statements.
The twin should not create an uncontrolled concentration of sensitive operational data. Access, isolation, logging, model security and continuity should be designed into the architecture. Scenario models should include technology outage and manual recovery.
25. Model climate, weather and decarbonisation
Ports face acute weather, sea-level, heat, wind and water-depth risks as well as transition requirements. These factors can affect operating windows, asset life, insurance, capital and customer demand. The model should use location-specific evidence and engineering review.
Weather layers can improve berth and equipment simulation. Port of Rotterdam describes digital representation of infrastructure, ship movements, weather and hydro information as part of smarter port management [13-14]. The acquisition model should state the data period and avoid treating historical patterns as fixed future conditions.
Decarbonisation can require shore power, alternative-fuel services, equipment conversion and grid capacity. These investments may create strategic value or regulated obligations. Their economics should be separated from ordinary terminal expansion.
26. Validate the model
Validation begins with historical replay. The model should reproduce vessel time, berth occupancy, crane moves, yard occupancy, gate flows and resource use within documented tolerances across normal, peak and disrupted periods. A model that matches one average can still fail on the tails that drive capital and customer risk.
The team should use holdout periods and sensitivity tests. Parameters should be challenged for arrival variability, dwell, equipment failure, labour, weather and customer mix. Material manual overrides need evidence and approval.
Independent review should attempt to disprove the model. Operations, engineering, commercial, finance, technology and transaction specialists should review the assumptions relevant to their discipline. Validation status should remain visible in every valuation output.
| Validation test | Comparison | Acceptance question | Consequence of failure |
|---|---|---|---|
| Historical replay | Simulated versus observed calls and flows | Does the model reproduce level and distribution? | Recalibrate or widen range |
| Peak-period test | Congested weeks and recovery | Does it reproduce nonlinear delay? | Reduce usable capacity confidence |
| Resource test | Crane, yard, gate and labour hours | Are resource constraints represented? | Do not use cost or capex output |
| Holdout test | Period excluded from calibration | Does performance generalise? | Limit forecast use |
| Scenario plausibility | Operational expert review | Are interventions feasible and sequenced? | Exclude upside from base value |
Passing one test does not establish fitness for every decision or scenario.
27. Translate operations into maintainable EBITDA
Maintainable EBITDA should begin with reported performance and adjust for volume normalisation, tariff or rebate effects, service penalties, maintenance, technology, concession charges and recurring operating requirements. Every adjustment should trace to contracts, data or an identified professional assessment.
Digital-twin upside should remain outside the base case until it is deliverable. The value of an intervention depends on implementation cost, operating disruption, customer response and the capacity of connected processes. Probability weighting should reflect evidence and accountability.
The buyer should also separate earnings from cash. Storage, incentives, customer credit, concession fees and capital timing can cause material differences. A throughput gain that requires substantial working capital or capital expenditure should be valued on cash flow.
28. Build the acquisition value bridge
The value bridge should connect reported earnings, maintainable operations, lifecycle capital, concession rights, expansion and probability-adjusted improvement. The discount rate and multiple should reflect the risk and duration of the cash flow being valued. A short-dated concession should not receive the economics of perpetual ownership.
IFRS 13 provides the framework for fair value measurement, IFRS 3 governs business combinations, and IAS 36 addresses recoverable amount and impairment, including goodwill [15-17]. Transaction valuation and accounting allocation are related but distinct exercises. Qualified valuation and accounting professionals should apply the relevant standards to the actual facts.
The committee should see values both with and without operational upside. This prevents a competitive price from depending on changes that the buyer has not yet delivered.
Value attribution should also distinguish seller-provided capability from buyer-created capability. Existing contracts, trained labour, proven equipment performance and transferable systems may support current value. Procurement scale, network redesign, new customer access and group technology may arise only after the buyer takes control. The acquisition model should state the investment, implementation period and execution risk attached to each buyer-created benefit. This separation supports disciplined bidding, post-close accountability and negotiation over contingent value when a benefit depends on evidence that will emerge after signing.
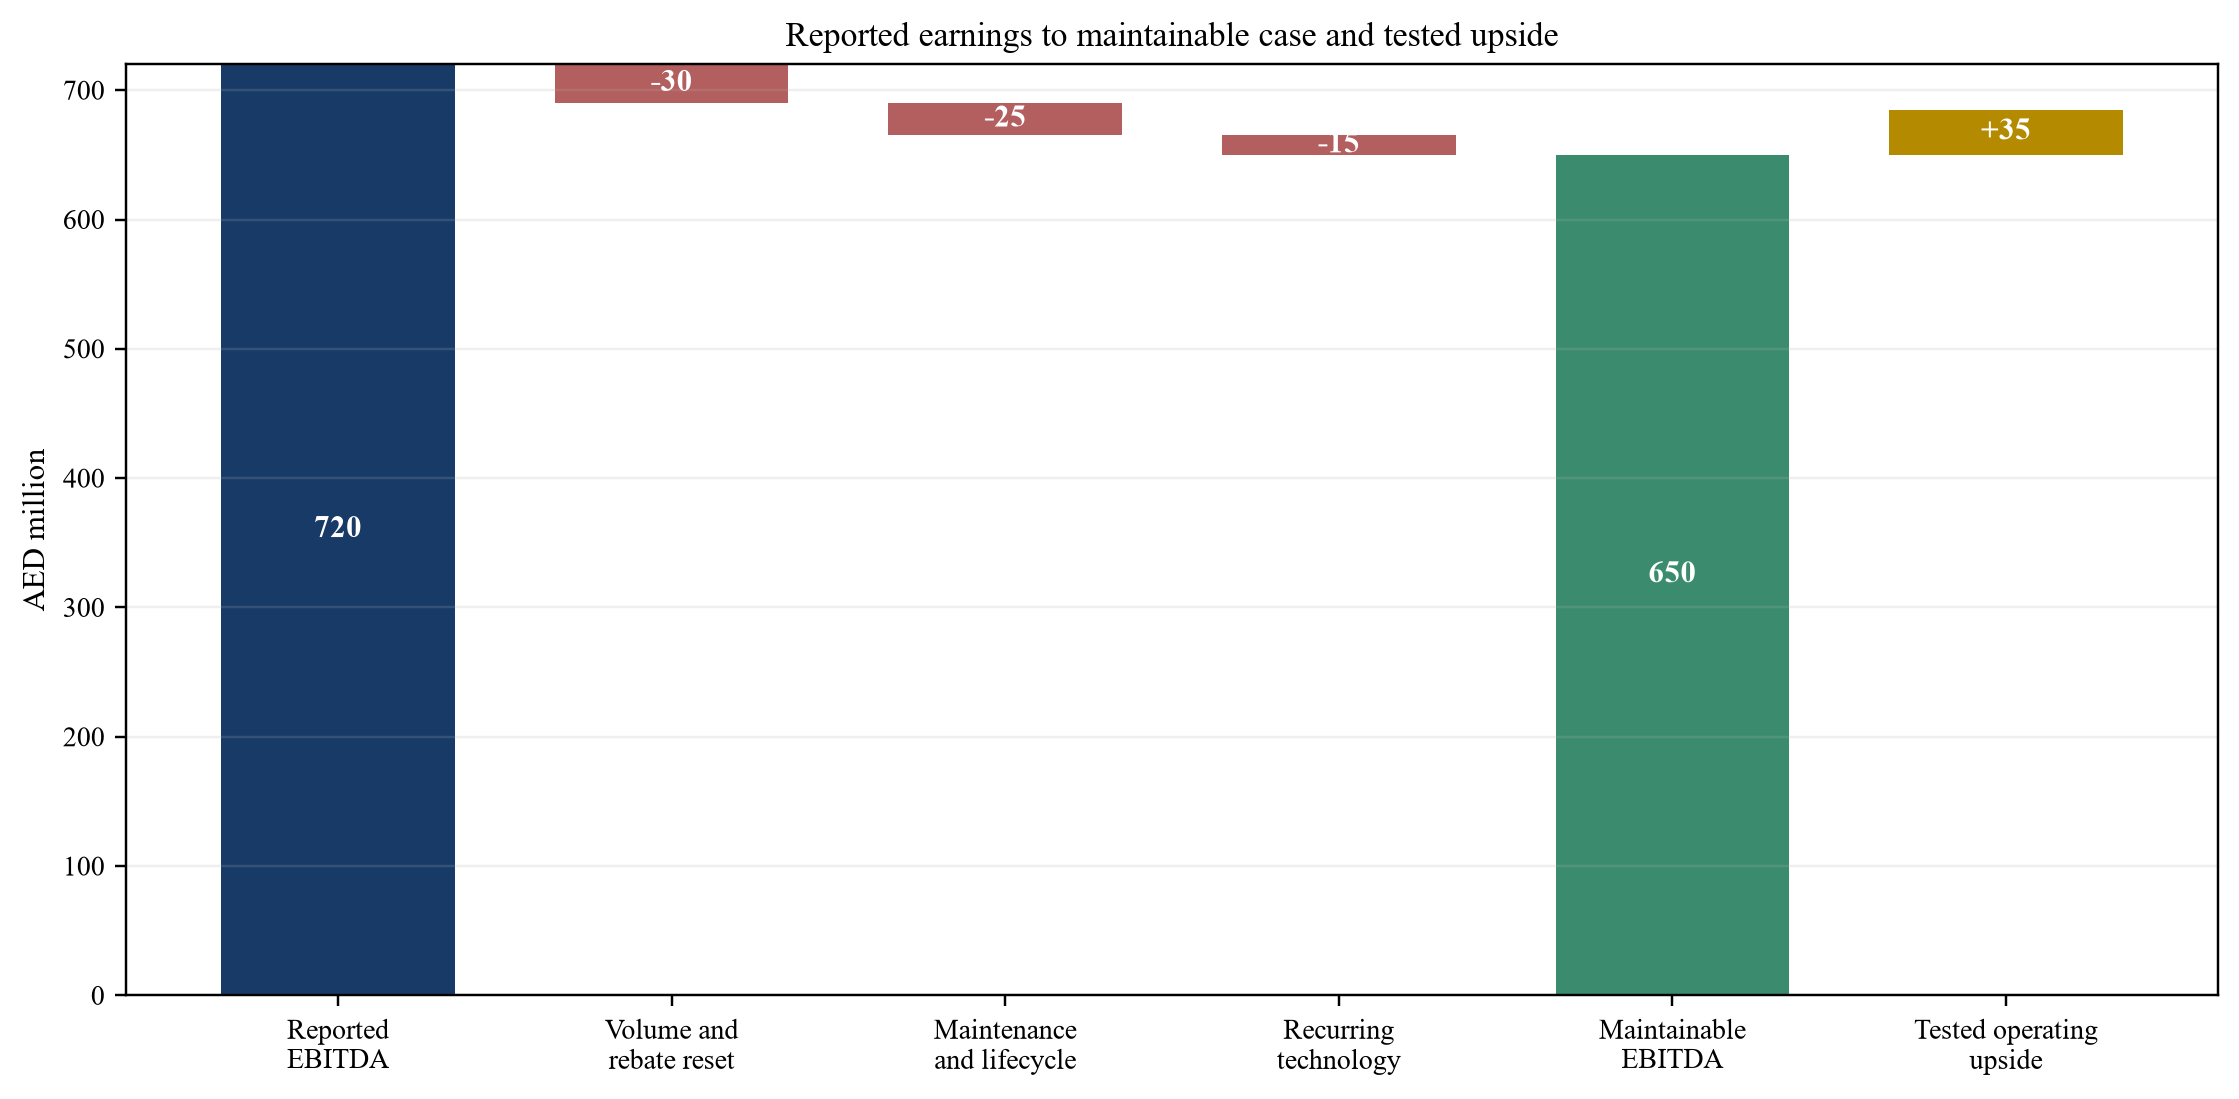
All values are management assumptions in AED million and are not observed company data.
29. Demonstrate the four-terminal scenario
Consider a hypothetical GCC port platform with four terminals and designed annual capacity of 11.8 million TEU. Current throughput is 8.4 million TEU and reported EBITDA is AED 720 million. Annual headline utilisation is 71 per cent, while peak contracted windows reach 88 per cent. Management proposes AED 1.4 billion of expansion expenditure.
The reconstructed system estimates service-level usable capacity of 9.4 million TEU under the current mix. Berth and arrival patterns constrain the first stage; yard dwell and gate peaks constrain further growth. Historical replay identifies variation by terminal and customer that is not visible in platform averages.
Earnings review reduces reported EBITDA by AED 70 million for volume normalisation, rebate treatment, lifecycle maintenance and recurring technology cost, producing maintainable EBITDA of AED 650 million. Tested operating interventions could add AED 35 million of annual EBITDA after implementation cost, with a probability-adjusted present value of AED 310 million.
The staged model indicates that AED 450 million of the proposed expansion could be deferred if berth-window reliability, yard dwell and gate performance meet specified thresholds while contracted demand remains within the tested range. The result is conditional. Failure to achieve those thresholds advances the capital trigger.
| Item | Terminal A | Terminal B | Terminal C | Terminal D | Platform |
|---|---|---|---|---|---|
| Designed capacity, million TEU | 3.6 | 3.1 | 2.8 | 2.3 | 11.8 |
| Current throughput, million TEU | 2.8 | 2.2 | 1.9 | 1.5 | 8.4 |
| Reported EBITDA, AED million | 258 | 190 | 154 | 118 | 720 |
| Maintainable EBITDA, AED million | 229 | 171 | 141 | 109 | 650 |
| Peak-window utilisation | 91% | 87% | 86% | 84% | 88% |
| Proposed expansion capex, AED million | 520 | 380 | 310 | 190 | 1,400 |
All figures are management assumptions used solely to demonstrate the framework.
30. Structure price and transaction protection
The base acquisition value should use maintainable earnings, concession life, lifecycle capital and a supportable demand case. Operational upside can be represented through the buyer's plan, a lower entry price or carefully defined contingent value. Sellers should not receive value at closing for improvements dependent on buyer execution unless the commercial bargain expressly provides it.
Completion accounts should define debt, cash, working capital, concession balances, customer incentives, maintenance accruals and committed capital. Specific protections may address concession consent, customer termination, deferred maintenance, technology licences, cyber incidents, land or environmental matters and undisclosed capital obligations.
Conditions precedent can require authority consent, critical contract retention, data access or completion of specified works. The agreement should preserve evidence and system access needed for post-close operation and claims.
31. Plan the first hundred days
Before closing, the buyer should protect concession deadlines, customer windows, operating authority, cyber access, maintenance and project commitments. It should identify the people who hold tacit knowledge of berth planning, equipment, yard rules, customer exceptions and public interfaces.
The first hundred days should establish one operating baseline, governance cadence and value-action register. The digital twin should be frozen at the diligence version, then updated through controlled releases. Changes in data or assumptions should not rewrite the acquisition case without a documented bridge.
High-value interventions should begin with measured pilots. A revised berth rule, crane allocation or gate appointment should be tested against service, safety, labour and downstream effects. Realised value should be measured against the baseline and net of implementation cost.
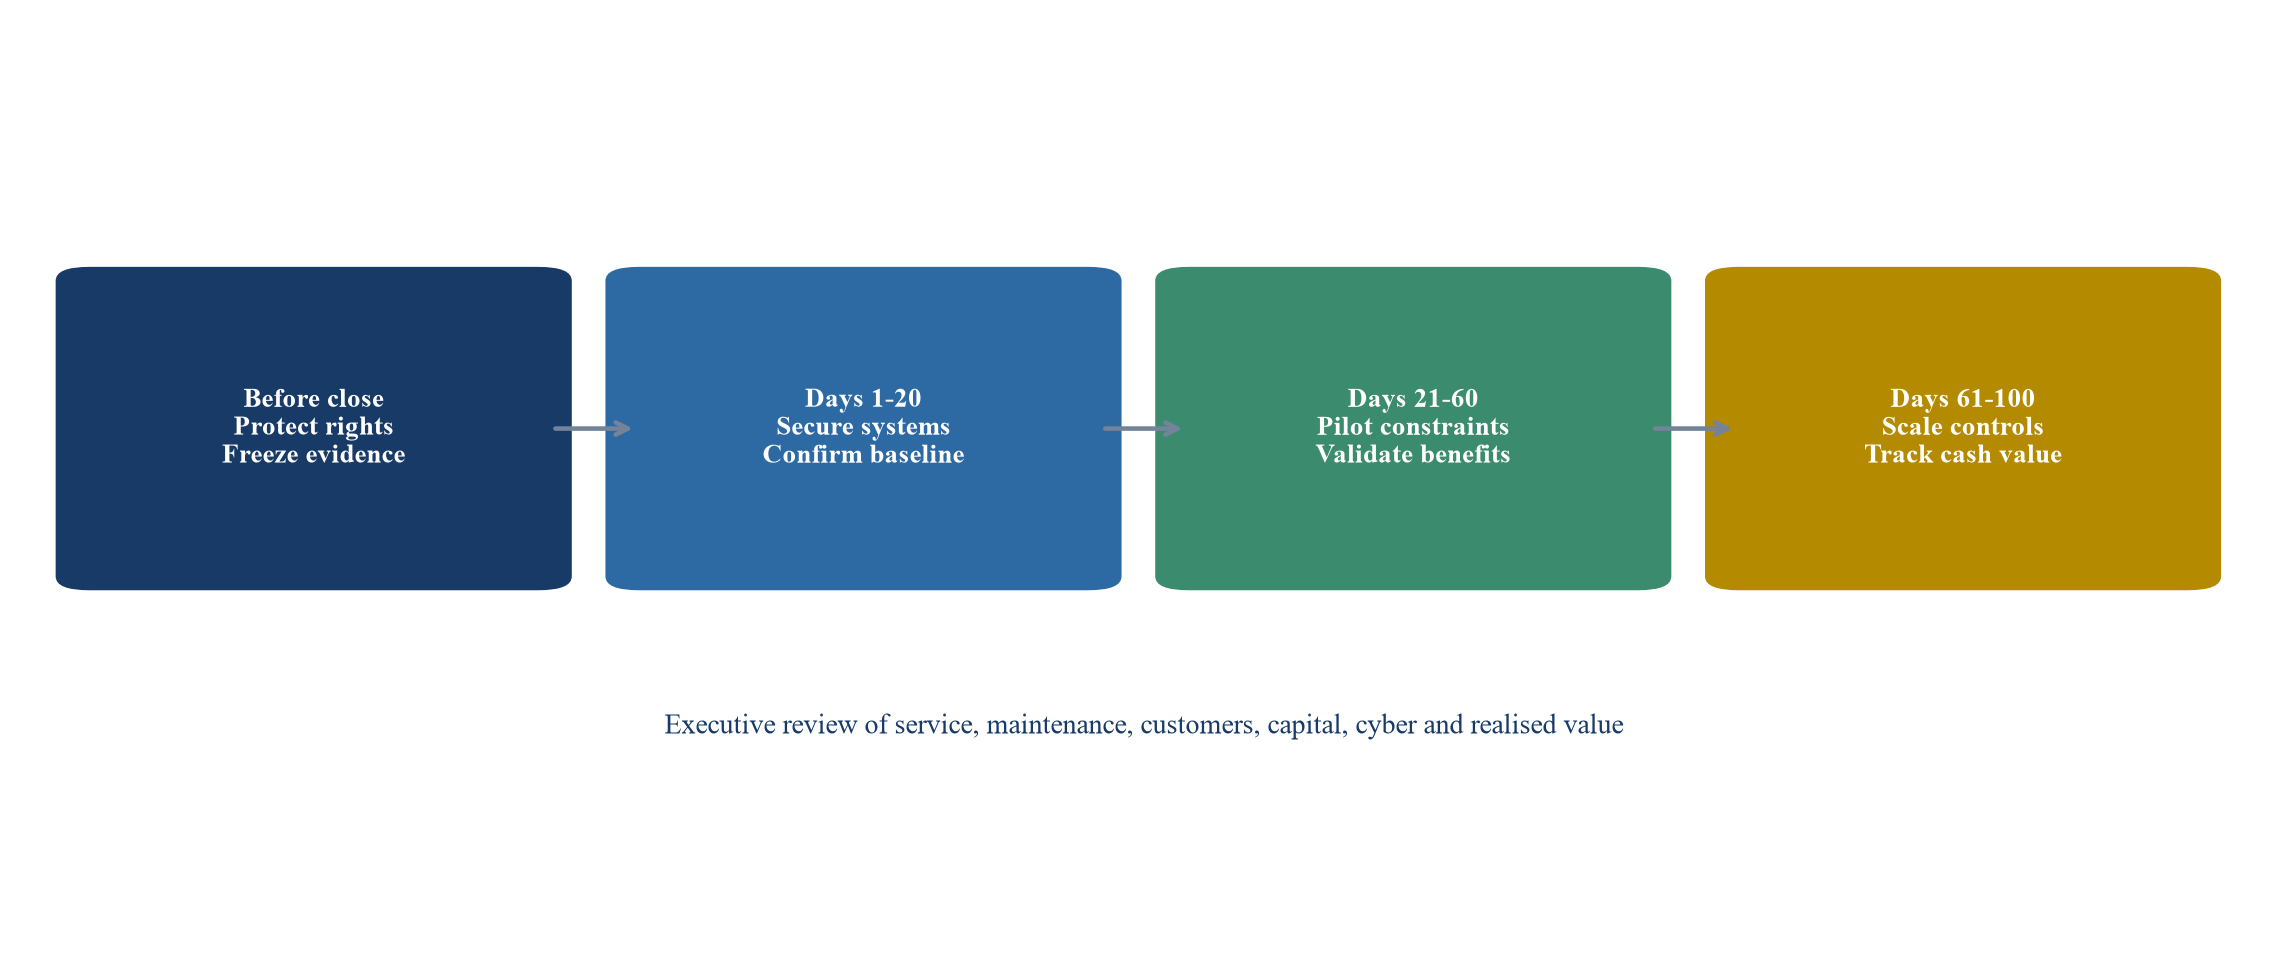
The acquisition model remains a dated baseline while operating data and interventions move through controlled governance.
32. Establish governance and decision rights
The model owner should control code, data lineage, releases and validation. Operations should approve process logic and feasibility. Engineering should assess asset condition and capital. Commercial teams should confirm customer and tariff inputs. Finance should reconcile earnings and cash. Technology and cyber teams should assess architecture and resilience. Counsel should interpret concession, competition, data and transaction matters.
The investment committee pack should separate observed facts, professional assessments, management assumptions and unresolved gaps. Observed facts include executed contracts, recorded events, invoices and preserved source data. Professional assessments include asset condition, model fitness, legal interpretation and valuation. Management assumptions include future demand, customer behaviour, implementation and capital timing.
Every material output should show the data cut-off, model version, scenario, sensitivity and approver. This record supports transaction accountability and later comparison with realised performance.
Decision rights should extend through signing and completion. A change-control forum should assess new data, customer developments, authority requirements and revised capital estimates. Material changes should flow through the operating model, valuation bridge, transaction documents and integration plan together. The deal team should retain a baseline package showing the assumptions accepted when price was approved. After completion, management can compare realised berth productivity, dwell, service, maintenance and capex against that baseline and explain variance to the board.
33. Recognise limitations
A digital twin is limited by its data, system boundary, model design and validation. It may not capture strategic customer decisions, regulatory change, geopolitical disruption, construction execution, technology failure or rare operational events. Scenario detail does not remove uncertainty.
Historical calibration can create false confidence when the future operating regime differs from the observed period. Shipping alliances may alter call patterns, customer contracts may change routing, new regulation may affect costs, and expansion works may temporarily reduce capacity. Sparse data can also hide peak-window failures even when annual averages appear stable. The diligence report should identify these breaks explicitly, stress the affected parameters and describe the evidence needed before a conclusion can be relied upon. Where uncertainty remains material, transaction protection or a lower value should carry the risk.
The framework does not replace engineering inspection, navigation or safety analysis, concession and competition advice, environmental assessment, cyber testing, accounting or valuation. Each professional should state the scope and evidence of the conclusion.
The illustrative figures in this paper are hypothetical. They show how operational evidence can enter an acquisition decision. They should not be applied to an identified terminal without verified data and qualified review.
34. Conclude the acquisition case
A port buyer should value the operating system that produces reliable cargo flow, not nominal infrastructure alone. The core evidence is the interaction among demand, arrival variability, berth productivity, yard dwell, gates, equipment, concession rights and capital.
A calibrated digital twin can make that interaction visible and testable. It can identify the binding constraint, quantify the service consequence of growth, compare expansion stages and connect operating interventions to cash. Its outputs enter value only when historical replay, sensitivity and professional review support the decision.
The acquisition should proceed when the buyer can explain sustainable throughput, maintainable earnings, lifecycle capital, concession value, expansion triggers and delivery accountability. Price and terms should cover risks that cannot be controlled at closing. The integration plan should address the constraints that can be changed and measure realised value against a preserved baseline.
Sources
- Maritime and Port Authority of Singapore, Maritime Digital Twin. Read the primary source
- World Bank and S&P Global Market Intelligence, The Container Port Performance Index 2020 to 2024. Read the primary source
- International Maritime Organization, Maritime Single Window: advancing digitalization in shipping. Read the primary source
- International Maritime Organization, Maritime Single Window. Read the primary source
- International Maritime Organization, Facilitation and the free flow of trade by ship. Read the primary source
- UN Trade and Development, Review of Maritime Transport 2025. Read the primary source
- UN Trade and Development, Port Performance and Maritime Trade Facilitation. Read the primary source
- World Bank, Port Reform Toolkit, third edition. Read the primary source
- World Bank Public-Private Partnership Resource Center, Ports Module. Read the primary source
- World Bank Public-Private Partnership Resource Center, Public-Private Partnerships in Ports. Read the primary source
- OECD, Competition in Ports and Port Services. Read the primary source
- World Bank, Port Reform Toolkit Module 5: Economic Regulation. Read the primary source
- Port of Rotterdam Authority, Control and Management. Read the primary source
- Port of Rotterdam Authority, Smart Infrastructure. Read the primary source
- IFRS Foundation, IFRS 13 Fair Value Measurement. Read the primary source
- IFRS Foundation, IFRS 3 Business Combinations. Read the primary source
- IFRS Foundation, IAS 36 Impairment of Assets. Read the primary source
- International Association of Ports and Harbors, Cybersecurity Guidelines for Ports and Port Facilities. Read the primary source
- United Nations Economic Commission for Europe, UN/CEFACT Smart Container Business Requirements Specification. Read the primary source
- International Organization for Standardization, ISO 28000 Security and resilience: Security management systems. Read the primary source
- International Finance Corporation, Performance Standards on Environmental and Social Sustainability. Read the primary source
- World Bank, Port Reform Toolkit Module 6: Risk Management and Financing. Read the primary source
- Maritime and Port Authority of Singapore, Singapore Maritime Institute Forum and digital-twin research. Read the primary source
- Port of Barcelona PierNext, Digital Twins for Safer and More Efficient Port Decisions. Read the primary source
