

1. Define the retail decision before estimating value
A retail roll-up creates several decisions at once. The buyer must decide what it is acquiring, how much it can pay, whether competition approval or remedies may alter the perimeter, which stores and brands should remain distinct, which systems can be integrated, and how inventory should move through the transition. A single synergy percentage cannot answer those questions. The investment committee needs a model that connects each value claim to the stores, products, channels, customers, suppliers and operating actions that create it.
The transaction perimeter comes first. Record the legal entities, countries, licences, franchise and agency rights, owned and leased stores, e-commerce channels, loyalty programmes, warehouses, procurement entities, private-label rights, data assets, employees and transitional services included in the deal. Identify exclusions, consent requirements, change-of-control clauses and assets that remain shared with the seller. A benefit that depends on an excluded warehouse, non-transferable brand right or restricted customer database should not enter the executable case.
The buyer should then state the decision for each value hypothesis. A store-density hypothesis asks whether nearby locations expand coverage, transfer demand or destroy contribution. A purchasing hypothesis asks whether comparable specifications and volumes can be consolidated without losing supplier rebates, product quality or brand differentiation. An assortment hypothesis asks whether a common range improves availability and turns while preserving local demand. A technology hypothesis asks whether migration improves decisions without disrupting trading. The model should preserve these distinctions.
Regional context matters. Saudi Arabia's General Authority for Statistics publishes quarterly wholesale and retail indicators covering operating revenue, employee compensation and e-commerce sales, with 2023 as the base year in the current methodology.[1][2] Those indicators describe a market context; they do not establish a target's forecast. LuLu Retail's 2025 integrated report, for example, describes operations across all six GCC states and several formats and channels.[3] Cenomi Retail's disclosures show the operational complexity of a multi-brand, multi-country network.[4] A transaction model therefore needs evidence at a much lower level than regional growth or group revenue.
The output of the first phase is a decision map. Every material hypothesis has an owner, evidence request, valuation treatment, integration dependency and stop condition. The paper calls this the retail integration evidence ledger. It follows the logic of a retail integration evidence ledger while adding store, SKU, channel, promotion and inventory fields needed for retail decisions.
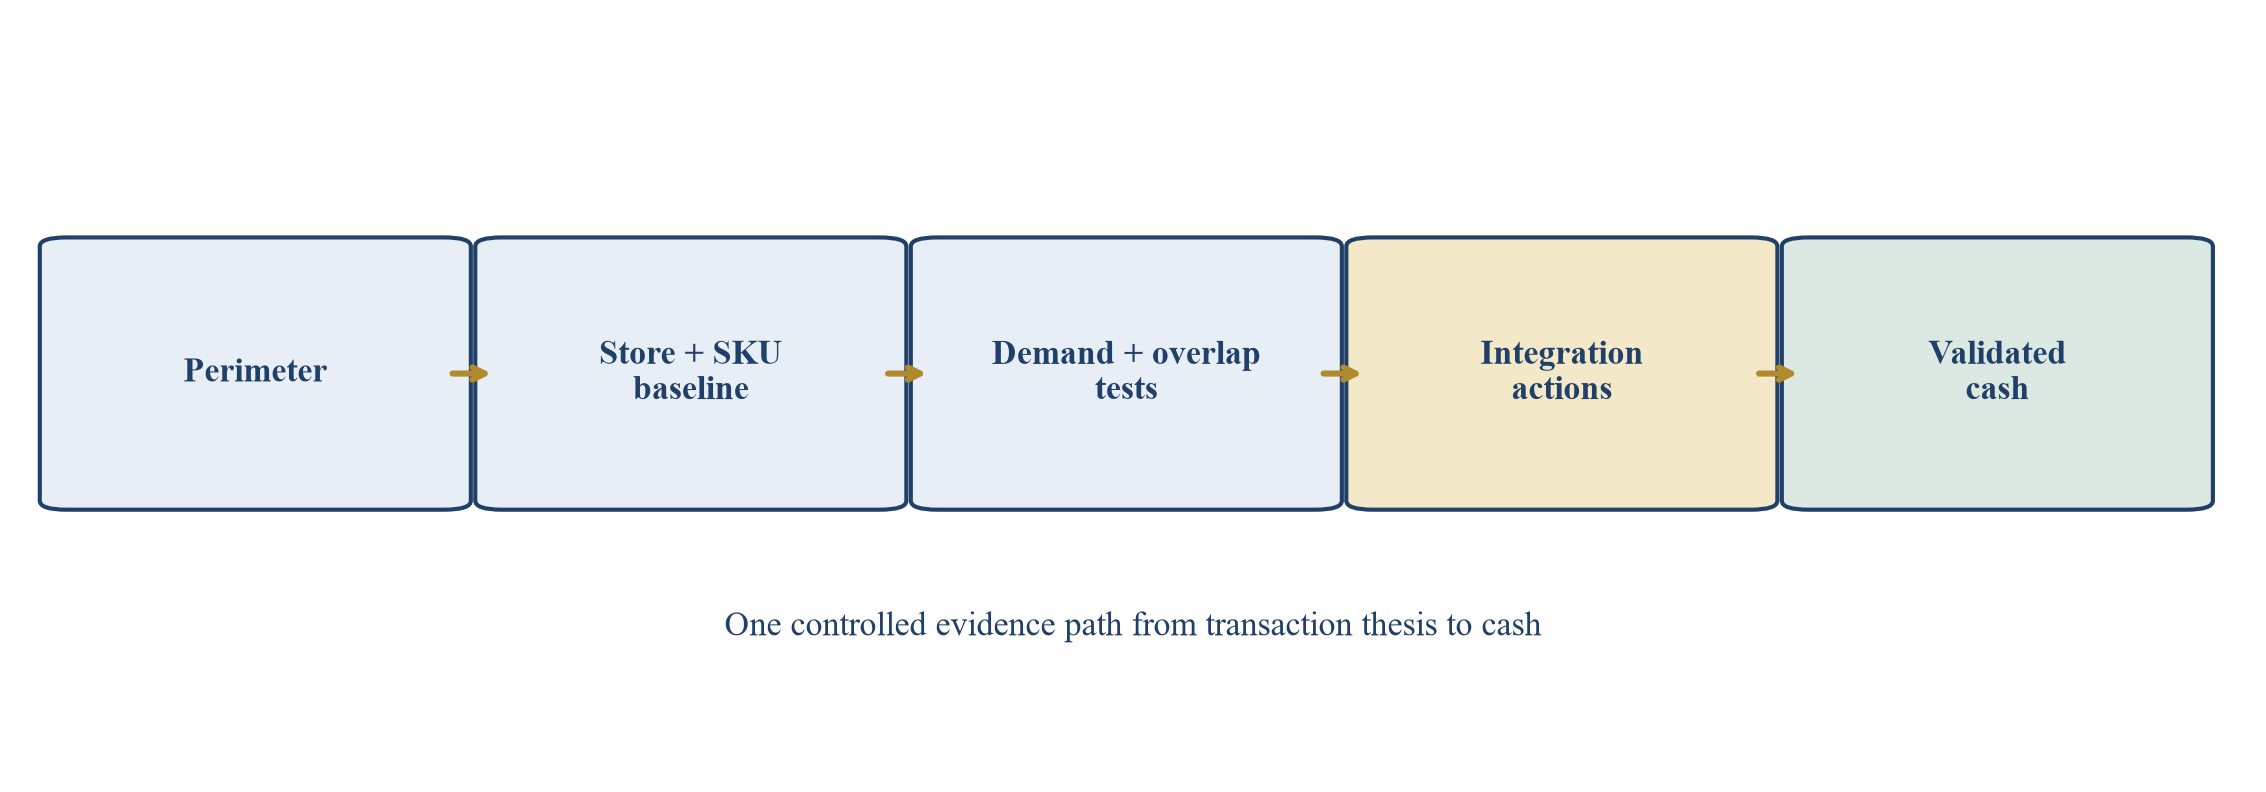
Management framework. The buyer preserves store, SKU, channel and inventory evidence through each decision gate.
2. Define the value perimeter before price
The deal team should define the value perimeter while the acquisition thesis is still capable of changing. The perimeter states which benefits belong to the target on a standalone basis, which arise only from ownership, which require a combination with the buyer and which depend on a future strategic option. This distinction protects the valuation from paying the seller for value that the buyer must fund and execute.
Standalone value includes the target's maintainable cash flows under a credible independent plan. Improvements already funded, contracted or controlled by the target may belong in that plan when the evidence supports them. Ownership value arises from capabilities or decisions available to the buyer after completion. Combination value depends on interaction between the businesses. Option value depends on future choices whose timing, probability and capital requirements remain uncertain. The board should see these categories separately.
The value perimeter also defines exclusions. General market growth, inflation, currency movement and a recovery already embedded in forecasts do not become acquisition synergies merely because results improve after closing. Financing choices should remain visible as financing effects. Purchase-accounting movements and consolidation eliminations can change reported results without representing operating value. A rigorous perimeter prevents these effects from being credited to integration teams.
Price discipline requires a sharing rule. The buyer may transfer part of expected value to the seller to secure control, address competition or reflect negotiating leverage. The investment committee should approve the maximum seller share under base and downside cases. A deal can remain strategically attractive while becoming financially unattractive because too much future value has been capitalised into the offer.
| Value category | What it represents | Evidence required | Treatment in price |
|---|---|---|---|
| Standalone value | Maintainable target cash flows without buyer action | Historical quality, contracts, forecast drivers and required investment | Primary valuation base |
| Target-controlled improvement | Action already funded and controlled by the target | Approved plan, owner, capacity and dated milestones | Probability-weighted within standalone plan |
| Ownership value | Benefit available because the buyer controls capital or decisions | Legal ability, authority, implementation plan and cost | Buyer value; seller share explicitly approved |
| Combination value | Benefit from integrating buyer and target capabilities | Joint baseline, dependency map and operating design | Buyer value after cost and dis-synergy |
| Strategic option | Future choice created by ownership | Trigger, capital requirement, expiry and scenario value | Separately disclosed; normally excluded from base case |
| Market movement | External change affecting both businesses | Independent market evidence | Kept outside synergy reporting |
The classification is approved before the final offer and revisited when diligence changes the evidence.
3. The anatomy of a retail value record
Each retail value record should be capable of independent challenge. The title describes an operating outcome rather than a broad aspiration. The baseline identifies the relevant quantity, period, perimeter and source. The counterfactual states what management expects without the initiative. The formula explains how the benefit is calculated. The owner controls delivery; the finance owner controls measurement. Dependencies state what must occur first. Implementation cost, working capital, tax and capital expenditure connect the initiative to cash.
The baseline is often the weakest field. Historical cost can be distorted by one-off activity, foreign exchange, related parties, temporary vacancies, deferred maintenance or inconsistent allocation. Revenue baselines require customer, product, geography, channel, price, volume and retention detail. Procurement baselines require quantities, specifications, supplier terms and rebates. Workforce baselines require filled roles, vacancies, contractors, incentives and statutory obligations. Finance should approve the baseline before the initiative receives value credit.
The counterfactual is equally important. Results after closing combine the initiative with market changes, standalone performance, management action and random variation. A measured saving against an obsolete budget can overstate value. A measured revenue gain against the prior year can understate value when the market declines. The ledger records the method selected: frozen baseline, indexed baseline, matched control, unit economics, cohort analysis or another approved approach.
Evidence matures through stages. A hypothesis can enter the ledger during target screening. Diligence adds source documents and management access. The integration plan identifies actions and resources. Delivery evidence shows contracts, headcount, pricing decisions, migrated customers or changed processes. Finance validates the calculation. The board receives the current confidence stage rather than one undifferentiated headline number.
| Field | Control question | Typical evidence |
|---|---|---|
| Initiative identity | Is this one distinct source of value? | Unique identifier, workstream and description |
| Baseline | What amount exists before the action? | Source-system extract, contract, payroll or invoice data |
| Counterfactual | What would occur without the action? | Approved forecast, index or comparison cohort |
| Formula | How is value calculated? | Volume, price, cost, timing and probability rules |
| Ownership | Who delivers and who validates? | Executive owner, workstream owner and finance controller |
| Dependencies | Which decisions or systems must occur first? | Legal, technology, customer, people and regulatory milestones |
| Cost to achieve | What cash and capacity are required? | Separation, integration, adviser, capex and retention budgets |
| Timing | When do run-rate and cash appear? | Monthly phasing and critical path |
| Risks and dis-synergies | What can reduce or delay value? | Attrition, disruption, stranded cost and execution scenarios |
| Evidence and approval | Why should the board rely on the number? | Source links, validation status and dated approvals |
Specialist evidence may add fields. Every material change retains its prior version and approval history.
4. Build a store, SKU, channel and promotion baseline
The baseline should preserve trading reality before integration changes it. Create a controlled data book at daily or weekly grain where available. At minimum, link legal entity, country, store, format, mall or catchment, brand, SKU, category, channel, transaction date, price, quantity, promotion, return, cost, supplier, inventory movement and customer cohort where lawful. Reconcile the resulting sales and margin totals to financial reporting and explain residual differences.
Store cohorts prevent averages from concealing incompatible formats. Group stores by country, city, catchment, format, maturity, size, lease structure, brand, opening vintage and trading pattern. New stores should not be compared directly with mature stores. A flagship in a destination mall follows a different demand curve from a neighbourhood convenience store. Online orders attributed to a physical store require a stable allocation rule. Management should preserve original and adjusted cohort definitions so later results are reproducible.
SKU data needs an economic hierarchy. Product identifiers, pack sizes, units of measure and category trees often differ between buyer and target. Build a crosswalk that retains the source code and maps comparable products without forcing false equivalence. A branded exclusive, private-label item and commodity substitute may sit in one category while carrying different demand, margin and customer roles. The crosswalk should record confidence, owner and approval.
Promotions alter both baseline demand and gross margin. Record regular price, promotional price, mechanic, funding source, dates, eligible channel, media support, supplier contribution, stock availability, returns and post-promotion performance. A demand spike created by a supplier-funded campaign should not become an untreated forecast baseline. Promotion calendars also interact with Ramadan, Eid, tourism, school terms, weather and country-specific events. Forecast features should preserve these causes rather than treating the dates as interchangeable seasonality.
Inventory requires quantity, cost, age, location, status, sell-through, expected markdown, returns, supplier rights, expiry or obsolescence where relevant and transfer restrictions. Reconcile perpetual records to counts and financial ledgers. Missing or inconsistent fields become an explicit coverage measure. Management can proceed with a scenario range; it should not relabel data gaps as observed performance.
| Evidence domain | Minimum fields | Primary transaction question | Typical failure signal |
|---|---|---|---|
| Store | country, catchment, format, size, maturity, lease and trading calendar | Which locations are comparable and which overlap? | averaged sales across unlike stores |
| SKU and category | product, hierarchy, pack, supplier, cost, price and margin | Which products are truly comparable? | forced crosswalk or missing unit conversion |
| Channel | store, web, app, marketplace, fulfilment origin and returns | Where was demand generated and served? | double attribution of omnichannel sales |
| Promotion | mechanic, funding, dates, discount and media support | What demand was temporary or subsidised? | spike treated as organic baseline |
| Customer cohort | lawful identifier, acquisition source, activity and channel | Is revenue incremental, transferred or retained? | overlap hidden by group totals |
| Inventory | quantity, age, status, sell-through, markdown and location | What working capital and loss risk travels with the deal? | cost value treated as recoverable cash |
The required grain depends on format and systems. Each field retains a source, owner, definition and quality test.
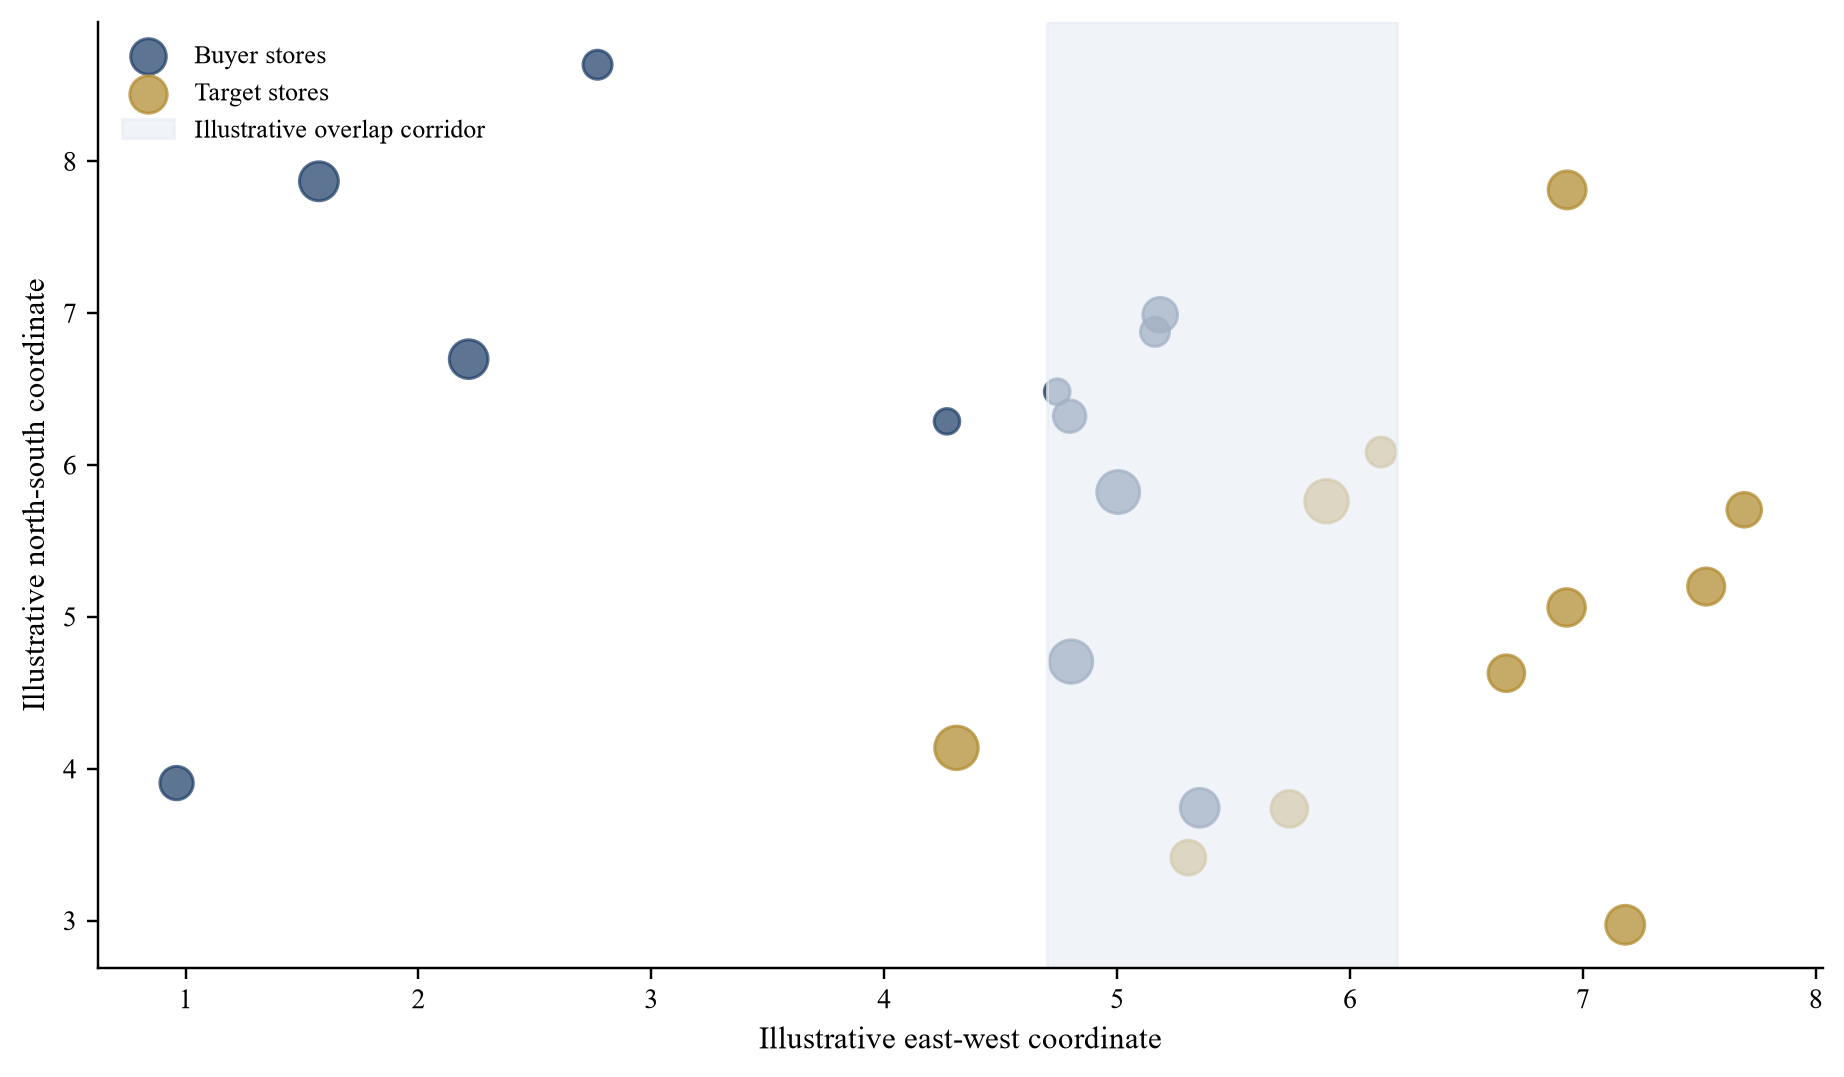
Coordinates and contribution values are modelling assumptions. Bubble size represents indexed contribution.
5. Forecast demand as a range and preserve model error
Demand forecasting should begin with the commercial decision it informs. Store replenishment, assortment selection, integration timing, warehouse capacity and purchase-price discipline use different horizons and loss functions. A model that performs well on monthly category revenue may still be unsuitable for daily SKU replenishment. Define the forecast grain, horizon, refresh frequency, error measure and action before comparing algorithms.
Construct a transparent baseline model first. Seasonal naive, moving average and simple exponential-smoothing models provide useful challengers. Add causal features only when they are available at decision time and have a credible relationship with demand. Calendar, price, promotion, local events, weather, store closure, stock availability and channel migration can matter. A feature known only after the period creates leakage and an unrealistically favourable back-test.
Separate unconstrained demand from observed sales. A store that sold zero units after a stock-out did not necessarily face zero demand. Lost-sales estimation remains uncertain, so show a range and the method used. Returns, cancellations and fulfilment substitutions also affect observed quantity. When the target and buyer use different definitions, retain both source fields and the reconciliation.
Back-test by rolling origin and by decision cohort. Report bias, mean absolute error and a scale-independent measure suited to the data. Weighted aggregate error can conceal failure on high-margin, strategic or volatile products. Present error by store maturity, product velocity, promotion regime and channel. Compare the proposed model with the simple challenger and record when management overrides the output.
Forecast uncertainty belongs in the transaction model. A base case can use the central range, while downside cases apply demand, margin and timing shocks consistent with observed error. Procurement and network synergies should reflect the risk that common inventory is ordered before assortment and demand are validated. The buyer should also model the liquidity effect of forecast error: excess purchases, markdown, supplier cancellation, warehouse use and slower cash conversion.
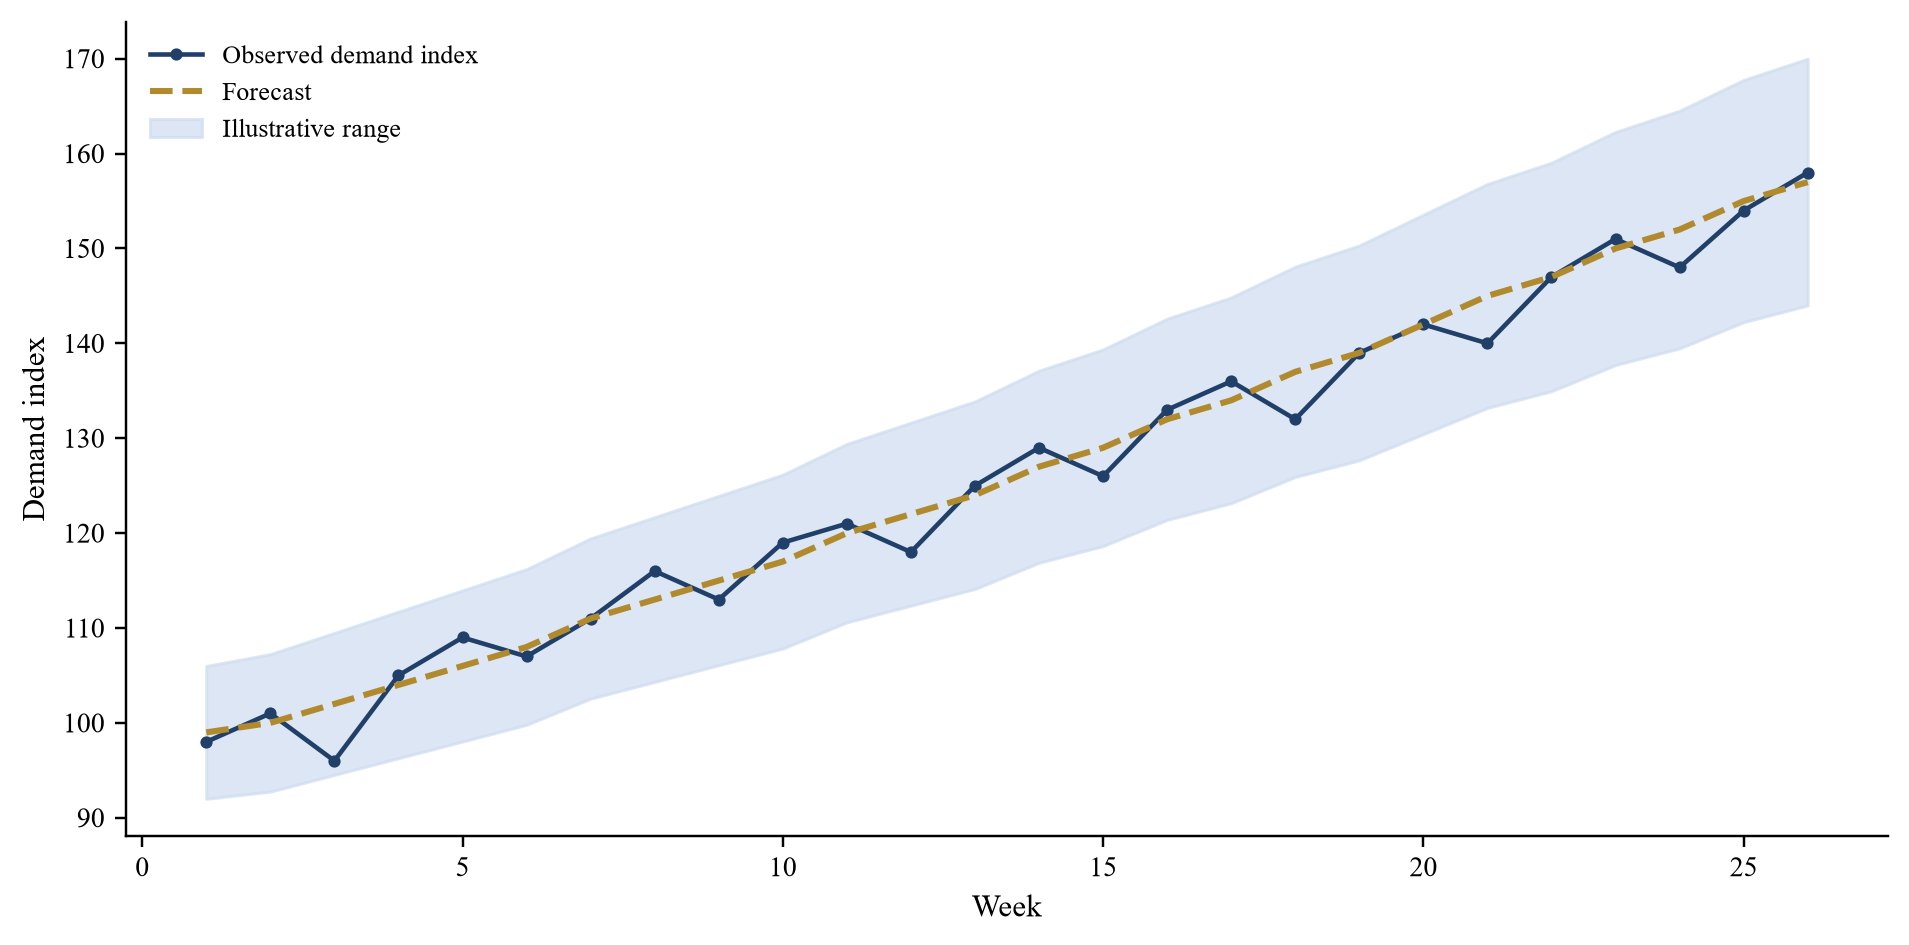
Indexed weekly demand. The values illustrate model governance and do not represent an actual retailer.
6. Measure cannibalisation before combining networks and channels
Cannibalisation occurs when an action shifts demand from one part of the combined group to another. It may be rational if the shift improves contribution, retention or capital efficiency. It can destroy value when the buyer counts transferred sales as incremental growth, retains duplicate fixed costs or closes a store whose customers do not migrate as assumed. The analysis should distinguish customer transfer, category substitution, channel migration and genuine market expansion.
Map geographic exposure using catchments rather than straight-line distance alone. Travel time, mall role, public transport, parking, customer mission, brand positioning and delivery coverage can shape overlap. Define exposed pairs before observing the post-action result. Then compare changes in exposed cohorts with less-exposed stores or products that faced similar market conditions. A matched-cohort or difference-in-differences design can strengthen attribution when its assumptions are credible and documented.
Customer overlap can be measured only within lawful and permitted data use. Use privacy-preserving identifiers where appropriate and minimise personal data. Compare active customers, visit frequency, basket, gross margin, promotion dependence, returns and channel migration. A loyalty match can understate anonymous trade and overstate the representativeness of enrolled customers. State coverage and bias rather than extrapolating silently.
Product cannibalisation requires a substitution map. Identify which SKUs, price points, pack sizes, brands and private-label products compete for the same mission. Promotion tests should consider forward buying and post-promotion dips. A product that gains share inside the combined portfolio can still reduce total category contribution. Measure net incremental contribution after price, margin, markdown, media and fulfilment effects.
Competition analysis remains a separate workstream. Saudi Arabia's General Authority for Competition defines economic concentration broadly and examines control and competitive effects under its law and guidelines.[5] The UAE's Federal Decree-Law No. 36 of 2023 and its 2026 executive regulations govern competition and economic-concentration procedures in the UAE.[6][7] Internal overlap analysis can inform diligence and remedy planning; qualified competition counsel should determine notification, market definition, evidence and legal conclusions.
| Decision | Unit of analysis | Core comparison | Value measure | Guardrail |
|---|---|---|---|---|
| open or retain nearby stores | store-week and catchment | exposed pair versus matched stores | incremental contribution after fixed cost | service level and customer loss |
| combine assortments | SKU-store-week | substituted range versus control range | net category contribution and turns | availability and brand role |
| merge digital channels | customer-channel-month | migration cohort versus stable cohort | retained gross profit after fulfilment | consent, privacy and experience |
| align promotions | SKU-promotion-event | treated event versus comparable event | incremental margin after funding | post-event demand and stock |
| close a store | customer and catchment cohort | retained, migrated and lost demand | cash contribution after exit cost | lease, people and reputation |
The buyer should predefine exposed and comparison cohorts and preserve the assumptions used.
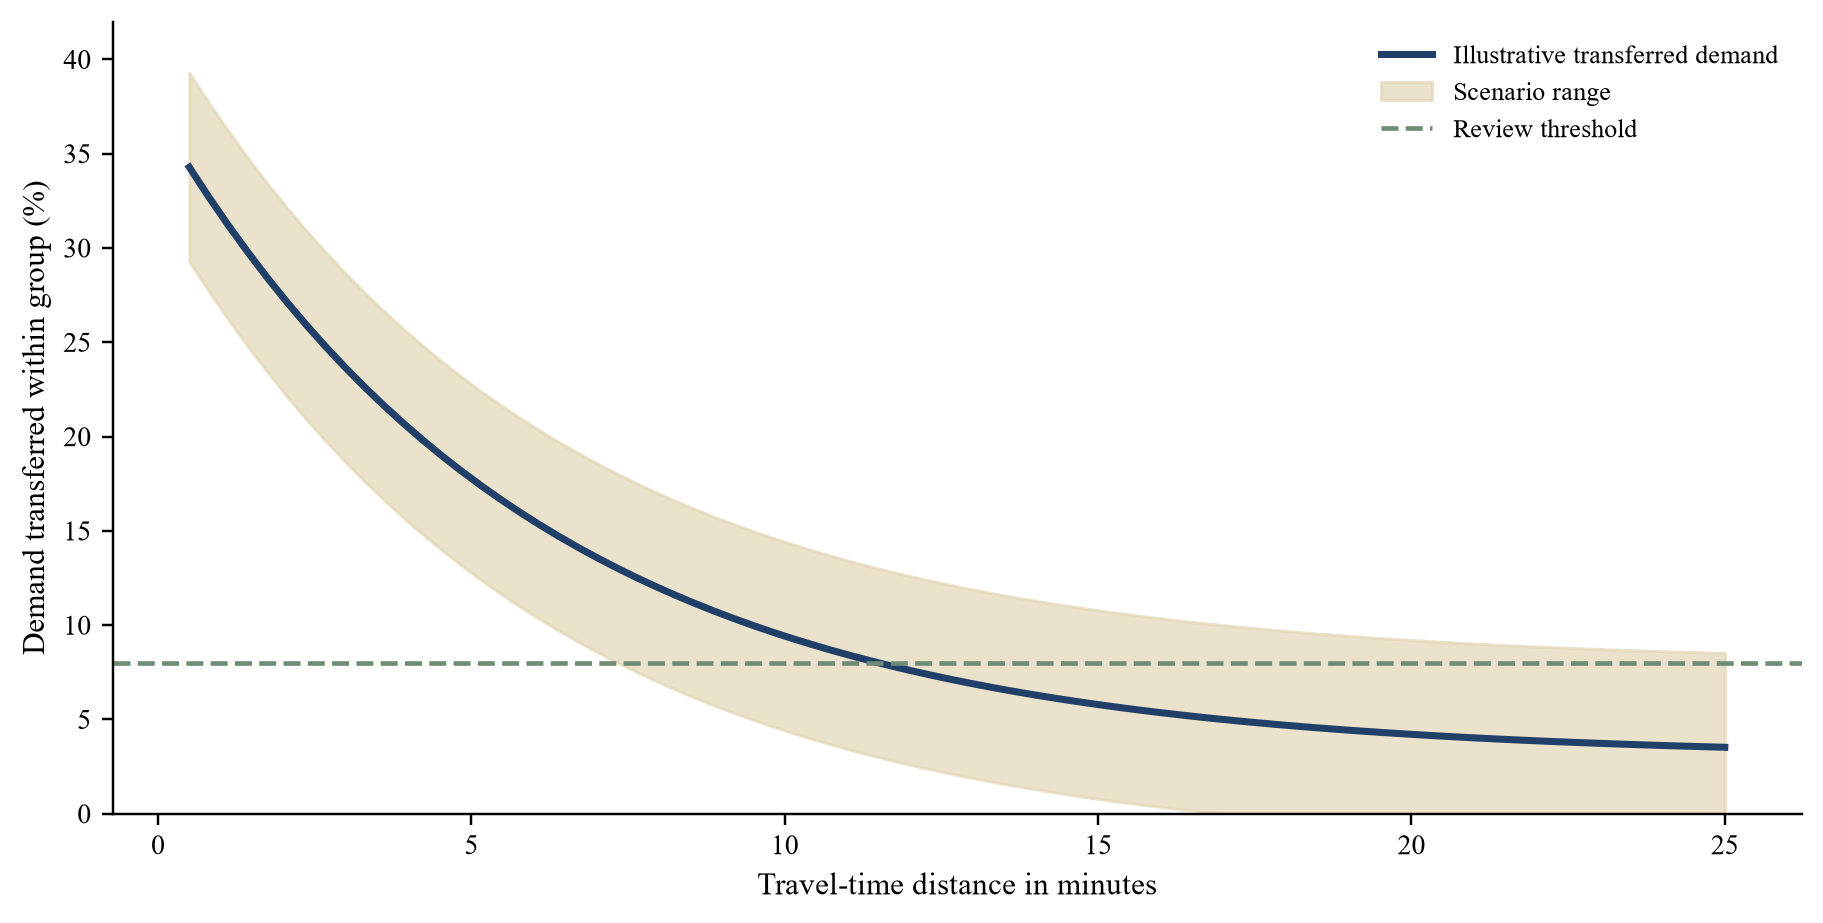
The curve is a modelling illustration. Distance does not determine causation on its own.
7. Connect the ledger to valuation and the agreement
The transaction model and the retail integration evidence ledger should share identifiers. Every synergy line in the valuation links to a ledger record. The model carries gross value, probability, timing, tax, implementation cost and terminal assumptions. The board can therefore remove, delay or resize an initiative and see the price and return effect. A model line labelled simply synergies prevents meaningful challenge.
The buyer should calculate the net present value of executable initiatives and compare it with the premium. The comparison includes downside cases and the approved seller share. A premium can be covered in the base case while failing under modest delay or attrition. The board should know the number of initiatives on which the return depends and whether they share common dependencies.
Diligence findings flow into both the ledger and the sale and purchase agreement. A customer dependency can influence a condition, warranty, indemnity, covenant, escrow or contingent consideration. A working-capital opportunity can influence the completion mechanism. A management dependency can influence retention or deferred value. Counsel determines legal drafting; the ledger retains the commercial rationale and quantification.
The agreement can also protect the measurement environment. Pre-completion conduct covenants, access rights, information obligations and restrictions on leakage preserve the baseline. Earn-out measures require precise definitions, accounting policies, decision rights and dispute procedures. The ledger should never substitute for the agreement, while it can reveal where the agreement needs economic precision.
| Evidence issue | Valuation response | Potential transaction response | Ownership response |
|---|---|---|---|
| Customer concentration | Downside revenue and margin case | Consent, retention-linked consideration or protection | Executive sponsor and account plan |
| Unverified procurement saving | Lower probability and delayed timing | Information access and conduct covenant | Category diligence and supplier negotiation |
| Working-capital deficit | Equity-value and liquidity adjustment | Completion accounts and normal-level definition | Daily cash and collections control |
| Key-person dependency | Lower cash-flow confidence | Retention, deferred value or condition | Delegation, documentation and succession |
| Systems separation | Cost and schedule increase | Transitional services and milestone protection | Migration office and continuity testing |
| Regulatory remedy risk | Reduced or excluded combination value | Condition precedent, long-stop and conduct rules | Standalone capability until approval |
Qualified legal, tax and accounting advisers determine the appropriate mechanism for each transaction.
8. Govern Day One and the first 100 days
Day One should preserve the evidence required to manage value. Finance locks the baseline data, integration leadership confirms owners, and management communicates the decision cadence. Critical customer, supplier, people, technology and cash controls become active. The ledger distinguishes initiatives that can start immediately from those restricted by legal separation, consultation, regulatory approval, contract or system readiness.
The first 100 days convert hypotheses into executable plans. Each initiative receives a charter with scope, owner, milestones, resources, risks and acceptance criteria. A value-capture office consolidates workstream reports, resolves duplicates and tests dependencies. Finance validates the baseline and reporting method before a benefit becomes part of the committed forecast.
Initiative sequencing matters. A rapid systems consolidation can jeopardise customer continuity. A procurement action can require product requalification. Workforce change can remove the people needed for migration. The ledger records dependency links so the steering committee sees the value at risk when one milestone moves. The programme should protect franchise value before accelerating extraction.
Management incentives should use measures within the executive's control and should not reward gross opportunity. The board can combine delivery milestones, validated run-rate, realised cash and operating-health indicators. Customer retention, service, safety, compliance and employee continuity provide guardrails. Remuneration decisions remain subject to applicable governance, employment and disclosure requirements.
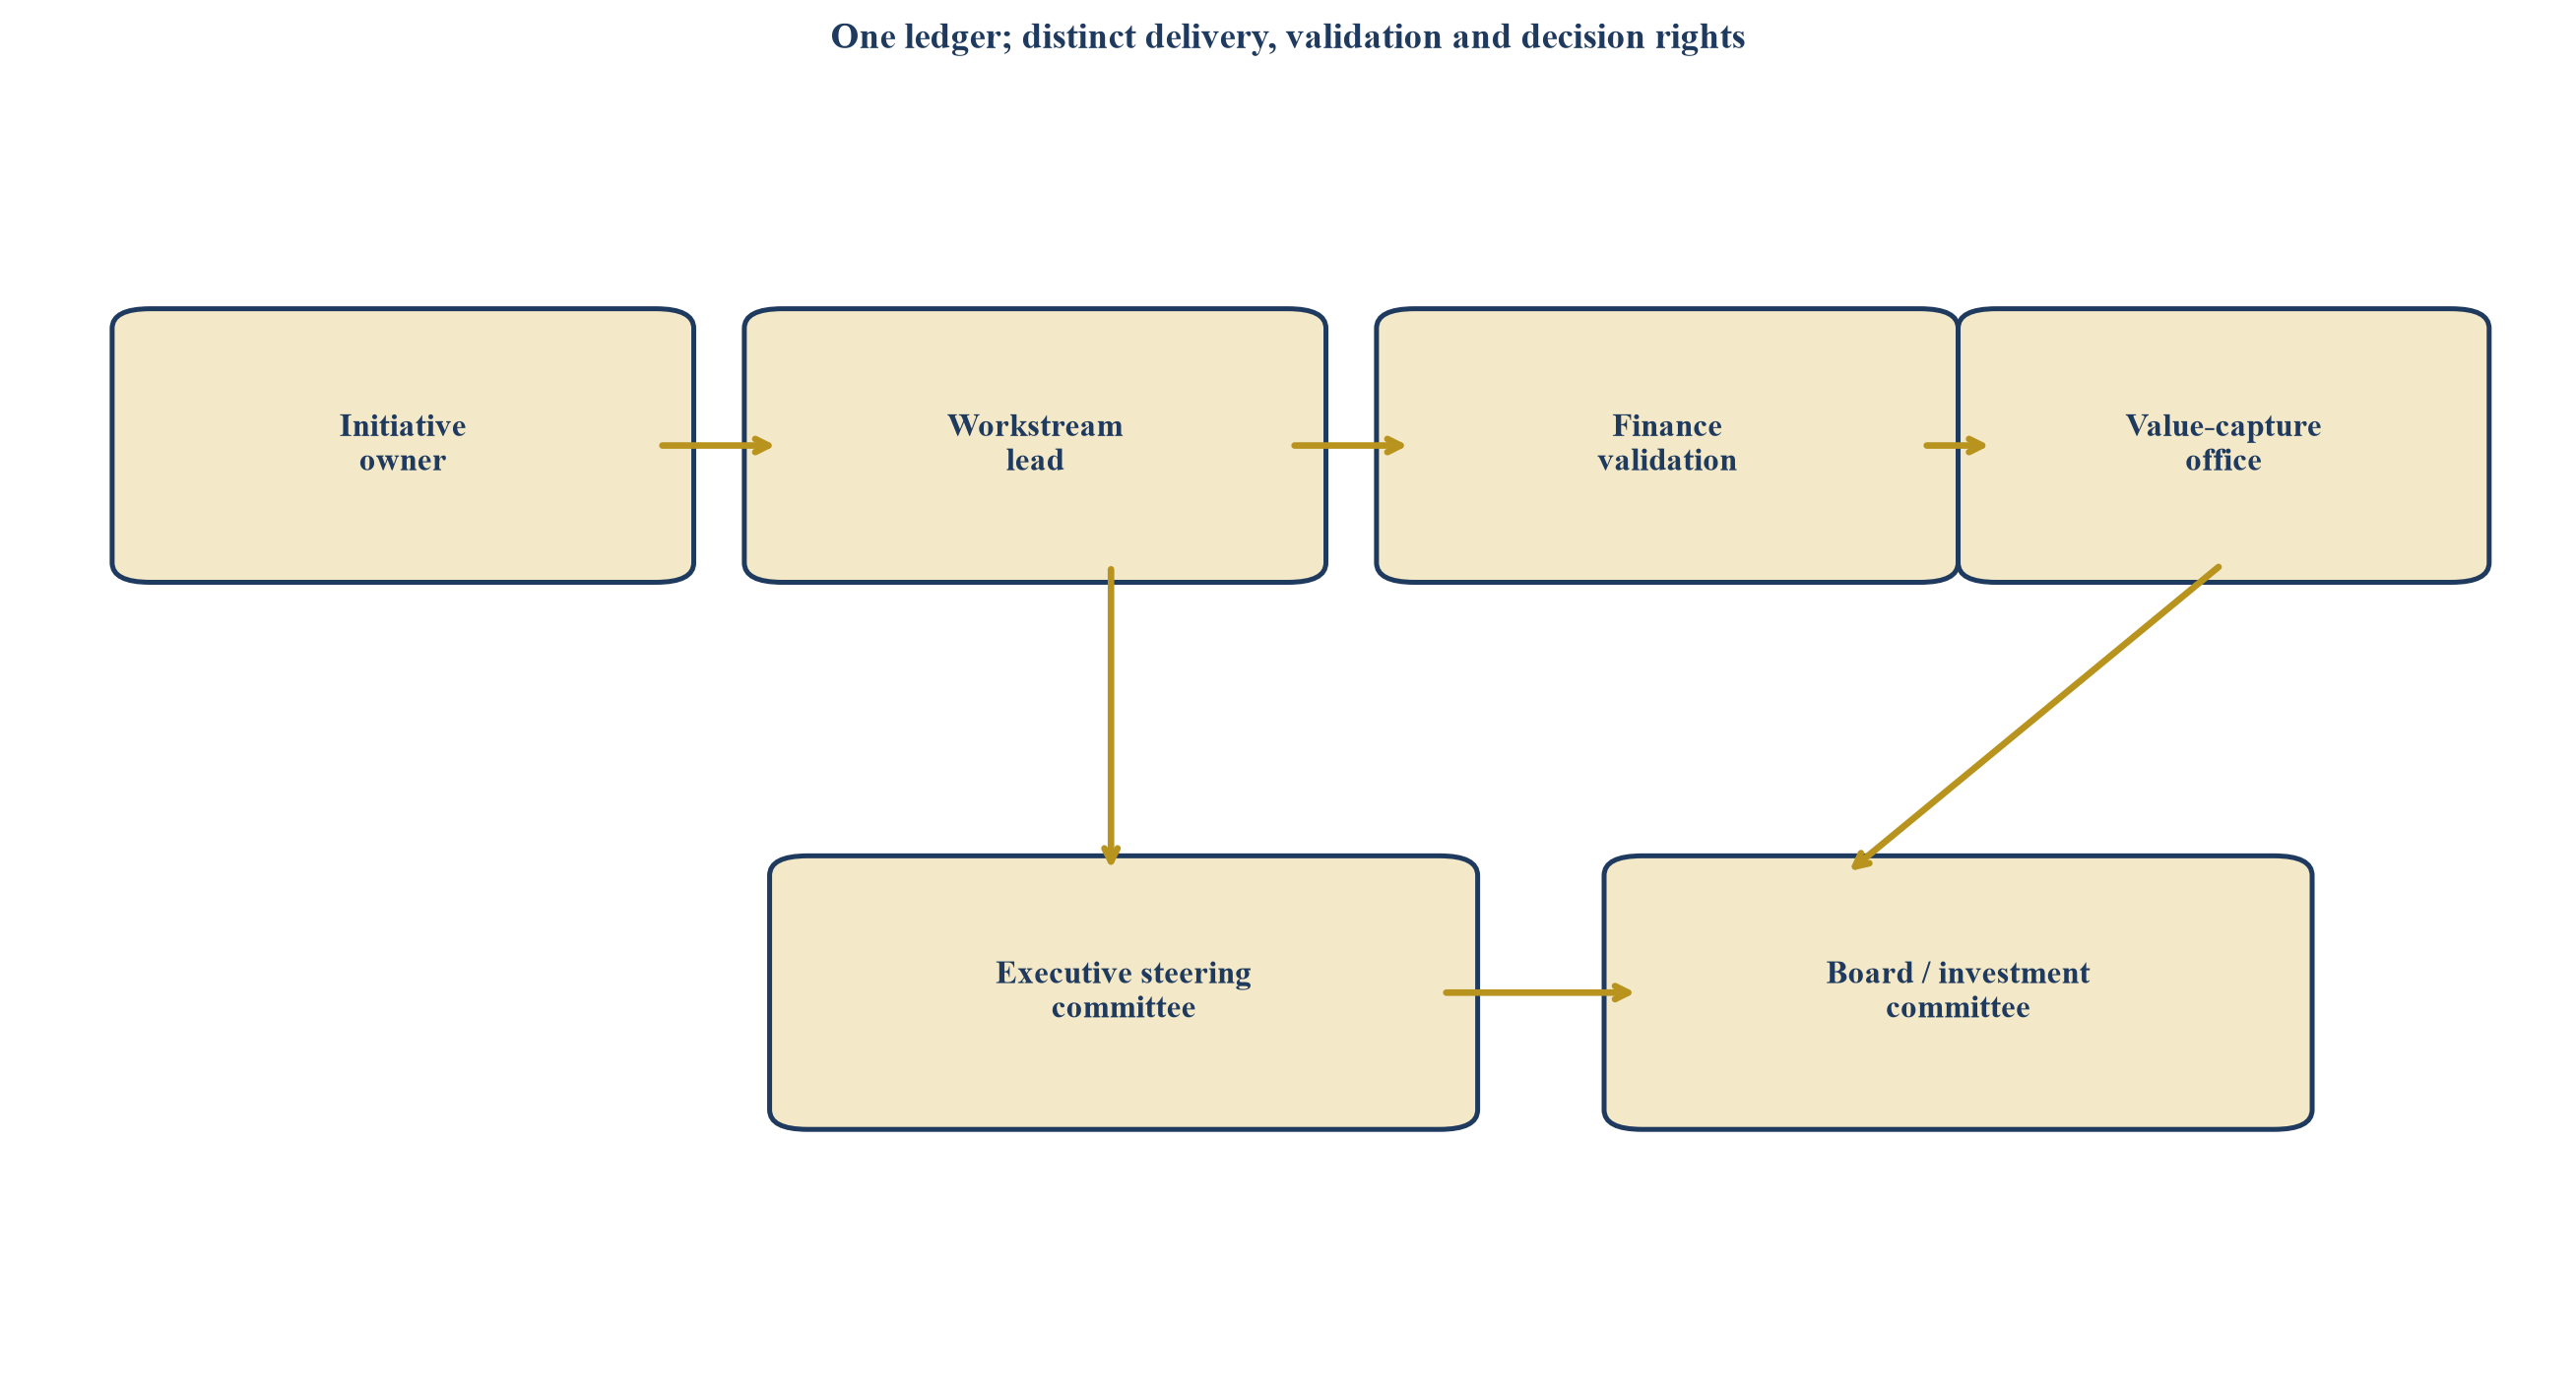
Management framework. Finance validates measurement while executive owners remain accountable for operating delivery.
9. Report run-rate, accounting result and realised cash
The monthly board bridge should start with the original approved deal case. It then shows diligence changes, Day-One corrections, scope changes, delivery variance, timing variance, implementation cost, dis-synergy, realised cash and revised forecast. Original value is never overwritten. The bridge explains why the current case differs and which decision is required.
Run-rate measures the current annualised effect of an initiative. It can provide an early signal while remaining vulnerable to seasonality, temporary action and incomplete cost. Accounting results follow the group's reporting policies and may include acquisition accounting, amortisation, impairment, restructuring and consolidation effects. Realised cash connects operating change to actual receipts, payments, capital and tax. The board should receive all three with clear definitions.
IFRS 3 establishes the acquisition method for business combinations, including recognition and measurement of identifiable assets and liabilities and goodwill. IAS 36 requires goodwill to be tested for impairment at the relevant cash-generating-unit level and sets the recoverable-amount framework. The management ledger does not determine accounting treatment. It can strengthen the evidence used to compare acquisition objectives, operating performance and recoverability, while qualified accountants and auditors retain their responsibilities.
The ledger should reconcile to management reporting at defined control points. Revenue initiatives reconcile to invoices and customer records. Procurement initiatives reconcile to contracts, purchase orders and received quantities. Workforce initiatives reconcile to payroll and organisation records. Working-capital initiatives reconcile to ledgers and bank movement. Finance records residual differences and does not force an allocation where evidence is insufficient.
| Measure | Original case | Current approved | Delivered to date | Board question |
|---|---|---|---|---|
| Gross opportunity | Initial estimate | Evidence-adjusted potential | Not applicable | Has the opportunity changed? |
| Committed run-rate | Approved initiatives | Latest executable forecast | Validated annualised effect | Which dependencies threaten delivery? |
| Cost to achieve | Deal-case budget | Current funded forecast | Cash spent and committed | Is remaining value funded? |
| Dis-synergies | Downside allowance | Current quantified forecast | Observed effect | Which franchise risks require action? |
| Realised cash | Deal-case phasing | Current cash forecast | Bank- and ledger-supported effect | Does cash support the investment thesis? |
| Net present value | Approved valuation | Reforecast using current timing | Not a period measure | Does expected value still cover the premium? |
Values remain in original, approved and current columns so the board can see changes through time.
10. A retained value-capture office
A retained value-capture office provides continuity from diligence through ownership. The office maintains the ledger, baseline book, dependency map, meeting cadence, decision log and board bridge. It coordinates workstreams and specialist input while leaving operating accountability with management and accounting conclusions with finance and auditors.
The retained model is useful when the buyer has several portfolio companies, an active acquisition pipeline or limited permanent integration capacity. The team can preserve methods and lessons across transactions, maintain comparable definitions and help management focus on a small number of material decisions. The retainer should define capacity, deliverables, exclusions, confidentiality, conflicts, specialist budgets, response times and termination.
The weekly cadence includes initiative review, finance validation, risk and dependency resolution and steering decisions. The monthly cadence adds a full bridge to the approved deal case. The office records what management accepted, which evidence was used and how the decision changed value. It should remain independent enough to challenge optimism and close enough to operations to understand constraints.
Success fees linked only to reported synergy can create measurement incentives. Commercial terms should support accurate reporting, timely challenge and durable value. Where performance-linked economics are used, definitions, baselines, validation and conflict management require particular care and compliance with applicable professional obligations.
| Cadence | Output | Decision enabled | Evidence of completion |
|---|---|---|---|
| Continuous | Controlled retail integration evidence ledger and source index | Current view of each initiative | Version history and linked evidence |
| Weekly | Dependency, risk and decision pack | Resource and sequencing action | Named decision, owner and due date |
| Monthly | Original-to-current value bridge | Board challenge and corrective action | Approved bridge and forecast |
| Gate-based | Baseline, charter and validation approvals | Move from hypothesis to committed plan | Dated finance and executive approval |
| Quarterly | Premium coverage and cash review | Capital allocation and impairment indicators | Updated downside and recoverability evidence |
| Post-programme | Benefits review and lessons register | Improve the next acquisition | Closed initiatives and retained evidence |
The exact scope depends on transaction size, management capacity, reporting systems and regulatory context.
11. Work through a hypothetical GCC retail roll-up
Consider a hypothetical GCC family group acquiring a multi-brand retailer for an enterprise value of AED 720 million. The target operates 96 stores across three countries and an e-commerce channel. The buyer operates 142 stores, with partial geographic and category overlap. These amounts and operating facts are assumptions created solely to demonstrate the framework.
The initial transaction case includes AED 64 million of gross annual run-rate opportunity: AED 24 million from purchasing, AED 16 million from store and support overlap, AED 12 million from cross-sell and channel migrationing and loyalty, AED 8 million from inventory productivity and AED 4 million from technology and other efficiencies. The deal model initially presents these amounts as five lines. The retail integration evidence ledger converts them into 31 initiatives tied to specific categories, stores, cohorts, systems and actions.
The baseline review changes the case. A portion of apparent purchasing scale uses unlike specifications and cannot be consolidated without changing the offer. Several supplier rebates depend on brand-level volume and would be lost under a common contract. Seven nearby stores have different customer missions, while six pairs show material cohort and category overlap. Online revenue was attributed differently by the two businesses, creating double-counting in the combined channel case. Inventory ageing also shows that part of the assumed working-capital release would arise from markdown rather than better turns.
The demand team back-tests store-category forecasts and retains simple challengers. The proposed model improves aggregate error in the hypothetical case, while performance is weaker for promoted seasonal products and new stores. The buyer therefore uses the model for scenario ranges and exception prioritisation. Purchasing commitments for those segments remain gated until trading evidence matures. Commercial leaders retain the right to override within recorded thresholds and must document the reason and expiry.
After review, evidence-adjusted gross opportunity is AED 43 million. Estimated cost to achieve is AED 29 million over twenty-four months. A downside case includes AED 11 million of temporary trading disruption, lost rebates, markdown and customer leakage. These are assumptions, not forecasts. The price committee removes unsupported value from the maximum offer, requires a working-capital mechanism and links selected integration actions to evidence gates.
Day One protects trading, payroll, supplier ordering, inventory ownership, returns, cybersecurity, pricing authority and customer service. Store closures and broad assortment harmonisation remain outside the first wave. During the first 100 days, management validates six purchasing initiatives, pilots two category changes and reviews the exposed store pairs. A location decision advances only after management can compare contribution, customer migration, lease cost and capacity under documented scenarios.
At Month 12, the hypothetical programme reports AED 27 million of validated annualised run-rate and AED 9 million of realised cumulative cash after implementation spending. The difference reflects timing, inventory investment and costs to achieve. The board bridge preserves the original AED 64 million claim, the AED 43 million evidence-adjusted case, the delivered amount and the remaining dependencies. One digital cross-sell and channel migration initiative is removed because lawful data combination and customer-consent requirements make the original case impracticable on the assumed timetable.
The example illustrates a broader principle. Forecasts and overlap models change the quality of the decision when they reveal where value depends on evidence. They do not manufacture synergy. Value receives credit after the buyer demonstrates an executable action, protects the retail franchise, reconciles the result and converts the effect into cash.
12. Sequence integration through five retail gates
Gate One protects continuity. Confirm legal entities, licences, payment acceptance, supplier ordering, inventory ownership, warehouse and store access, payroll, cybersecurity, returns, customer service and decision rights. Preserve the evidence required to reconstruct trading after closing. No model improvement compensates for interrupted operations.
Gate Two locks the baseline. Reconcile store, SKU, channel, promotion, supplier and inventory data to financial reporting. Approve cohort definitions, crosswalks, missing-data coverage and model limitations. The buyer can continue to use ranges where data remain incomplete; material claims should retain the associated uncertainty.
Gate Three validates demand and overlap. Back-test forecasts, test cohort stability, quantify customer and product overlap and model network scenarios. Competition counsel assesses legal implications independently. Commercial leaders approve which tests are decision-ready and which remain exploratory.
Gate Four pilots operating change. Run bounded assortment, promotion, procurement, fulfilment or network pilots with pre-agreed measures and stop conditions. Protect strategic brands and vulnerable customer journeys. Record implementation cost, temporary disruption and working-capital consequences alongside the benefit.
Gate Five scales and validates cash. Finance reconciles delivered effects to invoices, supplier records, payroll, inventory movements, credits, returns and bank receipts. Management updates the transaction case, impairment indicators and integration priorities. The board sees original, approved, current and realised values without overwriting the history.
The gate pack should remain compact enough to support a real decision. For every proposed action, show the stores and categories affected, evidence coverage, expected contribution, implementation cash, working-capital effect, customer and supplier exposure, model range, accountable owner and reversal route. A decision that changes price, assortment, staffing, store access or customer data should identify the authority and any required specialist review. Finance should preserve the calculation version used at approval. Integration management should record what occurred, when the action became effective and whether the stop condition was triggered. This record allows the board to distinguish a weak hypothesis from poor implementation and a delayed benefit from value that has disappeared.
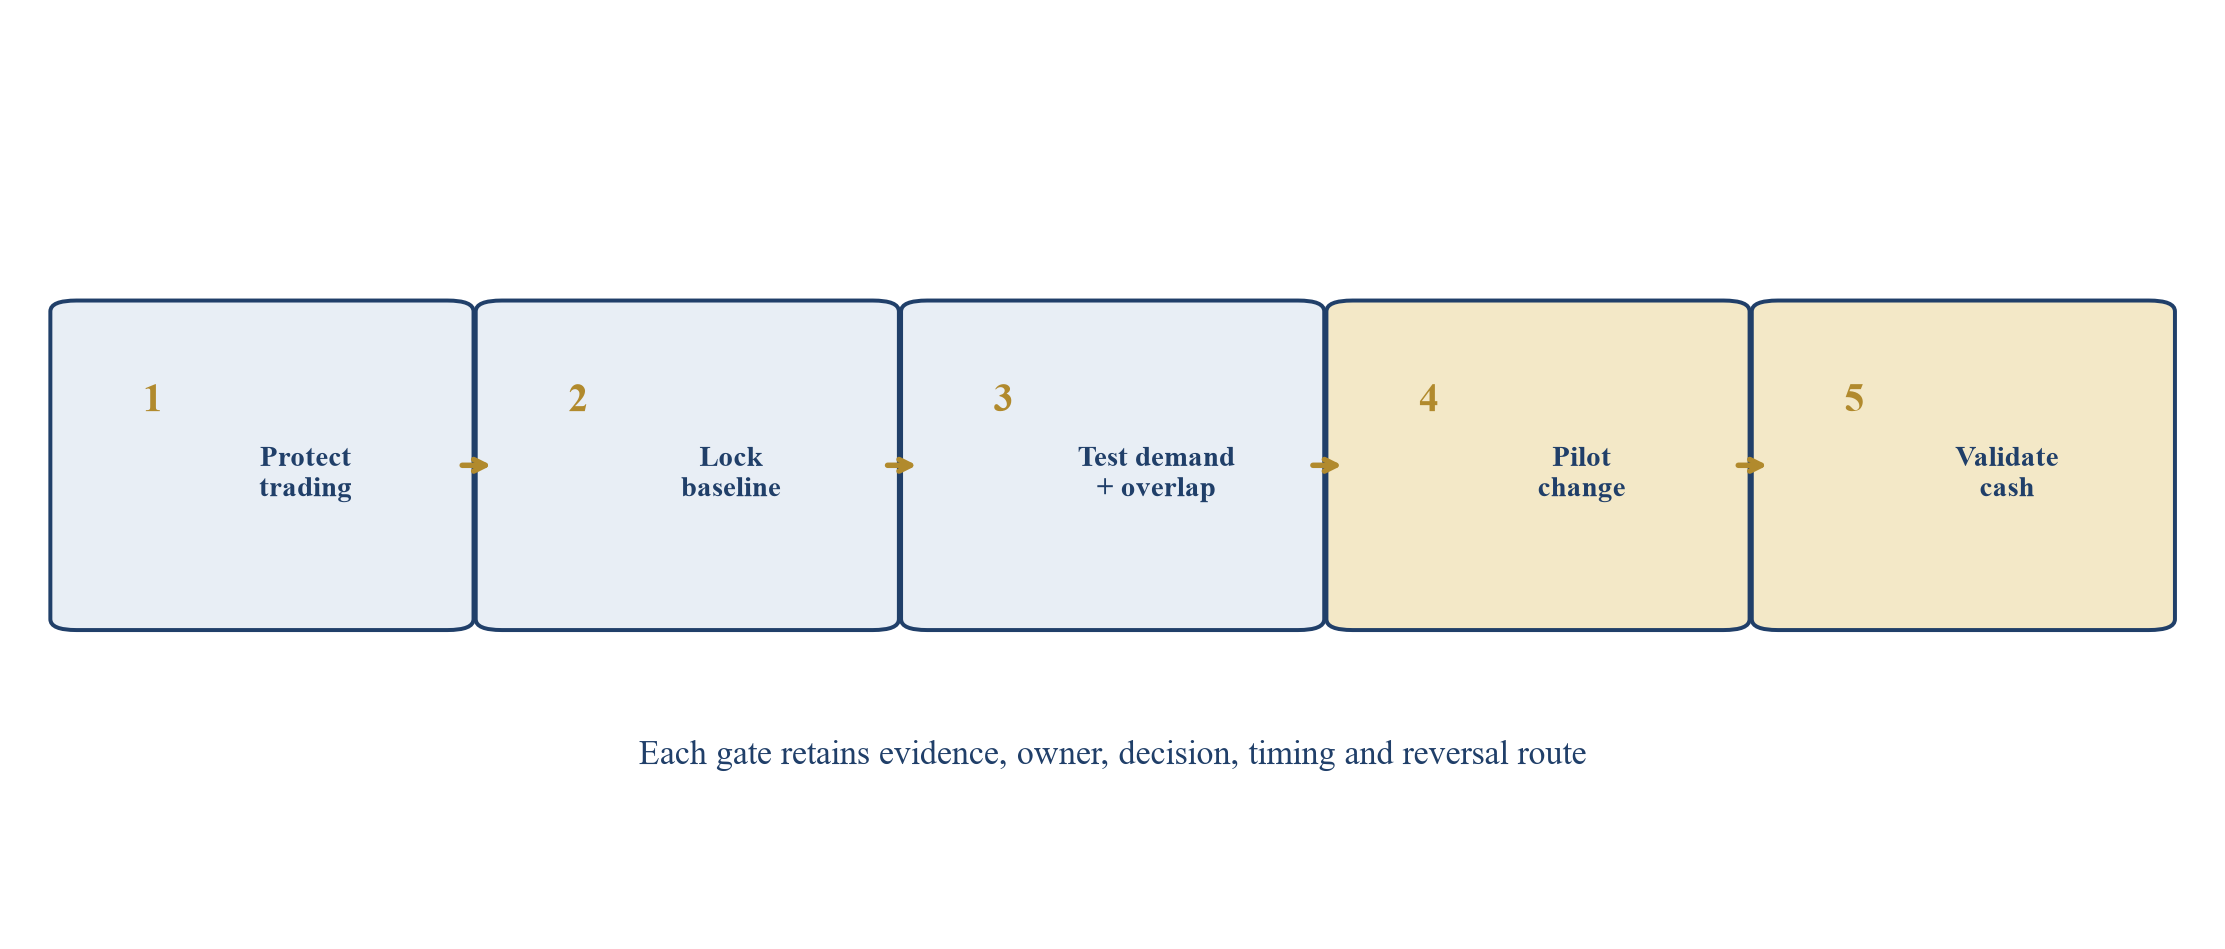
Management framework. The gate owner can pause or reverse an action when the required evidence is absent.
13. Limitations and further research
The framework is a management and transaction-control method. It does not determine fair value, accounting recognition, legal rights, competition approval, tax treatment, data-protection compliance or investment suitability.
Retail counterfactuals remain difficult. Weather, tourism, macroeconomic conditions, promotions, competitor action, store works, product availability and consumer preference can move together. A matched cohort may still differ in an unobserved way. Results should therefore be presented with the design, range, sensitivity and residual uncertainty.
Forecast performance can deteriorate when assortments, prices, channels or consumer behaviour change. Historical error provides evidence about prior conditions rather than a guarantee of future performance. The governance process should detect drift, preserve challengers and allow management to revert to a simpler method.
Further research could compare announced retail synergies with later cash delivery across GCC transactions, test network effects using store openings and closures, and examine how supplier terms, franchise rights and digital channels affect roll-up economics. Useful evidence would include transaction-level prices and quantities, inventory outcomes, promotion funding, customer migration and implementation costs. Access to such data is likely to remain restricted, making transparent transaction-specific analysis especially important.
14. Conclusion
A GCC retail roll-up should be underwritten at the level where value is created and lost. Store, SKU, channel, customer cohort, promotion, supplier and inventory evidence provide that level. Group averages and market growth cannot establish that a particular integration plan will create cash.
The retail integration evidence ledger converts each transaction claim into a controlled record with a baseline, counterfactual, formula, owner, dependency, cost, timing and evidence path. Demand forecasts and cannibalisation tests improve the decision when their errors, assumptions and coverage remain visible. Competition analysis, accounting conclusions and lawful data use retain their own professional decision rights.
Integration should advance through evidence gates: protect trading, lock the baseline, test demand and overlap, pilot operating changes and validate cash. The resulting board record shows what the buyer expected, what it paid, what management changed, which customers and assets were exposed, what evidence supports the result and which decision comes next.
Appendix A. Synergy Record Template. A1. Identity and economics
Initiative identifier, title, class and workstream.
Standalone baseline, approved counterfactual and source period.
Gross opportunity, executable value, timing and probability.
Implementation cost, working capital, capital expenditure, tax and cash profile.
Premium coverage and downside sensitivity.
Appendix A. Synergy Record Template. A2. Delivery and evidence
Executive owner, workstream owner and finance validator.
Dependencies, milestones, resources and acceptance criteria.
Customer, supplier, workforce, technology and regulatory guardrails.
Source links, calculation model, version history and approval dates.
Run-rate, accounting and realised-cash measures.
Appendix B. Board Gate Questions. B1. Before the binding offer
Which value belongs to the target without buyer action?
Which value requires control, combination or a future option?
Which initiatives have source-supported baselines and executable owners?
How much expected value has moved to the seller through the premium?
Does the downside case cover cost, dis-synergy, delay and common dependencies?
Appendix B. Board Gate Questions. B2. During ownership
Which changes from the original deal case are supported by new evidence?
Which initiative is material to premium coverage and exposed to delay?
How do validated run-rate, accounting result and realised cash differ?
Which dis-synergy or implementation cost requires board action?
Does the current evidence support the remaining acquisition thesis?
Sources
- General Authority for Statistics, Saudi Arabia. Wholesale and Retail Trade Statistics. Read the primary source
- General Authority for Statistics, Saudi Arabia. Methodology and Quality Report for Wholesale and Retail Trade Statistics. Read the primary source
- LuLu Retail Holdings PLC. Integrated Annual Report 2025. Read the primary source
- Cenomi Retail. Annual Report 2025 and financial information. Read the primary source
- General Authority for Competition, Saudi Arabia. Economic Concentration Review Guidelines. Read the primary source
- UAE Legislation. Federal Decree-Law No. 36 of 2023 Regarding Regulating Competition. Read the primary source
- UAE Legislation. Cabinet Resolution No. 59 of 2026 concerning the Executive Regulations of the Competition Law. Read the primary source
- IFRS Foundation. IFRS 3 Business Combinations. Read the primary source
- IFRS Foundation. IAS 2 Inventories and supporting implementation material. Read the primary source
- IFRS Foundation. IAS 36 Impairment of Assets. Read the primary source
- IFRS Foundation. IFRS 15 Revenue from Contracts with Customers. Read the primary source
- National Institute of Standards and Technology. Artificial Intelligence Risk Management Framework 1.0. Read the primary source
- National Institute of Standards and Technology. AI Risk Management Framework Playbook. Read the primary source
- GS1. Global Traceability Standard. Read the primary source
- UAE Government. Federal Decree-Law No. 14 of 2023 on Trading by Modern Technological Means. Read the primary source
- UAE Legislation. Federal Decree-Law No. 45 of 2021 Regarding the Protection of Personal Data. Read the primary source
- Saudi Data and Artificial Intelligence Authority. Personal Data Protection Law and implementing materials. Read the primary source
- Ellahie, A., Huang, X., Tuna, A. I., and Vincenzi, R. Are Merger Synergy Disclosures Credible? 2026. Read the primary source
- Paugam, L., Wang, Y., Stolowy, H., and Binder, C. The Construction of Financial Value: Crafting Synergy Estimates in Acquisitions. 2026. Read the primary source
- Hyndman, R. J., and Athanasopoulos, G. Forecasting: Principles and Practice. Read the primary source
- OECD. Competition Assessment Toolkit. Read the primary source
- World Bank. Global Economic Prospects and regional data resources. Read the primary source
