

1. Define the investible distribution claim
A GCC PropTech company becomes growth-equity ready when it can demonstrate that demand, contracting, implementation, adoption, renewal and expansion operate as a repeatable system. Early revenue can be valuable evidence, yet its interpretation depends on how the opportunity was originated and converted. A contract won through a founder's long-standing developer relationship may prove the product can solve a problem. It may provide limited evidence that a new sales team can reproduce the outcome with an unrelated buyer.
The investment claim should therefore state the commercial mechanism in operational terms. It should identify the target decision maker, problem, buying trigger, budget owner, sales motion, qualification standard, implementation burden, time to first value, renewal basis and expansion route. It should also state what share of the process still depends on a founder, sponsor, anchor shareholder, government introducer or developer group. This creates a testable proposition rather than a general assertion that the market is large.
The claim should distinguish access from conversion. A relationship can open a door, reduce perceived risk or accelerate procurement. Product value, implementation quality and user adoption determine whether the customer deploys, pays, renews and expands. A credible growth case shows that relationship-sourced opportunities pass through the same qualification, pricing, contracting, implementation and customer-success controls as independently sourced opportunities.
The investment committee should approve the evidence required before scale capital is released. Appropriate gates may include a minimum number of unrelated customers, a defined concentration ceiling, referenceable deployments, measured implementation margin, stable gross retention, positive expansion behaviour and at least one repeatable route into a second market. The specific thresholds should reflect the product and investor mandate. They should be fixed before capital is committed and tested against verified records.
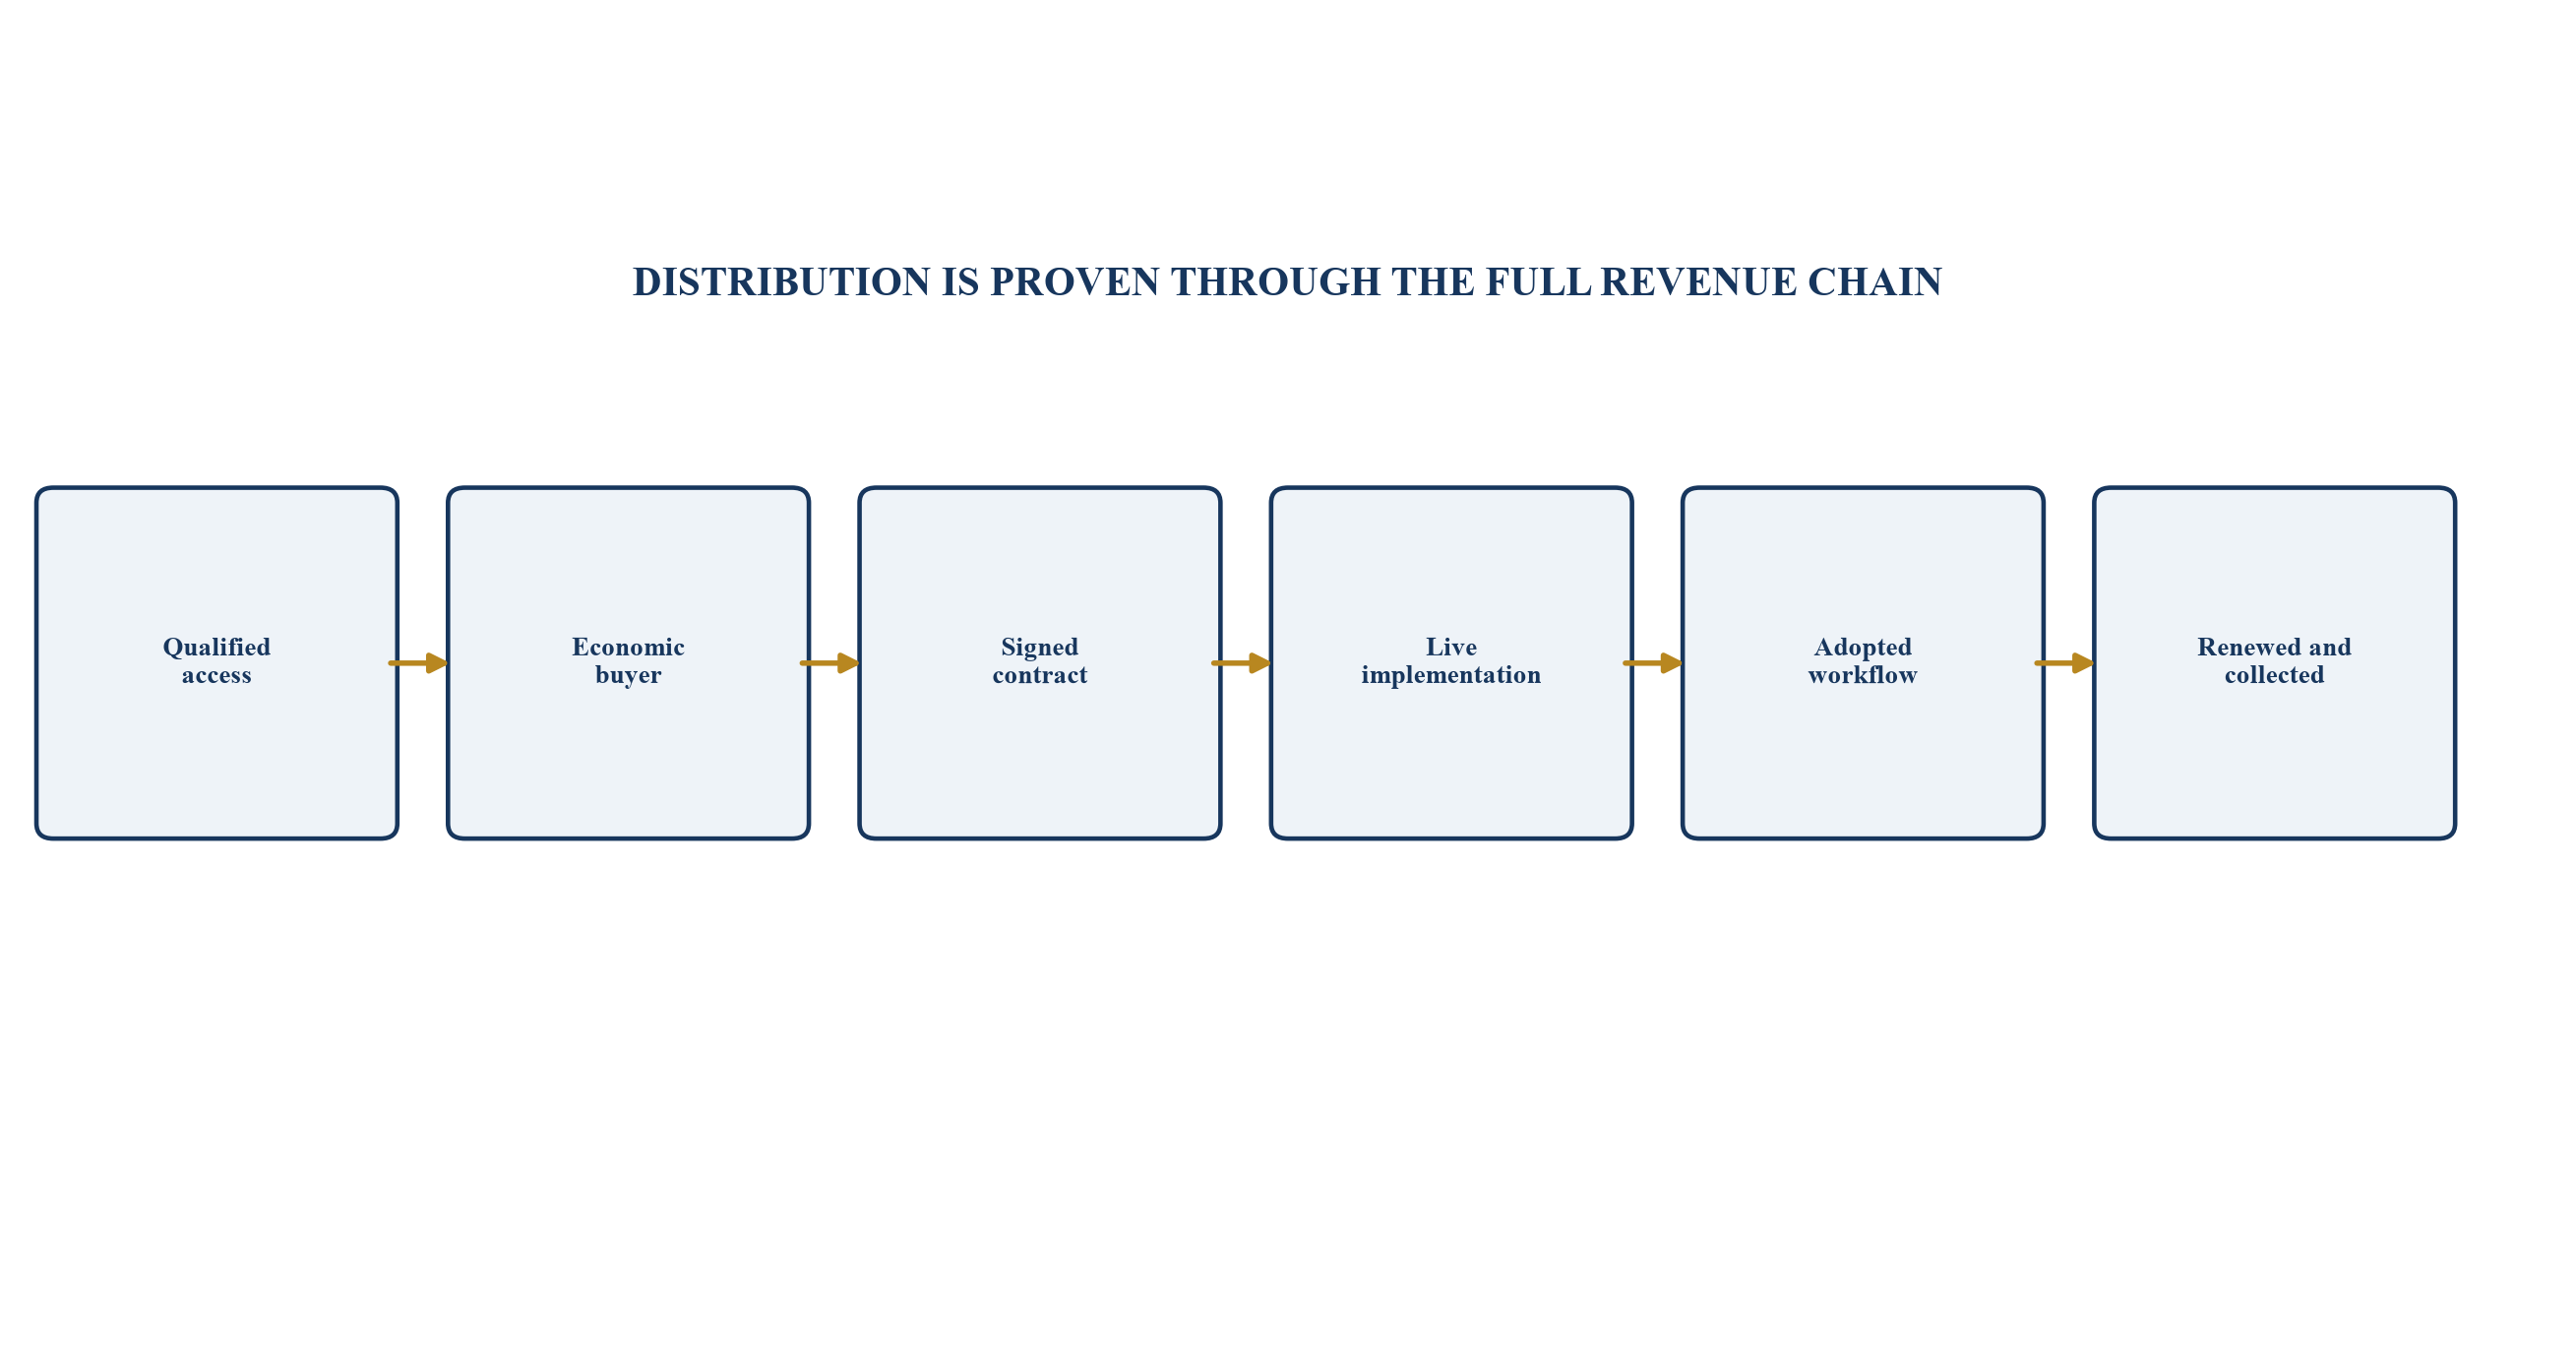
Each transition requires a named owner, a defined record and a reproducible test.
2. Separate customer, sponsor and channel concentration
Concentration should be measured through several lenses. Customer concentration asks how much contracted revenue, recurring revenue, receivables and cash collection depend on the largest accounts. Sponsor concentration asks how much pipeline and revenue arose through founders, shareholders, board members or strategic partners. Channel concentration asks how much qualified demand depends on a reseller, marketplace, government programme, developer group or technology integrator. These exposures can overlap, but they create different failure modes.
A company may report a diversified customer list while most buyers belong to one developer group or were introduced by one sponsor. It may have a broad pipeline while a single integration partner controls access to procurement. It may show low revenue concentration while one customer provides the case study, data access and brand credibility that supports the rest of the market. Diligence should reconstruct economic dependence rather than rely on account counts.
The concentration map should link every customer to ultimate group, originating source, commercial owner, product, geography, contract, receivable, implementation status and renewal date. Related parties and reciprocal arrangements require separate disclosure. Pipeline should be weighted by evidence, not management confidence. A signed evaluation, budgeted request for proposal and verbal expression of interest should not receive the same probability.
Stress testing should remove the largest customer, sponsor and channel in turn. The model should show the effect on annual recurring revenue, implementation utilisation, cash runway, referenceability and new-logo conversion. A combined stress can be appropriate where the same relationship supports several parts of the system. The output becomes a capital-structure input because concentrated businesses may need a larger liquidity reserve, more conservative valuation and milestone-based funding.
Table 1. Distribution-concentration evidence map
| Exposure | Core measure | Verification evidence | Downside test |
|---|---|---|---|
| customer | revenue, ARR, receivables and cash by ultimate group | contracts, invoices, collections and group mapping | loss or delayed renewal of top group |
| sponsor | opportunities and wins sourced by founders or strategic sponsors | CRM source history, introductions and meeting records | removal of sponsor-sourced pipeline |
| channel | qualified pipeline and wins by reseller, integrator or platform | partner agreement, opportunity registration and economics | suspension or repricing of leading channel |
| reference | conversion influenced by a named anchor deployment | reference calls, case-study permissions and attribution | withdrawal of anchor reference |
| product | revenue and retention by module or workflow | order forms, usage records and renewal history | discontinuation or commoditisation of lead module |
Evidence should be reconciled to contracts, invoices, CRM history, ownership records and bank receipts.
3. Reconstruct the route from lead to cash
The commercial data room should permit an investor to follow a lead from its original source to collected cash. The path includes source, qualification, discovery, proof of concept, proposal, security review, procurement, contract, implementation, acceptance, invoice, collection, adoption, renewal and expansion. Missing transitions often expose where relationships substitute for a scalable process.
CRM records should be reconciled to email history, proposal versions, contracts, invoicing and bank receipts on a sample basis. Stage definitions should describe objective evidence. A proposal sent is different from a budget-approved opportunity. A contract under legal review is different from a signed order. Pipeline changes should retain an audit trail so that opportunities are not created, advanced or re-dated to support a financing narrative.
The company should calculate conversion, elapsed time and loss reasons by source, customer segment, product, country and commercial owner. Founder-led deals can then be compared with sales-led, partner-led, inbound and government-programme opportunities. The comparison should include discounting, implementation scope, payment terms, support burden and expansion, because a high win rate may reflect unusually favourable commercial terms.
Cash closes the evidence chain. Contracted revenue can remain uncollected because of acceptance disputes, missing purchase orders, delayed milestones, retention amounts or customer budget cycles. Growth-equity diligence should reconcile bookings, billings, recognised revenue, deferred revenue, receivables and cash. This bridge prevents a company from using one commercial event to support several incompatible claims.
4. Define the real economic buyer and buying trigger
PropTech products can serve owners, developers, asset managers, contractors, brokers, facilities managers, tenants, lenders, valuers, regulators and investors. The user, beneficiary, data owner, integration owner, procurement authority and budget holder may be different entities. A scalable sales motion identifies each role and resolves the incentive gaps between them.
The buying trigger should be specific. It may be a portfolio acquisition, new development launch, regulatory requirement, enterprise-resource-planning replacement, operating-cost target, vacancy problem, sustainability commitment, financing process or service-quality failure. An undefined promise to digitise real estate creates a long sales cycle and weak budget ownership. A clear trigger connects the product to an existing decision, deadline and economic line.
Diligence should test whether the buyer can quantify the problem before the product is introduced. Customer interviews should ask how the issue was managed previously, who approved the purchase, which alternatives were considered, what evidence supported the decision and what would cause non-renewal. Interviews should include users, procurement and finance rather than the executive sponsor alone.
The target segment should be narrow enough to support repeatability. A workflow product for large developers can require different integrations, security approvals and service levels from a product for small property managers. A marketplace can have different acquisition and liquidity mechanics from enterprise software. Growth planning should show which segment funds the next phase and which adjacent segments remain options pending evidence.
5. Test whether the product survives beyond the relationship
Relationship independence does not require excluding founder involvement. It requires showing that the organisation converts access into repeatable value through documented systems. The company should demonstrate that another qualified commercial owner can run discovery, price the solution, secure internal resources, manage procurement and reach implementation without relying on personal authority unavailable to the wider team.
A useful test assigns a new opportunity to the standard process with the founder limited to a defined executive role. The company records where the process stalls, which objections arise, what proof is missing and how much senior intervention is required. The purpose is to identify a transfer gap. It should not manufacture a founder-free process before the team is ready.
Customer evidence should also survive independent review. Reference calls selected by the investor can test whether the product solved a funded problem, whether implementation matched the proposal, whether users adopted the workflow, whether the buyer would renew at the current price and whether the buyer would recommend the product without the founder relationship. Responses should be reconciled with usage, tickets, invoices and renewal records.
The operating model should convert relationship knowledge into assets: an ideal-customer profile, qualification questions, discovery template, value calculator, security pack, implementation plan, integration library, pricing rules, case studies and customer-success playbooks. These assets lower variance across sellers and geographies. Their effectiveness appears in conversion, cycle time, discounting, time to value and retention.
6. Segment revenue before calculating recurring economics
PropTech revenue can include subscriptions, licences, usage fees, transaction fees, implementation, integration, hardware, data, professional services, advertising, payments and financial-service economics. These streams differ in gross margin, predictability, working capital, regulatory exposure and valuation treatment. The investor should reconstruct revenue at contract-line level rather than rely on a management label.
IFRS 15 requires an entity to identify the contract and performance obligations, determine the transaction price, allocate it to performance obligations and recognise revenue when or as obligations are satisfied. The accounting conclusion depends on the actual contract and facts. The commercial model should remain consistent with the audited or advised accounting treatment while also showing operational metrics such as annual recurring revenue, bookings and billings.
Implementation revenue deserves particular attention. Mandatory implementation can delay the start of subscription service, consume scarce specialist capacity or indicate that the product is not yet standardised. A separately priced service can still be economically required to make the product usable. The company should show implementation scope, duration, direct labour, partner cost, acceptance, margin, rework and the point at which the customer receives value.
Usage and transaction revenue can scale attractively, but it may fluctuate with property transactions, leasing activity, payment volumes or construction cycles. The diligence model should separate contractual minimums from variable activity and show seasonality. Data and payment products may also create regulatory, privacy, credit or counterparty obligations that should not be valued as software economics without adjustment.
7. Build an auditable ARR bridge
Annual recurring revenue should be defined in a written metric policy. The policy should identify eligible contracts, normalisation period, currency translation, treatment of usage, contractual minimums, discounts, free periods, implementation, suspended accounts, overdue receivables, early termination and related parties. The same policy should be applied across periods and reconciled to contract records.
The bridge begins with opening ARR and adds new logos, expansion, price, contraction, churn, reactivation, acquisitions, disposals and currency movements to reach closing ARR. Each movement should link to the underlying customer and effective date. Management estimates can be shown separately from contracted values. A forecast should never be inserted into historical ARR.
Renewal should be measured by eligible cohort. Gross revenue retention isolates contraction and churn from the starting base. Net revenue retention adds expansion. Logo retention indicates customer continuity. The company should show renewal rate by value and count, because losing several smaller customers can signal product or service issues before the revenue impact becomes material. It should also show collection after renewal.
Listed-company disclosures provide useful illustrations of metric mechanics without establishing a private-company benchmark. Procore states that substantially all revenue comes from subscription access and support, with revenue generally recognised ratably over the subscription term. CoStar discloses contract renewal rates for specified subscription services. AppFolio discusses subscription services, value-added services, onboarding and customer-service infrastructure. The investee should define its own metrics from verified contracts and operating data.
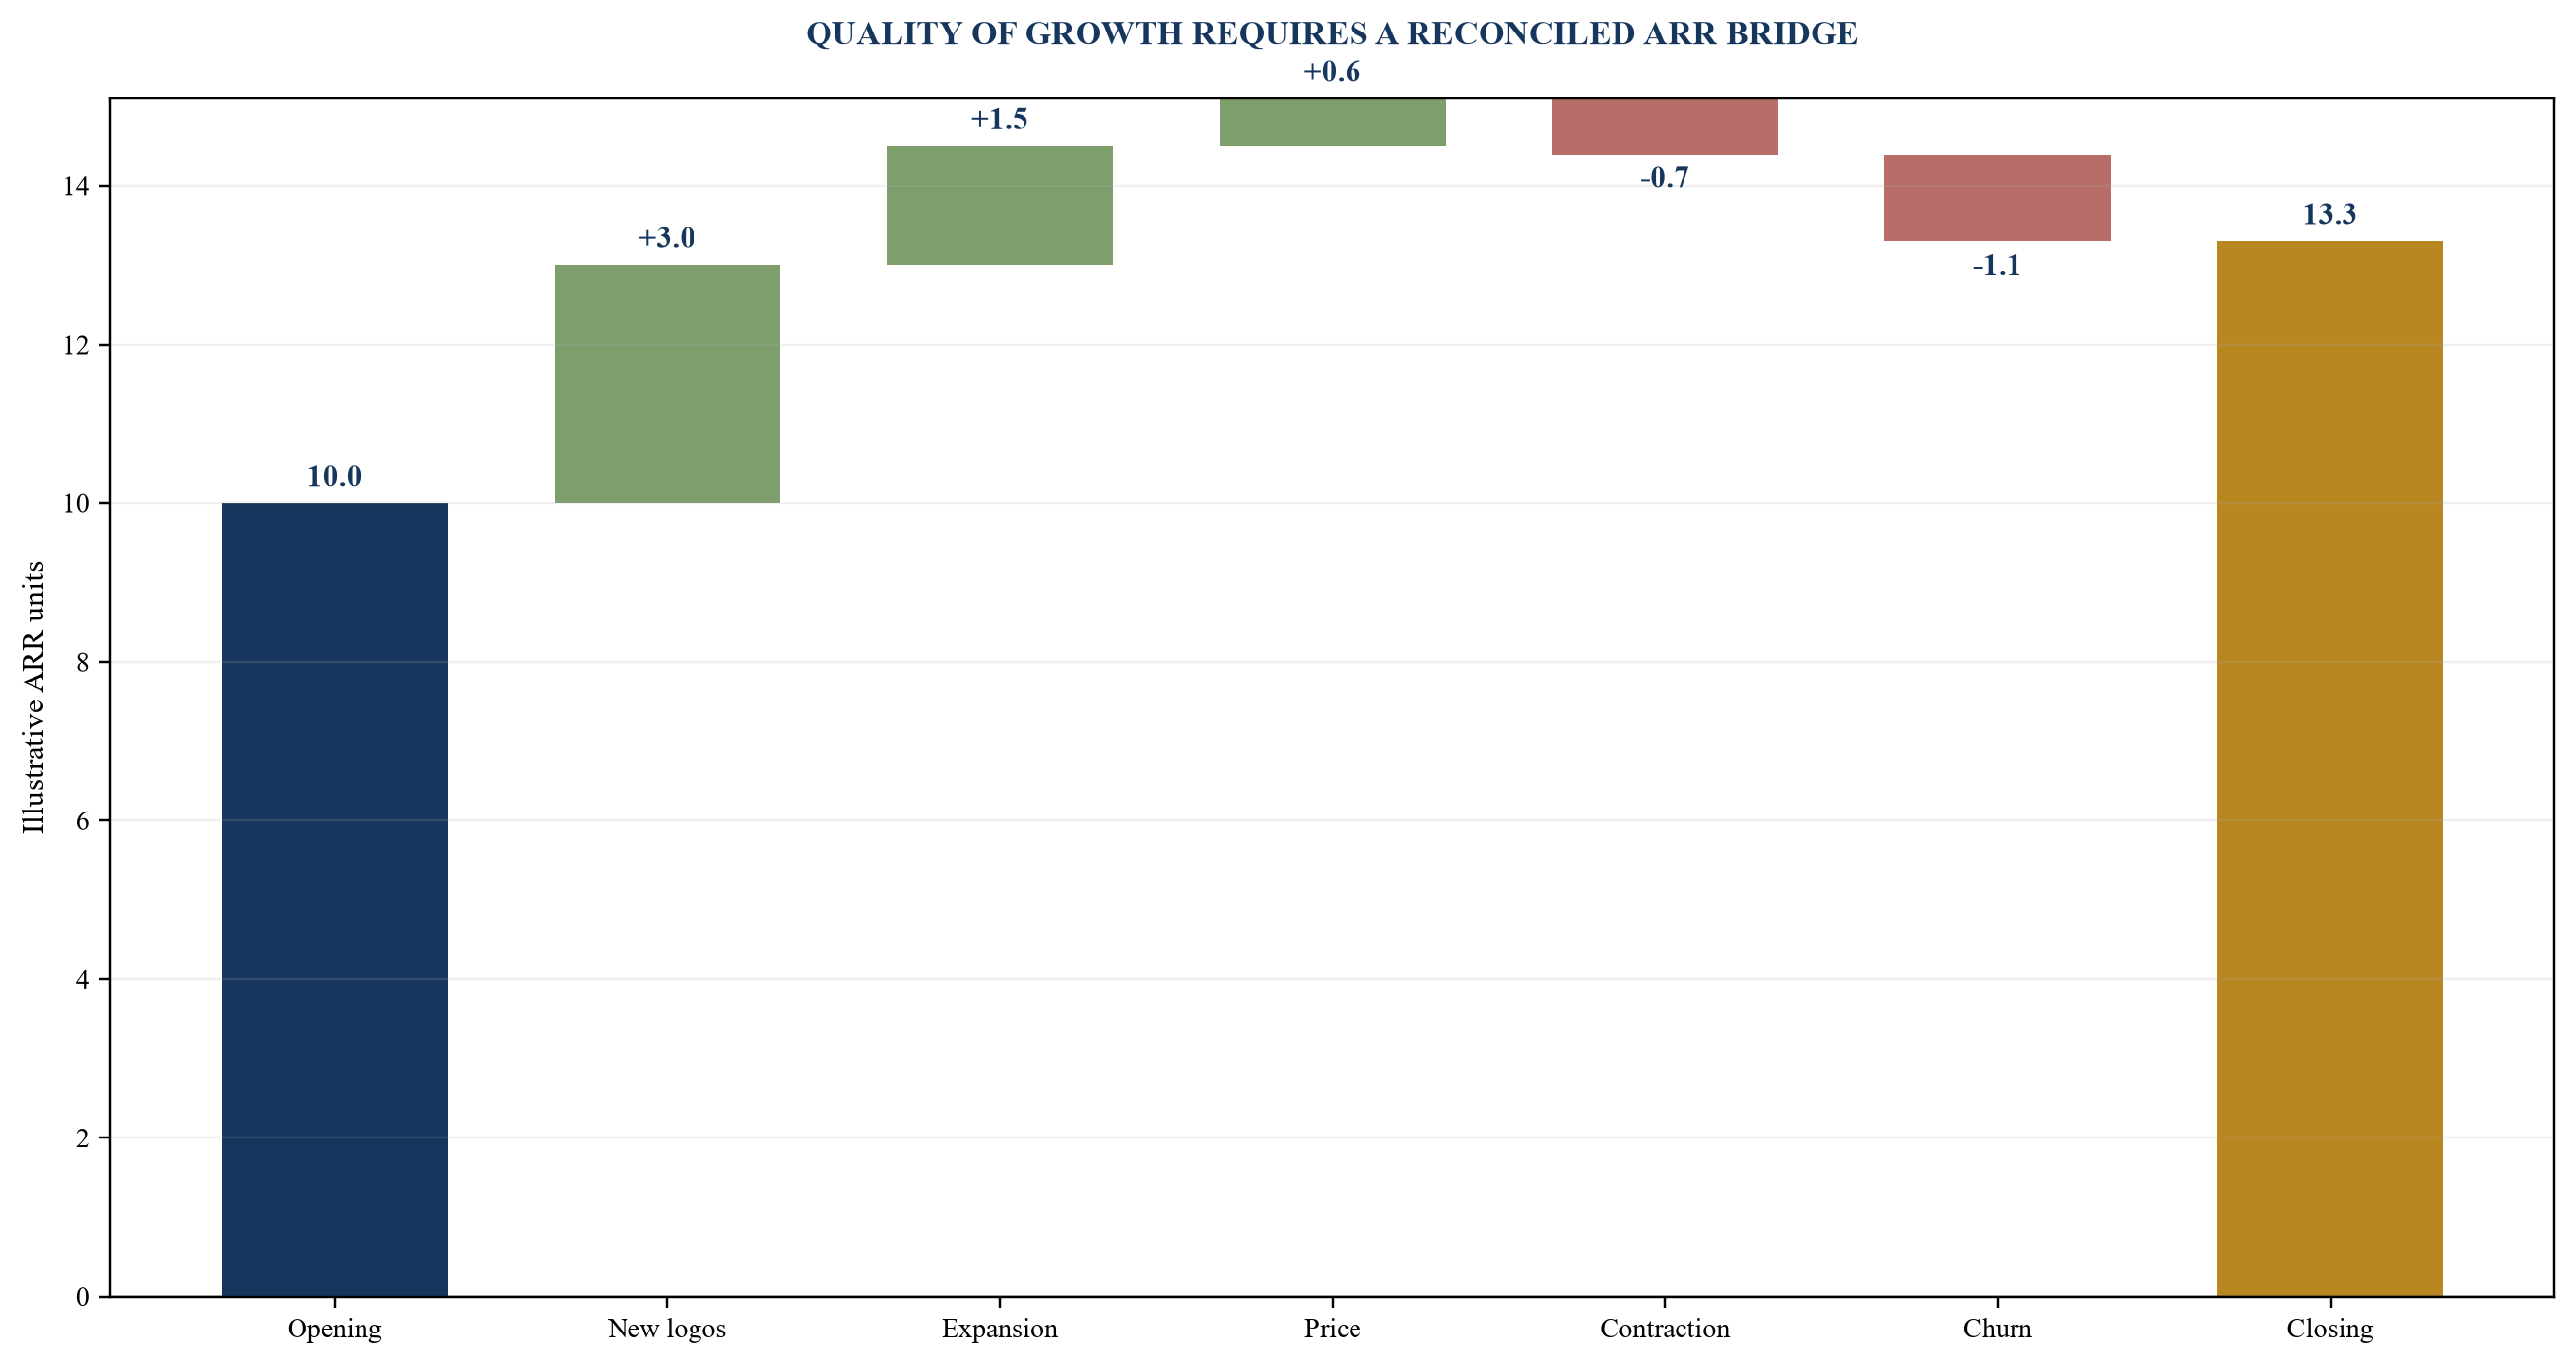
Values are illustrative analytical assumptions and do not represent a company forecast.
8. Measure implementation as a production system
Implementation is part of the product economics. The company should define the standard journey from contract to live use: discovery, data migration, configuration, integration, testing, training, acceptance and first value. Each step should have an owner, entry evidence, exit evidence, expected elapsed time and exception path. Custom work should be identified at quotation rather than discovered after signature.
Cohort analysis should group customers by product, segment, geography, implementation model and start period. It should track elapsed time, internal hours, partner hours, rework, direct cost, acceptance, activation, adoption, support tickets and early renewal behaviour. An apparent improvement in average time can reflect a mix shift toward simpler customers, so like-for-like comparisons matter.
The analysis should distinguish customer delay from company delay while preserving the total time to value. Missing customer data, slow security approval and unavailable integration teams are commercial realities even when the company does not control them. A scalable product anticipates common dependencies, qualifies readiness before contract and prices exceptional work.
Implementation capacity should be linked to the growth plan. If each new customer requires a scarce senior engineer, revenue growth can create a working-capital and delivery bottleneck. The plan should show trained capacity, utilisation, backlog, partner certification, automation and the cost of maintaining quality. Growth capital should fund the constraint that releases repeatable revenue rather than amplify unqualified sales.
Table 2. Implementation-cohort evidence
| Measure | Purpose | Required segmentation | Warning signal |
|---|---|---|---|
| contract-to-live days | tests deployment speed | product, segment, country and complexity | median improves while upper quartile worsens |
| direct implementation cost | tests contribution economics | internal labour, partner, cloud and travel | cost omitted from customer margin |
| acceptance and rework | tests scope quality | standard, configured and custom | repeated scope changes after signature |
| adoption at 30, 60 and 90 days | tests realised workflow | role, site and module | executive sponsor active while users are not |
| implementation-to-renewal outcome | connects delivery to retention | cohort and commercial source | fast implementation with weak renewal |
Cohorts should use verified delivery records and consistent definitions.
9. Prove adoption and customer value
Deployment is an intermediate milestone. Growth-equity value depends on whether the product becomes part of a recurring workflow and creates an outcome the customer continues to fund. The company should define the product events that demonstrate meaningful use. Login counts can be misleading where a small number of administrators maintain the system while the intended users remain inactive.
An adoption map should link user roles to required behaviours, workflow frequency, data inputs, decisions and outputs. For a construction platform, evidence may include active projects, document workflows, approvals, payment applications or issue closure. For a property-management platform, it may include units, work orders, resident interactions, leasing activity or payments. For an analytics product, it may include decisions taken and validated through source records.
Customer value should be measured against a pre-agreed baseline where feasible. Relevant outcomes may include cycle time, error rate, occupancy, collection, maintenance response, energy use, sales conversion or working capital. The company should separate observed association from causation. It should retain customer-approved evidence and disclose other operational changes that could explain the result.
Customer-success resources should be allocated according to risk and value. The operating plan should identify onboarding, adoption, executive review, support, renewal and expansion responsibilities. Health scores should use verifiable signals and be tested against actual renewal outcomes. A model that classifies every large customer as healthy because of executive relationships conceals distribution risk.
10. Diagnose churn before using retention multiples
Churn analysis should start with the contractual population eligible to renew. The company should identify renewal dates, notice periods, auto-renewal terms, price changes, usage, outstanding support issues and decision owners. Lost accounts should retain the customer's stated reason and the company's evidence-based root-cause assessment. Generic categories such as budget or strategy change are insufficient when product, delivery or relationship failures contributed.
Churn should be split into avoidable and structural causes. Structural causes may include project completion, business closure, portfolio sale or regulatory change. Avoidable causes can include weak adoption, missing functionality, implementation failure, support quality, security concerns, pricing or competitive displacement. The distinction should be reviewed independently because commercial teams have an incentive to classify losses as external.
Contraction and non-collection deserve equal attention. A customer can renew at a lower scope, receive an extended free period or remain nominally active while invoices age. The ARR policy should reflect enforceable economics. Receivable ageing and credit notes should be analysed by cohort, source and relationship. Cash retention is often a stricter measure than contractual renewal.
The valuation model should test retention under concentration and service stress. A growing company may maintain headline net retention through a few large expansions while smaller cohorts deteriorate. The investor should compare gross retention, logo retention, net retention, cohort contribution and cash collection. The applicable multiple should reflect the durability demonstrated by the actual customer base.
11. Measure customer acquisition cost by a complete commercial cohort
Customer acquisition cost should include the people, programmes and concessions required to acquire a defined cohort. Salaries, commissions, marketing, events, travel, proof-of-concept cost, solution engineering, founder time and partner fees can all be relevant. Omitting senior relationship effort can make an early sales motion appear more efficient than it is.
The denominator should be new customers or new recurring gross profit acquired during a stated period. The numerator should reflect the lag between commercial spending and conversion. A fast-growing team can incur cost before the resulting contracts appear, while a relationship-led company can recognise contracts supported by years of prior effort. Cohort analysis and sensitivity ranges provide a more useful decision view than a single blended ratio.
Payback should use recurring gross profit and expected collection timing. Implementation losses, cloud cost, support and channel share should be incorporated where they are required to deliver the recurring stream. A company with prepaid annual contracts can fund growth more readily than one with milestone billing and slow enterprise collection, even at the same accounting revenue.
The investment case should show acquisition economics by source. Founder, direct sales, inbound, government programme, reseller and integrator channels may have different conversion, cycle time, discount, implementation burden and retention. A lower-cost channel can destroy value if it attracts poorly qualified customers or transfers pricing power to the intermediary.
12. Price the product against value and delivery cost
Pricing should reflect the decision unit and the customer's economic value while remaining operable across contracts and countries. Common bases include unit, project value, portfolio size, user, module, transaction, usage or outcome. Each basis changes expansion mechanics, revenue variability and customer negotiation. The company should explain why the metric remains aligned as customers grow or the market changes.
Discount analysis should include headline price, free periods, implementation waivers, bespoke features, service credits, payment terms and partner margin. A contract signed at list price can still carry a large economic discount. Diligence should compare effective price across customers after normalising scope and timing. Related-party or strategic accounts should be shown separately.
Value-based pricing requires credible customer evidence. The business should identify the operational or financial line affected, measurement method, customer share of value and period of benefit. Savings estimates should remain separate from verified outcomes. Products tied to asset value, transaction volume or payment flows may generate attractive expansion, but they can also create cyclicality and regulatory dependencies.
The growth plan should include controlled pricing tests. New prices can be introduced by segment or product package with defined success and stop criteria. The company should monitor conversion, cycle time, scope, adoption, retention and collection. Price increases that rely on founder negotiation and customer goodwill do not establish a repeatable pricing system.
13. Build the channel concentration map
Channel strategy can expand distribution across a fragmented Gulf market. System integrators, cloud providers, enterprise software vendors, brokers, property managers, consultants, banks and government programmes can provide access, implementation capacity or product integration. The economics should be defined before the channel is treated as scalable.
The map should show the target customer, channel role, opportunity ownership, commercial rights, certification, implementation responsibility, data access, support, margin, payment, exclusivity, termination and customer portability. A referral agreement differs materially from a reseller model. A marketplace listing differs from a partner that owns the customer contract and controls renewal.
Channel productivity should be measured by trained partners, active partners, registered opportunities, qualified pipeline, wins, elapsed time, effective revenue share, implementation quality and renewal. A long list of signed partners can contain little commercial capacity. The company should retain evidence of partner investment and named personnel rather than count memoranda of understanding as distribution.
The investor should model channel failure. If a leading partner exits, the company should know whether it retains the customer relationship, data, contract, implementation records and renewal rights. The transition plan should identify direct-support capacity and alternative partners. Concentrated channel dependence should influence liquidity reserve, valuation and governance.
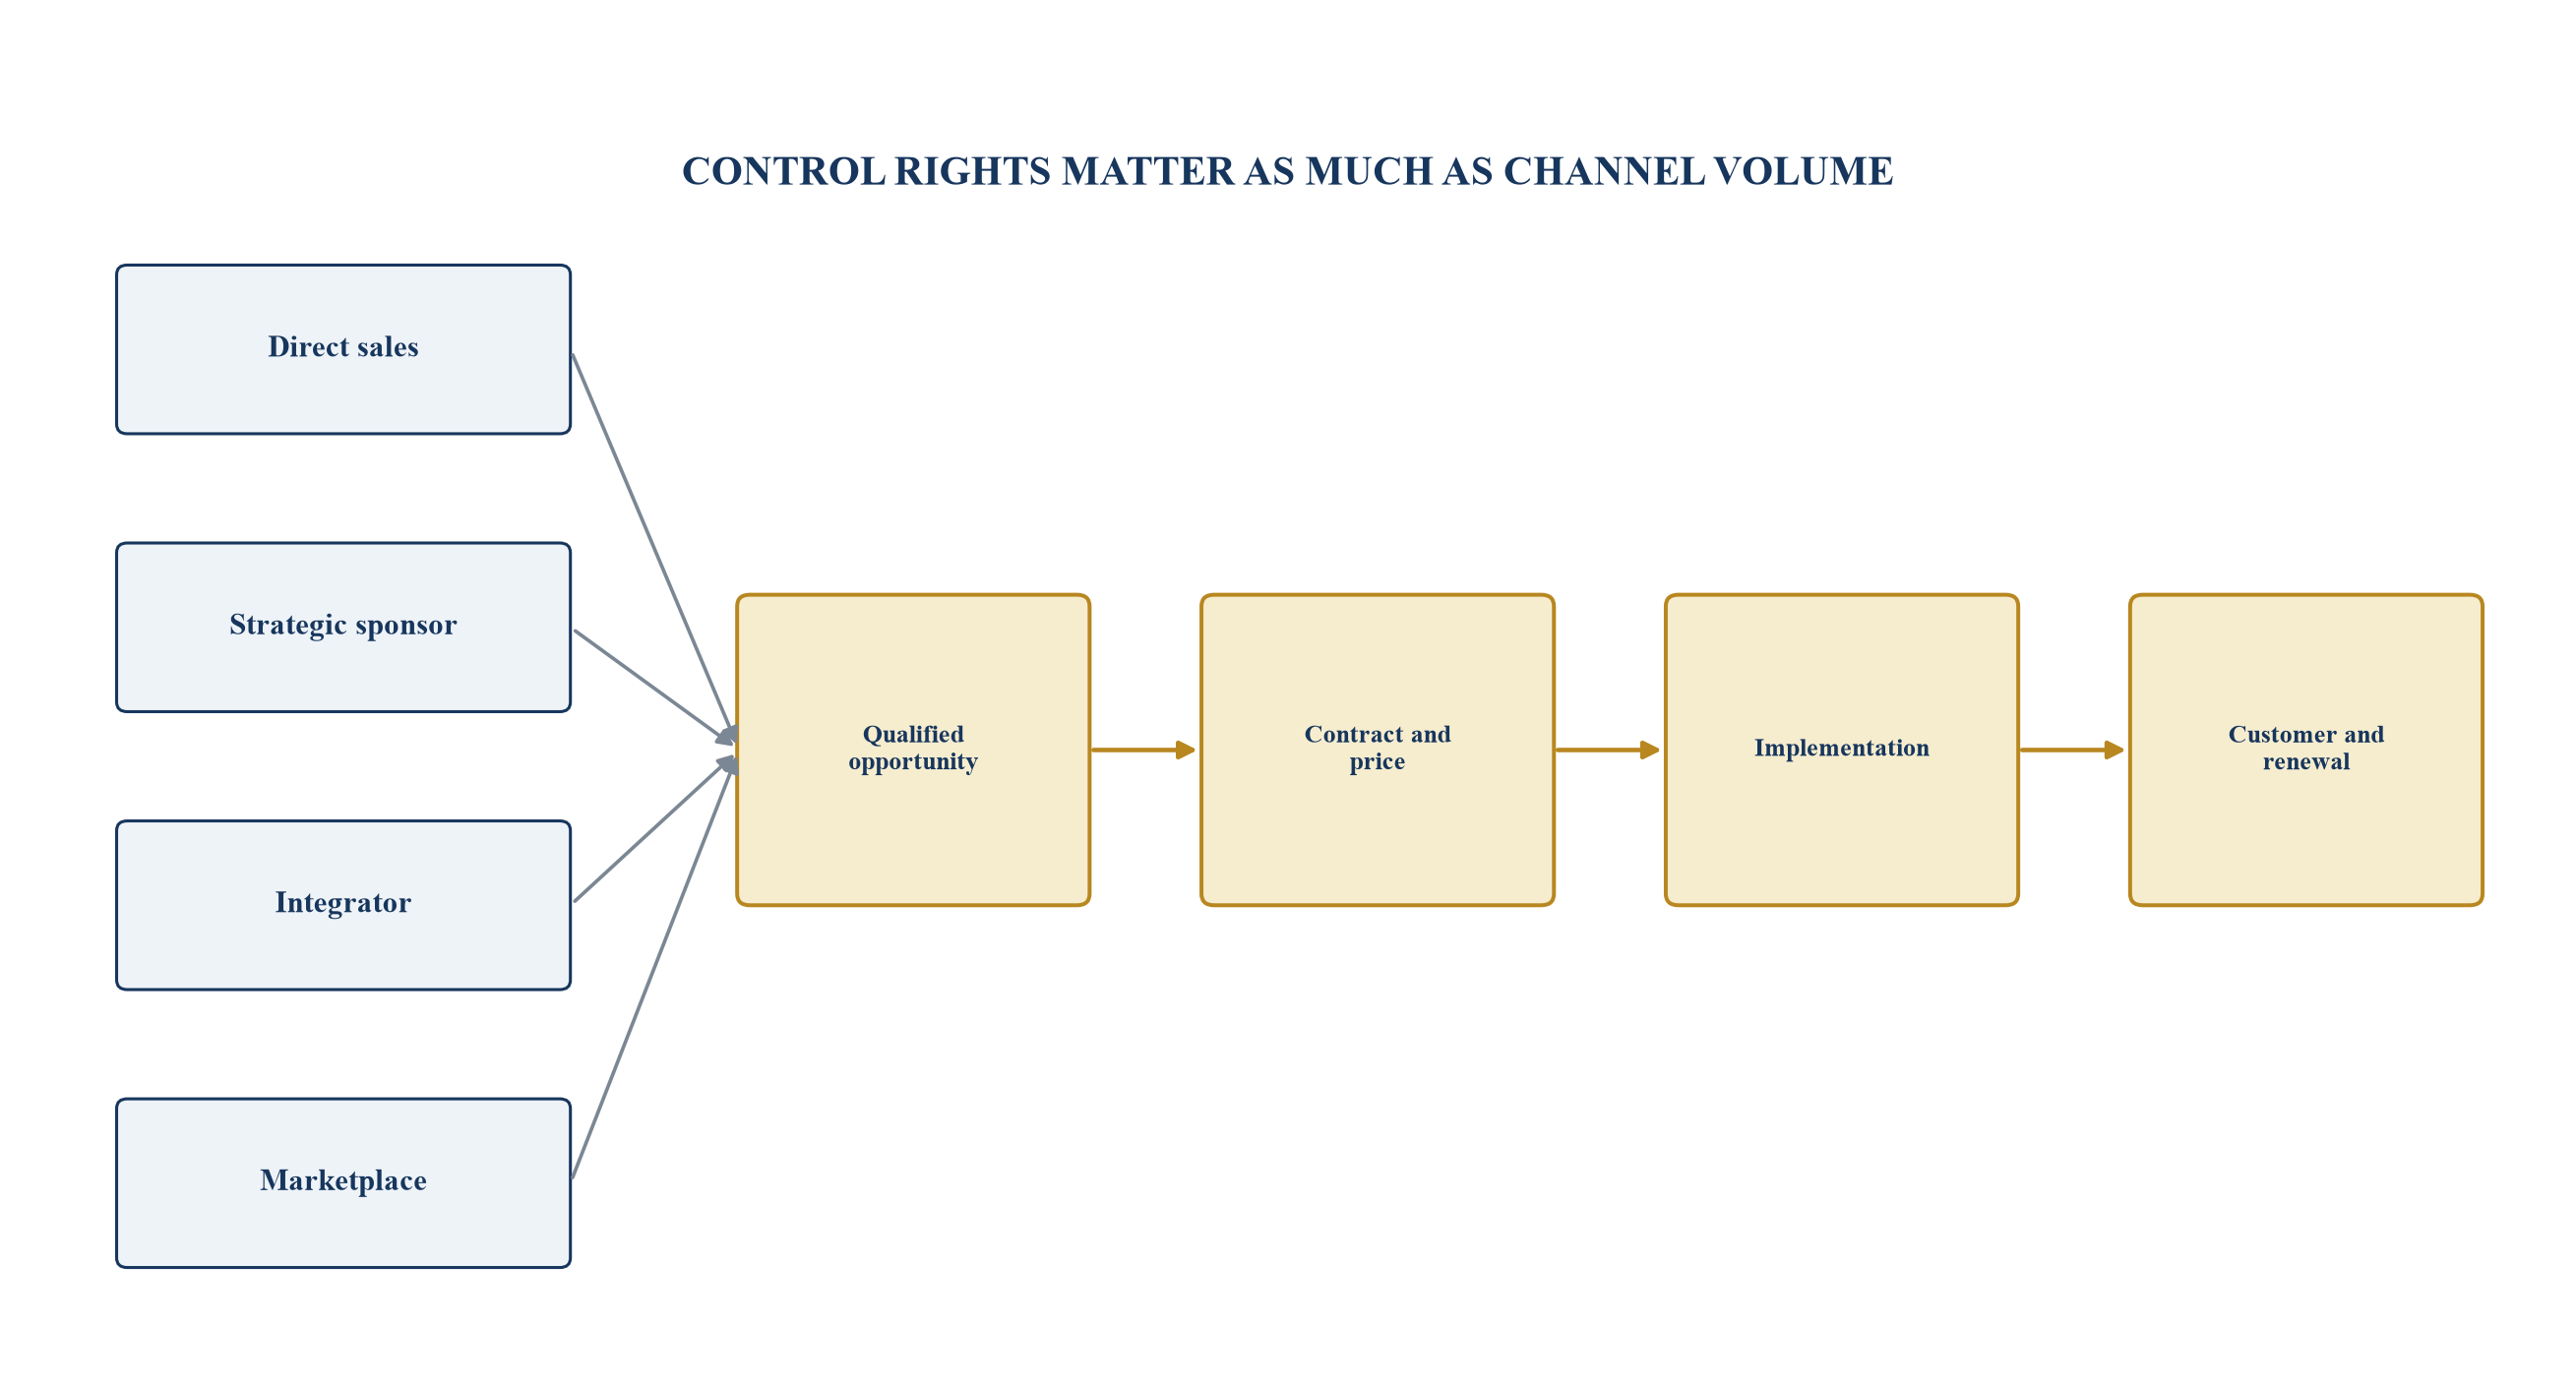
The map separates access, contracting, implementation and customer ownership.
14. Treat data rights as part of distribution
Many PropTech products depend on building, tenant, transaction, identity, location, operational or behavioural data. Distribution therefore includes the legal and technical right to obtain, process and retain the data needed to deliver the product. A customer contract that grants access for one deployment may not allow model training, benchmarking, cross-customer analytics or use after termination.
The data map should identify source, controller, processor, purpose, legal basis, location, transfer, retention, subprocessor, security control and deletion path. It should separate personal data from operational and commercially confidential data. It should also distinguish raw customer data from derived features, anonymised aggregates, model parameters and generated outputs. Counsel should assess the actual product and jurisdiction.
The UAE Personal Data Protection Law provides a federal framework for processing personal data and defines obligations relating to confidentiality and privacy. Saudi Arabia's Personal Data Protection Law and implementing materials govern processing in the Kingdom and certain processing relating to residents from outside the Kingdom. Free-zone or sector rules may also apply. The company should maintain a jurisdiction-specific compliance matrix rather than assume one Gulf-wide position.
Data portability affects customer ownership and channel independence. The contract should define export formats, continuity, deletion and access to records needed for verification or dispute. A product that cannot operate when a developer, government platform or integrator withdraws data access has a distribution dependency that belongs in the investment model.
15. Diligence AI features as governed products
Artificial intelligence can support valuation, lead scoring, property search, maintenance, document review, fraud detection, forecasting, design and workflow automation. An AI label does not establish a defensible product or commercial advantage. Diligence should identify the exact task, model, data, human role, output, failure consequence and customer value.
The product team should maintain model documentation, evaluation datasets, performance by relevant segment, monitoring, override, incident and change-control records. Accuracy should be linked to the decision it supports. A small error can be immaterial in a recommendation tool and consequential in eligibility, pricing, safety or financial decisions. Customer contracts and marketing claims should match the validated use.
The NIST AI Risk Management Framework organises voluntary risk-management outcomes through govern, map, measure and manage functions. It provides a useful diligence lens for accountability, context, measurement and ongoing risk treatment. The applicable legal and sector requirements still depend on the product, user, data and jurisdiction.
AI economics should include model and data cost, inference, human review, monitoring, retraining, security, support and third-party dependence. A feature that improves conversion while raising variable cost or customer liability may weaken gross margin. The investment model should show the evidence required before AI-driven uplift is included in price, retention or expansion assumptions.
16. Build a geography scorecard before funding expansion
The Gulf is not one commercial market. Each country has its own real-estate regulation, data rules, procurement norms, tax treatment, payment practices, corporate structures, language needs and technology ecosystems. A product proven in Dubai may face different buyer concentration, integration and regulatory requirements in Riyadh, Doha, Manama, Muscat or Kuwait City.
The geography scorecard should start with the target workflow and buyer. It should assess regulatory scope, licence or sandbox needs, data location and transfer, required integrations, procurement path, local entity, tax, pricing, implementation capacity, partner quality, sales cycle, payment terms, customer references and market-entry cost. Evidence should be graded from primary-source confirmation and signed customer demand through to untested management assumptions.
Official initiatives can improve ecosystem access. Dubai's Real Estate Sector Strategy 2033 and related PropTech initiatives emphasise technology, AI, operational efficiency and investor access. Saudi REGA's PropTech Hub seeks to bring together regulators, investors, entrepreneurs and real-estate companies, and its sandbox process creates a route for specified innovative models. These programmes support an expansion hypothesis; they do not replace customer and unit-economic evidence.
The company should select a beachhead rather than fund simultaneous regional presence. The first market can test a repeatable route with a defined product, customer segment, partner and implementation model. Capital for the next geography should follow signed demand, regulatory readiness and delivery capacity. This sequence protects runway and produces comparable evidence.
Table 3. Cross-market readiness scorecard
| Dimension | Evidence required | UAE test | Saudi test | Capital gate |
|---|---|---|---|---|
| regulatory scope | regulator source and legal advice | applicable mainland, emirate and free-zone rules | REGA, sandbox and sector scope | no launch before required approvals |
| data governance | data map, transfer and hosting analysis | federal and applicable free-zone treatment | PDPL and implementing requirements | approved architecture and contracts |
| customer demand | budgeted opportunities and references | unrelated buyers beyond anchor group | named economic buyers beyond sponsor | signed or procurement-advanced demand |
| integration | verified system and data interfaces | repeatable connector and support model | local platform and language readiness | tested implementation plan |
| economics | price, delivery cost, collection and support | positive cohort contribution | funded path to positive cohort contribution | milestone release by cohort |
Scores are hypothetical analytical assumptions; actual conclusions require verified legal, commercial and operating evidence.
17. Test product localisation without creating a services company
Localisation can include Arabic workflows, regulatory forms, accounting or payment integrations, data hosting, property identifiers, valuation standards, tenancy processes and customer-specific approvals. These changes may be essential to adoption. They can also fragment the product and absorb engineering capacity if every sale creates a bespoke branch.
The product architecture should separate core platform, configuration, local module, integration and custom development. Each requested change should identify the number of customers served, strategic value, build cost, maintenance cost, security impact and product owner. Contract pricing and delivery dates should reflect the actual classification. Custom commitments should not be hidden inside a standard subscription proposal.
The roadmap should show how local requirements become reusable assets. A country pack can standardise language, data schema, regulatory workflow, integrations and deployment documentation. Partner certification can expand implementation capacity where the core product remains controlled. Product telemetry and support records should confirm whether localisation improves adoption and retention.
Growth funding should distinguish product investment from customer-funded work. A strategic local module can justify equity when it expands a repeatable market. A one-off integration may be better funded through implementation fees. The board should monitor the share of engineering capacity devoted to reusable roadmap, committed customers, defects and bespoke requests.
18. Connect sales capacity to implementation and customer success
A commercial plan is credible when sales, solution engineering, implementation and customer success expand in a coordinated manner. Hiring account executives faster than the company can qualify, deploy and support customers creates backlog, poor adoption and churn. Hiring delivery ahead of contracted demand consumes runway. The operating model should identify the binding constraint for each growth stage.
Capacity planning should use role-specific productivity. Sales productivity includes ramp time, qualified pipeline, win rate, contract value and cycle time. Solution engineering includes discovery and proof-of-concept load. Implementation includes concurrent deployments, complexity and rework. Customer success includes portfolio size, risk, adoption and renewal activity. Aggregate headcount ratios can conceal the scarce role.
The plan should model monthly cohorts from pipeline through collection. It should incorporate hiring dates, ramp, attrition, partner capacity, customer dependencies and billing terms. A downside case should reduce conversion, extend procurement and increase implementation time simultaneously. This reveals whether the company can preserve service quality and liquidity under a plausible growth delay.
Management incentives should balance bookings with implementation, collection and retention. Commission paid solely on signature can encourage underpriced custom commitments. A portion can follow verified contract quality, cash or successful handover, subject to local employment and tax advice. The chosen design should be clear, measurable and consistent with customer outcomes.
19. Reconcile gross margin to the product promise
Gross margin should include the direct resources required to provide the contracted service. Cloud, data licences, payment costs, customer support, implementation labour, partner share, hardware, field service and third-party models can be relevant. Classification should follow the company's accounting policy, while the investment model should also show contribution economics at customer and product level.
The diligence team should reconcile management gross margin to the financial statements and then build an operational bridge. Subscription gross margin can be overstated when implementation losses or customer-specific support sit in operating expenses. Transaction revenue can appear attractive before chargebacks, fraud, payment processing and customer-service costs. Hardware can create warranty and working-capital exposure.
Margin should be analysed by cohort and source. Anchor customers may receive discounted pricing, heavy customisation and senior support. Partner-led customers may carry revenue share. New geographies may require duplicated hosting, local support or compliance. A blended corporate margin can conceal that the growth cohort is less attractive than the installed base.
The value-creation plan should identify the mechanism for improvement: product standardisation, implementation automation, partner scale, cloud optimisation, data renegotiation, support tooling or pricing. Each initiative requires cost, timing and service-quality measures. Margin expansion should enter the valuation only when the operating plan and evidence support it.
20. Translate commercial evidence into valuation
Revenue multiples are a conclusion of risk and growth analysis rather than a substitute for it. The valuation should reconcile recurring revenue, non-recurring revenue, gross profit, cash conversion, retention, concentration, acquisition efficiency, implementation burden, growth durability, governance and liquidity. The investor should use several methods and explain the weight assigned to each.
Public companies can illustrate disclosed business-model characteristics. Procore reports subscription access and support; AppFolio reports subscription and value-added services; CoStar reports subscription-based services and renewal; Autodesk discloses direct and indirect channels. Differences in scale, geography, product breadth, profitability, liquidity and reporting make direct multiple transfer inappropriate without adjustments.
A private-company analysis can use revenue and gross-profit multiples, discounted cash flow, milestone value and transaction evidence where reliable. The model should separate current verified performance from the value of future geographies, modules and AI features. Options can be valued through staged capital rather than paid for fully at entry.
The downside case should remove or delay the assumptions most dependent on relationships: anchor renewal, sponsor-sourced pipeline, leading channel, favourable implementation support and second-market launch. It should include dilution from additional capital and a longer path to liquidity. The resulting return range informs price, tranche size, governance and reserve strategy.
21. Structure growth equity around evidence maturity
The financing structure should match the evidence gap. A company with strong product adoption and weak channel independence may need capital for a professional commercial system. A company with signed demand and slow implementation may need delivery capacity and working capital. A company entering a second country may need regulatory, localisation and partner milestones before the full expansion budget is released.
Milestone tranches can be tied to objective evidence such as unrelated-customer wins, implementation cycle, gross retention, collected recurring revenue, partner productivity or second-market readiness. Milestones should avoid incentives to sign low-quality contracts or defer necessary cost. Definitions, data access, review rights and cure processes should be agreed in the investment documents.
Primary capital should be mapped to uses and the next financing point. The plan should include hiring, product, implementation, compliance, security, working capital, contingency and transaction cost. Secondary liquidity can be considered separately because it does not extend runway. A reserve may be held for evidence-backed acceleration or downside support.
Governance can include board representation, information rights, budget approval, related-party controls, key-person planning, option-pool treatment and reserved matters. Founder relationships remain valuable assets, so governance should support their transition into institutional distribution. The objective is a company whose commercial evidence can be understood and reproduced by future investors and acquirers.
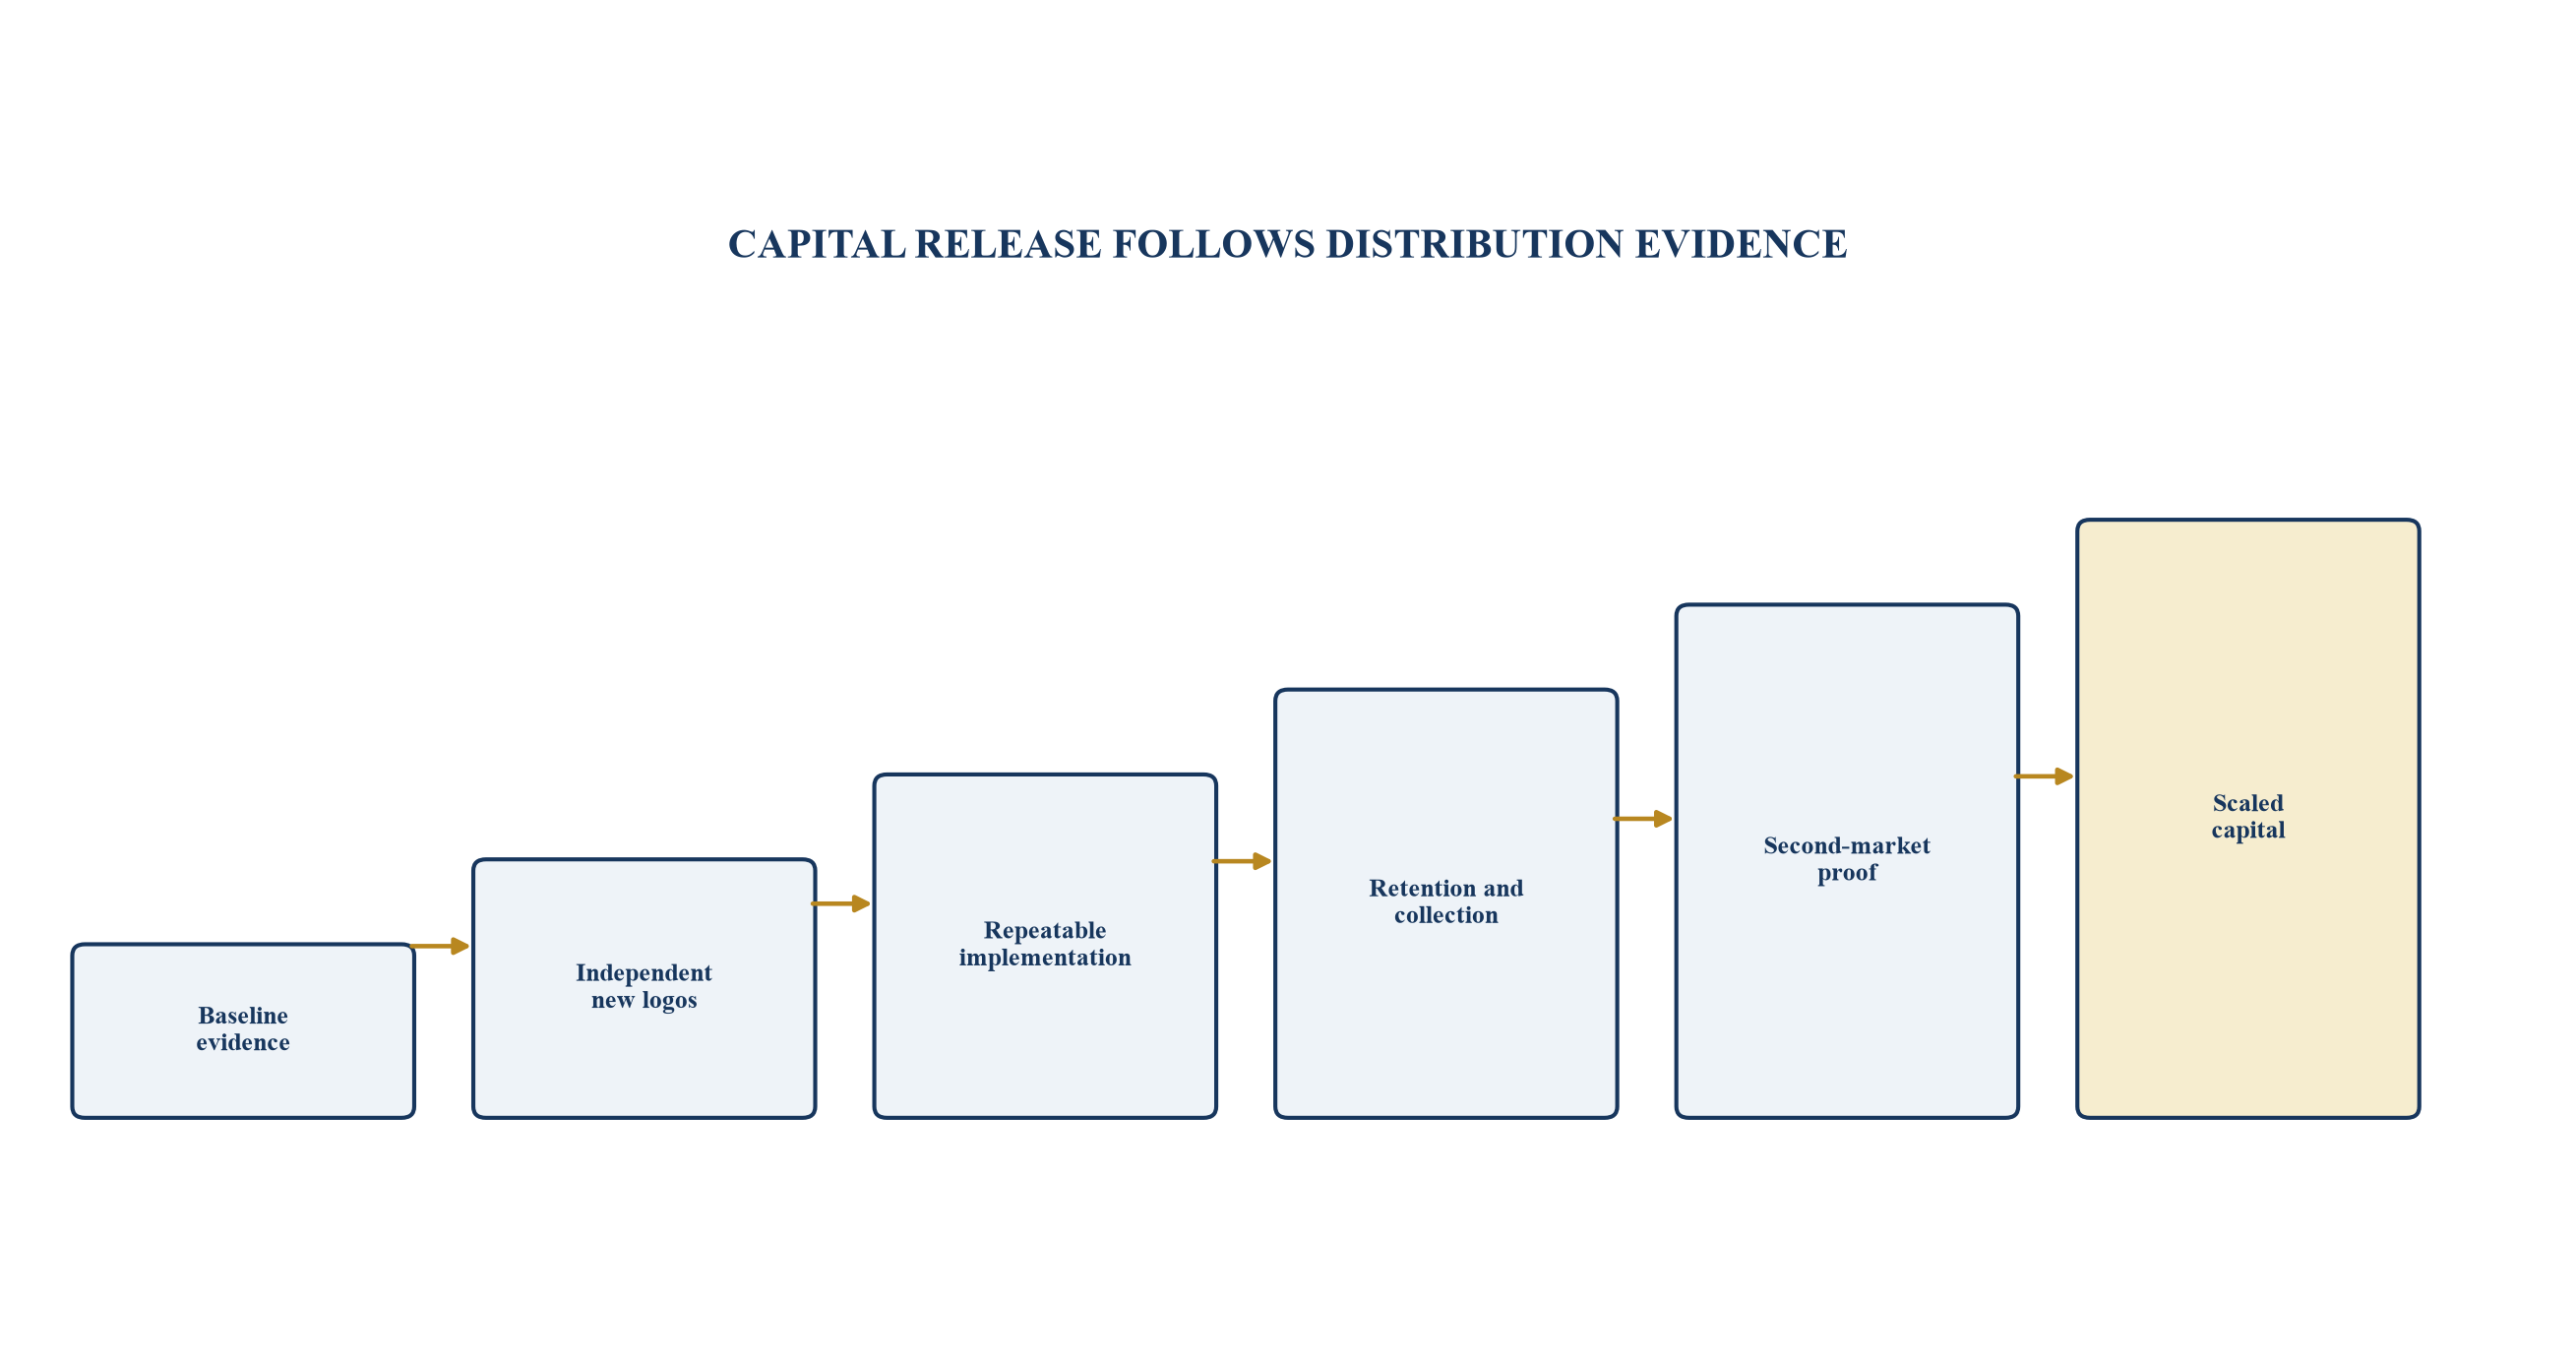
Capital at risk increases after independently verified commercial and operating evidence.
22. Set use-of-funds milestones that create enterprise value
The use-of-funds plan should connect each expenditure to a commercial bottleneck and a measurable enterprise-value outcome. Hiring a sales team is an input. A repeatable direct-sales motion with verified conversion, implementation and retention is an outcome. Building a Saudi module is an input. Regulatory readiness, signed demand, successful deployment and collected revenue are outcomes.
Each workstream should state budget, owner, timing, dependency, leading indicator, evidence gate and stop condition. Product work can be tied to reusable capabilities, adoption and support reduction. Commercial work can be tied to qualified pipeline and unrelated wins. Implementation work can be tied to cycle time, margin and acceptance. Geography work can be tied to approvals, customer evidence and unit economics.
The plan should preserve liquidity for slower enterprise procurement. Growth-equity models often assume that hiring creates pipeline and pipeline converts on schedule. The downside case should delay hiring productivity, procurement, implementation and collection. Management should state the actions available to preserve cash without damaging the installed base or product integrity.
Monthly board reporting should reconcile capital deployed, evidence obtained, recurring gross profit created and runway remaining. Variance should be explained through operating causes. The board can then redirect capital toward proven channels and pause speculative expansion. This creates a disciplined learning loop rather than a fixed spending plan.
Table 4. Use-of-funds milestones
| Workstream | Capital purpose | Evidence milestone | Stop or redesign trigger |
|---|---|---|---|
| direct distribution | hire and enable a repeatable sales pod | unrelated qualified pipeline, wins and collection | founder intervention remains essential at each stage |
| implementation | standardise delivery and certify partners | lower like-for-like cycle and rework with stable adoption | backlog grows faster than accepted deployments |
| customer success | improve adoption, renewal and expansion | cohort health predicts retained and collected revenue | health score diverges from actual renewal |
| product and AI | build reusable, governed capability | measured customer value, gross-margin fit and control evidence | bespoke cost exceeds repeatable demand |
| geography | localise and launch one selected beachhead | regulatory readiness, signed demand and live cohort | unsupported fixed cost or missing customer owner |
Amounts and thresholds belong in the company-specific investment plan after verification.
23. Install governance for institutional distribution
Institutional distribution requires definitions, systems and accountability that remain stable as the organisation grows. The board should approve policies for CRM stages, ARR, bookings, implementation acceptance, churn, customer health, concentration and pipeline probability. Changes should be documented with their effect on prior-period comparability.
A commercial-review cadence can examine source, stage movement, loss, discounting, implementation, adoption, renewal, receivables and partner performance. Finance should reconcile commercial metrics to contracts and ledgers. Product and delivery teams should confirm scope and capacity before large commitments are approved. Related-party opportunities should receive independent review.
Information rights should provide the investor with customer and cohort evidence while respecting confidentiality and data-protection obligations. A standard board pack can show the ARR bridge, concentration map, funnel, implementation cohorts, retention, collection, gross margin, channel productivity, geography gates and use-of-funds progress. Metrics should link to source systems.
Key-person planning is part of distribution resilience. The company should identify relationships, approvals and knowledge held by founders or a small number of employees. A transfer plan can include account ownership, documented playbooks, succession, incentives and customer introductions. The process should preserve trust while creating organisational continuity.
24. Execute a 100-day evidence programme
The first 100 days should establish the commercial truth before accelerating spend. The company should freeze metric definitions, reconcile the customer and contract population, map concentration, sample the lead-to-cash trail, interview customers, rebuild implementation cohorts and confirm product telemetry. Open evidence gaps should have owners and dates.
The second phase should run focused tests. These may include an independently sourced sales pod, a standardised implementation cohort, a pricing experiment, a partner activation plan and one second-market readiness sprint. Each test should have a hypothesis, maximum spend, evidence, review date and stop condition. Management should retain failed results because they improve capital allocation.
The third phase should convert evidence into operating routines. CRM stages, pricing authority, implementation gates, customer health, renewal forecasting, channel governance and board reporting should be embedded in systems. Hiring and geography capital can then follow demonstrated bottlenecks. The company should avoid launching several transformation programmes that compete for the same senior people.
At day 100, the board should receive a refreshed investment case showing verified current performance, remaining evidence gaps, capital deployed, runway, downside actions and next-stage milestones. The review can approve acceleration, continue testing, redesign the plan or preserve cash. This creates a controlled route from relationship-led success to institutional scale.
Evidence ownership should be explicit throughout the programme. Commercial operations should own source history, stage evidence and sales-cycle analysis. Finance should own contract, revenue, receivable and cash reconciliation. Delivery leaders should own scope, acceptance, effort and rework. Product and customer-success leaders should own telemetry, adoption, support and renewal preparation. Legal, privacy and security advisers should own their specialist reviews within the approved scope.
The programme should also create a controlled evidence room for future financing or sale. Core records should use stable identifiers for customer, contract, opportunity, implementation and invoice. Versioned exports should reconcile to board reporting, and permissions should protect customer confidentiality. A prospective investor or acquirer should be able to reproduce the principal metrics without requesting a new management reconstruction.
Management should document judgement. Pipeline probabilities, churn classifications, related-party assessments, recurring-revenue eligibility and customer-health scores often require interpretation. The record should identify the evidence considered, approver and effect of a reasonable alternative. This discipline improves board decisions and reduces the risk that a financing process exposes inconsistent definitions.
Table 5. One-hundred-day evidence controls
| Period | Priority | Required output | Board decision |
|---|---|---|---|
| days 1 to 20 | freeze definitions and populations | approved metric policy, customer register and contract universe | accept baseline or require remediation |
| days 21 to 40 | reconstruct commercial and delivery evidence | source-to-cash samples, concentration map and implementation cohorts | select focused tests |
| days 41 to 70 | run bounded commercial tests | independent sales, pricing, partner and localisation evidence | release or redirect test capital |
| days 71 to 90 | embed operating controls | CRM gates, acceptance, customer health, renewal and board pack | approve institutional routines |
| days 91 to 100 | refresh the investment case | verified performance, downside, runway and next milestones | accelerate, continue, redesign or stop |
The sequence establishes definitions and source reconciliation before accelerating commercial expenditure.
25. Use a final growth-equity decision checklist
The investment committee should receive the customer and contract register, ultimate-group map, source history, pipeline audit, ARR policy and bridge, revenue-recognition analysis, implementation cohorts, adoption evidence, renewal and churn analysis, receivable reconciliation, channel contracts, product and data architecture, regulatory matrix, geography scorecard, financial model and use-of-funds plan.
The committee should confirm that the distribution claim survives removal of the largest customer, sponsor and channel. It should distinguish independently repeatable wins from relationship access, and contractual recurring revenue from forecasts or non-recurring services. It should verify that implementation capacity, customer success and cash collection can support the proposed sales pace.
The valuation should reflect concentration, product and geography evidence. Future modules, AI capabilities and markets can remain staged options until demonstrated. The structure should provide sufficient runway, objective milestone definitions, data access, governance and downside flexibility. Any secondary component should be disclosed separately from capital available to the business.
The committee should review evidence freshness. A reference call completed before a major product release, a pipeline snapshot taken before a procurement delay, or a retention analysis that excludes the next renewal cohort can produce a stale decision picture. The transaction timetable should specify cut-off dates and bring-down procedures for material contracts, customer losses, receivables, security incidents, regulatory developments and key employees. Management should certify the defined evidence set, and specialist advisers should report unresolved scope limits. The final model should retain a bridge from the diligence cut-off to completion so that the investor can identify changes in revenue quality, cash need and milestone feasibility before funds are released.
Approval should state price, instrument, tranche, reserve, governance, key risks, reporting, next evidence gate and stop conditions. The final record should explain the residual customer, sponsor, channel, implementation, retention, data, regulatory, cyber and financing risks accepted by the investor. A defensible growth-equity case finances a verified route from market access to collected recurring value.
The committee secretary should retain the evidence index, challenge log, approvals, conditions and post-completion monitoring timetable as part of the permanent transaction record.
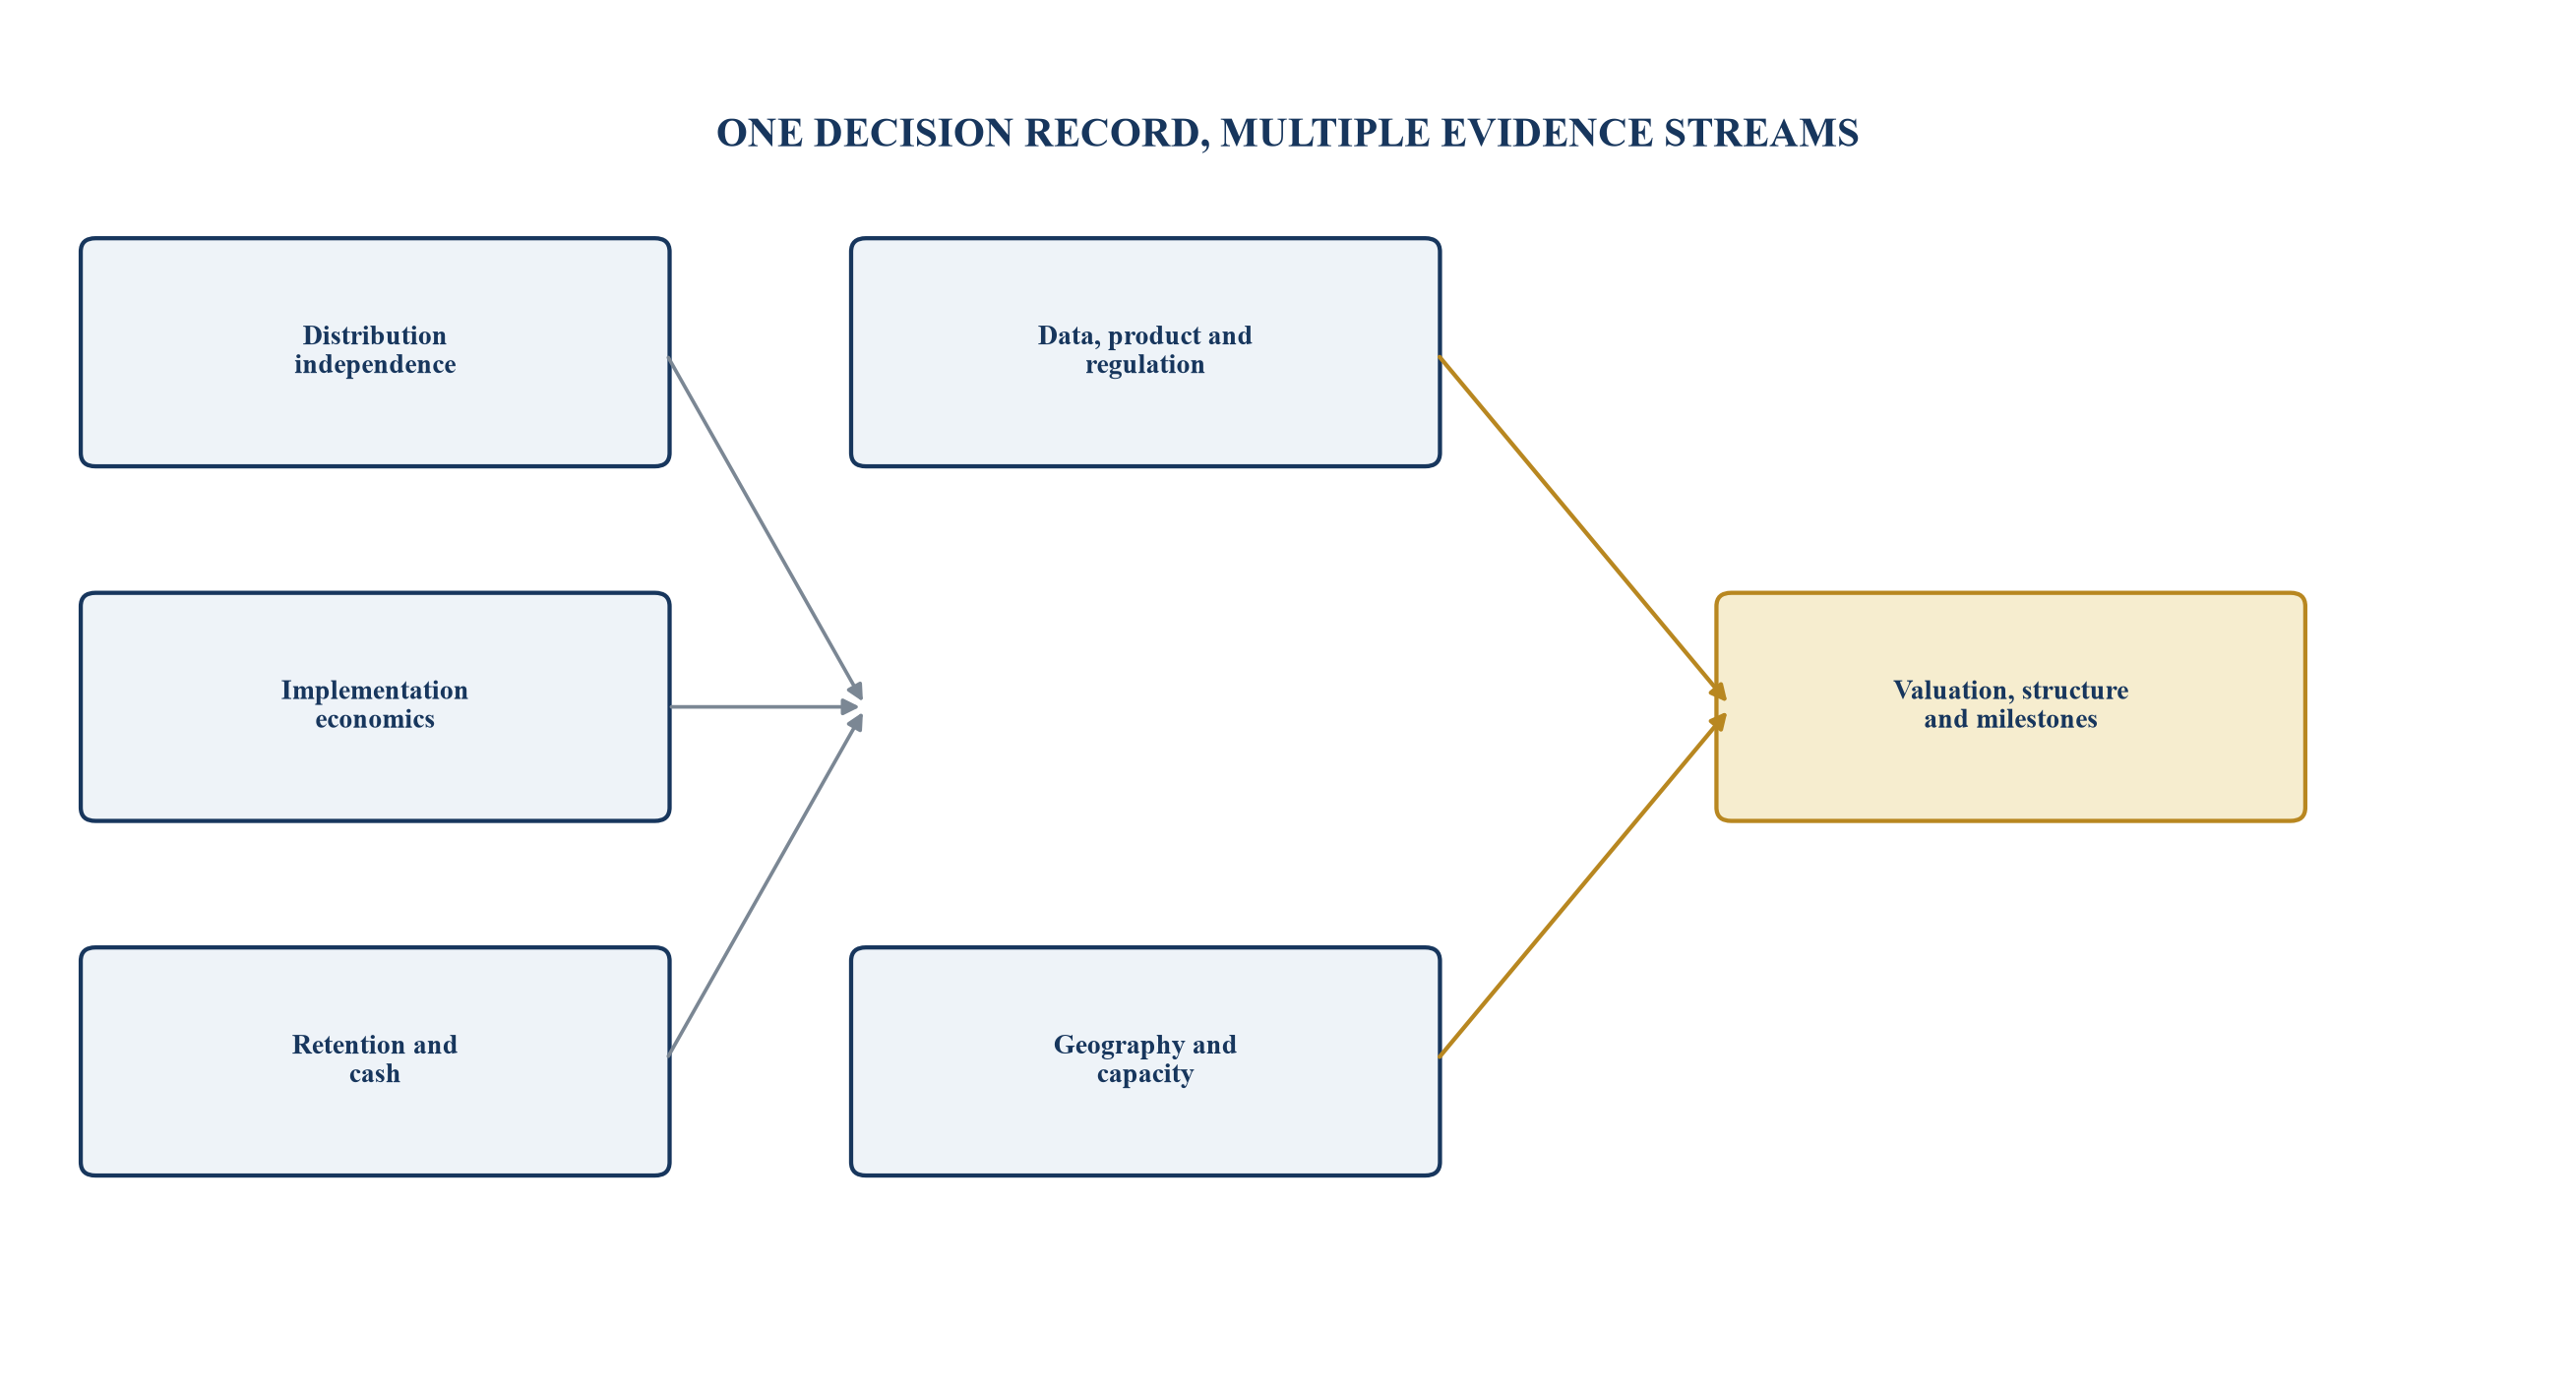
The final decision integrates commercial, operating, regulatory and financing evidence.
References
- Dubai Land Department. Dubai Real Estate Sector Strategy 2033 poised to drive significant growth in transactions and international investments, 28 October 2024. https://dubailand.gov.ae/en/news-media/dubai-real-estate-sector-strategy-2033-poised-to-drive-significant-growth-in-transactions-and-international-investments/
- Dubai Land Department. Dubai Land Department enriches PropTech Connect 2026 with strategic discussions on innovation, governance, and the future of real estate investment, 4 February 2026. https://dubailand.gov.ae/en/news-media/dubai-land-department-enriches-proptech-connect-2026-with-strategic-discussions-on-innovation-governance-and-the-future-of-real-estate-investment/
- Dubai Land Department. Real Estate Evolution Space. https://dubailand.gov.ae/en/eservices/real-estate-evolution-space/
- Dubai Land Department. Dubai Land Department launches pilot phase of the Real Estate Tokenisation Project, 19 March 2025. https://dubailand.gov.ae/en/news-media/dubai-land-department-launches-pilot-phase-of-the-real-estate-tokenisation-project
- Dubai Land Department. Dubai's Real Estate Sector records AED 761 billion in transactions in 2024. https://dubailand.gov.ae/en/news-media/dubai-s-real-estate-sector-records-aed761-billion-in-transactions-in-2024
- Real Estate General Authority. Saudi PropTech Hub. https://rega.gov.sa/en/rega-services/platforms/saudi-proptech-hub/
- Real Estate General Authority. REGA launches Saudi PropTech Hub. https://rega.gov.sa/en/media-center/news-announcements/rega-launches-saudi-proptech-hub-sph/
- Real Estate General Authority. REGA signs MoU with Public Investment Fund to enhance Kingdom's role as PropTech center. https://rega.gov.sa/en/media-center/news-announcements/rega-signs-mou-with-public-investment-fund-to-enhance-kingdoms-role-as-proptech-center/
- Real Estate General Authority. PropTech leading radical transformation in Saudi real estate sector. https://rega.gov.sa/en/media-center/news-announcements/proptech-leading-radical-transformation-in-saudi-real-estate-sector/
- IFRS Foundation. IFRS 15 Revenue from Contracts with Customers. https://www.ifrs.org/issued-standards/list-of-standards/ifrs-15-revenue-from-contracts-with-customers/
- IFRS Foundation. IFRS 15 supporting materials. https://www.ifrs.org/supporting-implementation/supporting-materials-by-ifrs-standards/ifrs-15/
- IFRS Foundation. IAS 38 Intangible Assets. https://www.ifrs.org/issued-standards/list-of-standards/ias-38-intangible-assets/
- IFRS Foundation. IAS 36 Impairment of Assets. https://www.ifrs.org/issued-standards/list-of-standards/ias-36-impairment-of-assets/
- United Arab Emirates Government. Data protection laws. https://u.ae/en/about-the-uae/digital-uae/data/data-protection-laws.
- Saudi Data and Artificial Intelligence Authority. Personal Data Protection Law. https://sdaia.gov.sa/en/SDAIA/about/Documents/Personal%20Data%20English%20V2-23April2023-%20Reviewed-.pdf
- Saudi Data and Artificial Intelligence Authority. Laws and Regulations. https://sdaia.gov.sa/en/SDAIA/about/Pages/RegulationsAndPolicies.aspx
- National Institute of Standards and Technology. Artificial Intelligence Risk Management Framework 1.0. https://doi.org/10.6028/NIST.AI.100-1
- National Institute of Standards and Technology. AI Risk Management Framework. https://www.nist.gov/itl/ai-risk-management-framework
- Procore Technologies, Inc. Annual Report on Form 10-K for the year ended 31 December 2025. https://www.sec.gov/Archives/edgar/data/1611052/000162828026011055/pcor-20251231.htm
- Procore Technologies, Inc. Annual Report on Form 10-K for the year ended 31 December 2024. https://www.sec.gov/Archives/edgar/data/1611052/000162828025008121/pcor-20241231.htm
- AppFolio, Inc. Annual Report on Form 10-K for the year ended 31 December 2025. https://www.sec.gov/Archives/edgar/data/1433195/000143319526000011/appf-20251231.htm
- CoStar Group, Inc. Annual Report on Form 10-K for the year ended 31 December 2025. https://www.sec.gov/Archives/edgar/data/1057352/000105735226000020/csgp-20251231.htm
- Autodesk, Inc. Annual Report on Form 10-K for the year ended 31 January 2026. https://www.sec.gov/Archives/edgar/data/769397/000076939726000015/adsk-20260131.htm
- Autodesk, Inc. Annual Report on Form 10-K for the year ended 31 January 2025. https://www.sec.gov/Archives/edgar/data/769397/000076939725000019/adsk-20250131.htm
- Bentley Systems, Incorporated. Annual Report on Form 10-K for the year ended 31 December 2025. https://www.sec.gov/Archives/edgar/data/1031308/000103130826000007/bsy-20251231.htm
- Organisation for Economic Co-operation and Development. OECD AI Principles. https://oecd.ai/en/ai-principles
- International Organization for Standardization. ISO/IEC 27001 Information security management systems. https://www.iso.org/isoiec-27001-information-security.html
