

1. Frame the credit decision
The core decision is how much to lend against an equipment fleet, for how long, on what principal profile and with what monitoring controls. The answer depends on the borrower's capacity to service debt and the lender's ability to identify, control and realise the financed assets. Residual value is therefore part of credit design rather than a final recovery estimate.
A robust decision separates five values. Invoice value is the contracted acquisition price. Market value is the price expected in an orderly transaction at the valuation date. Economic value reflects expected productive cash flows to the current operator. Gross residual value is the expected sale price at a future date. Net realisable value deducts the costs and delay required to repossess, repair, move, store and sell the asset. Credit protection should be calibrated to the last measure under a stated stress.
The framework asks whether asset evidence is sufficiently reliable to change a lending decision. A model can support a higher advance rate only when identity, title, usage, maintenance and market evidence are controlled. Sparse or manipulable evidence should increase uncertainty and reduce reliance on the estimated residual value.
| Decision | Principal evidence | Model output | Credit consequence |
|---|---|---|---|
| Initial advance rate | Invoice, equipment identity, age, specification, comparable sales | Day-one value range and confidence | Facility amount and borrower equity |
| Tenor and amortisation | Expected hours, duty cycle, maintenance plan, value curve | Monthly downside residual value | Principal schedule and balloon limit |
| Monitoring | Telematics, service records, location, insurance, payment history | Updated condition and value score | Alerts, cash sweep or inspection |
| Covenant reset | Utilisation, maintenance exceptions, market liquidity | Coverage and forecast breach | Cure, additional collateral or repricing |
| Recovery strategy | Title, location, condition, buyers, costs and sale time | Net realisable value distribution | Restructure, consensual sale or enforcement |
Each decision should rely on evidence that can be reproduced and monitored through the loan term.
2. Define the equipment perimeter
The portfolio should be segmented by asset class, manufacturer, model, specification, age, ownership chain, application and geography. A hydraulic excavator working in a controlled quarry has a different degradation path from the same model used intermittently across urban construction sites. A generator operated near rated load has a different risk profile from one exposed to repeated overload and poor fuel quality.
Identity is foundational. The lender should reconcile manufacturer serial number, engine number, chassis number where applicable, invoice, insurance, registration, tax records, borrower fixed-asset register, inspection photographs and security documents. Attachments and major components need their own identifiers when they represent a material share of value. Duplicate serial numbers, undocumented replacements and inconsistent specifications should block automated valuation until resolved.
The perimeter should also capture assets that cannot readily be separated from a plant, licence or site. Equipment may have high value in use while offering limited removal value. Foundations, utilities, calibration, software licences and environmental obligations can make physical recovery expensive. These factors belong in the collateral model before the facility is sized.
3. Build a reliable data spine
A predictive model requires a controlled record linking the loan, borrower, asset, operator, site, service history and market observations. The lender should establish a canonical asset identifier and record the provenance, timestamp and owner of each input. Raw telemetry, inspection evidence and market transactions should remain traceable after transformations.
Data quality should be measured. Completeness tests identify missing periods and fields. Consistency tests compare reported hours with fuel use, production records and service intervals. Plausibility tests identify impossible locations, negative hours or abrupt counter resets. Reconciliation tests connect financed cost, disbursement, asset registration and accounting records. A model confidence score should reflect these controls rather than treating every record as equally reliable.
The data spine should preserve historical values. Overwriting an hour reading or condition grade destroys the audit trail needed to explain a valuation change. Versioned records allow the lender to distinguish genuine deterioration from a corrected data error.
4. Capture equipment identity and title
Residual value is useful only if the lender can establish what the asset is and what rights attach to it. The security pack should identify the legal owner, financing party, asset, perfection steps, insurance interest, restrictions on disposal and the process for release. Company charges, security-interest filings and transport registrations may apply depending on asset and borrower structure. Transaction counsel should confirm the requirements for each facility.
The lender should treat title evidence as a scored control. A clean chain from supplier invoice to borrower and lender security receives a stronger score than a chain dependent on unexplained transfers, related-party invoices or missing original records. Imported equipment requires evidence of customs clearance, duties, specification and local support. Refurbished equipment requires evidence of the base machine, replaced components and warranty.
Title uncertainty affects both probability of recovery and time to sale. The model should therefore apply a legal-control adjustment rather than merely record title as a binary field. An asset with strong physical value and weak enforceability can have low net realisable value to the lender.
5. Convert usage into economic age
Calendar age is a poor standalone measure for working equipment. Economic age combines cumulative hours, load, idle time, duty cycle, starts, temperature, vibration, fuel consumption and operating environment. The relevant measures vary by equipment class.
Usage should be normalised against the expected productive life of major components. Two machines with 6,000 hours can have different remaining lives when one worked at stable load with scheduled servicing and the other experienced repeated overload, dust ingress or overheating. A usage severity index can weight hours by operating conditions and convert them into equivalent standard hours.
The model should distinguish productive use from under-utilisation. High utilisation can accelerate wear while demonstrating demand and cash generation. Low utilisation can preserve physical condition while signalling project delay, weak deployment or poor borrower economics. Credit monitoring requires both interpretations.
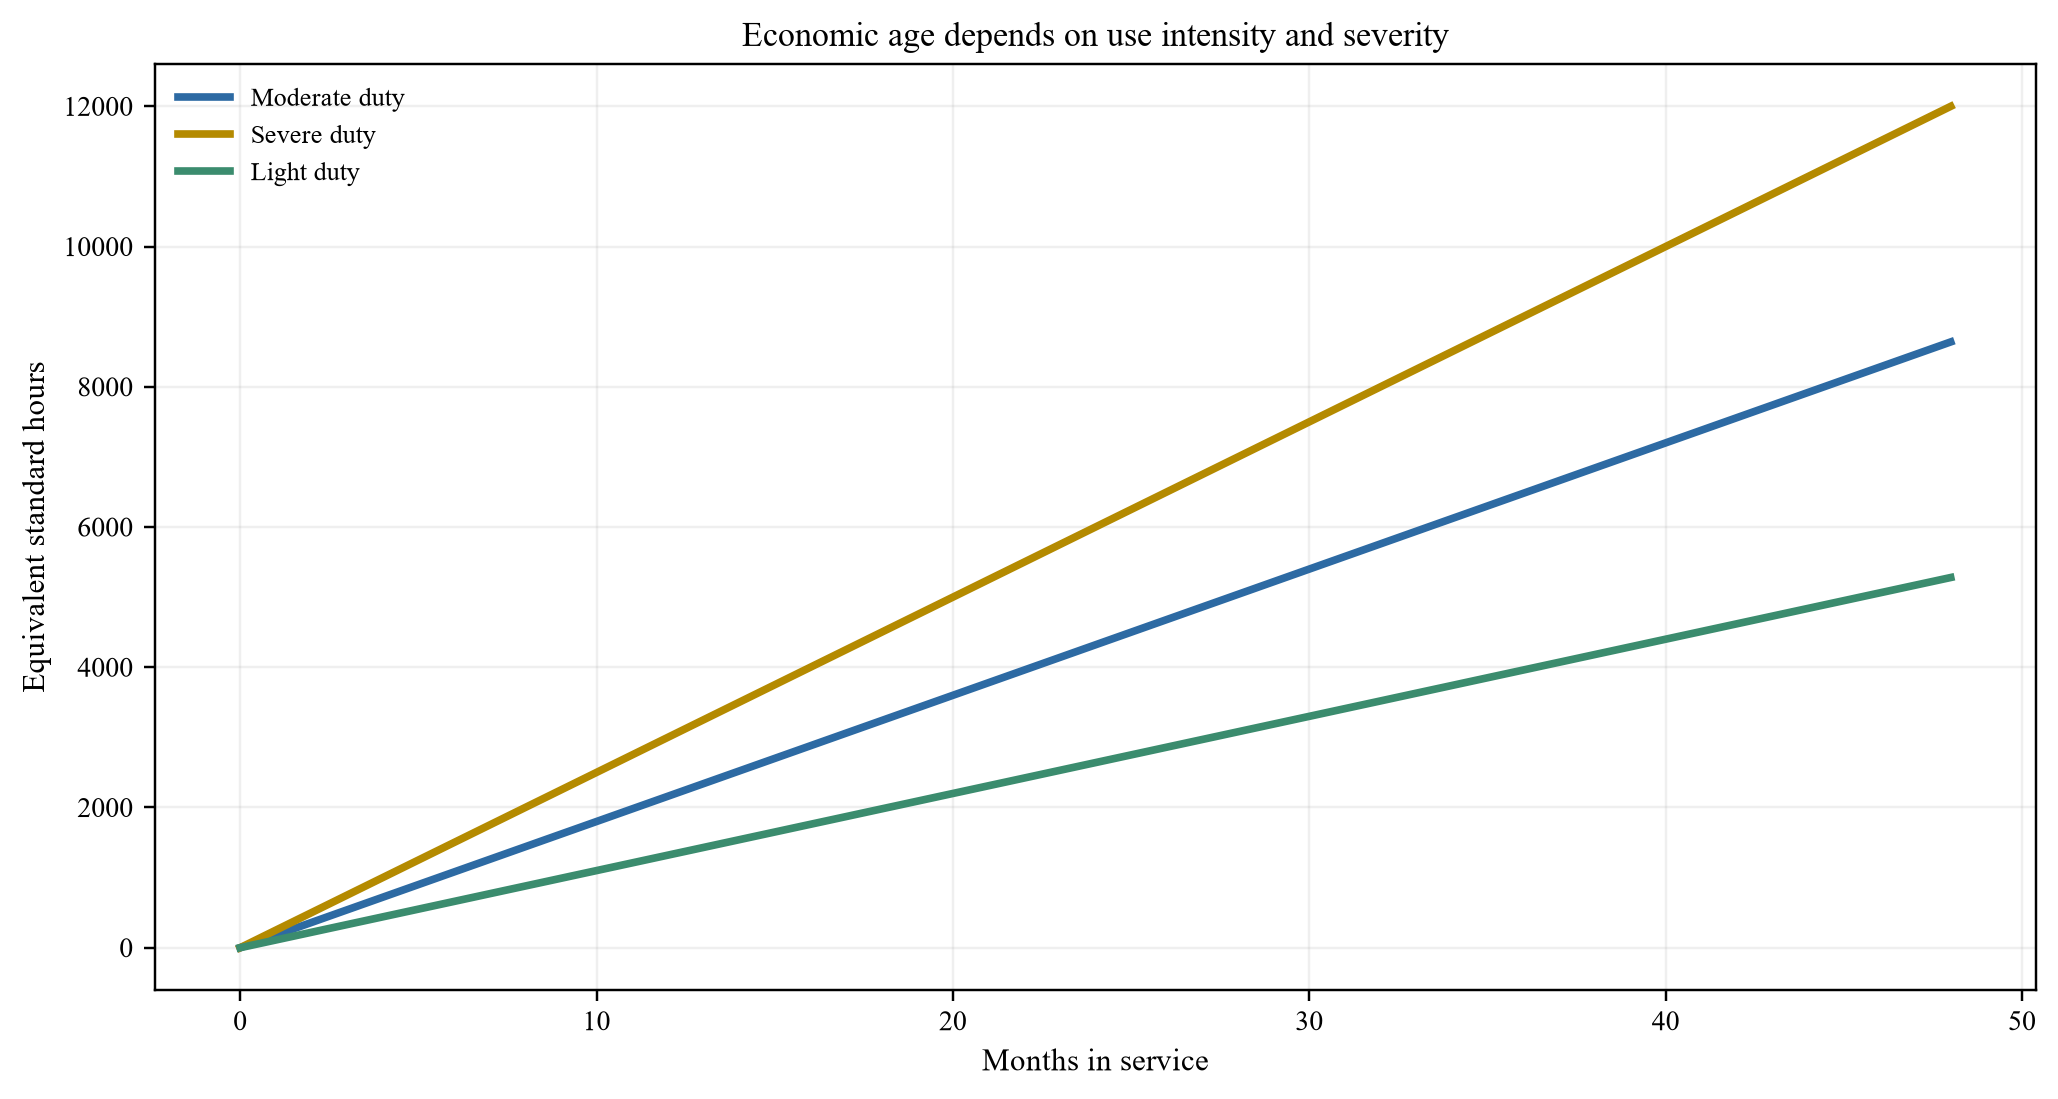
Equivalent hours reflect duty severity; the same calendar age can produce materially different remaining useful life.
6. Score maintenance quality
Maintenance records should be translated into evidence of condition and remaining life. The model should capture scheduled-service compliance, oil and filter changes, fluid analysis, fault codes, wear measurements, component rebuilds, parts quality, authorised-service involvement and unresolved defects.
A maintenance score should reward timely, verifiable work and penalise gaps, repeated faults, deferred replacements and inconsistent hour readings. Expenditure alone is insufficient. A large repair bill may restore value or reveal persistent failure. The model should distinguish preventive maintenance, normal wear, major overhaul and accident repair.
Independent inspections remain necessary. Digital records can be incomplete or altered. Physical inspection should test identity, operating hours, leaks, structural damage, tyres or tracks, hydraulics, electronics, safety systems and attachments. The inspection protocol should be consistent enough to train and validate the model.
7. Observe condition directly
Condition grades should connect physical evidence to expected repair cost and saleability. A five-grade system can be supported by measurable thresholds for structural integrity, powertrain performance, undercarriage or tyres, hydraulics, cab and controls, appearance and documentation. Photographs should be time-stamped and linked to the asset identifier.
Computer vision can assist with surface damage, corrosion, tyre wear and component presence. Its output should remain an input to a controlled valuation process. Image quality, lighting, angle, concealed defects and model drift can affect reliability. Human review is required for high-value exceptions and any decision that materially changes credit terms.
Condition should influence both expected price and uncertainty. A machine with a known repair requirement may be easier to value than one with sparse evidence. The model should widen the distribution when evidence is weak.
8. Establish the secondary-market dataset
Residual-value modelling needs observed transactions, asking prices, auction results, dealer bids, repossession outcomes and days to sale. Each observation should record model, year, hours, specification, condition, location, seller type, sale channel, taxes, buyer premium, currency, date and whether the transaction completed.
Asking prices should not be treated as sale prices. Auction results require adjustment for buyer fees, transport, incomplete inspections and distress. Dealer bids include inventory, warranty and margin considerations. Private sales may provide limited verification. The model should retain source type and apply evidence weights.
Sparse markets require hierarchical modelling. Evidence can be pooled across related models, power bands or applications while preserving equipment-specific adjustments. The result should disclose the extent to which the estimate depends on broader category evidence.
9. Normalise market observations
Comparable transactions should be adjusted for time, geography, specification, hours, condition and sale channel. Inflation and foreign-exchange movements can affect imported-equipment prices. Supply disruptions can temporarily increase used values. New-model introductions can reduce the price of older technology.
The adjustment process should avoid false precision. A transparent comparable grid may be more reliable than a complex model trained on a small or biased dataset. The model should report the number of comparable observations, their dispersion and distance from the subject asset.
Outliers require review. A high price may include attachments or a service contract. A low price may reflect missing title, fire damage or a forced sale. Removing observations without a documented rule can introduce bias.
10. Model gross residual value
The base model can combine a depreciation curve with adjustments for economic age, maintenance, condition, specification, geography and market liquidity. More advanced approaches can use gradient boosting, survival models or Bayesian hierarchies when data volume and governance support them. The selected method should be explainable to credit officers and independently validated.
The output should be a distribution rather than one number. The central estimate supports expected economics. A lower percentile supports collateral protection. An extreme stress supports limits, capital planning and workout readiness. Confidence should fall when data are sparse or out of distribution.
The model should also estimate remaining useful life and probability of major component failure. Residual value may decline abruptly when an overhaul becomes due. A smooth depreciation curve can hide this cliff.
Feature selection should follow economic logic. Manufacturer, model, configuration, age, equivalent hours, maintenance compliance, condition, geography, sale channel and market date have direct links to value. Borrower identity or dealer relationship may appear predictive because of historical practices, yet those variables can encode underwriting selection or inconsistent recovery effort. Their use should be challenged before they influence price. The model should also avoid using information that would not have been available on the valuation date.
Forecast intervals should widen with horizon. A month-six estimate for a standard machine with active market evidence can be relatively tight. A month-forty-eight estimate for specialised equipment is exposed to technology, macroeconomic and liquidity change. The credit structure should respond through a lower balloon, faster principal reduction or a contractual revaluation point. Reporting only a central percentage would conceal the uncertainty that matters most to the lender.
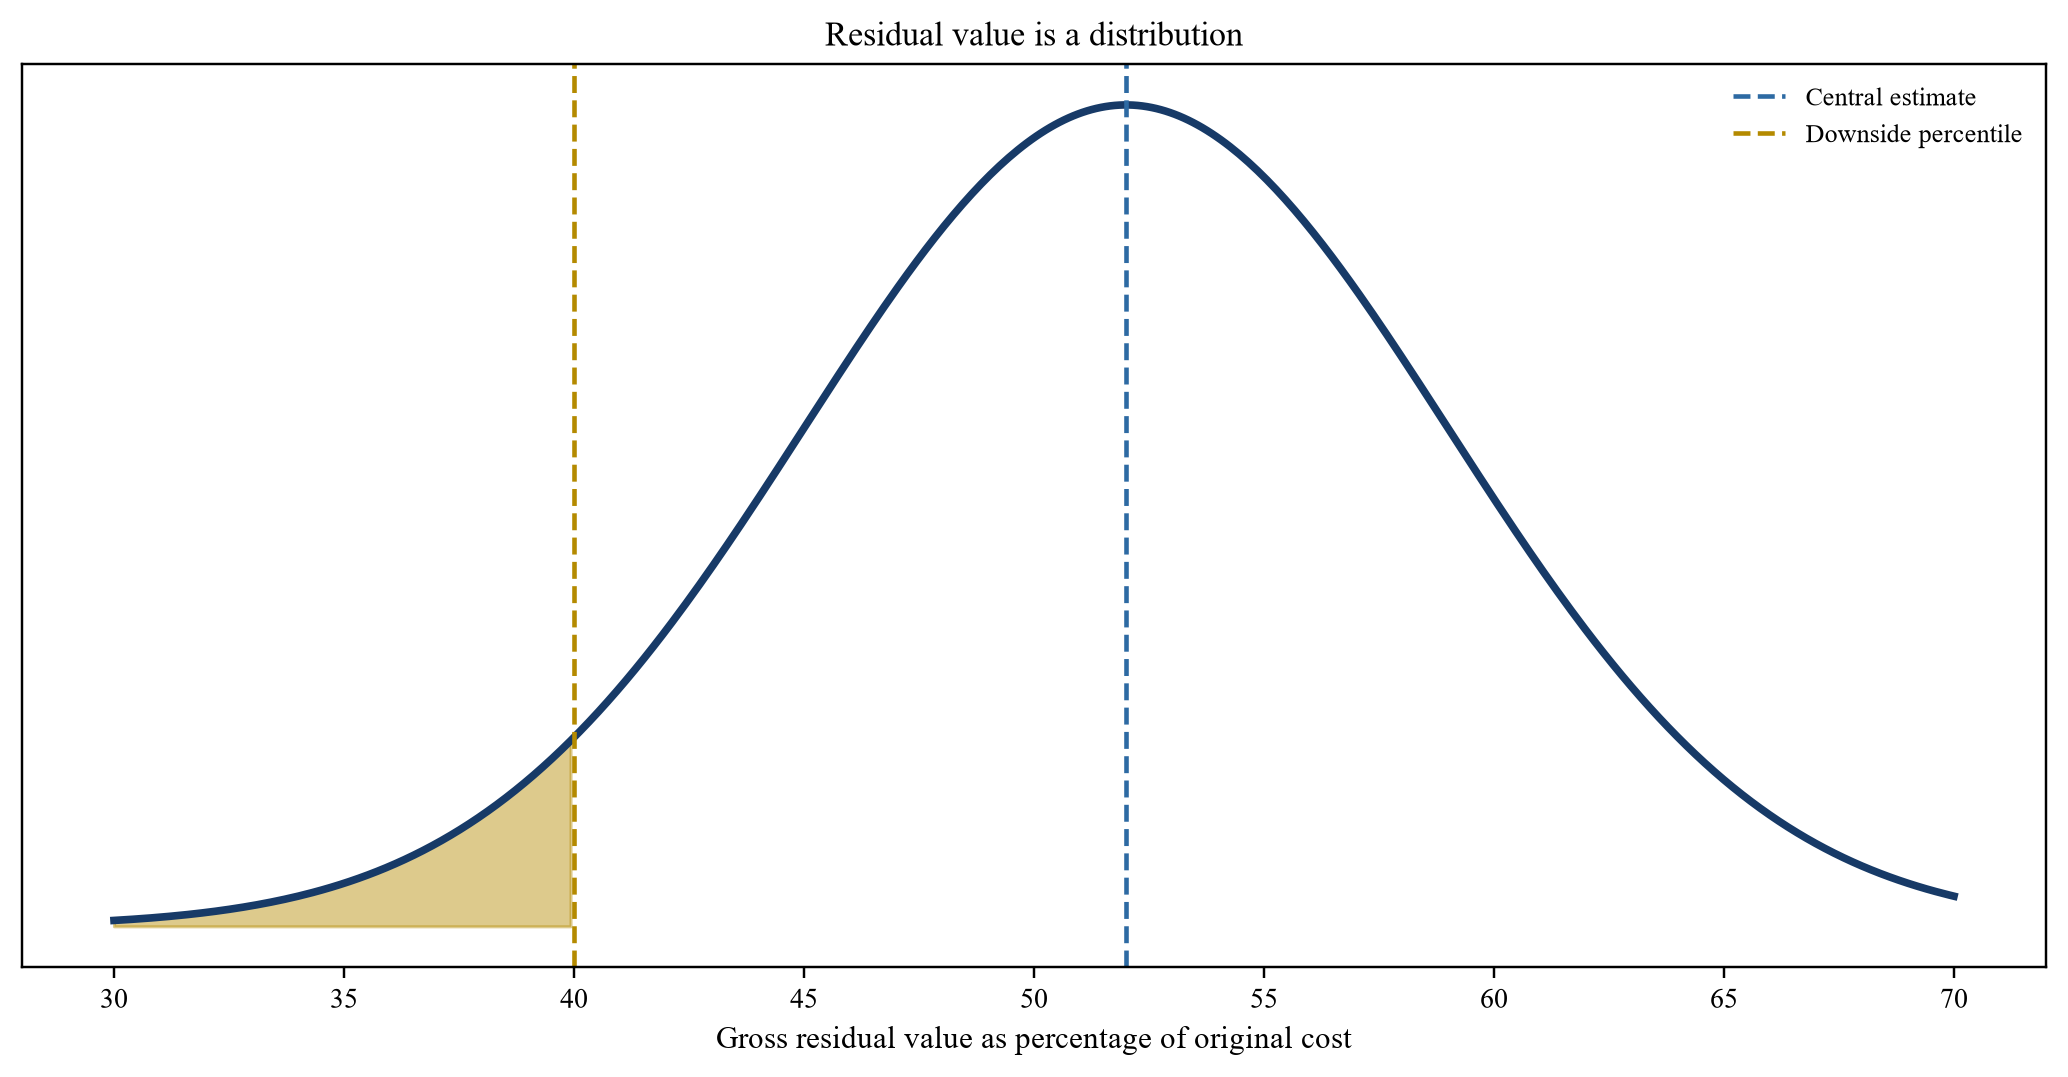
Credit design uses a downside percentile and recognises forecast uncertainty rather than relying only on the central estimate.
11. Deduct recovery friction
Gross sale value is not collateral value. The lender should deduct repossession, legal, transport, de-installation, repair, storage, insurance, auction, tax and selling costs. It should also discount for time to possession and sale. Each cost should be supported by portfolio experience or a stated management assumption.
Recovery friction varies materially. Mobile standard equipment with national dealer support can have a broad buyer pool. Specialised machinery may require disassembly, technical recommissioning and a cross-border buyer. Equipment inside a disputed site may remain inaccessible. The model should distinguish these cases.
Time matters because principal, interest, insurance and deterioration continue during recovery. A twelve-month delay can erode value even if the expected sale price is unchanged. The net-realisable-value calculation should show both cash costs and time value.
12. Estimate market liquidity
Liquidity should be measured through expected days to sale, number of credible buyers, dispersion between bids, auction clearance rates and dealer inventory. A high quoted price in a thin market may offer less protection than a lower price supported by frequent transactions.
Liquidity can be cyclical. Construction equipment values may weaken when projects slow and multiple lenders repossess similar machines. Correlation between borrower default and equipment prices is therefore important. A downturn can reduce both service capacity and collateral value.
The lender should apply concentration limits by model, sector, region and disposal channel. A portfolio of similar machines can overwhelm the local resale market even when each asset is individually saleable.
13. Link residual value to advance rate
The advance rate should reflect downside net realisable value, data confidence, borrower risk, legal control and portfolio concentration. A strong borrower does not remove collateral uncertainty. Strong collateral does not replace cash-flow underwriting.
A decision grid can start with a maximum percentage of verified invoice cost and a maximum percentage of downside net realisable value. The lower result sets the asset-supported limit. The lender then applies borrower, sector and concentration limits.
Higher data quality can support more efficient capital while preserving protection. The benefit should arise from narrower uncertainty and stronger controls rather than an automatic premium for connected equipment.
| Evidence and liquidity | Strong borrower | Moderate borrower | Weak or volatile borrower |
|---|---|---|---|
| High confidence; liquid market | 75% of invoice cost; 80% of downside NRV | 70%; 75% | 60%; 65% |
| Moderate confidence; normal market | 70%; 75% | 65%; 70% | 55%; 60% |
| Low confidence or thin market | 55%; 60% | 50%; 55% | Case-specific or decline |
Percentages are hypothetical management assumptions and should be calibrated to lender policy and portfolio evidence.
14. Design amortisation around value
Principal should decline at least as fast as the lender's required collateral cover after allowing for uncertainty and costs. Straight-line or equal-instalment structures can create periods when principal exceeds the downside value path. A value-linked schedule uses the projected lower-percentile net realisable value as a ceiling.
The schedule should also fit borrower cash flows. Seasonal contractors may need sculpted payments. A grace period can be appropriate during mobilisation, but deferred principal should remain within collateral and cash-flow limits. Balloons require a credible refinance, sale or retained-value case.
The model should identify future value cliffs, such as warranty expiry, overhaul thresholds, regulatory restrictions or model obsolescence. Principal should step down before those events.
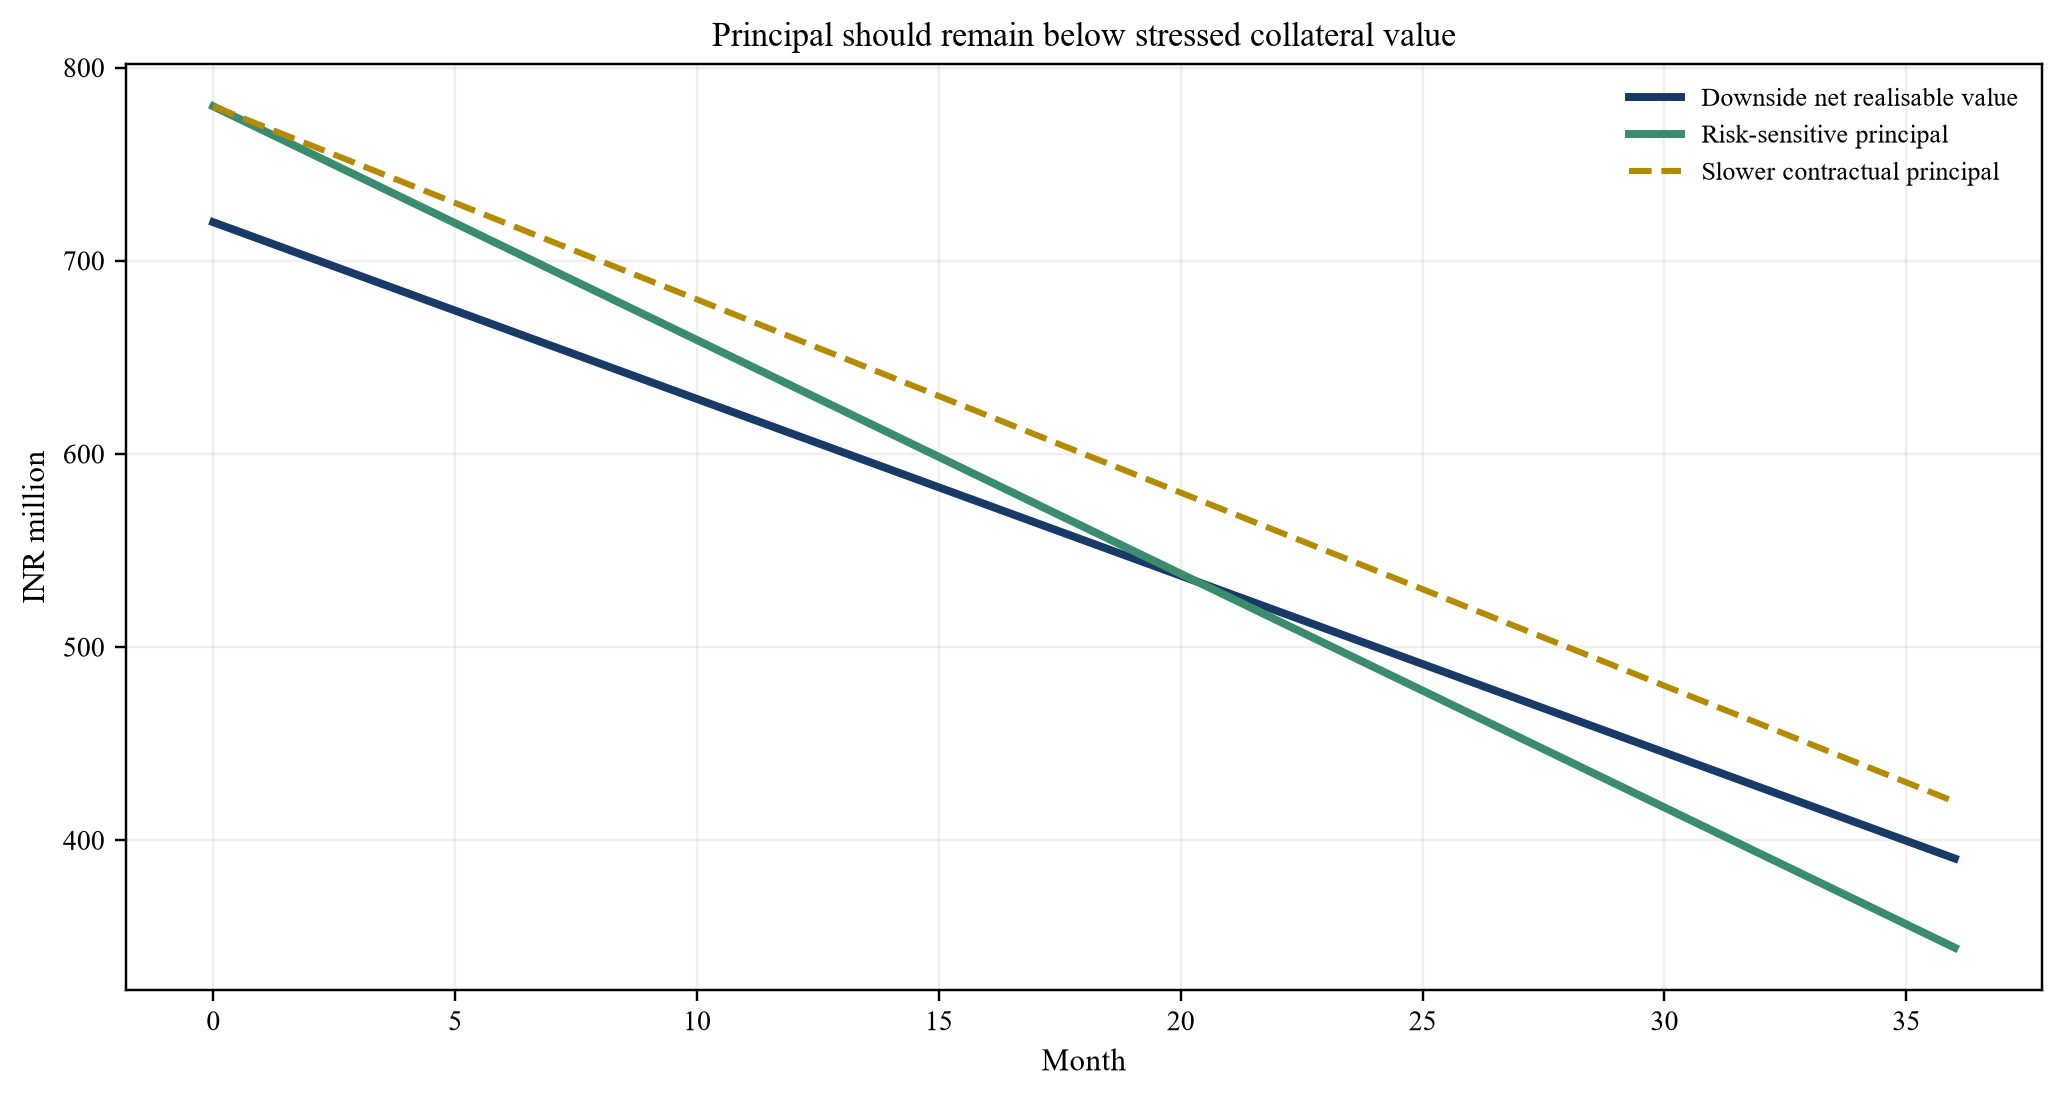
The risk-sensitive schedule preserves a minimum collateral-cover buffer through the facility term.
15. Price model and execution risk
The interest margin should compensate for borrower credit risk, asset uncertainty, operating cost, capital, liquidity and expected loss. It should not conceal an under-advanced facility or weak security. Origination fees, monitoring costs and prepayment terms should be transparent and consistent with applicable regulation and contracts.
Model risk has economic value. A facility dependent on sparse or unvalidated predictions should carry a lower advance rate, tighter tenor or additional reserve. Reliable telemetry can reduce monitoring cost, but only when the lender can access, interpret and retain the data.
Pricing should be linked to observable improvements where appropriate. Verified maintenance, reduced utilisation severity or additional collateral can justify a reset. Deterioration can trigger additional protection within agreed terms.
16. Establish monitoring triggers
Monitoring should focus on events that change service capacity or collateral value. Relevant triggers include missed payments, location outside approved areas, telemetry interruption, excessive hours, overheating, fault-code frequency, delayed service, insurance lapse, unauthorised disposal, title change, accident and weak project utilisation.
Each trigger needs a threshold, owner, response time and escalation path. A disconnected device should not automatically prove misconduct. The lender should first test power, connectivity, vendor availability and authorised maintenance. Repeated unexplained gaps can justify inspection.
Portfolio monitoring should show trends, not only exceptions. Deteriorating maintenance across a borrower fleet may indicate liquidity stress before arrears emerge.
| Trigger | Validation | Credit response | Operational response |
|---|---|---|---|
| Telemetry gap above seven days | Device and network check | Heightened watch | Borrower contact and inspection |
| Service overdue by 15% of interval | Service records and dealer confirmation | Suspend further draw | Complete service and evidence |
| Severe utilisation above plan | Project records and cash flow | Reforecast value and cover | Shorten inspection interval |
| Asset outside approved geography | GPS and movement authorisation | Covenant review | Locate and secure asset |
| Downside cover below threshold | Model rerun and independent review | Cure, prepayment or additional collateral | Disposal or restructuring plan |
Triggers require validation before contractual action.
17. Govern telemetry and borrower data
Usage and location data can be commercially sensitive and may include personal data. The lender should define the purpose, fields, frequency, retention, recipients and security controls before collection. Data should be limited to what underwriting, monitoring and recovery require.
Where digital-lending rules apply, regulated entities remain responsible for outsourced service providers. RBI guidance emphasises explicit consent, need-based collection, audit trails, privacy policies and controls on storage and access [1-2]. Transaction-specific legal advice is required because equipment telemetry can involve operators, employers, manufacturers and platform providers.
The borrower should understand what changes credit terms and how errors can be challenged. Model outputs should be reviewable. A device fault or data mismatch should have a correction process.
18. Validate the predictive model
Validation should test data lineage, conceptual logic, variable stability, performance, bias, explainability, overrides and implementation. Training and validation periods should be separated. The lender should compare predicted values with actual sale proceeds and record recovery costs.
Performance should be measured across equipment classes, ages, regions and market conditions. Average error can conceal systematic overvaluation of thinly traded assets. Tail performance matters because lending decisions rely on downside estimates.
Independent validation should challenge feature leakage, survivorship bias and selective sale data. Assets sold quickly and cleanly may dominate the dataset, while disputed or severely damaged assets are under-recorded. Recovery observations should include failures and delays.
19. Control model overrides
Credit officers need the ability to override a model when documented evidence falls outside its scope. Every override should record direction, magnitude, reason, evidence, approver and outcome. Override rates should be monitored by team, asset class and dealer.
Frequent upward overrides can indicate commercial pressure or an uncalibrated model. Frequent downward overrides may reveal missing risk variables. Outcome analysis should determine whether overrides improved realised performance.
No override should erase the original output. Governance requires a comparison between model, approved decision and realised result.
20. Integrate accounting and impairment
The collateral model can inform recovery assumptions in credit-risk measurement, but accounting treatment depends on the applicable framework and entity facts. Expected credit loss estimates require probability of default, exposure at default and loss given default across relevant scenarios. Residual value is one component of recoveries.
The finance and risk teams should reconcile valuation dates, discount rates, recovery timing and costs. A credit model used for pricing may differ from an accounting model used for impairment. Differences should be documented rather than concealed through manual adjustments.
Model changes need governance because they can affect origination economics, portfolio limits and reported impairment simultaneously.
21. Plan recovery before default
Recovery readiness should be established at origination. The lender should know where the asset is expected to operate, who can inspect it, how it can be immobilised lawfully, what permissions are needed to move it, which dealers or auction platforms can sell it and what repairs are economically justified.
Borrower cooperation can preserve value. A consensual sale may be faster and less destructive than contested enforcement. The workout plan should compare restructuring, voluntary surrender, managed sale and formal enforcement under realistic time and cost assumptions.
Safety and continuity matter. Heavy equipment should be shut down, transported and stored by qualified parties. Poor recovery execution can damage the asset and create liability.
22. Manage dealer and manufacturer dependence
Manufacturers and dealers can provide inspection, service, parts, telemetry and resale support. These capabilities can materially affect value. The lender should test whether support is contractual, transferable and available across the portfolio geography.
Dealer buybacks and residual-value guarantees require credit analysis of the provider and precise terms. A guarantee may exclude condition, hours, maintenance, location or timing. It may be an unsecured claim rather than immediate liquidity.
The model should avoid circular evidence. Dealer asking prices, dealer valuations and dealer guarantees from the same counterparty do not provide three independent confirmations.
23. Stress technology and transition risk
Equipment values can change when emissions rules, fuel economics, automation, safety standards, import restrictions or new technology alter buyer demand. Electric or hybrid equipment introduces battery state of health, charging compatibility and replacement cost. Connected equipment can depend on software, subscriptions and data access.
The lender should define technology cohorts and monitor price divergence. A category-level curve may overstate value when older specifications become less acceptable at major sites. Conversely, scarce proven equipment can retain value during supply constraints.
Stress scenarios should consider loss of manufacturer support, parts inflation, software discontinuation and regulatory limits on operation or resale.
24. Apply portfolio concentration controls
Asset-backed protection can weaken when defaults and values are correlated. A lender concentrated in one contractor segment, geography, project sponsor, model or dealer can face simultaneous arrears and a saturated resale market.
Concentration limits should use both exposure and stressed net realisable value. The lender should model how many units can be sold within a stated period without a material discount. Disposal capacity should be tested with dealers and auction channels.
Securitisation or portfolio financing requires consistent asset data, security evidence and performance history. Weak origination records can reduce funding value even when individual loans perform.
25. Demonstrate the framework
Consider a hypothetical portfolio of 120 construction and industrial machines with original equipment cost of INR 1.20 billion. Management assumes a proposed facility of INR 780 million, equal to 65% of cost, and a thirty-six-month term. Equipment identity, invoices, insurance and security evidence are complete for 114 machines; six require documentary cures before drawdown.
Usage and maintenance evidence produces three cohorts. Fifty machines have high-confidence telemetry and timely service. Forty-five have moderate evidence with several short gaps. Twenty-five have sparse telemetry or independent service histories. The model estimates central gross residual value at month thirty-six of INR 585 million and downside gross residual value of INR 465 million.
Assumed recovery deductions comprise INR 18 million of repossession and legal cost, INR 21 million of transport and storage, INR 16 million of repairs and preparation, INR 10 million of selling cost and INR 10 million of timing discount. Downside net realisable value is therefore INR 390 million. A value-linked principal schedule reduces outstanding principal to INR 344 million at month thirty-six, yielding 1.13 times downside cover.
| Item | Day one | Month 18 | Month 36 |
|---|---|---|---|
| Original equipment cost | 1,200 | 1,200 | 1,200 |
| Central gross residual value | 1,020 | 780 | 585 |
| Downside gross residual value | 900 | 630 | 465 |
| Recovery and timing costs | (72) | (70) | (75) |
| Downside net realisable value | 828 | 560 | 390 |
| Risk-sensitive principal | 780 | 560 | 344 |
| Downside collateral cover | 1.06x | 1.00x | 1.13x |
All figures are hypothetical management assumptions in INR million.
26. Translate findings into terms
The illustrative facility would use staged drawdown. The six assets with documentary gaps remain ineligible until cured. Advance rates vary by evidence cohort, with lower limits for sparse telemetry and thin secondary markets. Principal follows the downside value path and includes a minimum cover test.
Covenants require insurance, maintenance, location reporting, inspection rights, restrictions on disposal and timely data access. A sustained breach of downside cover triggers a cure through prepayment, additional collateral or an approved disposal. Model changes cannot alter contractual terms without the agreed process.
The lender should also retain discretion to reject assets outside the validated model domain. Predictive capability does not convert unsuitable collateral into acceptable security.
27. Implement in four stages
The first stage establishes identity, security, data rights and portfolio segmentation. The second stage builds comparable-sales and recovery-cost datasets. The third stage pilots predictive estimates alongside existing valuations without changing credit decisions. The fourth stage introduces controlled decision use after validation and approval.
Implementation should prioritise a small number of material equipment classes with sufficient observations. Data collection should serve specific decisions. Dashboards and devices should follow the credit design.
Quarterly governance should review model performance, overrides, realised recoveries, data incidents, concentration and market change. Material deterioration should trigger recalibration or restricted use.
The identity stage should begin with an exception census rather than a technology rollout. Every financed unit should be matched to its invoice, supplier, serial number, borrower ledger, security record, insurance schedule, location and current operating status. The implementation team should quantify unmatched assets, duplicate identifiers, missing documents, expired insurance and disputed ownership. Exceptions should be assigned to named owners with cure dates. The initial result is a controlled asset register that can support inspection and recovery even before a predictive model exists.
The market-data stage should define what qualifies as an observation. Verified sale proceeds, auction hammer prices, dealer purchases, trade-ins, asking prices and independent valuations should remain separate evidence classes. Gross price should be reconciled to taxes, commissions, transport, repair and time to cash. When the lender records a repossession, it should preserve the last pre-default estimate, condition at possession, expenditure after possession, sale process, bids received and final net proceeds. This creates a feedback loop that commercial data feeds alone cannot provide.
The shadow-model stage should run predictions without changing approvals. Credit officers should continue using the existing policy while the model records what it would have predicted. The validation team can then compare model outputs with independent valuations, subsequent observations and realised sales. Shadow operation reveals practical problems such as delayed telemetry, model mappings that fail for attachments, inconsistent maintenance codes and assets outside the training population. It also provides evidence about whether a proposed downside percentile is sufficiently conservative.
Controlled credit use should start with defined equipment classes, exposure caps and override rules. The approval paper should state which decisions the model may support. It may determine an advance-rate band while leaving tenor and pricing to conventional credit judgement. It may provide a monitoring trigger without creating an automatic event of default. The boundary should be explicit in policy, contracts and system configuration. Expansion to new classes should require evidence, validation and approval.
The implementation team should include credit, collections, operations, legal, data, technology, valuation and frontline representatives. Dealer and manufacturer input can improve equipment knowledge, yet governance should protect lender independence. A commercial partner should not control both the source data and the final value used to size credit. Independent challenge is especially important where a manufacturer provides a buyback, maintenance plan and telemetry platform alongside the financed asset.
Systems should record the reason for every material state change. A lower residual value might result from additional hours, poor maintenance, market decline, damage, weaker title evidence or a revised model. The user should be able to see the driver and supporting record. This supports borrower discussions, credit review, audit and model improvement. It also reduces the risk that a complex output is treated as an unexplained score.
Training should focus on decisions and evidence. Originators need to understand which records affect eligibility and advance rate. Inspectors need consistent grading standards. Credit officers need to interpret distributions, confidence and out-of-domain warnings. Collections teams need to preserve condition and market evidence during recovery. Data teams need to understand the legal and commercial meaning of fields. A technically accurate model can fail when operational users collect inconsistent evidence or bypass controls.
Implementation success should be measured through credit outcomes. Suitable measures include reduced documentary exceptions, better collateral coverage, lower forecast error, earlier detection of deterioration, shorter recovery time, lower recovery cost and improved net proceeds. Measures should be adjusted for portfolio mix and market conditions. A faster approval process can be valuable, but it should not be treated as success if exceptions, losses or disputes increase. Governance should review benefits and adverse outcomes together.
A formal review calendar should distinguish routine monitoring from material-change approval. Monthly operational review can address data completeness, device failures, overdue inspections and unresolved documentation. Quarterly credit review can assess coverage, concentration, overrides and early arrears. Annual validation can reassess model design, calibration and policy limits. A sudden market closure, regulatory change, technology discontinuation or material recovery shortfall should trigger an event-driven review. The committee should record decisions, limitations and corrective actions, then verify completion. This discipline helps the lender preserve a stable control environment while incorporating new evidence.
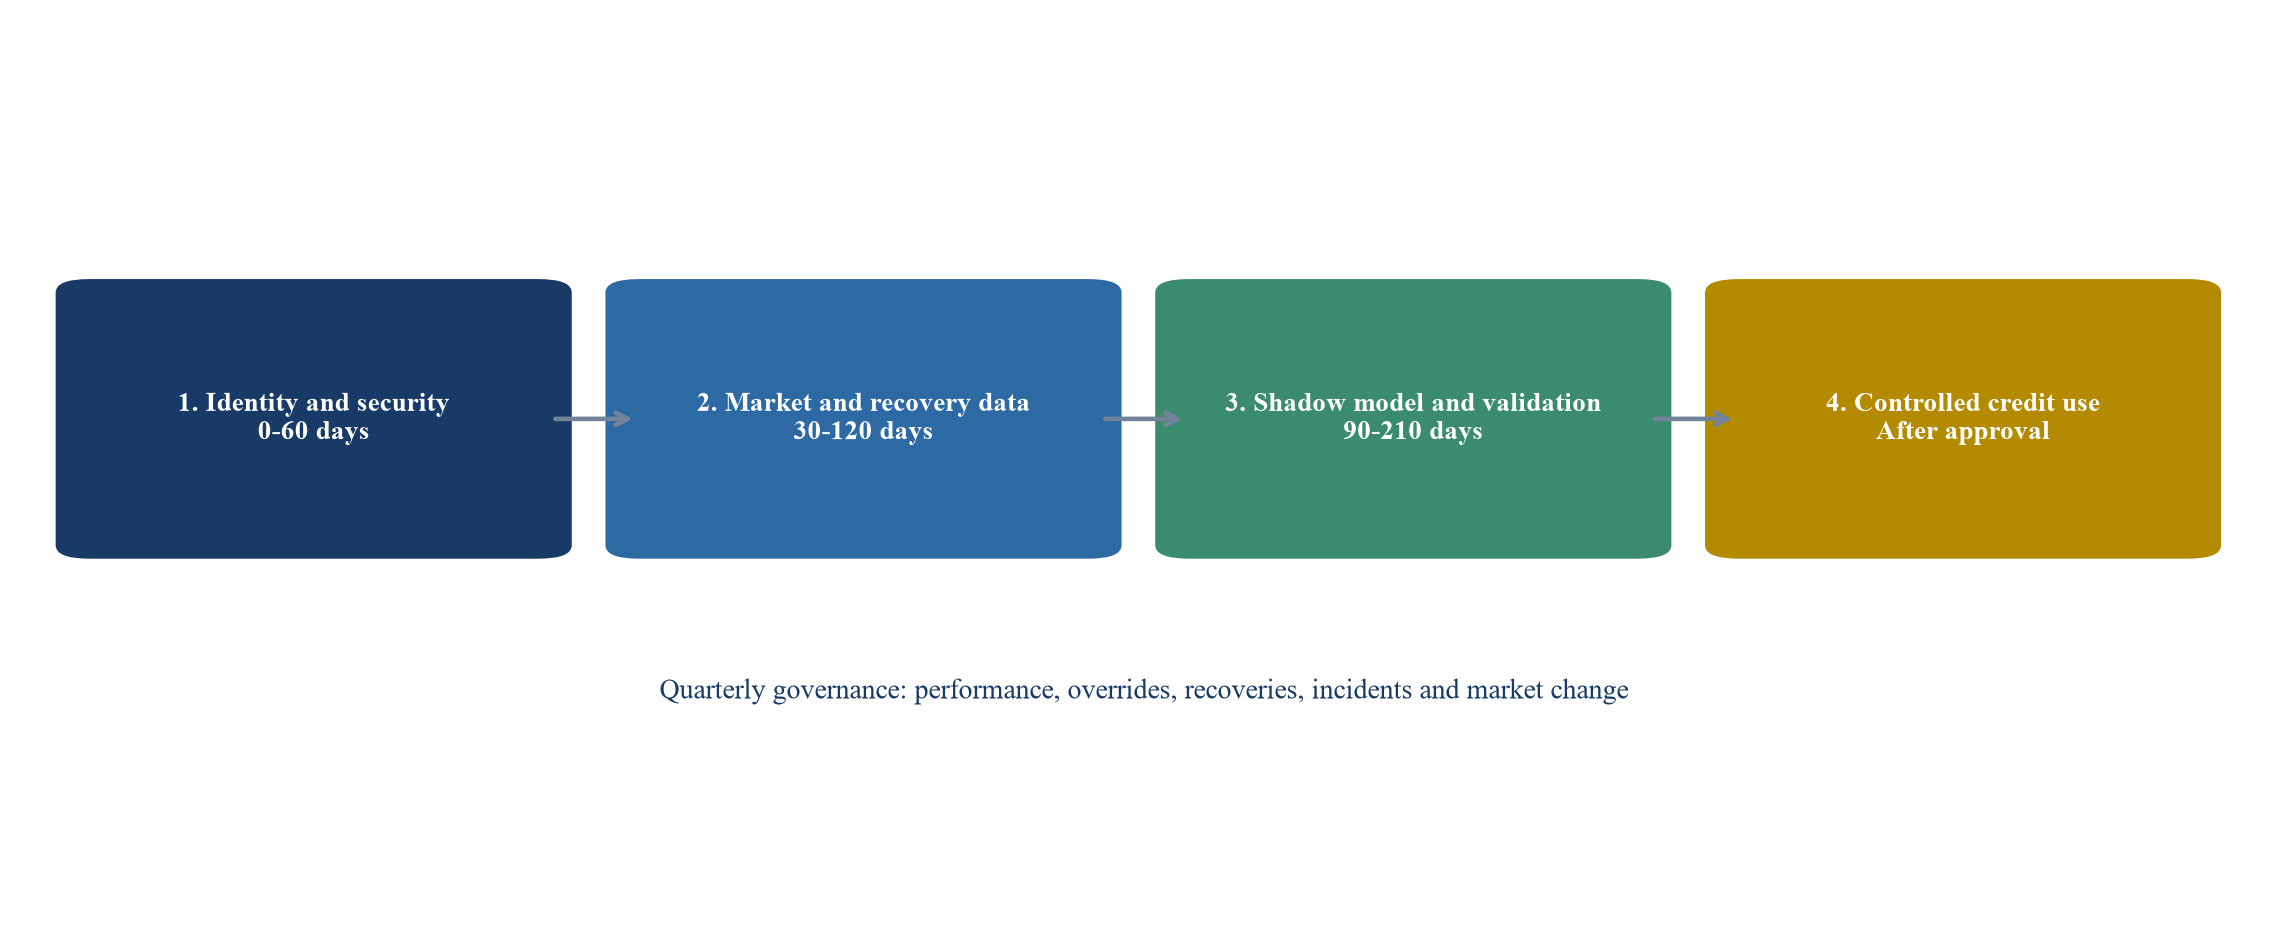
Decision use begins after identity, data and validation controls are established.
28. Conclude with a credit operating model
Predictive residual values can improve equipment finance when they are embedded in an operating model that controls identity, data, decisions and recoveries. The useful output is a defendable range of net realisable value and a clear account of uncertainty. That range should shape advance rate, amortisation, monitoring and workout readiness.
The framework places evidence quality at the centre. Usage data without title control is insufficient. A strong algorithm without comparable transactions is fragile. A high gross value without recovery-cost evidence can misstate protection. Credit judgement remains responsible for the final decision.
For lenders, the practical objective is a portfolio in which principal declines with stressed collateral value, exceptions are visible early and realised outcomes improve the next decision. For borrowers, the benefit is a financing structure that recognises verifiable asset quality and maintenance discipline. For investors and funding providers, the benefit is an auditable link between assets, contracts, data and recoveries.
The operating model should allocate decision rights clearly. Origination owns the commercial proposition and evidence collection. Credit owns facility approval and exceptions. Valuation or risk analytics owns the model, data standards and performance monitoring. Operations controls documents, security, insurance and payment records. Collections and special assets own early intervention and recovery execution. Internal audit should be able to trace a loan from source records through model output, approval, contractual terms and subsequent monitoring. The same person should not be able to alter source data, override the value and approve the resulting exposure without independent review.
Management information should connect prediction to outcome. Useful measures include the proportion of assets with verified identity, completeness of telemetry and maintenance records, average forecast error, lower-tail error, override frequency, principal-to-downside-value coverage, days to locate, days to repossess, repair cost, days to sale, gross recovery, net recovery and variance against the last approved estimate. Measures should be analysed by equipment class, dealer, geography, borrower segment, origination channel and vintage. A favourable portfolio average should not conceal a weak segment.
Back-testing should use the value estimate that existed at the relevant decision date. Comparing a sale price with a model rebuilt using information learned during recovery creates hindsight bias. The lender should archive model version, data snapshot, assumptions and approval. When a recovered asset is repaired before sale, the analysis should separate market movement, condition difference, repair investment, sale-channel effect and forecast error. This decomposition turns recovery activity into usable evidence for future underwriting.
The framework also requires a conservative boundary for novelty. Connected assets, computer vision and machine learning can improve measurement, but each new input introduces vendor, cyber, privacy and continuity dependencies. A lender should maintain a viable process when a telemetry provider fails, an application programming interface changes or a model cannot score an unusual asset. The fallback may use physical inspection, independent valuation, a lower advance rate and faster amortisation. The existence of a fallback is part of credit resilience.
Borrowers should receive a coherent information request and correction route. Equipment finance can become operationally burdensome when lenders request overlapping files from finance, projects, fleet and maintenance teams. A single asset schedule, agreed identifiers and evidence standards can reduce repeated work. When an incorrect hour reading, service flag or location record changes a decision, the borrower should be able to provide evidence and obtain review under a documented process.
The framework is intentionally modular. A lender can begin with verified identity, comparable sales and recovery-cost evidence before adding telemetry or advanced analytics. The test for each module is whether it improves a defined decision and performs under back-testing. Technology investment should be tied to reduced uncertainty, faster intervention, lower loss or more efficient capital deployment. Activity measures such as device count or dashboard usage do not demonstrate credit value on their own.
The final credit memorandum should therefore state the borrower case, asset perimeter, legal control, evidence quality, valuation range, downside net realisable value, cash-flow capacity, advance rate, amortisation path, concentration, covenants, monitoring, recovery plan, model limitations and approval conditions. That record allows later reviewers to understand why the lender accepted the exposure. It also provides the baseline against which performance, exceptions and recoveries can be judged.
Sources
- Reserve Bank of India. Master Direction, Non-Banking Financial Company, Scale Based Regulation Directions, 2023, updated 10 October 2024. Read the primary source
- Reserve Bank of India. Guidelines on Digital Lending, 2 September 2022. Read the primary source
- Reserve Bank of India. Report of the Working Group on Digital Lending including Lending through Online Platforms and Mobile Apps, 2021. Read the primary source
- Reserve Bank of India. Master Circular on Bank Finance to Non-Banking Financial Companies, 3 April 2023. Read the primary source
- Reserve Bank of India. Financial Stability Report, latest available edition at publication date. Read the primary source
- Ministry of Statistics and Programme Implementation. Index of Industrial Production, use-based classification and capital-goods series. Read the primary source
- Ministry of Heavy Industries. Capital Goods Sector and related policy materials. Read the primary source
- Central Registry of Securitisation Asset Reconstruction and Security Interest of India. Central Registry guidance and security-interest services. Read the primary source
- Ministry of Road Transport and Highways. VAHAN vehicle registration services and data descriptions. Read the primary source
- Ministry of Corporate Affairs. Companies Act 2013 and rules on registration of charges. Read the primary source
- Insolvency and Bankruptcy Board of India. Companies Registered Valuers and Valuation Rules 2017 and valuation guidance. Read the primary source
- Ministry of Law and Justice. Insolvency and Bankruptcy Code 2016. Read the primary source
- Ministry of Law and Justice. Securitisation and Reconstruction of Financial Assets and Enforcement of Security Interest Act 2002. Read the primary source
- Ministry of Electronics and Information Technology. Digital Personal Data Protection Act 2023. Read the primary source
- Indian Accounting Standards. Ind AS 109 Financial Instruments. Ministry of Corporate Affairs. Read the primary source
- Indian Accounting Standards. Ind AS 16 Property Plant and Equipment. Ministry of Corporate Affairs. Read the primary source
- International Accounting Standards Board. IFRS 9 Financial Instruments. Read the primary source
- International Valuation Standards Council. International Valuation Standards, current edition. Read the primary source
- Basel Committee on Banking Supervision. Principles for the Management of Credit Risk. Read the primary source
- Basel Committee on Banking Supervision. Prudential Treatment of Problem Assets, Definitions of Non-performing Exposures and Forbearance. Read the primary source
- National Institute of Standards and Technology. AI Risk Management Framework 1.0. Read the primary source
- International Organization for Standardization. ISO 55000 Asset management, overview and principles. Read the primary source
- International Organization for Standardization. ISO 31000 Risk management guidelines. Read the primary source
- World Bank. Secured Transactions, Collateral Registries and movable-asset finance resources. Read the primary source
