

1. Define the transaction decision
The analysis should begin with the decision that the evidence must support. A primary equity raise, acquisition, strategic investment, debt financing or secondary sale requires a stated amount, use of proceeds, runway, valuation range, milestone plan and decision date. Claims technology evidence should distinguish production outcomes from pilots, product demonstrations, roadmap features and unsupported market opportunity.
The central question is whether the company repeatedly converts a claims problem into controlled deployment, measurable outcomes, durable contracts and cash. The financing model should include product development, data, integration, security, validation, implementation, customer support and procurement time. Benefits should enter the base case when an attributable measurement method, accountable owner and scaling path exist. Downside cases should incorporate implementation delay, model rework, customer remediation and reserve uncertainty.
Decision evidence should be dated and frozen for review. The board pack should state the valuation date, available claim maturities, reporting basis, foreign-exchange assumptions and permitted reliance. A financing that closes before loss cohorts mature may require a contingent structure or a wider valuation range. The evidence plan should identify which uncertainties can be resolved before signing and which will survive into warranties, covenants, earn-outs or post-close integration. This distinction converts a generic diligence exercise into a transaction timetable.
2. Define the business and product perimeter
An InsurTech vendor, managing general agent, carrier, administrator and embedded-insurance platform have different economics and liabilities. The perimeter should identify who bears insurance risk, owns the policyholder relationship, makes coverage and settlement decisions, holds regulatory permissions, purchases reinsurance and carries claim reserves. It should also identify each software, data and outsourced-service provider.
Product scope should state the line of business, claim type, jurisdiction, customer segment and decision supported. Motor image assessment differs from health utilisation review, property catastrophe triage and liability reserving. Transfer between products should remain outside the base case until demonstrated. Revenue should be separated into subscription, usage, implementation, data, support and risk-bearing components. Contract obligations, service credits, audit rights and indemnities should be reconciled with the operating model.
The perimeter should also identify whether the company influences claim entitlement, evidence sufficiency, settlement amount or payment timing. These functions carry different control requirements and liability. If a platform supplies information while a carrier retains decision authority, marketing, contracts and system design should agree. Material differences can create mis-selling, insurance-distribution or professional-liability questions that require qualified advice. The transaction model should value the business actually operated at the valuation date and treat planned risk transfer as a separate case.
3. Separate vendor economics from insurer economics
A claims platform may create value for an insurer without capturing that value itself. The insurer may gain lower handling cost, shorter cycle time, reduced leakage, improved recovery, better customer retention or more reliable information. The vendor captures value through price, volume, retention, expansion and margin. Contract structure determines how the two sets of economics connect.
The valuation model should avoid adding the insurer's full benefit to the vendor's value. It should test whether the benefit supports willingness to pay, renewal and expansion. A vendor paid per claim may grow with volume while exposing itself to price compression. A performance fee can improve alignment and create attribution disputes. A risk-bearing InsurTech may capture underwriting margin and also absorb claim volatility, capital requirements and reserve risk. Each economic layer requires separate evidence.
Value capture should be tested customer by customer. Procurement teams may cap fees, require savings guarantees or retain intellectual-property rights in configurations. Some carriers may treat the platform as replaceable infrastructure and others as a strategic control. The forecast should use observed contract behaviour rather than a fixed share of estimated customer benefit. Strategic acquirers may value integration or data access, subject to legal rights, operational feasibility and a quantified synergy plan.
4. Map the end-to-end claim workflow
Claims automation should be assessed across the complete workflow: notification, identity and policy checks, coverage support, evidence collection, triage, fraud review, damage or severity assessment, reserve input, liability review, settlement authority, payment, recovery, closure, complaint, reopening and quality assurance. The map should state who acts, what information is used and what evidence is retained.
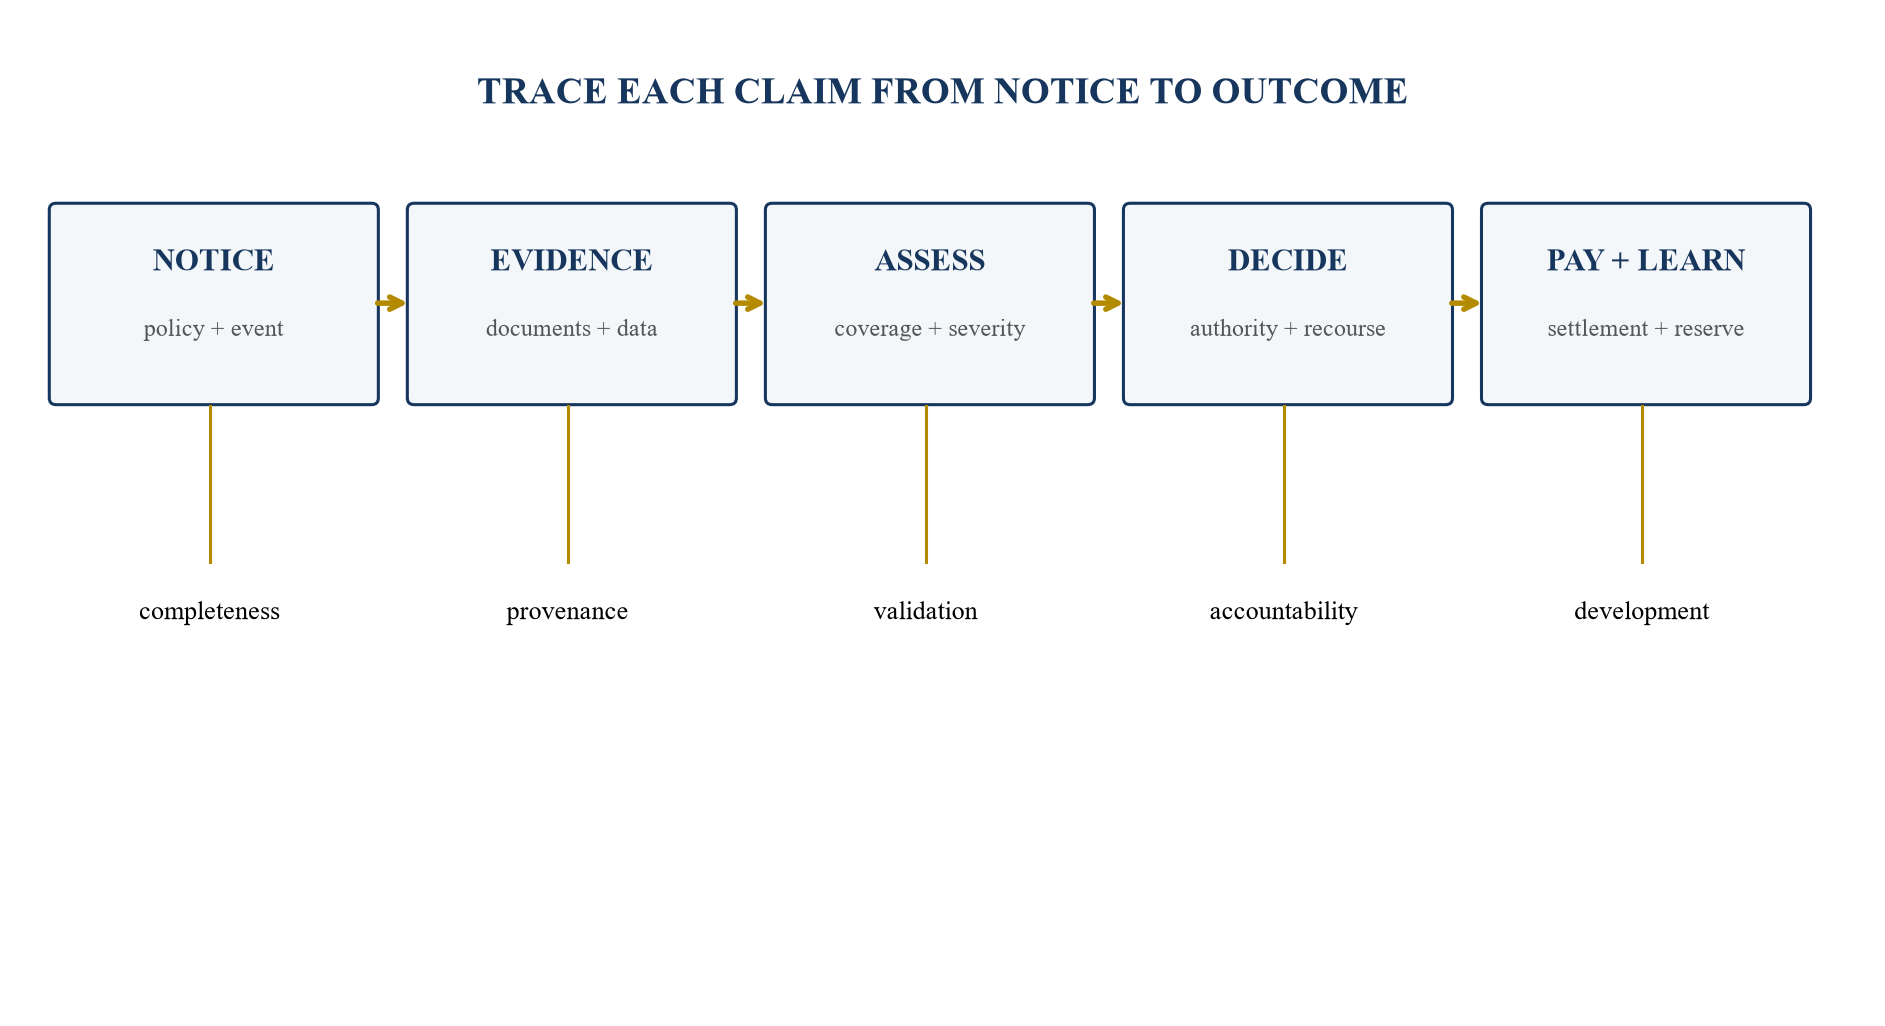
Populate the workflow with product-specific systems, decision rights, controls and evidence.
Counts and values should reconcile between stages. Withdrawn, rejected, referred, reopened and litigated claims must remain visible. Automation that moves work into an exception queue is incomplete. The workflow becomes the denominator for validation, staffing, pricing, reserve analysis and investor diligence.
The workflow should capture elapsed and active time separately. A claim may appear slow because it waits for customer evidence, repair capacity or a third party; internal work may still be efficient. Control totals should reconcile notification, reserve, payment, recovery and closure. Hand-offs should record ownership and ageing. The design should support reconstruction at the decision date, because later data can make an earlier automated recommendation appear more accurate than it was.
5. Build the claims evidence ledger
Table 1. Claims evidence ledger
| Element | Primary evidence | Transaction question |
|---|---|---|
| population | policy, exposure and claim records | is the denominator complete? |
| decision | versioned output and authorised action | who exercised accountability? |
| outcome | payment, recovery, complaint and review | what happened after the decision? |
| reserve | case estimate, IBNR and development | was uncertainty recognised? |
| consumer | delay, explanation, recourse and fairness | were outcomes supportable? |
| economics | labour, vendor, loss and cash | what value changed and who captured it? |
Fields should be adapted to the line, jurisdiction, insurer and applicable professional standards.
Each row should carry claim identifier, policy, product, jurisdiction, event date, report date, model version, user action, payment, reserve, closure, reopening and source. Corrections should preserve original values and effective dates. Personally identifiable data should be minimised in transaction materials while permitting controlled testing.
Two-way traceability matters. Reviewers should move from a reported benefit to the underlying claim cohort and from a selected claim back to source data, model output, human action and financial record. Reconciliation exceptions should remain visible. A dashboard without reproducible lineage is management information, not transaction-grade evidence.
The ledger should include evidence quality and access classification. Audited financial data, actuarial reports, controlled system extracts, management spreadsheets and anecdotal observations have different reliability. The transaction team should record extraction logic and checksum or version where practical. Sampling should be independently selected and repeatable. Where privacy prevents broad transfer, a clean-room review can preserve testing while limiting disclosure. Unresolved mismatches should feed directly into valuation sensitivity and disclosure.
6. Establish the pre-automation baseline
The baseline should measure the prior process using stable definitions. It should cover notification volume, handling time, touch count, queue ageing, payment, expense, leakage, fraud referral, recovery, complaint, reopen rate, reserve change and quality findings. It should identify manual work, legacy tools, external adjusters and existing automation.
Periods should cover seasonality, catastrophe events and development. Changes in product, distribution, geography, policy terms, deductible, claims philosophy, staffing and inflation should be recorded. A weak historical process should not be exaggerated. Where reliable history is unavailable, a controlled parallel period or matched cohort can support attribution. The valuation should disclose remaining selection bias and avoid treating management recollection as measured benefit.
Baseline maturity matters. Short-tail motor damage may develop rapidly, while liability and bodily injury claims can remain uncertain for years. The comparison horizon should match the claim process and value assertion. Management should show how incomplete cohorts are treated and whether survival, censoring or development adjustments are applied. A baseline rebuilt after seeing new-product results is vulnerable to hindsight bias; definitions and exclusions should be documented before the principal comparison.
7. Define automation precisely
Automation can mean document extraction, routing, recommendation, constrained decision, communication or payment. Straight-through processing should require a defined claim cohort that completes agreed stages without unplanned human intervention. A claim touched after an exception, audit or complaint should be classified consistently. Assisted handling should remain separate from autonomous handling.
The metric should show numerator, eligible population, exclusions, model version and outcome horizon. A rising automation rate can reflect narrower eligibility or reduced controls. Volume alone says little about quality. The evidence should connect automation to cycle time, handling cost, claim outcome, consumer result and reserve information. Management should set stop conditions for drift, outage, unusual events and material adverse outcomes.
Automation depth should be distinguished from automation breadth. A platform can automate a small administrative step across most claims or complete a full workflow for a narrow group. Both can be useful and have different economics. The board should report stages completed, manual minutes avoided, exception causes and stable outcome. Eligibility should be governed and monitored so that commercial pressure does not move unsuitable claims into autonomous paths before validation supports the change.
8. Define human decision rights
Claims decisions affect contractual rights and customer outcomes. The operating model should assign authority for coverage, liability, severity, settlement, rejection, fraud referral, reserve and complaint. Human review should provide sufficient information, competence, time and power to challenge the system. A nominal approval click is weak oversight.
Override data should record reason, direction, user, evidence and outcome. Concentrated overrides can reveal weak model performance, poor interfaces or misaligned authority. Quality assurance should sample automated and human decisions. Escalation should be available for vulnerable customers, unusual losses, ambiguous coverage and high severity. Financing assumptions should include ongoing supervision, training and assurance work.
Decision rights should survive staff absence, catastrophe surge and technology outage. Authority matrices should align with policy and claims limits. The platform should prevent unauthorised users from exceeding settlement powers and should preserve segregation where required. Reviewers should test whether users understand limitations and whether challenge changes an outcome when justified. Human involvement adds value only when it is informed, timely and documented; its cost belongs in the run-rate model.
9. Construct the claims funnel
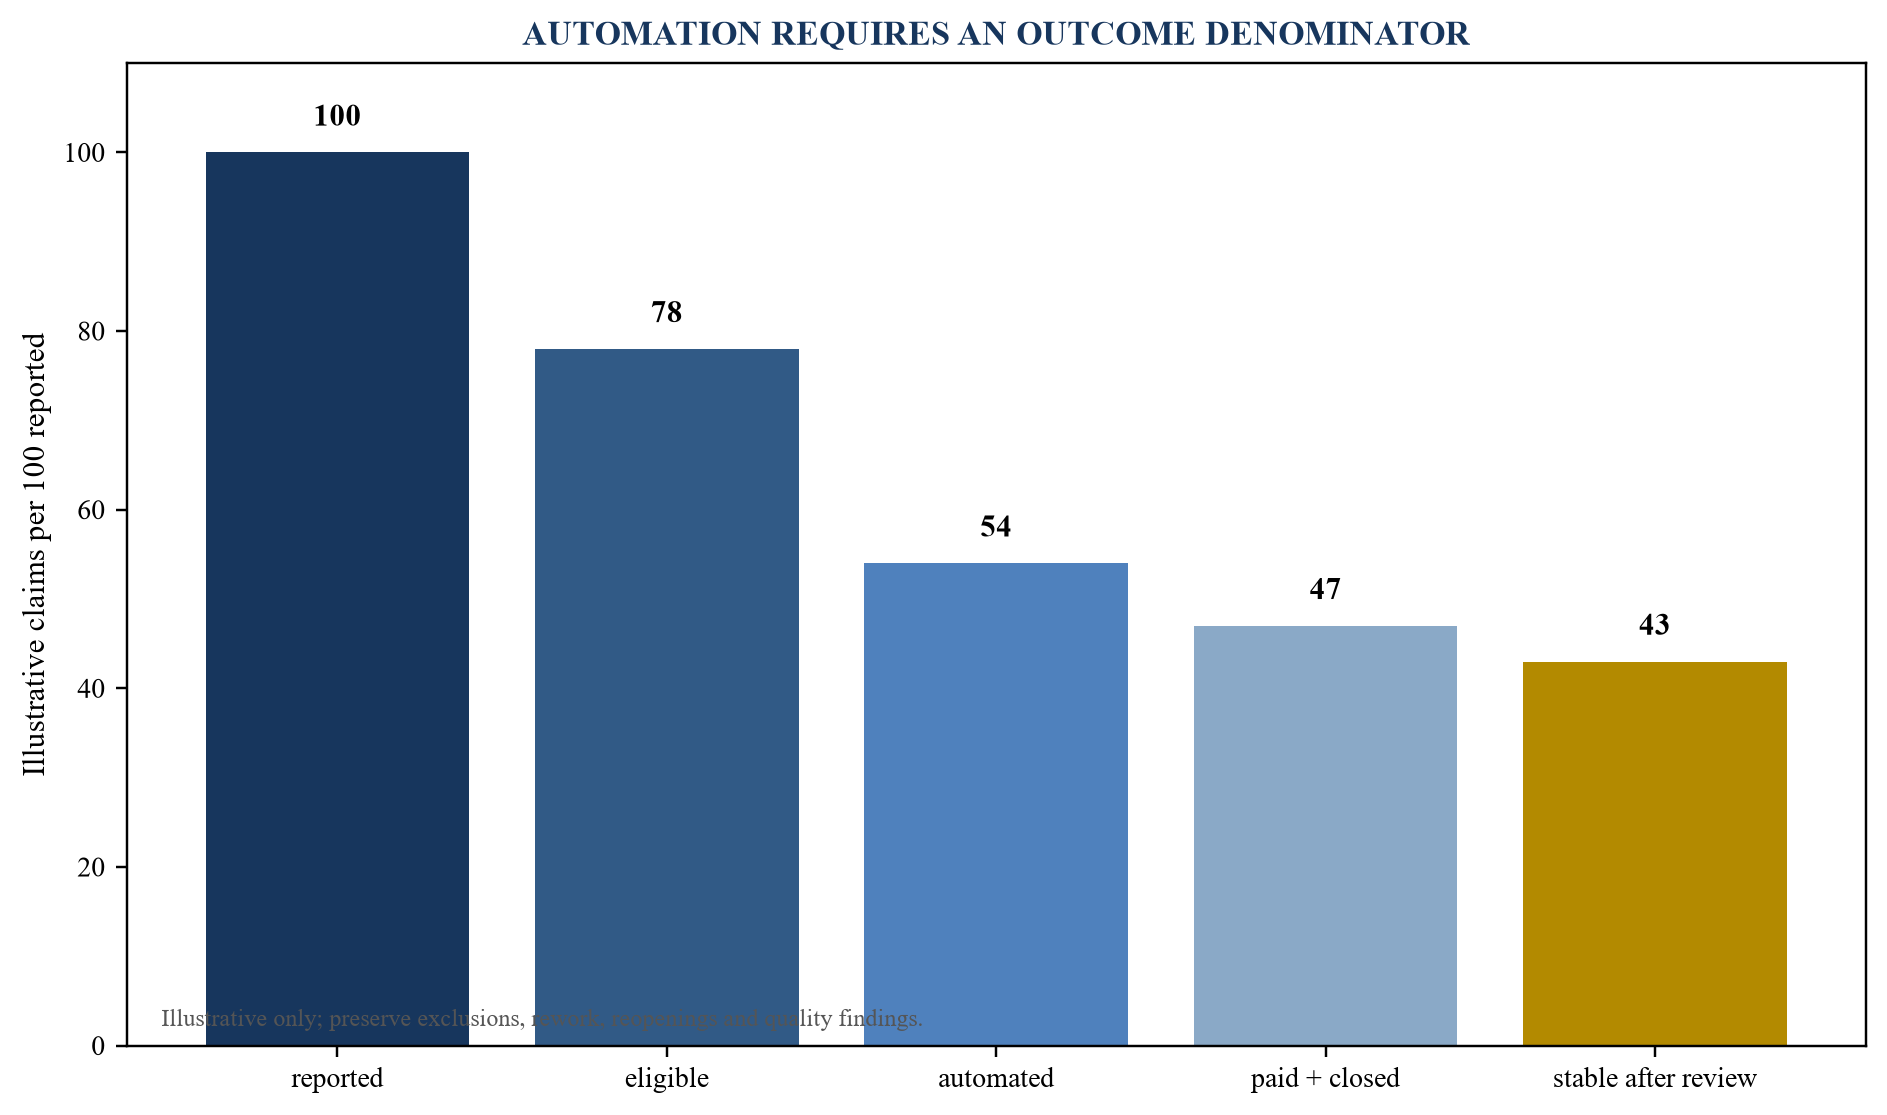
Illustrative counts only; replace with reconciled claim-level evidence.
The funnel should begin with all reported claims and explain each reduction. Eligibility exclusions may be appropriate and can create selection bias. Automated completion should be reconciled to payment and closure. Later complaints, reopenings, supplemental payments and audit findings should feed back into the cohort result.
Board reporting should show conversion by product, geography, severity and model version. A portfolio average can hide a weak segment. Investors should inspect the movement from reported claim to stable outcome, not only the percentage initially routed without human touch.
The funnel should also reconcile monetary value. A high count of low-value automated claims may represent a small share of incurred loss, while a few complex claims drive reserve risk and handling effort. Presenting both claim count and estimated ultimate value prevents scale from being overstated. Cohorts should remain open to subsequent development so that supplemental payment, recovery and reopening can be attributed to the original automation path.
10. Measure cycle time and service outcome
Cycle time should be measured from defined events: loss to notification, notification to first action, evidence completion, decision, payment and closure. Median, percentile and tail outcomes are more informative than a single average. Pauses caused by customer, supplier or missing evidence should remain visible and consistently classified.
Faster processing creates value through customer experience, lower work in progress and earlier information. Speed can damage outcomes if evidence is incomplete or pressure causes underpayment. The scorecard should pair time with reopenings, supplements, complaints, appeals and quality findings. Differences should be adjusted for claim mix. Cash benefits should distinguish earlier payment timing from lower ultimate claim cost.
Service outcomes should be tested at the tail. The longest-running claims often contain vulnerability, dispute, litigation or high severity. An improvement in median duration can coexist with worsening tail outcomes. The evidence should show percentiles, unresolved ageing and reasons. Regulatory or contractual settlement deadlines should be treated as constraints. Faster payment can increase near-term cash outflow even when it improves service, so treasury and valuation models should reflect timing accurately.
11. Measure handling work and capacity
Handling economics should include adjuster time, supervisor review, external assessment, document work, customer contact, quality assurance, technology support and remediation. Automation may reduce one activity and create another. Released hours create value when they reduce cash cost, absorb growth or improve outcomes. Capacity that remains unused should not be presented as realised saving.
Time studies should use system events and representative observation where possible. Staffing changes should reconcile to payroll and vendor invoices. The model should distinguish fixed, step-fixed and variable costs. Implementation and model-governance teams may expand before operational savings appear. A credible forecast shows the adoption curve, redeployment plan and timing of cash conversion.
Capacity value should be assigned to a defined use. Released adjuster hours may absorb portfolio growth, reduce external fees, improve quality or remain unused. Each outcome affects cash differently. Management should avoid applying salary rates to every minute saved when headcount and vendor spend remain unchanged. The plan should identify thresholds at which a team, shift or outsourced contract can be reduced, together with operational and employee consequences.
12. Define claims leakage
Leakage is the avoidable difference between actual claim outcome and a controlled benchmark, subject to policy, law and fair treatment. It can arise through missed coverage terms, duplicate payment, weak negotiation, inaccurate assessment, missed recovery, process error or fraud. The benchmark should be independently supportable and should not reward underpayment.
Sampling should stratify claim type, severity, handler, channel and model version. Reviewers should separate random variation from systematic weakness. Recoverable leakage identified after payment may create one-off benefit and operational learning. Sustainable value requires control redesign and verified recurrence reduction. Customer remediation, complaint and litigation exposure should be included in downside analysis.
Leakage studies should use qualified reviewers and a written standard. Retrospective opinions can differ, particularly in negotiated or litigated matters. Dual review and documented disagreement improve reliability. The benchmark should consider information available at the original decision, not a later perfect-information outcome. Claimed savings should be net of additional evidence, repair, legal, investigation and recovery costs. The valuation should distinguish identified opportunity from realised cash and recurring prevention.
13. Measure fraud outcomes carefully
Fraud systems can prioritise claims for investigation, identify relationships or surface anomalies. A referral is activity, not a confirmed saving. The evidence should reconcile flagged claims to investigation, confirmed outcome, prevented or recovered payment, customer effect and cost. Legal and contractual standards for adverse action remain applicable.
False positives can delay legitimate claims and consume specialist resources. False negatives are difficult to observe and require retrospective cases, seeded tests, network review and complementary controls. The operating threshold should consider severity and workload. Financing materials should avoid adding gross flagged value to benefits. Net value should deduct investigation, delay, remediation and amounts that would have been identified by existing controls.
Confirmed fraud is often a legally and operationally demanding label. The data model should distinguish suspicion, referral, investigation, withdrawal, repudiation, recovery and adjudicated outcome. Prevention estimates should state the counterfactual and avoid counting an entire claimed amount when only a portion was unsupported. Claimants should have appropriate explanation and recourse. Model performance should be monitored for changing fraud patterns and for disproportionate effects across customer groups.
14. Validate severity and damage estimates
Image, document and language models may estimate damage, repair scope, medical utilisation or likely settlement. Validation should compare model output with an independently defined outcome over representative segments. Ground truth may itself contain negotiation, repair-network and timing effects. The study should state observation date and data availability.
Performance should be analysed across severity bands, product, geography, asset type and unusual cases. Absolute error, directional bias and tail error all matter. A model that performs well near the median can be unsafe for large losses. The operating model should route low-confidence and out-of-distribution claims to qualified review. Changes in repair cost, medical pricing and inflation require ongoing monitoring.
Estimate validation should reflect business use. A small error can be material when it determines an automatic settlement, and a wider estimate may be acceptable when it only prioritises review. The company should show calibration, confidence and stability as well as average error. Repair-network behaviour and settlement negotiation can contaminate labels, so reviewers should understand how outcome data were created. Production monitoring should compare estimated and eventual cost at consistent maturities.
15. Test false positives and false negatives
Each use case requires a decision-specific error definition. A false fraud alert differs from an incorrect repair estimate or unsupported coverage recommendation. Testing should identify the consumer and financial consequence of each error. Precision and recall can support assessment when the outcome is observable; severity-weighted measures may be required.
Threshold curves should show how workload and error change. The selected operating point should have accountable approval. The test set should be separated from model development and reflect production conditions. Later-discovered outcomes should update monitoring without leaking into historical validation. Material errors should trigger investigation, limits, remediation and, where relevant, reserve or valuation sensitivity.
Error costs are asymmetric. Missing a large fraudulent or under-reserved claim can have a different consequence from referring a legitimate low-value claim. The scorecard should combine unweighted quality measures with severity and consumer impact. Stress testing should include distribution shift, missing data, rare event and coordinated manipulation. Reviewers should confirm that model monitoring observes the outcomes needed to detect deterioration rather than only technical input statistics.
16. Test fairness and consumer outcomes
Fairness testing should begin with the applicable legal and regulatory standard, product purpose and affected decision. It should examine whether similarly situated customers receive supportable outcomes and whether protected or vulnerable groups experience unjustified differences. Aggregate accuracy can coexist with material subgroup harm.
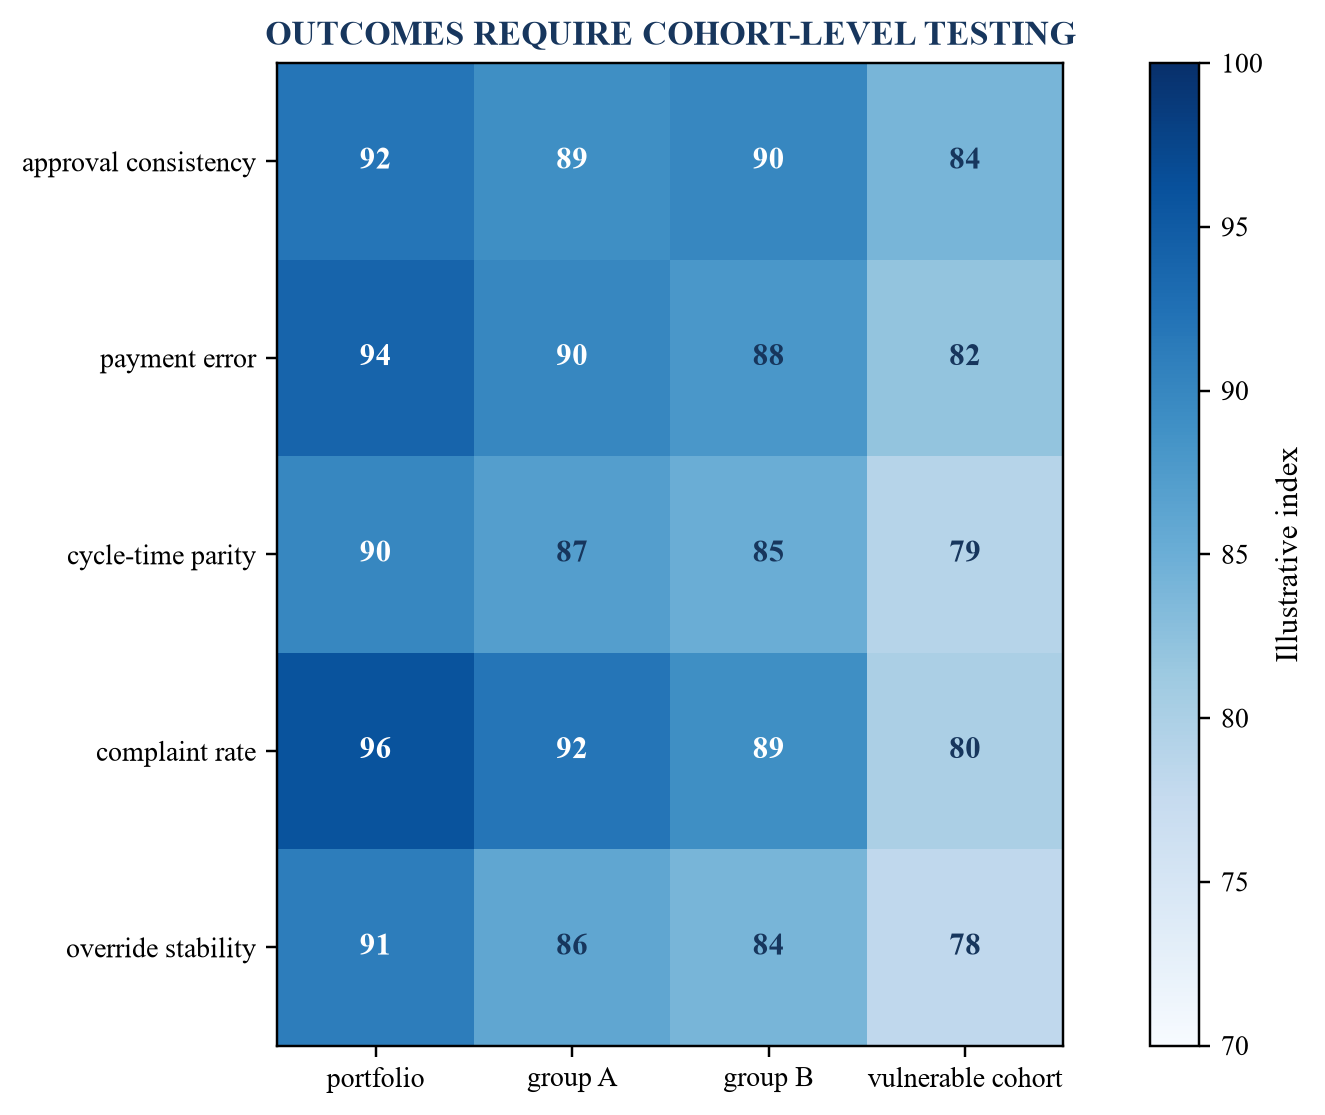
Thresholds and protected characteristics require jurisdiction-specific legal and regulatory review.
Testing should cover data representation, proxy effects, threshold outcomes, explanation, override, complaint and recourse. Differences require investigation, context and accountable resolution. The company should preserve evidence of design choices and remediation. Consumer protection is part of deployment quality and buyer acceptance, with direct implications for contract durability and liability.
Fairness evidence should be refreshed when data, model, threshold, product or population changes. Protected-characteristic data may be restricted or unavailable, requiring a lawful and carefully governed testing approach. Proxy methods have limitations that should be disclosed. The board should approve escalation for material disparity and record the rationale for any difference considered supportable. Remediation can require data change, threshold change, workflow control, customer correction or suspension.
17. Govern explanations and recourse
Customers and handlers need explanations suited to the decision and jurisdiction. A technical feature score may not explain coverage, payment or referral. The communication should identify relevant policy or evidence, the role of automation, available next steps and a route to human review. Material uncertainty should remain visible.
The company should test whether explanations are accurate, consistent, understandable and generated from the actual decision path. Template language can become misleading when it omits a decisive factor. Recourse metrics should include review requests, reversals, supplements, complaints, handling time and subgroup outcomes. Investors should inspect whether explanation and appeal work scales with automated volume.
Explanation quality should be tested with policyholders and handlers using representative decisions. A useful explanation supports action without exposing security controls or proprietary details unnecessarily. Translation and accessibility may be required. The company should preserve the link between the explanation sent and the system state at that time. High reversal rates can indicate weak decisions, poor explanation or both, and should trigger root-cause analysis.
18. Govern data provenance and leakage
Claims models can combine policy, exposure, customer, image, telematics, repair, medical, weather, geospatial and external data. Provenance should record origin, legal basis, observation time, transformation, ownership, retention and permitted use. Missing or delayed fields can change output without a visible system failure.
Training leakage occurs when information available only after the decision enters model development or validation. Examples include final settlement, later investigation or reserve updates. The company should enforce temporal cut-offs and reproduce the information set available at each historical decision. Data quality controls should cover reconciliation, duplication, identity resolution, schema drift and label consistency. Third-party data rights should survive the intended commercial scale and transaction.
Data diligence should trace several claims from source system through transformation, feature creation, model output and retained evidence. Feature definitions should be consistent across customers or clearly configured. Missingness can carry meaning and can also reflect a broken feed. The company should monitor both. Acquisition diligence should determine whether customer contracts permit continued processing, model improvement and data transfer after a change of control.
19. Govern models through their lifecycle
The inventory should state each model's purpose, owner, developer, data, version, validation, limitation, monitoring and retirement. Embedded third-party models and generative systems should be included. Intended and prohibited uses should be explicit. Risk classification should reflect the decision, customer effect, financial exposure and degree of automation.
Independent validation should assess conceptual soundness, data, implementation, performance, stability and outcomes. Monitoring should identify drift, unusual events, data failure and control override. Material changes should trigger impact assessment and proportionate revalidation. EIOPA, NAIC and CBUAE materials emphasise governance, fairness, explainability, accountability and risk-based control for insurance AI. The transaction file should show how these principles operate in production.
Governance should connect board risk appetite to operational limits. The inventory should identify criticality, customer impact and validation status. Exceptions require expiry dates and accountable approval. Generative components need controls for source grounding, unsupported output, prompt or retrieval change, sensitive data and reproducibility. Acquirers should test whether governance depends on a few individuals or is embedded in systems, committees and retained evidence.
20. Control third-party models and data
InsurTech products often depend on cloud platforms, foundation models, repair databases, identity tools, geospatial data and specialist model vendors. The company remains responsible for its product and contractual obligations. Due diligence should identify subprocessors, licences, data locations, model-change rights, audit evidence, service levels, exit support and concentration.
The operating model should test provider changes before production use. Vendor assurances should be supported by technical and contractual evidence. A critical component with weak access, uncertain licence or no replacement path can reduce strategic value. Forecasts should include usage cost, price escalation, migration and redundancy. Change-of-control clauses should be checked before an acquisition or financing assumes continuity.
Concentration should be assessed at service, model, cloud region and data-source levels. Two named vendors can share the same upstream dependency. Exit plans should identify data export, model replacement, customer approval, revalidation and elapsed time. A theoretical alternative is insufficient when migration would interrupt claims. The valuation case should include the cost and delay of replacing critical dependencies that lack durable contractual protection.
21. Secure claims data and operations
Claims records can contain identity, health, location, financial and loss information. Security should cover least privilege, segregation, encryption, logging, secure development, vulnerability management, incident response and recovery. Data inventories should state purpose, location, access, transfer, retention and deletion. Production and development environments should be controlled.
Operational resilience should identify important services, dependencies, tolerances, fallback and testing. A claims outage can delay payment and create conduct harm. Manual fallback needs trained capacity and reconciled recovery. Security questionnaires, penetration tests, incident history, business-continuity exercises and remediation should enter the data room. Unresolved high-severity findings should affect deployment timing and valuation sensitivity.
Resilience testing should include data corruption, model unavailability, cloud failure, supplier outage and sudden claim surge. Recovery should restore the correct model and decision history, not merely application access. Incident exercises should involve carrier customers and define communication responsibility. Insurance cover can transfer part of financial exposure and does not replace control. Transaction diligence should reconcile security representations with open findings and historical incidents.
22. Build the loss-ratio bridge
The loss ratio generally relates incurred claims and relevant claim expense to earned premium, subject to the reporting basis used. A movement should be decomposed before it is attributed to technology. Exposure, pricing, product, geography, channel, policy terms, deductible, reinsurance, frequency, severity, inflation, catastrophe, claim practice, reserve assumption and prior-year development can each contribute.
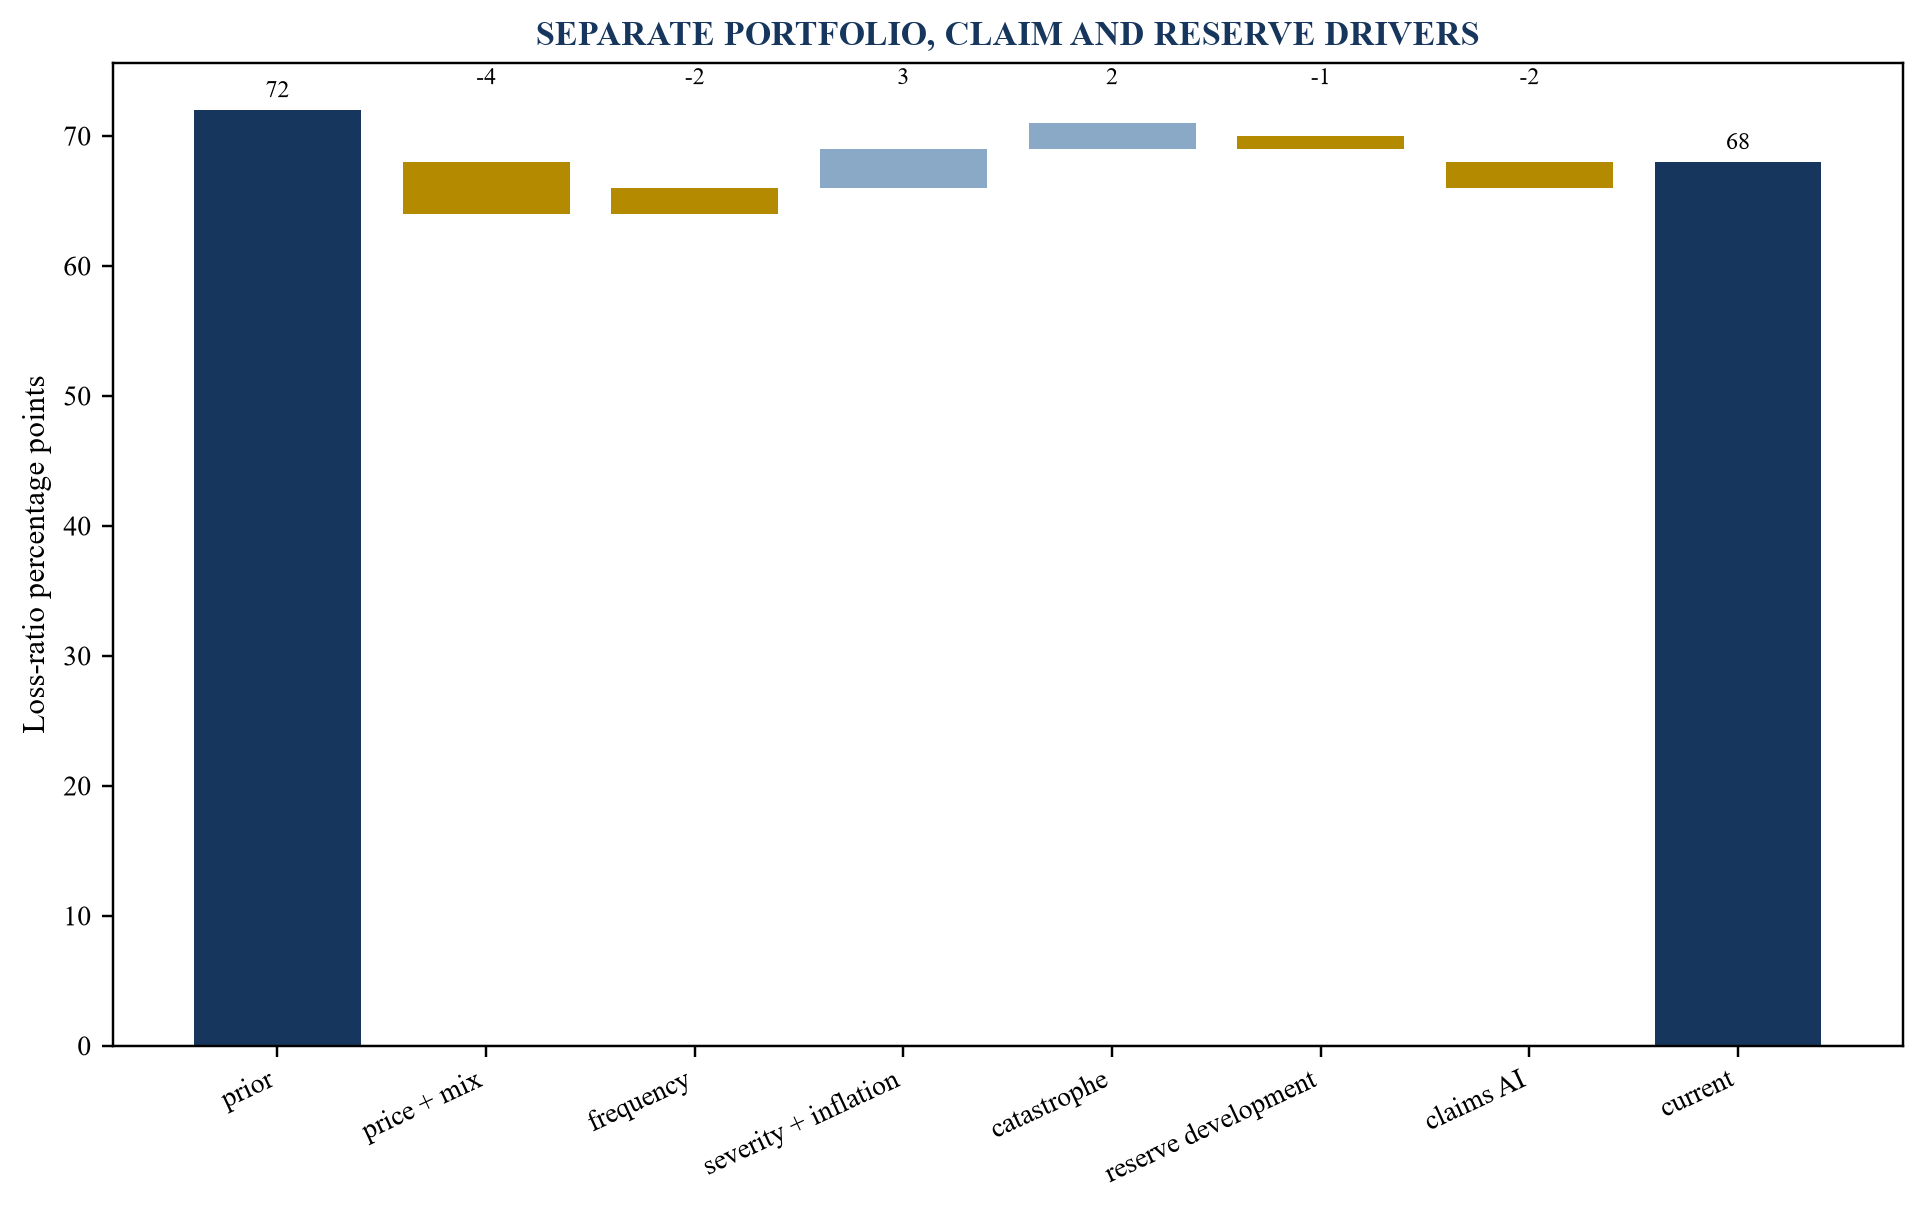
Illustrative percentage-point movements only; use audited definitions and actuarial evidence.
The technology contribution should be supported by claim-level cohorts and controlled analysis. Faster closure can change timing without changing ultimate loss. A lower current estimate can reverse through development. The bridge should reconcile to financial and actuarial reporting and show confidence ranges.
Attribution should follow an agreed hierarchy. Start with audited premium and incurred-claim measures, then isolate exposure and mix, external severity drivers, underwriting or pricing action, reinsurance and reserve development. Residual movement should not automatically be assigned to claims technology. Where a matched cohort supports an operational effect, the bridge should show sample size, maturity, uncertainty and interaction with existing controls. Repeating the analysis across periods tests whether the result is durable rather than a favourable cohort.
23. Separate frequency, severity and mix
Claim frequency measures events relative to an exposure base; severity measures cost per claim under a defined population. Mix changes can move both. The analysis should use earned exposure, consistent claim definitions and mature outcomes. Product growth can produce immature cohorts that appear favourable before claims develop.
Automation may influence severity through earlier intervention, repair routing, fraud control or recovery. It rarely changes insured-event frequency unless linked to prevention or behaviour. Underwriting and pricing changes should remain separate. Cohort analysis should compare matched policies and account for seasonality, geography and channel. Management should disclose whether favourable evidence comes from a narrow low-severity segment.
Exposure definitions should be stable and relevant to the product, such as earned policy years, vehicles, property value or payroll. Frequency should include claim-reporting changes and late notifications. Severity should be measured at comparable maturity and should distinguish paid, case incurred and ultimate estimates. The analysis should identify whether automation changes reporting behaviour or closure practice, because either can move observed frequency and severity without changing underlying insured risk.
24. Treat inflation and catastrophe explicitly
Repair, labour, medical, legal and construction inflation affect claim severity. Social and judicial developments can influence liability outcomes. Catastrophe experience can dominate a period and change workload. A technology thesis should not absorb favourable external movements or be blamed automatically for adverse ones.
The forecast should model exposure-specific inflation and event scenarios. Claims automation can improve surge triage and information speed, while catastrophe conditions can create out-of-distribution data and supplier constraints. The operating plan should specify fallback and validation during extreme events. Investors should test whether capacity and service levels survive a realistic surge without compromising control.
Catastrophe analysis should separate event claims from ordinary attritional experience and identify aggregation by geography, peril and supplier. Models trained on routine losses may encounter unfamiliar images, incomplete records and network disruption. Temporary manual routing, revised authority and quality sampling should be pre-approved. The financial model should include additional adjuster, data, compute, communication and remediation cost during a surge, together with the liquidity effect of accelerated payments.
25. Define reserve risk
Claim reserves reflect uncertain future payments and expenses for incurred events. The analysis should distinguish case estimates, incurred-but-not-reported claims, claim-handling costs and any relevant risk adjustment or margin. Definitions and accounting treatment depend on the entity and reporting regime. IFRS 17 includes reported claims, incurred but not reported claims and claim-handling costs within relevant fulfilment cash flows.
Automation can improve timeliness and consistency of information. It can also create correlated bias, premature confidence or operational changes that alter development patterns. A model estimate is an input to actuarial and management judgement. The company should state who owns the booked reserve, how model information is used and how differences are reviewed.
Reserve risk should be assessed at the portfolio and decision levels. A small systematic bias across many claims can be material even when individual errors appear modest. Tail claims can create a different concentration. The governance file should identify thresholds for actuarial review, model limitation, management adjustment and board escalation. Transaction warranties and covenants should be informed by the same evidence so that reserve uncertainty is neither hidden in the forecast nor counted twice in valuation adjustments.
26. Analyse case estimates and IBNR
Case estimates should reflect information available on reported claims and approved reserving practice. IBNR addresses incurred events not yet reported and development beyond current case estimates. Claims technology may accelerate reporting, improve classification or change settlement timing, which can alter historical patterns used in actuarial methods.
The valuation team should reconcile model outputs with booked values and actuarial analysis. Differences should be segmented by accident period, development period, product, severity and model version. Systematic underestimation can overstate profit and capital. Systematic conservatism can obscure operating improvement. Neither direction should be valued without understanding cash, risk and governance.
27. Back-test reserve development
Back-testing should compare prior estimates with subsequent paid and incurred outcomes at consistent maturities. It should distinguish changes caused by new information, process, inflation, coverage, litigation and model revision. Aggregate favourable development can conceal adverse segments. The analysis should include tail claims and reopened cases.
Model validation should avoid using later information that was unavailable at the estimate date. Performance should be shown over several periods and conditions. A recent model may have limited mature evidence, requiring wider sensitivity and financing milestones. Independent actuarial review can test whether management's claimed reserve benefit is compatible with observed development.
28. Apply IFRS 17 and solvency evidence correctly
IFRS 17 measures insurance obligations using current estimates of future cash flows, discounting where applicable and a risk adjustment for non-financial risk. The liability for incurred claims reflects obligations for insured events that have occurred. Changes in estimates and risk adjustment can affect the insurance service result. Transaction analysis should use the entity's audited policies and reconciliations.
Regulatory solvency frameworks can use different definitions, confidence levels and capital treatment. A vendor selling to insurers should not present accounting or solvency outcomes as product features without qualified evidence. The data room should connect operational metrics to the insurer's actuarial, finance and risk controls. Investors should understand which effects change reported profit, capital, cash or only information timing.
29. Build reserve sensitivity
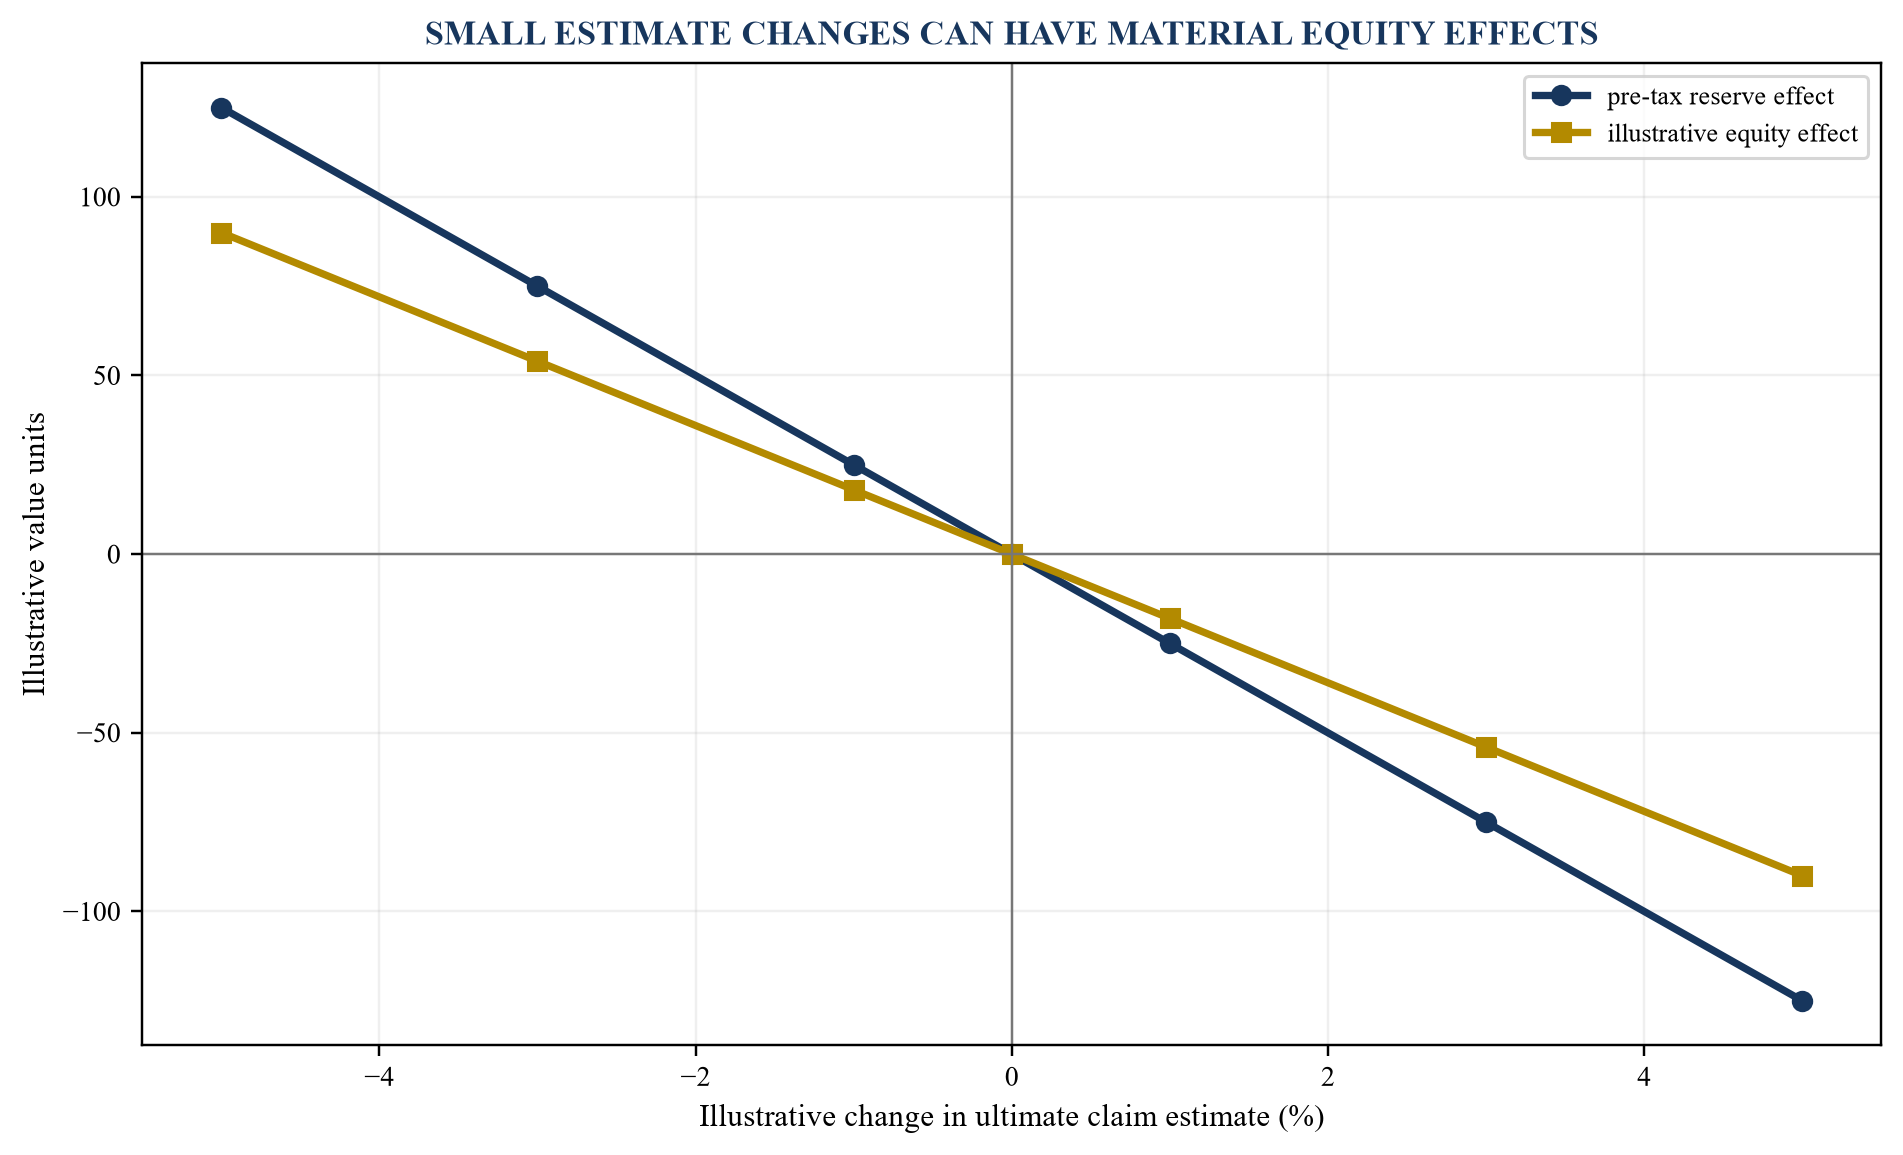
Illustrative values only; replace with actuarially supported claim cohorts, tax and capital assumptions.
Sensitivity should connect a change in claim assumptions to reserve, earnings, capital, covenant and equity effects. The relationship depends on earned premium, reinsurance, tax, discounting and regulatory capital. Scenarios should include adverse development, inflation, catastrophe and model bias. The purpose is decision resilience, not a single precise answer.
For a software vendor, reserve sensitivity matters through customer adoption, liability allocation and proof of value. For a risk-bearing InsurTech, it can dominate equity value. The model should identify which party carries each exposure.
30. Build automation unit economics
Table 2. Claims automation unit economics
| Driver | Evidence | Value treatment |
|---|---|---|
| eligible volume | reconciled claim cohort | establishes scalable denominator |
| work released | event and time study | convert only through cash or useful capacity |
| loss outcome | matched cohort and development | attribute after mix and reserve controls |
| consumer outcome | cycle, complaint, reversal | include service and remediation effects |
| technology cost | licence, compute, data and support | include full run-rate and scaling cost |
| control cost | validation, audit and oversight | retain recurring governance work |
Replace illustrative categories with verified claim-level, payroll, vendor and contract evidence.
Unit economics should be calculated by claim type and customer cohort. Revenue per claim or policy should reconcile to invoices. Delivery cost should include implementation, data, compute, support, quality and model operations. Gross margin should be measured after recurring delivery work. Customer acquisition cost should include enterprise sales and pilots, with payback based on collected gross profit.
Benefits to the insurer should be separately evidenced. The vendor's pricing and renewal depend on capture, switching cost and competition. The model should test volume decline, price pressure, compute cost and service intensity. A high automation percentage cannot compensate for weak contribution margin or long cash collection.
31. Measure customer retention and expansion
Durable demand is evidenced by production use, renewal, expansion, referenceability and collected cash. The cohort analysis should separate pilot, implementation, production and dormant customers. Contracted recurring revenue should be reconciled with invoices, usage and cancellation rights. One-off implementation and pass-through data should remain separate.
Net revenue retention should explain price, volume, product, geography, contraction and churn. Expansion can depend on successful outcomes in the first line of business. Investors should inspect whether the product survives security, model-risk, legal, procurement and operational review at each expansion. Customer concentration and change-of-control rights should enter valuation sensitivity.
32. Test the commercial contract
Contracts should identify scope, service levels, decision responsibility, data roles, model changes, audit, security, incident, subcontractor, intellectual property, liability, indemnity, termination and exit assistance. Outcome claims in sales material should be consistent with contractual commitments. A vendor may disclaim decision responsibility while marketing loss-ratio improvement; this mismatch requires resolution.
Pricing should match the value driver and risk allocation. Per-claim fees scale with volume; subscription improves predictability; implementation fees recover delivery; performance fees need auditable attribution. Minimum commitments, price reviews and termination convenience affect revenue durability. Contract diligence should reconcile signed terms with actual operating practice.
33. Evaluate implementation repeatability
Implementation should have defined data, integration, configuration, validation, training, acceptance and production stages. The company should measure elapsed time, internal hours, customer hours, defect, exception and post-launch support. A standard platform thesis requires reusable components and consistent acceptance evidence.
Custom engineering can support entry into a valuable segment and may reduce margin or scalability. Reviewers should separate product configuration from bespoke work. Delayed implementations affect revenue recognition, cash, customer trust and financing runway. The forecast should use observed implementation capacity and include dependencies controlled by the buyer.
34. Test competition, intellectual property and data rights
Competitive advantage may arise from workflow integration, validated models, proprietary data rights, distribution, regulatory trust, implementation capability or switching cost. General access to an AI model is not a durable moat. The company should show why a carrier, administrator, core-system vendor or adjacent InsurTech cannot reproduce the outcome economically.
Intellectual-property diligence should identify ownership, employee and contractor assignment, open-source obligations, model licences and customer-specific rights. Training and outcome data should have a lawful and durable use basis. Restrictions on derivative models, benchmarking or cross-customer learning can reduce scale. Patents and trade secrets should be connected to commercial use rather than counted as value by volume.
35. Build the integrated forecast
The forecast should connect qualified pipeline, procurement timing, implementation capacity, eligible claim volume, price, retention, delivery cost, governance cost and working capital. Revenue recognition and cash collection should follow contract evidence. Headcount should map to product, implementation, model operations, support, sales and control functions.
Base, downside and milestone cases should be explicit. The downside should include delayed customer approval, lower eligible volume, weak outcome evidence, model remediation, price pressure and reserve-related customer caution. The model should show monthly liquidity and covenant headroom where relevant. Financing need should fund a defined path to evidence and cash, rather than an unsupported market-share assumption.
36. Translate evidence into valuation
Valuation should connect forecast cash flows, risk and comparable economics. Revenue multiples require comparable growth, margin, retention, concentration, implementation intensity and risk-bearing profile. An insurer or managing general agent should not be compared directly with a software vendor without separating underwriting and technology economics.
Table 3. Evidence-to-valuation bridge
| Evidence domain | Strong evidence | Valuation implication |
|---|---|---|
| claims outcomes | matched cohorts and stable development | supports benefit durability |
| governance | validated models and controlled decisions | reduces adoption and liability risk |
| commercial | production renewals and collected cash | supports revenue quality |
| delivery | repeatable implementation and margin | supports scalable forecast |
| reserves | transparent assumptions and back-testing | constrains hidden balance-sheet risk |
| financing | milestones and adequate runway | reduces execution risk |
Weight and valuation effect require transaction-specific judgement and independent review.
Discounted cash flow should use scenario probabilities and avoid double-counting risk in both forecast and discount rate. Strategic value should be tied to identifiable synergies and integration feasibility. The valuation range should show which evidence would justify movement between cases.
37. Structure financing around evidence milestones
Capital should retire the risks that prevent durable commercial value. Milestones can include completion of independent validation, production acceptance, cohort maturity, renewal, implementation-time reduction, gross-margin improvement, security remediation and controlled expansion. Each milestone should have a source, owner, date and acceptance test.
Equity can fund product and commercial uncertainty; debt requires credible servicing cash and covenant resilience. A tranched or strategic structure may align funding with customer and evidence milestones. Terms should be assessed for dilution, control, liquidation preference, information rights and follow-on capacity. The financing plan should preserve enough runway to reach the next independently verifiable value inflection under a downside case.
38. Build the transaction data room
Table 4. InsurTech AI transaction data room
| Workstream | Core evidence | Verification test |
|---|---|---|
| product | workflow, model inventory, release history | replay representative claims |
| outcomes | cohort files, QA, complaints and reopenings | reconcile to financial records |
| actuarial | reserves, development and assumptions | back-test by mature cohort |
| commercial | contracts, CRM, invoices and cash | trace pipeline to collection |
| technology | architecture, security and resilience | inspect findings and recovery tests |
| legal | permissions, data rights, IP and liability | test ownership and change of control |
Access should be role-based, privacy-controlled and reconciled to source systems.
The room should use a controlled index, versioning and access log. Personal claims data should be minimised, anonymised or reviewed in a secure environment. Management presentations should link to underlying evidence. Open issues should state owner, consequence and remediation date.
Reviewers should select samples independently and reconcile across systems. Three journeys are useful: a successful automated claim, an exception or complaint, and a claim with material reserve development. The exercise reveals whether product, operational, consumer and financial records tell the same story.
39. Use a ninety-day readiness plan
Table 5. Ninety-day financing-readiness plan
| Period | Priority | Gated output |
|---|---|---|
| days 1-15 | perimeter and evidence ledger | reconciled decision scope |
| days 16-30 | cohort and workflow baseline | controlled claims population |
| days 31-45 | model, fairness and security review | findings and remediation plan |
| days 46-60 | loss-ratio and reserve bridge | actuarially reviewed attribution |
| days 61-75 | commercial and forecast proof | contract-to-cash model |
| days 76-90 | valuation, financing and data room | board-approved transaction case |
Timing is illustrative and should reflect transaction scope, data maturity and regulatory obligations.
The plan should run through accountable workstream owners and a weekly evidence review. Critical findings should enter the valuation and financing case as they emerge. The board should approve the transaction perimeter, risk appetite, claims made to investors and disclosure of limitations.
Readiness is reached when a third party can reproduce the central claims from controlled records. Gaps should remain explicit. A disciplined evidence package can improve transaction speed and credibility even when performance is mixed, because it allows risk to be priced and remediated.
40. Conclusion
InsurTech AI can create value through better claims information, lower operating work, faster service, controlled leakage, improved recovery and scalable delivery. The value is defensible when the claim population, decision path, consumer outcome, financial effect and reserve development can be traced. Automation volume and a lower reported loss ratio are insufficient on their own.
Boards and investors should separate product performance from portfolio mix, inflation, catastrophe, claim practice and reserve assumptions. They should test fairness, explainability, third parties, security and human accountability as operating evidence. The financing case should connect validated outcomes to contracts, implementation, unit economics, forecast and milestones. This structure converts a broad AI narrative into a decision-ready valuation range with explicit limitations and routes to stronger evidence.
References
- IFRS Foundation, IFRS 17 Insurance Contracts, issued standard and supporting materials, https://www.ifrs.org/issued-standards/list-of-standards/ifrs-17-insurance-contracts/
- IFRS Foundation, IFRS 17 Insurance Contracts, annotated standard, paragraph , https://www.ifrs.org/content/dam/ifrs/publications/pdf-standards/english/2023/issued-annotated/part-a/ifrs-17-insurance-contracts.pdf?bypass=on
- IFRS Foundation, IFRS 17 accounting model in one page, https://www.ifrs.org/content/dam/ifrs/supporting-implementation/ifrs-17/11-ifrs-17-accounting-model-a3-jan-2018.pdf
- IFRS Foundation, Effects Analysis, IFRS 17 Insurance Contracts, https://www.ifrs.org/content/dam/ifrs/project/insurance-contracts/ifrs-standard/ifrs-17-effects-analysis.pdf
- European Insurance and Occupational Pensions Authority, Opinion on Artificial Intelligence governance and risk management, 6 August 2025, https://www.eiopa.europa.eu/publications/opinion-artificial-intelligence-governance-and-risk-management_en
- European Insurance and Occupational Pensions Authority, Artificial intelligence governance principles: towards ethical and trustworthy artificial intelligence in the European insurance sector, 2021, https://www.eiopa.europa.eu/publications/artificial-intelligence-governance-principles-towards-ethical-and-trustworthy-artificial_en
- European Insurance and Occupational Pensions Authority, From Traditional AI to Generative AI: Implications for the Insurance Sector, 2025, https://www.eiopa.europa.eu/publications/traditional-ai-generative-ai-implications-insurance-sector_en
- National Association of Insurance Commissioners, Artificial Intelligence insurance topic, https://content.naic.org/insurance-topics/artificial-intelligence
- National Association of Insurance Commissioners, Model Bulletin on the Use of Artificial Intelligence Systems by Insurers, 2023, https://content.naic.org/sites/default/files/inline-files/2023-12-4%20Model%20Bulletin_Adopted_0.pdf
- National Association of Insurance Commissioners, Principles on Artificial Intelligence, 2020, https://content.naic.org/sites/default/files/inline-files/AI%20principles%20as%20Adopted%20by%20the%20Task%20Force%208_20_20.pdf
- National Association of Insurance Commissioners, Big Data and Artificial Intelligence Working Group, https://content.naic.org/committees/h/big-data-artificial-intelligence-wg
- Central Bank of the United Arab Emirates, Guidance Note on Consumer Protection and Responsible Adoption and Use of Artificial Intelligence and Machine Learning by Licensed Financial Institutions, 2026, https://rulebook.centralbank.ae/en/entiresection/6960
- International Association of Insurance Supervisors, Application Paper on the supervision of artificial intelligence, 2025, https://www.iaisweb.org/uploads/2025/07/Application-Paper-on-the-supervision-of-artificial-intelligence.pdf
- International Association of Insurance Supervisors, Insurance Core Principles and Common Framework, https://www.iaisweb.org/activities-topics/standard-setting/audiences-and-comframe/
- European Union, Regulation (EU) 2024/1689 laying down harmonised rules on artificial intelligence, https://eur-lex.europa.eu/eli/reg/2024/1689/oj
- European Union, Directive 2009/138/EC on the taking-up and pursuit of the business of Insurance and Reinsurance, https://eur-lex.europa.eu/eli/dir/2009/138/oj
- European Insurance and Occupational Pensions Authority, Guidelines on valuation of technical provisions, https://www.eiopa.europa.eu/publications/guidelines-valuation-technical-provisions_en
- Prudential Regulation Authority, Supervisory Statement SS5/14: Solvency II technical provisions, https://www.bankofengland.co.uk/prudential-regulation/publication/2014/solvency-2-technical-provisions-ss
- Financial Reporting Council, Technical Actuarial Standard 100: General Actuarial Standards, https://www.frc.org.uk/library/standards-codes-policy/actuarial/technical-actuarial-standards/
- Actuarial Standards Board, Actuarial Standard of Practice No. 43, Property/Casualty Unpaid Claim Estimates, https://www.actuarialstandardsboard.org/asops/propertycasualty-unpaid-claim-estimates/
- National Institute of Standards and Technology, Artificial Intelligence Risk Management Framework 1.0, https://www.nist.gov/itl/ai-risk-management-framework
- National Institute of Standards and Technology, AI Risk Management Framework Playbook, https://airc.nist.gov/airmf-resources/playbook/
- International Organization for Standardization, ISO/IEC 42001:2023 Artificial intelligence management system, https://www.iso.org/standard/81230.html
- Information Commissioner's Office, Guidance on AI and data protection, https://ico.org.uk/for-organisations/uk-gdpr-guidance-and-resources/artificial-intelligence/guidance-on-ai-and-data-protection/
- European Union, Regulation (EU) 2022/2554 on digital operational resilience for the financial sector, https://eur-lex.europa.eu/eli/reg/2022/2554/oj
- International Valuation Standards Council, International Valuation Standards, https://ivsc.org/standards/
