

Introduction
Liquid cooling changes both the physical architecture of a data centre and the commercial architecture of a retrofit. The work can involve information-technology equipment, rack manifolds, coolant distribution units, facility-water systems, chillers, pumps, controls, water treatment, leak detection, commissioning and ongoing fluid management. Responsibility crosses original-equipment manufacturers, engineering firms, mechanical contractors, colocation operators, hyperscalers and specialist service providers. A target may own only part of the system that determines performance.
The acquisition decision therefore depends on more than market growth. The buyer must determine which opportunities are funded, which designs are approved, which products are qualified, which technical interfaces are controlled, which personnel carry tacit know-how and which margins survive scaling. The same evidence should support valuation, purchase-price allocation, debt capacity, earn-out design and the first hundred days of integration.
This framework begins with the transaction perimeter and revenue-quality ladder. It then tests technical ownership, project execution, manufacturing, commissioning, water and refrigerant exposure, customer concentration and cash conversion. It ends with a central valuation, combined downside and transaction protections. Public sources establish sector context and disclosed transaction terms. Target-specific conclusions require contracts, drawings, product data, bills of material, test reports, telemetry, site records, invoices, cash receipts, employee files and intellectual-property documentation.
The framework is designed for an investment committee, strategic buyer or lender that must decide what can be paid at closing, what should remain contingent and what evidence must be completed before integration. It treats technical diligence as a financial input. Qualification, site readiness, commissioning, warranty and workforce transfer affect revenue timing, margin, working capital, useful life and downside recovery. The analysis therefore keeps each operating assumption connected to a source document and an accountable owner.
1. Define the acquisition thesis and return perimeter
State whether the buyer seeks product technology, engineering talent, customer access, field services, manufacturing capacity or an integrated thermal platform. Fix the valuation date, acquisition perimeter, funding plan, return threshold, integration budget and downside tolerance. Identify the legal entities, assets, contracts, licences, employees and facilities that transfer at closing.
Build separate stand-alone and combined cases. The stand-alone case should value only the target's controlled assets and executable cash flows. The combined case should identify each synergy, responsible owner, implementation cost, timing and customer dependency. Do not include a broader product bundle, global channel or purchasing benefit until the buyer can show how it changes an observable revenue, cost or working-capital line.
2. Map the thermal value chain and legal perimeter
Map the system from chip and cold plate through rack manifold, coolant distribution unit, secondary loop, facility-water loop and heat rejection. Record which party designs, owns, warrants, installs, controls and services each component. A target that sells a coolant distribution unit may rely on third parties for cold plates, controls, pumps, water treatment or field commissioning.
Reconcile the operating map to the legal perimeter. Identify the entity that owns patents and drawings, signs customer contracts, employs engineers, purchases components, performs installation, issues warranties and collects cash. Review intercompany licences, shared employees and related-party suppliers. A carve-out or founder-owned intellectual-property vehicle can leave critical rights outside the acquired business unless the transaction documents address them.
3. Classify retrofit demand by evidence state
Use a commercial ladder that separates addressable sites, customer discussions, engineering studies, budgetary quotations, funded projects, approved designs, purchase orders, scheduled outages, delivered equipment, installed capacity, commissioned systems, customer acceptance and collected cash. Each state supports a different conversion probability and timing assumption.
Measure pipeline by dollars, thermal megawatts, rack count, site count and gross margin. Remove duplicate opportunities reported by distributors, contractors and original-equipment manufacturers. Link each opportunity to a named site, customer decision-maker, server configuration, target deployment date and source document. This prevents broad market demand from being counted as target-specific backlog.
4. Distinguish executable retrofit work from customer aspiration
A site may want high-density compute while lacking available power, hydraulic distribution, chiller capacity, floor loading, outage windows or an approved server configuration. Test enabling works, construction sequencing, permits, customer budget and utility dependencies before treating the thermal project as executable.
Model the gating path for each project. A retrofit enters the executable schedule only when the customer has approved the technical concept, identified funding, established a procurement route and accepted the expected outage or phased installation plan. Remaining dependencies should carry specific probability, cost and delay assumptions rather than a single generic pipeline haircut.
5. Reconcile stated pipeline to risk-adjusted revenue
Begin with management's opportunity register and trace every material item to customer correspondence, design packages, quotations, procurement status and implementation dates. Remove expired quotations, projects awarded to others, duplicated channel entries, unsupported expansions and opportunities that require unproven product capability.
The hypothetical case begins with USD 1.28 billion of stated opportunities. Evidence tests remove USD 0.19 billion of unfunded concepts, USD 0.14 billion of duplicate or stale channel entries, USD 0.11 billion of site-readiness gaps, USD 0.07 billion of technical-qualification risk and USD 0.05 billion of credit and collection exposure. The resulting USD 0.72 billion schedule remains subject to delivery and acceptance.
6. Test product qualification and technology-roadmap fit
Review qualification against the server, rack, facility and coolant specifications that customers actually plan to deploy. NVIDIA documents hybrid liquid cooling for GB200 systems and liquid-cooled NVL72 architectures for GB300 systems. Product qualification should identify operating temperatures, pressure, flow, heat load, materials, connectors, controls, redundancy and serviceability for each supported configuration. [1][2][3]
Separate current qualification from roadmap claims. Record completed laboratory tests, witnessed customer tests, field hours, failures, corrective actions and certification status. Model engineering expenditure and time required for future platforms. A product that works for one rack generation may require redesigned manifolds, controls or facility interfaces for the next generation.
7. Verify proprietary know-how and freedom to operate
Inventory patents, applications, trade secrets, drawings, source code, control logic, simulation models, bills of material, tooling, test methods, installation procedures and field data. Establish legal ownership through assignments, employment agreements, contractor terms and acquisition history. Review open-source components and third-party licences.
Assess freedom to operate and practical reproducibility with qualified counsel and technical advisers. Determine whether the value resides in protected claims, accumulated test data, supplier process knowledge or a small group of engineers. Require a clean evidence chain from invention to commercial use. Know-how that cannot be documented, transferred and retained should receive a shorter life, higher attrition assumption or contingent value.
8. Separate codified intellectual property from tacit capability
Codified assets can include drawings, firmware, test protocols, configuration libraries and field procedures. Tacit capability can include the judgement needed to tune flow, select coolant chemistry, diagnose contamination, manage commissioning and resolve site-specific interactions. Both may create value, but they require different diligence and retention plans.
Run reproducibility tests. Ask a second team to manufacture, configure or commission a selected solution using the controlled documentation. Measure defects, rework, engineering hours and dependence on named individuals. Convert identified gaps into documentation sprints, retention arrangements, transition services and earn-out milestones before closing.
9. Analyse installed-base quality and warranty exposure
Build a site-level register of installed equipment, configuration, commissioning date, acceptance status, warranty term, service history, fluid chemistry, alarms, failures and customer credits. Distinguish systems operating in production from pilots and demonstration units. Link every claimed installed megawatt to a signed acceptance record and cash receipt.
Create warranty cohorts by product version, supplier lot and commissioning team. Estimate expected claims from observed failure frequency, service cost and remaining coverage. Review leakage, corrosion, fouling, pump, controls, connector and water-quality events. A rapidly growing installed base can create a delayed warranty tail that current margins do not yet reveal.
10. Test coolant chemistry and cleanliness controls
Open Compute Project guidance addresses operating and storage temperatures, water-based transfer fluids, corrosion, biological growth and flushing before operation. Vertiv's acquisition rationale for PurgeRite highlights flushing, purging, filtration and chemically stable coolant as part of reliable liquid-cooling deployment. [4][8][9]
Review approved fluids, material compatibility, filtration, particle limits, microbial controls, sampling, records and corrective actions. Trace responsibility across manufacturer, contractor and customer. Value field-service capability when it produces measurable commissioning quality, repeat business and margin. Treat weak chemistry control as a warranty, downtime and reputation exposure.
11. Map manufacturing and supplier dependence
Record capacity, yield, lead time and quality by product family and manufacturing site. Link major components to suppliers, alternates, tooling, minimum orders, purchase currency and qualification status. Determine whether pumps, heat exchangers, valves, sensors, controls and connectors can be dual-sourced without customer requalification.
Separate design ownership from manufacturing control. A target may own specifications while relying on a contract manufacturer for process knowledge or tooling. Model working capital, supplier deposits, expedited freight and obsolescence under rapid product change. Purchasing synergies should reflect validated specifications and qualification costs rather than headline spend.
12. Reconcile project revenue to acceptance and cash
Build a project ledger from proposal through engineering, equipment delivery, installation, commissioning, acceptance, invoice and collection. Record revenue-recognition policy, contract assets, retainage, change orders, liquidated damages, warranty holdbacks and disputed amounts. Reconcile management reporting to statutory accounts and bank receipts.
Project revenue can precede customer acceptance or cash collection. Test unbilled receivables and deferred revenue by project. Measure days from order to delivery, delivery to commissioning, commissioning to acceptance and acceptance to cash. Use these cohorts to forecast working capital and identify projects whose reported margin depends on unresolved site conditions.
13. Separate repeatable product economics from project engineering
Calculate revenue and contribution margin for standard products, customised products, design engineering, installation, commissioning, fluid services, maintenance and emergency response. Allocate material, labour, warranty, freight and field rework consistently. Show integration engineering separately from recurring support.
Recurring value arises when a qualified design can be manufactured and deployed repeatedly with controlled variation. Site-specific engineering may still earn attractive margins, but it should be valued on labour capacity, backlog, utilisation and cash conversion. Avoid capitalising one-time retrofit complexity as a permanent product margin.
14. Test customer concentration and qualification power
Aggregate customers across affiliates, sites, contractors and channels. Calculate concentration by stated pipeline, purchase orders, accepted revenue, gross margin, receivables and installed megawatts. Identify customers that control vendor qualification, reference designs or future platform access.
Model the loss or delay of the largest qualification relationship. A technical partnership can accelerate market access while creating dependency on one product roadmap or procurement group. Review change-of-control, assignment, exclusivity, most-favoured pricing, data rights, audit and termination provisions. Do not assume that a strategic relationship transfers unchanged after acquisition.
15. Test channel and contractor economics
Map direct sales, distributors, engineering firms, mechanical contractors, original-equipment manufacturers and facility operators. Record who owns the customer relationship, controls design, sets price, carries warranty, performs installation and collects cash. Separate sell-in from accepted end-customer deployment.
Measure discounts, rebates, bid support, project-development cost, warranty sharing and receivable risk by channel. A channel can expand reach while obscuring end demand and duplicating pipeline. Require site identifiers and end-customer evidence for material channel opportunities. Value channel relationships according to controlled economics and renewal behaviour.
16. Build the retrofit megawatt conversion schedule
Track customer-described, technically screened, site-ready, ordered, delivered, commissioned, accepted and paid thermal capacity. The hypothetical target reports 420 MW of customer-described demand. Technical and commercial evidence supports 275 MW of executable pipeline. The installed base totals 96 MW, of which 63 MW has completed acceptance and collection.
Forecast conversion by cohort and month. Link capacity to product configuration, manufacturing slot, site works, outage plan, commissioning team and customer acceptance. Apply remaining capex and working capital at each state. Avoid using the same megawatt in both backlog and installed-base valuation.
17. Model labour capacity and field-service productivity
List engineering, manufacturing, installation and commissioning roles by location, certification and utilisation. Measure project hours, travel, subcontractor use, rework, safety incidents and revenue per billable employee. Identify people who approve designs, resolve field issues or retain customer trust.
Forecast hiring, training and retention needed to execute the pipeline. Rapid revenue growth can consume specialist capacity before margins appear. Test wage inflation, overtime, travel and subcontractor rates. Tie earn-outs and management incentives to accepted gross profit and cash rather than orders that exceed executable labour capacity.
18. Assess water, heat-rejection and refrigerant exposure
Liquid cooling moves heat efficiently within the facility; final heat rejection can still consume water and electricity depending on site design. EPA resources describe water reuse for cooling applications, including data-centre examples. DOE and IEA material emphasise rising energy and water attention associated with data-centre growth. [5][6][14][15]
Map facility-water temperature, water source, treatment, discharge, drought exposure, heat-reuse options and refrigerant inventory by project. Identify who bears performance and environmental obligations. Validate claims about water or energy savings against the full system boundary. Environmental benefits can support customer value when measured; unsupported claims create sales and diligence risk.
19. Review safety, quality and cyber controls
Assess pressure testing, leak detection, lockout procedures, chemical handling, electrical interfaces, commissioning permits and incident reporting. Review quality records from design release through supplier inspection, factory test, site installation and acceptance. Link non-conformances to corrective actions and warranty reserves.
Controls and remote monitoring can create cyber exposure. Map software components, access paths, update mechanisms, credentials, logging and customer networks. Review NIST guidance and customer security requirements where applicable. A buyer should understand whether remote service capability is contractually authorised, segmented and auditable.
20. Apply US acquisition and competition requirements
Map the transaction against Hart-Scott-Rodino thresholds, filing rules and the 2023 Merger Guidelines with qualified counsel. Review customer and supplier overlap, labour markets, bundling, interoperability and access to critical inputs. A small specialist target can still matter strategically if it controls a qualification route or scarce technical capability. [16][17][18]
Identify export controls, government contracts, classified work, foreign ownership and CFIUS considerations where relevant. The analysis should follow the actual buyer, target, technology and customer base. Regulatory timing belongs in the financing and integration schedule rather than a generic closing assumption.
21. Apply acquisition accounting and intangible-asset evidence
US GAAP business-combination accounting requires identification and fair-value measurement of acquired assets and liabilities. Evaluate customer relationships, developed technology, trade names, backlog, non-compete arrangements, property, leases, working capital, deferred revenue and contingent consideration. Distinguish a business combination from an asset acquisition. [19][20][21][22]
Accounting evidence can improve valuation discipline without determining price. Vertiv's 2025 filing reported preliminary customer-relationship value of USD 372.6 million in the PurgeRite acquisition and disclosed material estimation uncertainty. Reconcile purchase-price allocation assumptions with customer attrition, technology life, margin, tax amortisation and the transaction model. [9][10]
22. Value developed technology and know-how
Use a relief-from-royalty, multi-period excess-earnings, with-and-without or cost approach only when its assumptions match the asset and evidence. Estimate legal life, economic life, obsolescence, maintenance research and development, contributory assets, customer overlap and tax effects. Avoid assigning the same cash flow to technology, customer relationships and goodwill.
Test technology value against commercial use. Trace qualified products to revenue, accepted installations, margins and repeat orders. Apply shorter lives or probability adjustments to roadmap technology. Tacit know-how can support goodwill or workforce value, but it also creates retention risk. Document how each asset contributes to the forecast.
23. Value customer relationships and retrofit pipeline
Classify customers by contract, qualification, installed base, repeat purchase, service attachment and competitive alternatives. Estimate attrition from observed cohorts and customer-specific evidence. Separate recurring service and replacement demand from one-time site conversions.
Value pipeline through project-level probability and timing rather than a blanket revenue multiple. Consider order status, funding, design approval, site readiness, manufacturing capacity, competition, margin and working capital. Recognise backlog and customer-relationship overlap once. Pipeline that remains an unfunded engineering concept belongs outside base value.
24. Triangulate enterprise value
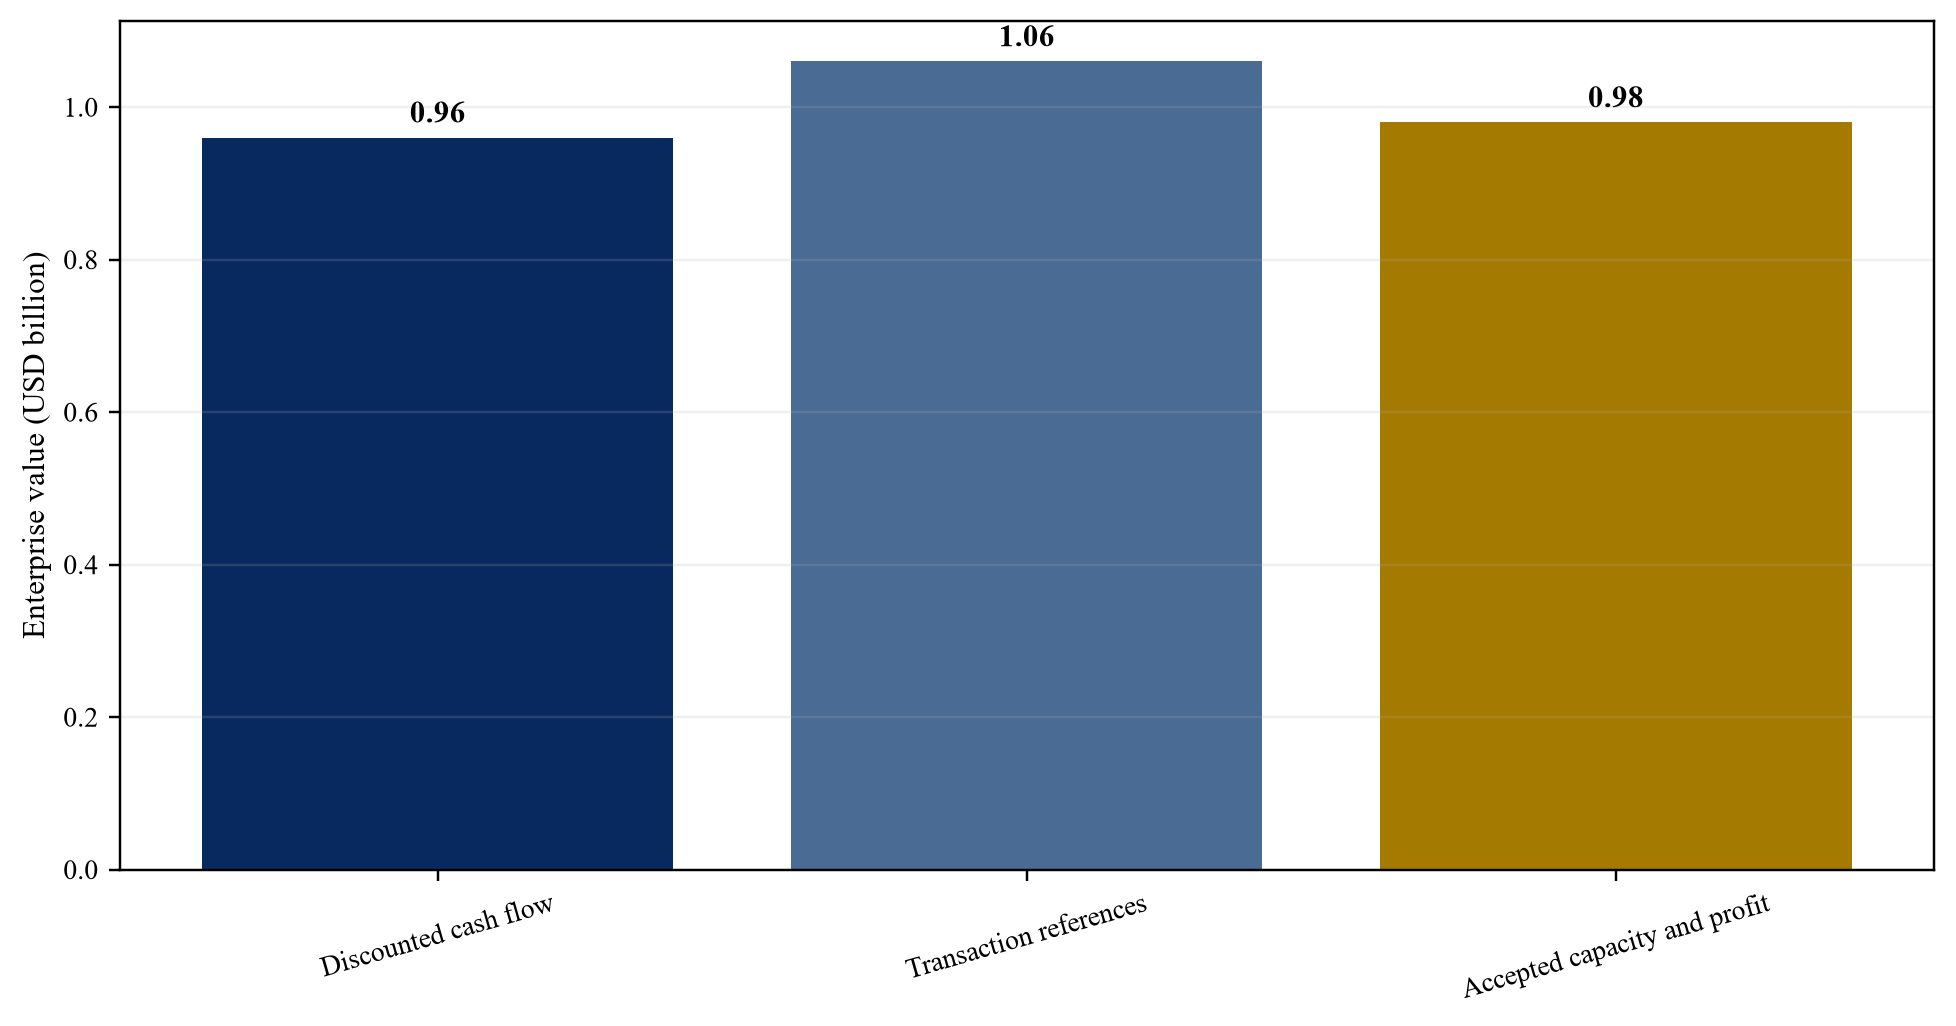
Use discounted cash flow, precedent transactions, public-company references and selected operating metrics on consistent definitions. The DCF should reflect project conversion, product mix, labour capacity, warranty, working capital, tax, capital expenditure and integration cost. Transaction references require adjustment for control, scale, growth, margins, customer concentration and synergies.
The disclosed Motivair and PurgeRite terms provide useful observations with materially different denominators. Motivair was described using expected revenue; PurgeRite was described using expected EBITDA including cost synergies. CoolTera and TMGcore involved different asset and capability scopes. Reconcile methods explicitly rather than averaging headline multiples. [7][8][11][12]
25. Build the enterprise-to-equity bridge
Deduct debt, leases, unpaid capital expenditure, customer advances that require performance, warranty provisions, supplier claims, tax exposures, transaction expenses and contingent obligations. Add only unrestricted cash available to the acquired group. Reconcile debt-like and working-capital treatment with the purchase agreement.
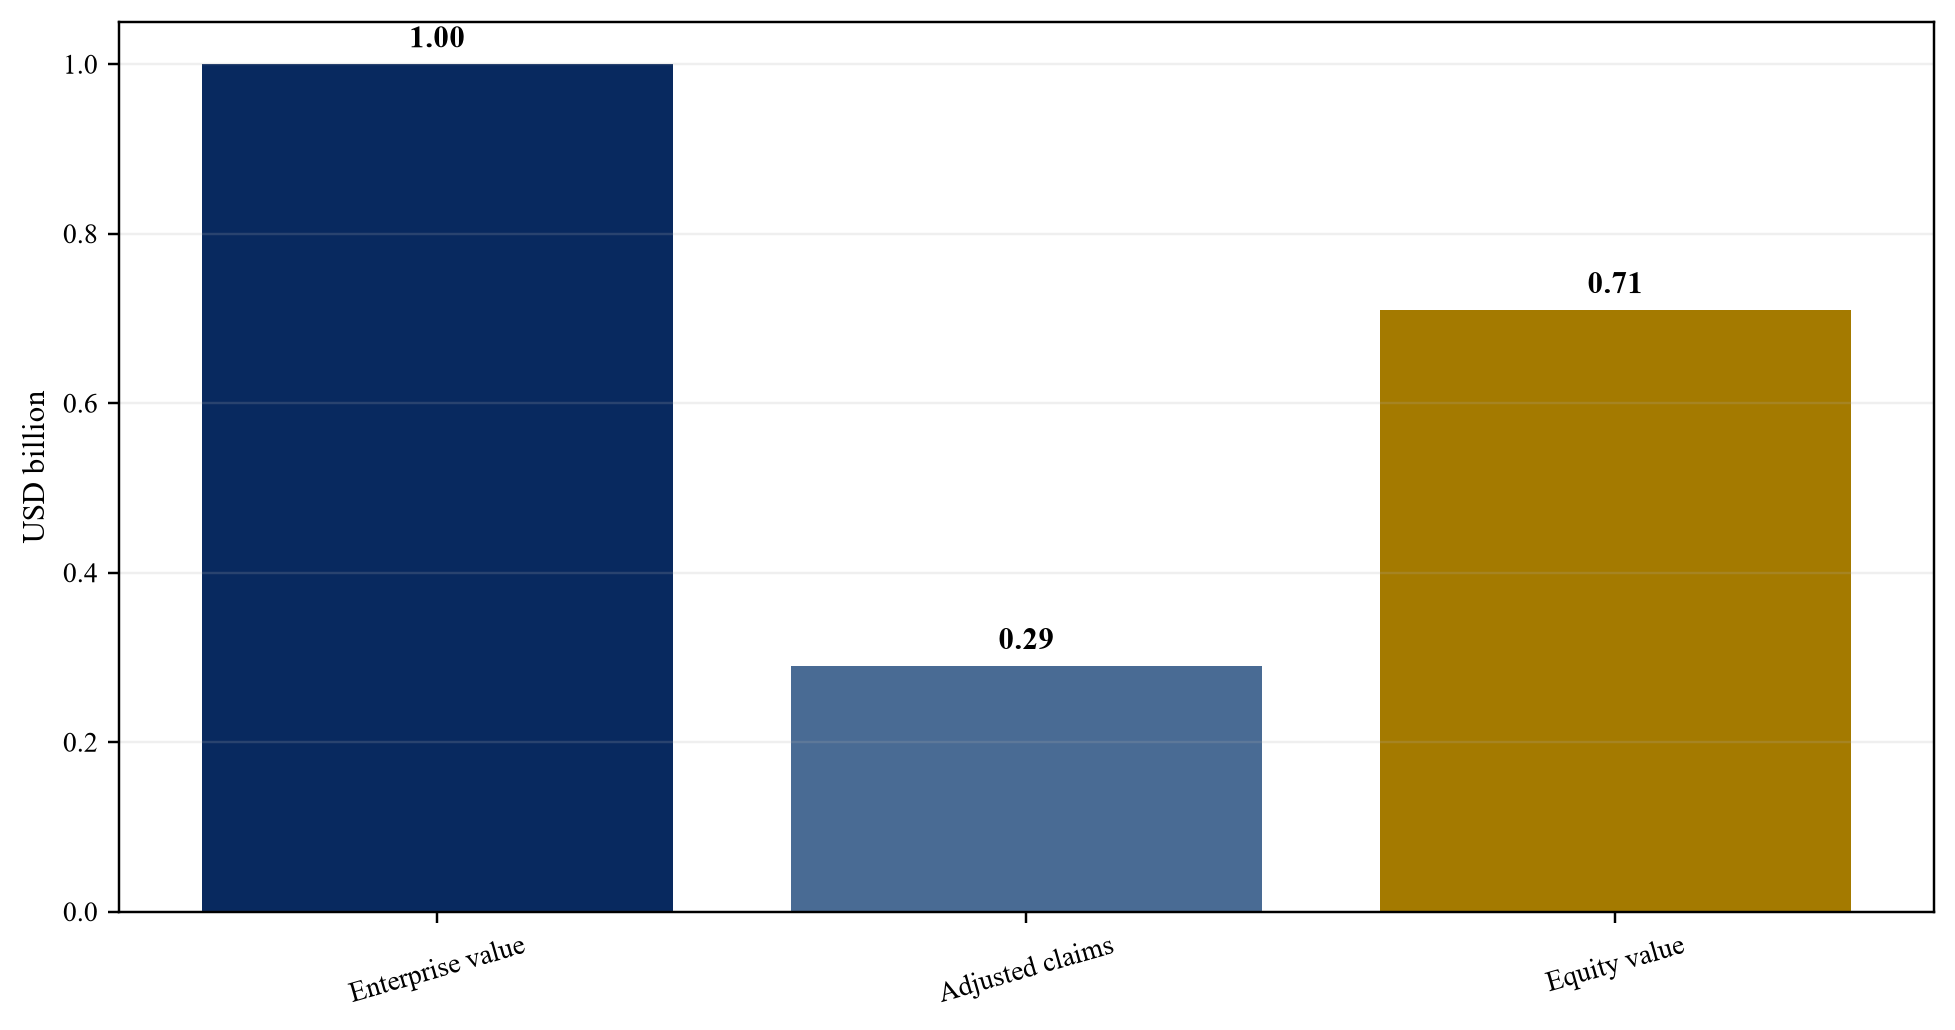
The hypothetical central case uses USD 1.00 billion of enterprise value and USD 0.29 billion of adjusted claims, producing USD 0.71 billion of illustrative equity value. The combined downside uses USD 0.49 billion of enterprise value and USD 0.34 billion of claims, producing USD 0.15 billion of illustrative equity value. These figures describe no identified company or transaction.
26. Run a combined conversion, cost and warranty downside
Combine risks that can occur together. Lower project conversion can leave manufacturing and engineering capacity underutilised. Schedule delay can increase labour and working capital. Rapid product change can cause inventory obsolescence. Field failures can add warranty cost while weakening future qualification and customer retention.
The hypothetical downside assumes a nine-month average delay, executable-pipeline conversion of 40 per cent rather than 66 per cent, a 12 per cent equipment-and-labour cost increase, incremental warranty losses, weaker service attachment and a 15 per cent steady-state EBITDA margin. Enterprise value falls to USD 0.49 billion and adjusted claims increase to USD 0.34 billion. The model should identify liquidity, covenant and integration responses before signing.
27. Convert diligence into transaction protections
Translate evidence gaps into closing conditions, price adjustments, escrow, holdbacks, earn-outs, warranties, indemnities, retention arrangements and walk-away rights. Define every milestone with an objective source, measurement period, accounting policy, dispute mechanism and long-stop date.
Useful milestones can include customer purchase orders, product qualification, accepted megawatts, collected gross profit, warranty performance, documentation completion and retention of critical engineers. Avoid earn-outs based solely on bookings or revenue when the seller can accelerate low-margin projects or defer warranty consequences.
28. Establish the first-hundred-day value-control system
Create a board dashboard that reconciles pipeline state, product qualification, accepted megawatts, revenue, gross margin, working capital, warranty, engineering capacity, supplier delivery, customer concentration, intellectual-property actions and liquidity. Name data owners and exception thresholds. Require source evidence for movement between states.
Priorities should include customer continuity, retention of critical personnel, control of drawings and software, supplier continuity, safety and quality governance, integration of project accounting and a documented technology roadmap. Compare stand-alone and combined performance. Recognise synergies only after actions, costs and customer outcomes are recorded.
Appendix A. Integrated valuation model
The model uses five connected schedules: commercial pipeline, retrofit capacity, product and labour capacity, cash conversion and valuation. Every opportunity has a customer, site, configuration, evidence state, expected order date, delivery date, acceptance date, price, margin, working-capital profile and conversion probability. Each accepted project links to its installed equipment, warranty cohort and service opportunity.
The intellectual-property schedule records asset type, owner, inventor, assignment, jurisdiction, remaining legal life, commercial use, supported product, maintenance expenditure and valuation method. The customer schedule records contracting entity, qualification status, installed base, repeat orders, gross margin, collection and attrition. The model prevents the same cash flow from supporting pipeline, customer-relationship and technology value more than once.
The valuation schedule calculates stand-alone discounted cash flow and reconciles relevant market evidence. Synergies appear in a separate schedule with owner, action, cost, timing, probability and customer dependency. The enterprise-to-equity bridge connects every debt-like claim to source documents and the purchase-agreement definition.
The model should preserve operating units and dates. Thermal capacity can be recorded in kilowatts or megawatts, while customer orders can be denominated by rack, coolant distribution unit, project or service hour. Convert these measures through a documented configuration table rather than an assumed average. Revenue timing should follow the customer's contract and acceptance process. Costs should distinguish purchased equipment, direct labour, subcontractors, freight, commissioning, warranty and continuing service. This structure lets the investment committee see whether value comes from more projects, better product mix, higher field productivity, lower rework or stronger service attachment.
Appendix B. Minimum confirmatory evidence
The commercial room should include customer opportunity records, site identifiers, correspondence, funded budgets, requests for proposal, quotations, purchase orders, contracts, change orders, acceptance certificates, invoices and bank receipts. The operating room should include drawings, bills of material, qualification records, factory tests, field tests, commissioning reports, telemetry, warranty cases, quality records and supplier agreements.
The intellectual-property room should include patents, applications, assignments, invention records, contractor agreements, source-code repositories, licences, open-source inventories, trade-secret controls, test data and product-roadmap approvals. The people room should include role maps, employment terms, retention data, certifications and succession plans. The finance room should include audited accounts, project ledgers, contract assets, deferred revenue, inventory, receivables, debt, leases, tax and insurance.
Evidence quality should be graded by source and reconciliation status. A management spreadsheet can identify an item for testing, while an executed contract, customer acceptance record or bank receipt can support a recognised state. Sample testing should cover large projects, unusual margins, year-end revenue, long-outstanding receivables, recent product versions and warranty events. Exceptions should remain visible in the data room with an owner, financial exposure and resolution date. This avoids replacing missing evidence with a broad diligence qualification that cannot be reflected in price or transaction protection.
Appendix C. Hypothetical worked case
The case starts with USD 1.28 billion of stated retrofit opportunities and 420 MW of customer-described demand. Evidence testing removes USD 0.19 billion of unfunded concepts, USD 0.14 billion of duplicate or stale channel entries, USD 0.11 billion of site-readiness gaps, USD 0.07 billion of technical-qualification risk and USD 0.05 billion of credit and collection exposure. The risk-adjusted schedule is USD 0.72 billion and 275 MW.
The target has completed 96 MW of projects. Signed acceptance and collection records support 63 MW. The remainder includes recent installations awaiting acceptance, pilots and projects with unresolved documentation. The central case assumes 66 per cent conversion of executable pipeline over thirty months, a 23 per cent steady-state EBITDA margin, controlled warranty cost and recurring fluid-management and maintenance attachment.
Discounted cash flow supports USD 0.96 billion of enterprise value. The precedent-transaction method supports USD 1.06 billion after adjustments for scale, margins, customer concentration and synergy. A selected accepted-capacity and gross-profit method supports USD 0.98 billion. The reconciled central value is USD 1.00 billion. Adjusted claims of USD 0.29 billion produce USD 0.71 billion of illustrative equity.
The combined downside assumes 40 per cent conversion, a nine-month delay, a 12 per cent cost increase, additional warranty expense, weaker service attachment and a 15 per cent EBITDA margin. Enterprise value falls to USD 0.49 billion. Adjusted claims increase to USD 0.34 billion, leaving USD 0.15 billion of illustrative equity. The figures are assumptions for decision analysis and describe no identified business.
The central and downside cases should also be tested for financing capacity. Lenders may focus on contracted and accepted cash rather than management pipeline, particularly where projects require inventory, customer-specific engineering or milestone acceptance. Model borrowing-base eligibility, covenant EBITDA, cash interest, amortisation, minimum liquidity and seasonal working capital. Equipment and inventory should receive recovery values consistent with configuration, qualification and resale evidence. Sponsor equity should cover identified integration work and a defined contingency rather than serve as an unspecified cure for every modelling gap.
Appendix D. Board and lender diligence questions
Commercial evidence: Which opportunities have approved budgets, named sites, confirmed server configurations and procurement routes? Which pipeline items appear through more than one channel? What proportion of stated value has a purchase order, accepted design or scheduled outage? How much accepted revenue has converted to cash?
Technology: Which products are qualified for current customer configurations? Which future platform claims remain under development? Who owns the patents, drawings, code, controls and test data? Can another team reproduce design and commissioning from controlled documentation? Which functions depend on named employees?
Execution: What enabling electrical, hydraulic and structural work does each retrofit require? Which party carries site risk, commissioning responsibility and warranty? What manufacturing and field-service capacity constrains conversion? How have lead times, rework and gross margins changed by cohort?
Quality and warranty: Which product versions, supplier lots or installation teams account for incidents? What fluid chemistry and cleanliness records exist? What claims remain open? How much cash and labour would a severe field event require?
Valuation and financing: Which cash flows support developed technology, customer relationships, backlog and goodwill? How do transaction multiples differ in denominator and synergy treatment? What claims sit ahead of equity? What liquidity is required under the combined downside?
Integration readiness: Which customer, supplier and employee communications can occur before and after closing? Which systems contain controlled drawings, project costs, quality records and customer acceptance? What day-one access is required to keep field projects safe and billable? Which integration actions could disturb qualification, warranty or customer trust? What decisions must remain with the target team until the buyer has demonstrated equivalent technical control?
Appendix E. Scenario governance
The valuation date should preserve the evidence set used for approval. Updates should identify the new document, changed assumption, owner and financial effect. An opportunity changes state only when the required source evidence is available. A project moves to accepted capacity only after signed customer acceptance; cash status changes only after bank evidence.
Run central, execution-delay, lower-conversion, cost-shock, warranty and combined cases. Do not blend mutually inconsistent assumptions. Report monthly differences between forecast and actual orders, deliveries, acceptance, cash and warranty. The board should review whether deviations reflect timing, permanent margin change or evidence weakness.
Every forecast version should retain its opening pipeline and capacity cohorts so actual conversion can be measured without rewriting history. Changes to probability, price, margin, useful life or attrition should record the approver and source. Acquisition accounting, lender reporting and management valuation should use reconciled definitions even when their measurement purposes differ. When a new product qualification or customer order changes the outlook, update the relevant cohort and keep the prior case available for performance attribution.
Appendix F. Liquid-cooling M&A data dictionary
The opportunity record should include customer, site, configuration, thermal load, sales channel, source document, budget status, quotation, expected order, technical qualification, site readiness, competitor, conversion probability and next evidence requirement. The project record should include contract, scope, price, change orders, cost, delivery, commissioning, acceptance, invoice, collection, warranty and responsible team.
The technology record should include product family, version, supported configuration, design owner, patent or trade-secret linkage, drawing release, software version, bill of material, suppliers, test records, field hours, failure events and roadmap status. The installed-base record should connect equipment serials, site, operating conditions, coolant, commissioning, acceptance, service and warranty.
The people record should include role, location, technical authority, customer dependency, certification, documentation responsibility, retention status and successor. The valuation record should identify method, cash-flow source, useful life, attrition, royalty, contributory assets, tax effects, probability and sensitivity. The claims record should include debt, leases, customer obligations, warranty, unpaid capex, tax, litigation, contingent consideration and transaction expenses.
The supplier record should include component, specification, approved vendor, production location, tooling owner, lead time, minimum order, price currency, warranty, alternate source and requalification requirement. The quality record should connect each non-conformance to product version, supplier lot, project, root cause, corrective action and financial cost. The fluid record should capture coolant type, concentration, materials, cleanliness, sampling, treatment, commissioning and service history. These tables allow diligence findings to flow into gross margin, warranty, working capital and purchase-agreement schedules without manual reinterpretation.
Appendix G. Decision figures and tables
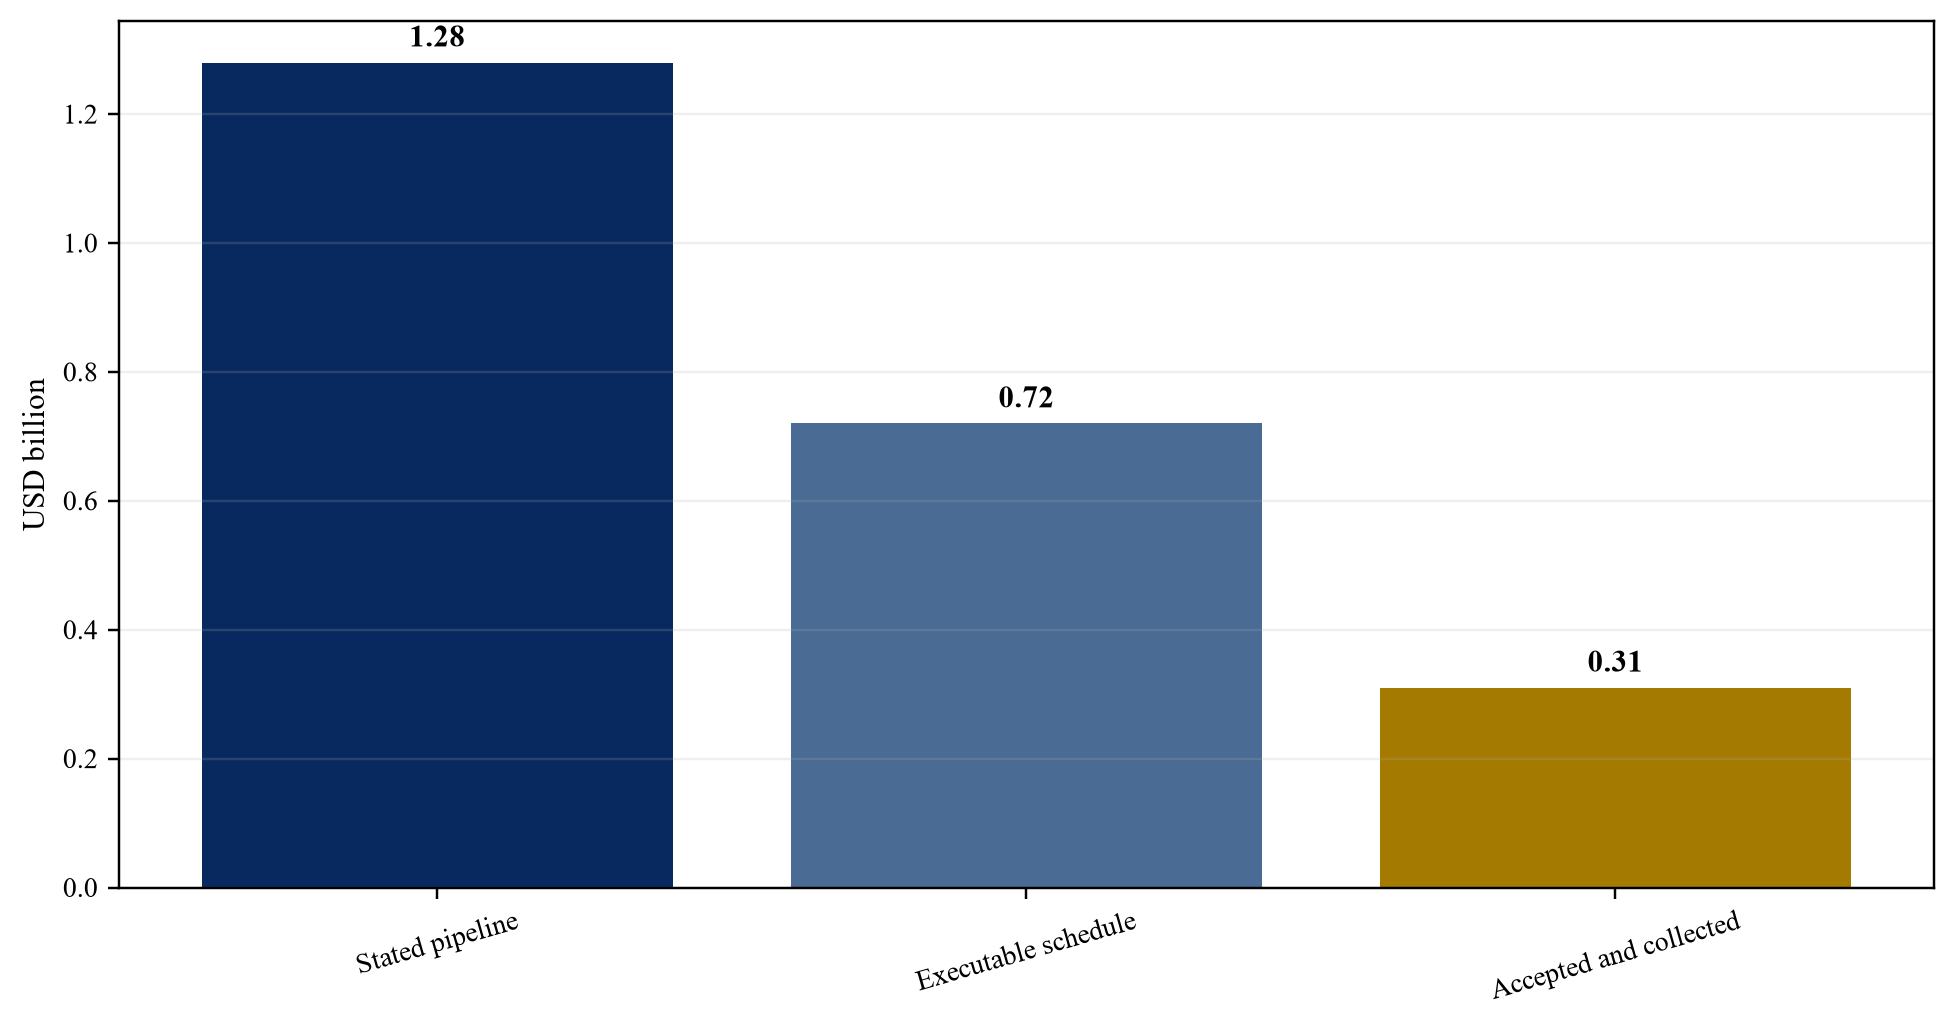
Wholly hypothetical; Matchpoint Partners analysis.
| State | Minimum evidence | Valuation treatment |
|---|---|---|
| Customer aspiration | named site and stated demand | market context only |
| Technically screened | configuration and feasibility review | probability-adjusted pipeline |
| Funded and approved | budget, design and procurement route | executable schedule |
| Ordered and delivered | purchase order and delivery record | backlog subject to performance |
| Accepted and collected | acceptance, invoice and cash | strongest commercial evidence |
Proposed framework unless stated otherwise.
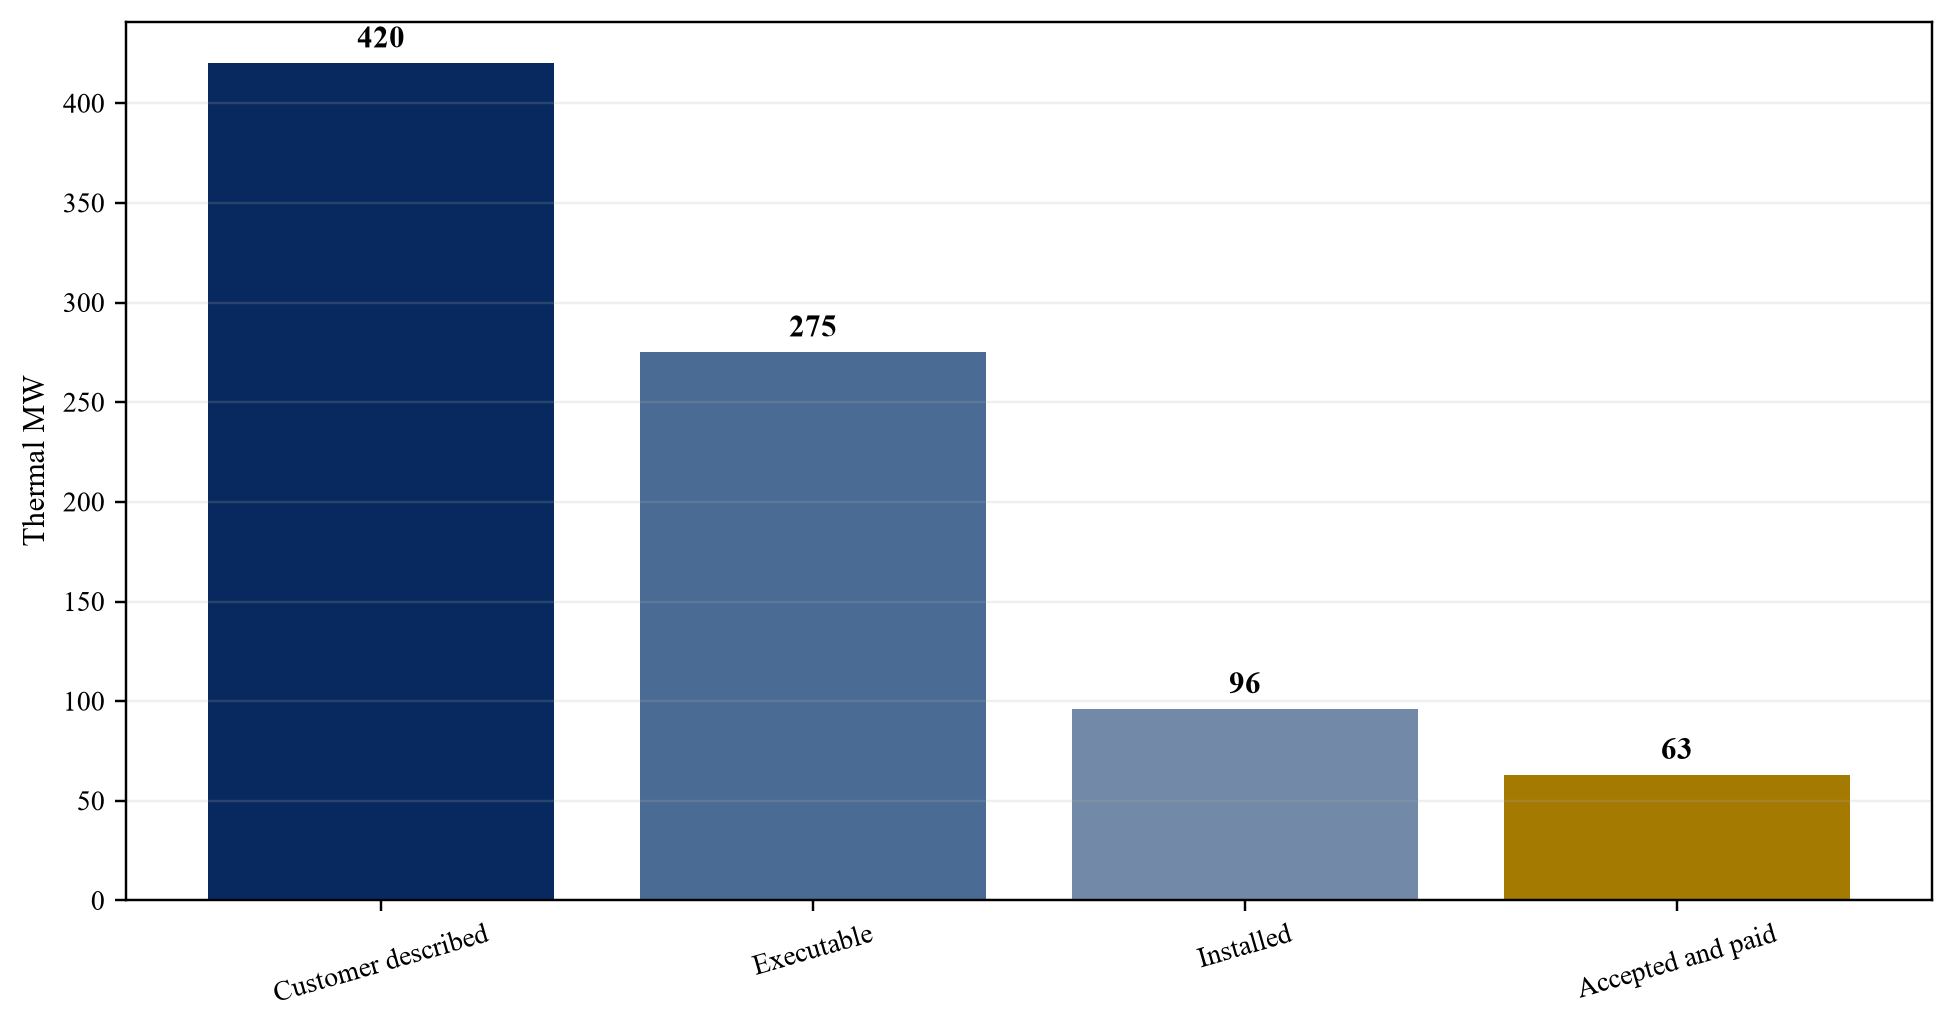
Wholly hypothetical; Matchpoint Partners analysis.
| Asset | Control evidence | Commercial evidence |
|---|---|---|
| Patents and designs | assignments and ownership register | qualified product revenue |
| Control software | repository, licence and release record | operating installations |
| Test data | controlled protocols and results | qualification and lower rework |
| Field procedures | approved work instructions | acceptance, uptime and repeat work |
| Tacit capability | role map and reproducibility test | customer retention and problem resolution |
Proposed framework unless stated otherwise.
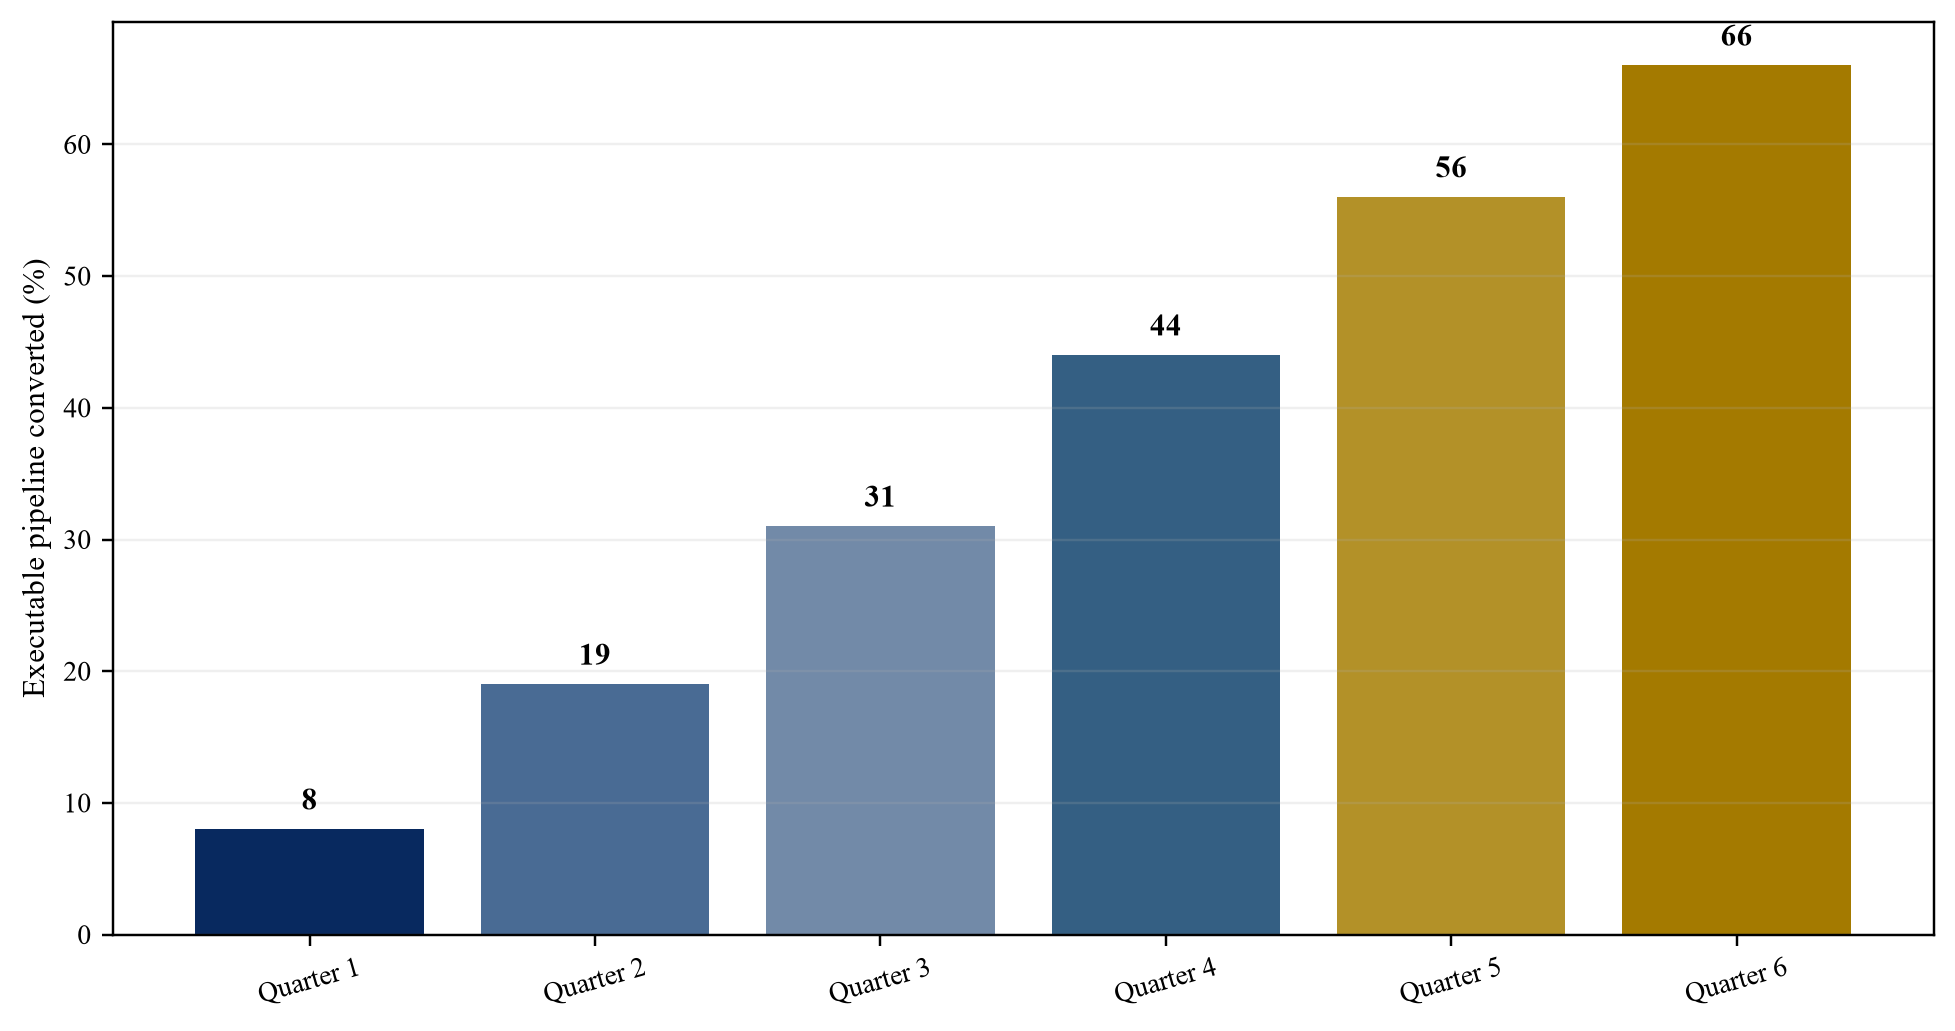
Wholly hypothetical; Matchpoint Partners analysis.
| Revenue type | Primary evidence | Principal risk |
|---|---|---|
| Standard equipment | repeat configuration and margin | component qualification and price |
| Custom engineering | approved scope and hours | labour capacity and rework |
| Installation and commissioning | site record and acceptance | schedule, safety and liquidated damages |
| Fluid and maintenance service | service record and renewal | technician capacity and customer retention |
Proposed framework unless stated otherwise.
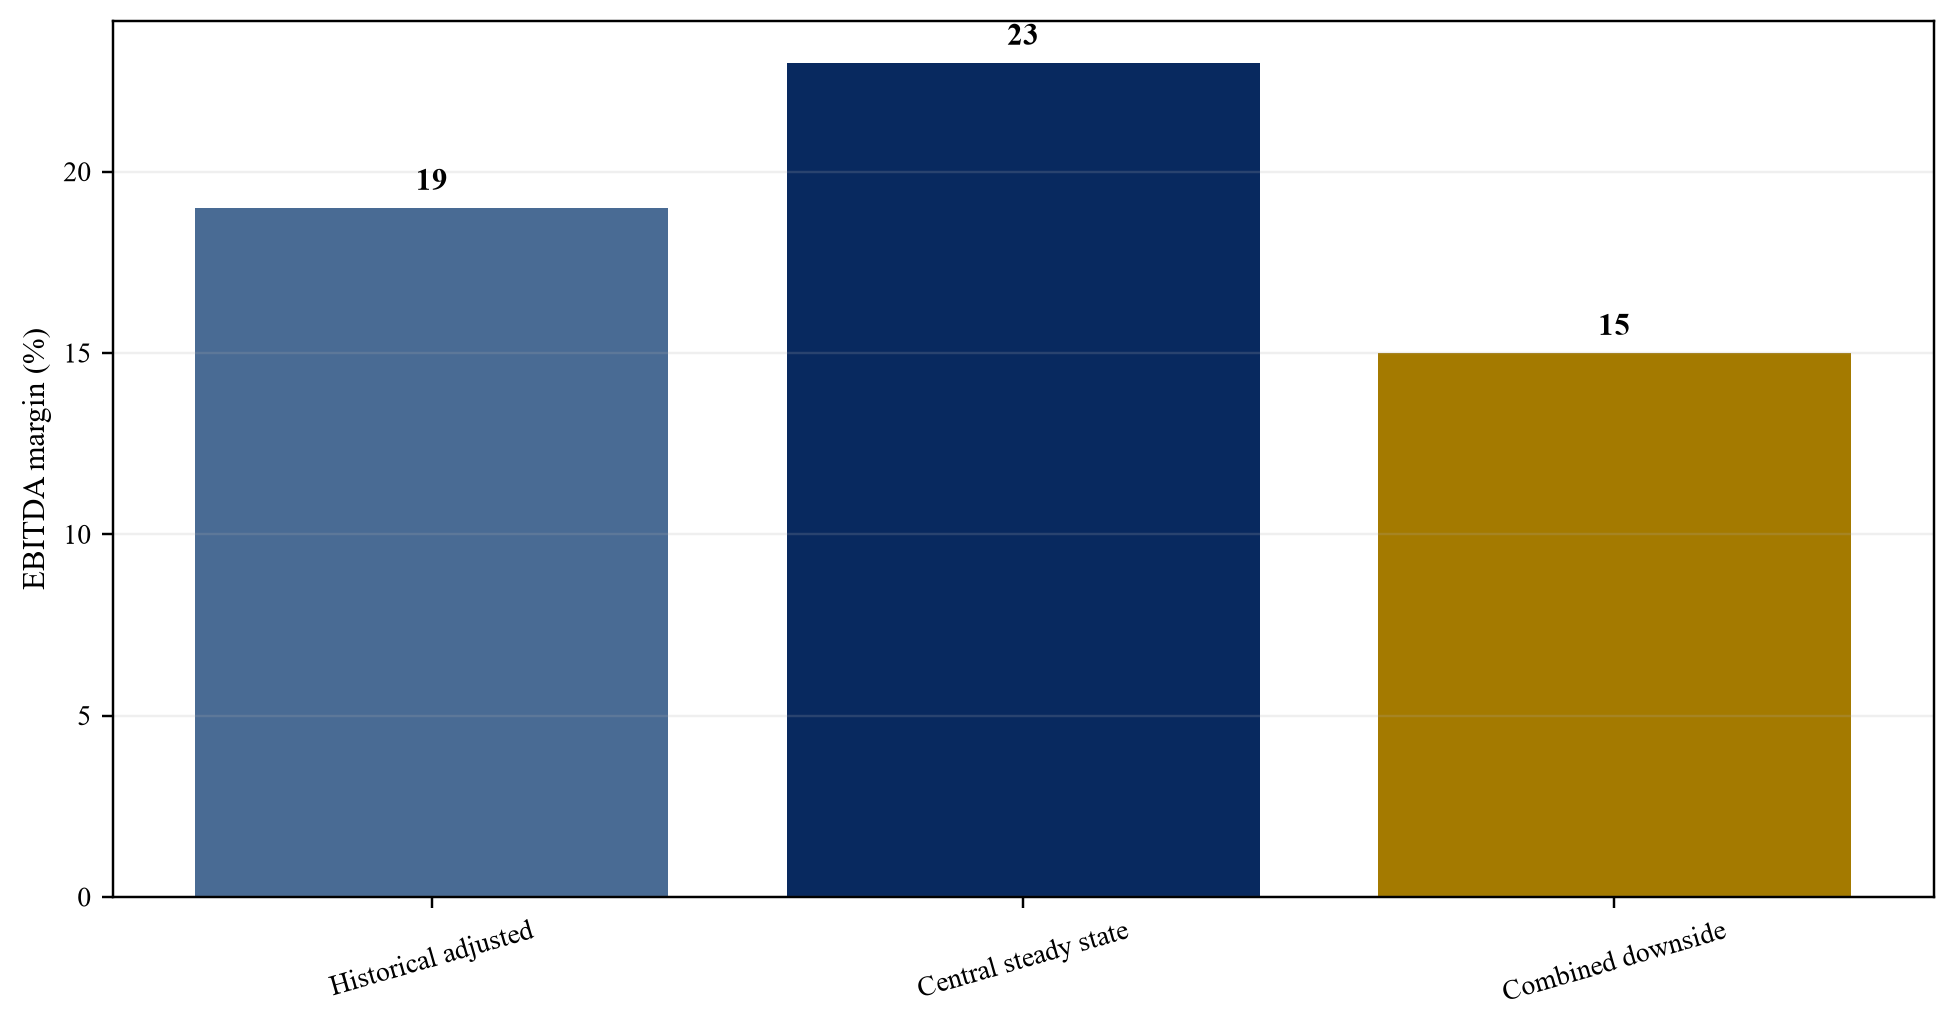
Wholly hypothetical; Matchpoint Partners analysis.
| Reference | Disclosed denominator | Required normalisation |
|---|---|---|
| Motivair controlling interest | expected revenue | stake, growth, margin and future purchase terms |
| PurgeRite | expected EBITDA including cost synergies | synergy, earn-out, services mix and customer concentration |
| CoolTera | consideration not material to buyer | acquired assets, technology scope and integration |
| TMGcore selected assets | asset purchase | intellectual property scope and absence of operating business |
Public terms require target-specific adjustment.
Wholly hypothetical; Matchpoint Partners analysis.
| Asset | Possible method | Critical inputs |
|---|---|---|
| Developed technology | relief from royalty or with-and-without | useful life, royalty, roadmap and maintenance R&D |
| Customer relationships | multi-period excess earnings | attrition, margin, contributory assets and overlap |
| Backlog | project-level excess earnings | acceptance, margin, timing and working capital |
| Trade name | relief from royalty | market use, life and rebranding plan |
Proposed framework unless stated otherwise.
Wholly hypothetical; Matchpoint Partners analysis.
| Item | Central case | Combined downside |
|---|---|---|
| Enterprise value | USD 1.00bn | USD 0.49bn |
| Adjusted claims | USD 0.29bn | USD 0.34bn |
| Illustrative equity | USD 0.71bn | USD 0.15bn |
Proposed framework unless stated otherwise.
| Metric | Primary source | Trigger |
|---|---|---|
| Executable retrofit pipeline | customer, site and budget evidence | conversion or schedule variance |
| Accepted and paid thermal MW | acceptance and bank record | commissioning or collection delay |
| Product gross margin | project ledger and bill of material | cost or rework variance |
| Warranty and fluid quality | service and chemistry record | failure or contamination event |
| Critical know-how retention | role map and documentation | attrition or reproducibility gap |
Proposed framework unless stated otherwise.
Sources
- NVIDIA, Understanding Your Grace-Blackwell Systems, GB200 NVL multi-node tuning guide. Read the primary source
- NVIDIA, DGX SuperPOD reference architecture featuring DGX GB200. Read the primary source
- NVIDIA, DGX GB Rack Scale Systems User Guide. Read the primary source
- Open Compute Project, Cold Plate Cooling Loop Requirements, Revision 2. Read the primary source
- ASHRAE, Emergence and Expansion of Liquid Cooling in Mainstream Data Centers. Read the primary source
- US Department of Energy, United States Data Center Energy Usage Report: 2025 Update. Read the primary source
- Schneider Electric, acquisition of a controlling interest in Motivair Corporation, 17 October 2024. Read the primary source
- Vertiv, intent to acquire PurgeRite, 3 November 2025. Read the primary source
- Vertiv Holdings Co, Annual Report for 2025, acquisition and purchase-price-allocation disclosures. Read the primary source
- Vertiv Holdings Co, 2025 Annual Report PDF, PurgeRite acquisition disclosure. Read the primary source
- Vertiv, acquisition of CoolTera Ltd., 4 December 2023. Read the primary source
- Modine, purchase of TMGcore liquid-immersion-cooling intellectual property and selected assets, 2 January 2024. Read the primary source
- Modine Manufacturing Company, Annual Report for fiscal 2025. Read the primary source
- US Environmental Protection Agency, Water Reuse Case Study: Quincy, Washington. Read the primary source
- International Energy Agency, Energy and AI. Read the primary source
- US Department of Justice and Federal Trade Commission, Merger Guidelines, 2023. Read the primary source
- Federal Trade Commission, Hart-Scott-Rodino premerger notification program. Read the primary source
- Federal Trade Commission, Premerger Notification Office, current thresholds and filing guidance. Read the primary source
- Financial Accounting Standards Board, Accounting Standards Codification Topic 805, Business Combinations. Read the primary source
- Financial Accounting Standards Board, Accounting Standards Codification Topic 606, Revenue from Contracts with Customers. Read the primary source
- Financial Accounting Standards Board, Accounting Standards Codification Topic 842, Leases. Read the primary source
- Financial Accounting Standards Board, Accounting Standards Codification Topic 350, Intangibles, Goodwill and Other. Read the primary source
- US Securities and Exchange Commission, Regulation S-X. Read the primary source
- National Institute of Standards and Technology, Cybersecurity Framework 2.0. Read the primary source
- Open Compute Project, Cooling Environments, Cold Plate resources. Read the primary source
- Open Compute Project and ASHRAE, alliance on data-centre liquid-cooling standards and practices, 13 October 2025. Read the primary source
- Schneider Electric, liquid-cooling portfolio with Motivair, 29 September 2025. Read the primary source
- Schneider Electric, Q1 2025 revenue presentation, completion of Motivair acquisition. Read the primary source
- US Department of Energy, Data Centers and Servers. Read the primary source
- US Environmental Protection Agency, Water Reuse for Industrial Applications Resources. Read the primary source
