

1. Define synergy as a verified change in economics
A logistics acquisition creates value when the combined business can serve customers, deploy assets, purchase inputs and manage cash more effectively than the businesses could have done separately. The relevant comparison is therefore the combined result against a credible standalone counterfactual. A budget variance alone cannot establish synergy because market prices, volume, fuel, labour, weather, regulation, customer mix and management action can change after completion.
The board should distinguish five evidence states. Gross opportunity is an analytical hypothesis before full operational challenge. Approved plan is an initiative whose baseline, owner, cost, timing, dependencies and controls have been accepted. Validated run-rate is the recurring economic effect supported by current operating evidence. Accounting result is the amount recognised under the applicable reporting framework. Realised cash is the amount visible in receipts, payments and financing balances after working-capital and implementation effects. These states should never be added together.
The ledger gives every initiative a permanent identity and a controlled history. It records the baseline period, transaction perimeter, counterfactual, formula, data owner, initiative owner, finance reviewer, first irreversible action, customer and workforce risks, capital requirement, one-off cost, expected benefit, cash timing, evidence, approvals, changes and reversals. An initiative remains an opportunity until its gates are satisfied.
This discipline matters because logistics benefits interact. Consolidating two routes may increase vehicle fill while reducing delivery reliability. Negotiating a fuel discount can create a volume commitment that limits later fleet electrification. Closing a depot can remove rent but require additional vehicles, driver hours and inventory. The ledger keeps these effects in one net value record instead of allowing separate teams to claim benefits and leave costs elsewhere.
Table 1. Evidence states in a logistics synergy ledger
| Evidence state | Required support | Permitted board use | Principal control |
|---|---|---|---|
| gross opportunity | initial route, fleet, supplier or overhead analysis | prioritise diligence and design work | disclose assumptions and confidence |
| approved plan | frozen baseline, counterfactual, owner, cost, timing and safeguards | release planning capacity and conditional budget | finance and operating approval |
| validated run-rate | repeated operating evidence after implementation | assess recurring economic effect | normalise volume, price and external factors |
| accounting result | ledger entries and policy conclusion | statutory and management reporting | reconcile to general ledger and disclosures |
| realised cash | bank, receivable, payable, debt and working-capital evidence | assess liquidity and debt reduction | reconcile timing, taxes and implementation cash |
The states are management-control categories. Accounting recognition follows the applicable reporting framework and transaction facts.
2. Freeze the transaction perimeter and baseline
The first task is to decide what has actually been acquired and what will be measured. Legal entities, customer contracts, operating branches, leased assets, subcontractor arrangements, shared services and data environments can enter the deal perimeter on different dates. A synergy baseline that mixes continuing, excluded and transitional activities will produce false comparisons.
The baseline should cover at least twelve months and, for seasonal networks, a period long enough to explain peak and trough behaviour. It should reconcile shipment or job records to invoices, recognised revenue, direct cost, asset registers, fuel and maintenance systems, payroll, supplier invoices, depot records and cash. Volume should be segmented by origin, destination, service promise, commodity or handling requirement, vehicle class, customer, price, margin and collection profile.
Data quality must be measured before modelling. The UK Government Data Quality Framework identifies completeness, uniqueness, consistency, timeliness, validity and accuracy as distinct dimensions.[7] Applied to logistics, completeness asks whether all movements and costs are present; uniqueness tests duplicate loads or suppliers; consistency reconciles transport-management, finance and telematics records; timeliness tests whether events are posted promptly; validity tests formats and allowed ranges; accuracy compares records with operational reality.
The counterfactual should state how each business was expected to perform without the acquisition. It can use board-approved standalone forecasts adjusted for evidence obtained during diligence, with separate scenarios for volume, price, labour, fuel and capital. Management should preserve the original counterfactual and record later changes rather than overwriting it. This protects the value bridge from hindsight.
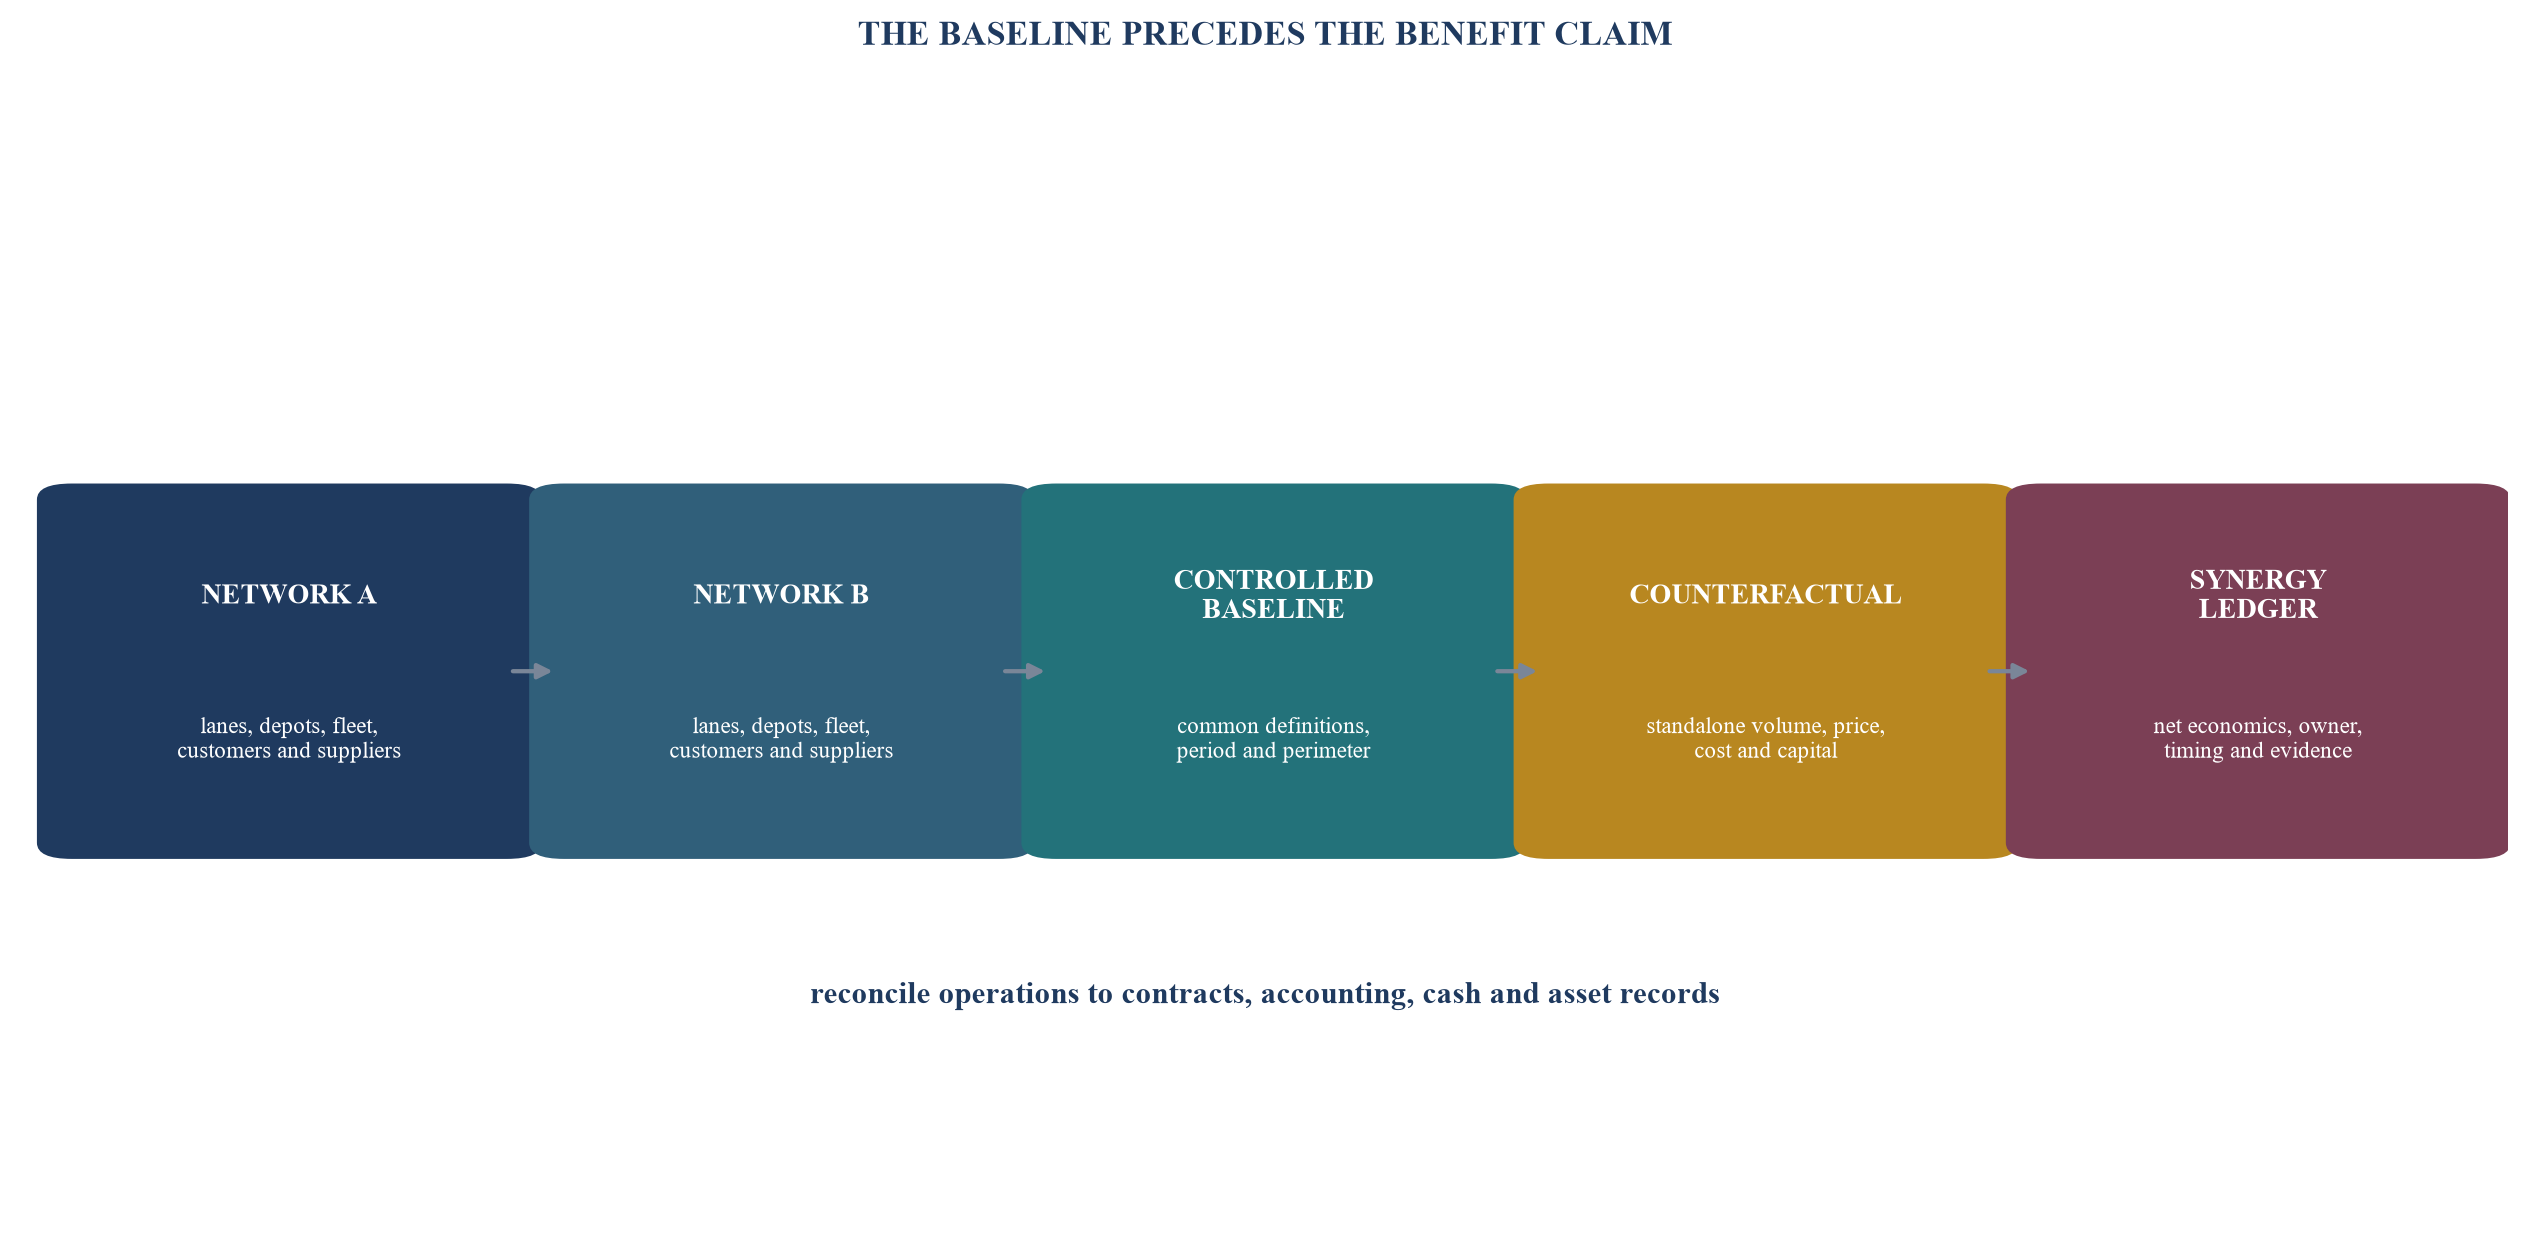
The diagram shows the evidence layers that must be reconciled before route, fleet or procurement benefits are approved.
3. Build a route-overlap map that respects service reality
Route synergy begins with a lane-level map. Each movement should have an origin, destination, collection and delivery window, distance, frequency, volume, weight or cube, handling requirement, vehicle class, customer commitment, revenue, direct cost and exception history. The US Bureau of Transportation Statistics' Freight Analysis Framework illustrates the analytical value of origin, destination, commodity and mode data at scale.[6] A company-level model needs more detailed operational records and contract terms.
Overlap has several forms. Exact overlap occurs when both businesses serve materially the same lane with compatible vehicles and windows. Directional overlap occurs when outbound movements in one network can pair with return movements in the other. Temporal overlap exists when schedules can be coordinated. Node overlap exists when depots, cross-docks or ports serve similar catchments. Customer overlap can support consolidated collections or delivery rounds. Each form creates a different initiative and evidence requirement.
Distance alone cannot determine consolidation. A route may carry dangerous goods, temperature-controlled products, high-value cargo or customer-specific equipment. Cabotage, driver hours, permits, axle limits, customs, security, insurance, trade sanctions and labour rules can constrain alternatives. Customer contracts may require dedicated vehicles, specific depots, fixed collection times or subcontractor approval. The route team should record each hard constraint before an optimisation model is allowed to recommend change.
The design objective should combine cost, service, resilience and capital. A route that is marginally cheaper but vulnerable to a single border, depot or supplier can reduce enterprise resilience. The World Bank's logistics work treats reliability alongside speed and connectivity.[5] Management should therefore measure on-time collection, on-time delivery, damage, temperature or handling compliance, missed slots, dwell, claims, complaints and recovery time as well as kilometres and cost.
Table 2. Route-overlap decision record
| Field | Evidence | Decision question | Failure signal |
|---|---|---|---|
| origin, destination and nodes | geocoded jobs and depot records | where is physical overlap real? | aggregated zones conceal detours or restrictions |
| service window | contract, order and delivery evidence | can movements share a schedule? | missed slots or extended dwell |
| capacity requirement | weight, cube, pallets and handling | can the same asset serve both loads? | legal, safety or equipment incompatibility |
| revenue and direct cost | invoice, job costing and supplier records | does consolidation improve contribution? | savings offset by price, claims or subcontracting |
| customer and regulatory constraints | contracts, permits and specialist review | which constraints are mandatory? | model recommends an unlawful or unapproved route |
| resilience | disruption and recovery evidence | does the design retain practical alternatives? | a single node or carrier becomes critical |
Required fields should be adapted to the transport mode, jurisdiction, customer contract and safety regime.
4. Convert overlap into executable network initiatives
The route map becomes valuable when it produces specific initiatives. These can include paired backhauls, combined collection rounds, redesigned line-haul schedules, common cross-docks, direct shipment around a node, consolidated subcontractor capacity, revised customer cut-offs or a new depot catchment. Each initiative needs a before-and-after operating design and a measurable acceptance test.
A lane consolidation record should show affected jobs, current kilometres, proposed kilometres, loaded and empty distance, vehicle and driver hours, tolls, fuel or energy, subcontractor cost, handling, depot activity, service risk and additional technology or planning effort. Revenue effects should be included where the new service promise changes price, volume, retention or claims. The calculation should identify which variables are observed, contracted or assumed.
The board should avoid treating modelled kilometres as cash. Cash emerges only when schedules change, supplier or labour commitments change, vehicles are redeployed or disposed, fuel or energy consumption falls, and customer service remains within the agreed threshold. Some benefits improve capacity headroom rather than current profit. That headroom can support growth or resilience, while it should be kept separate from released cash until used.
Pilots provide stronger evidence than simultaneous network redesign. A pilot can test a representative set of lanes for several cycles, with predetermined service, safety, cost and workforce criteria. The result should be compared with both the baseline and contemporaneous control routes where practical. A failed pilot is useful evidence when it prevents a larger disruption.
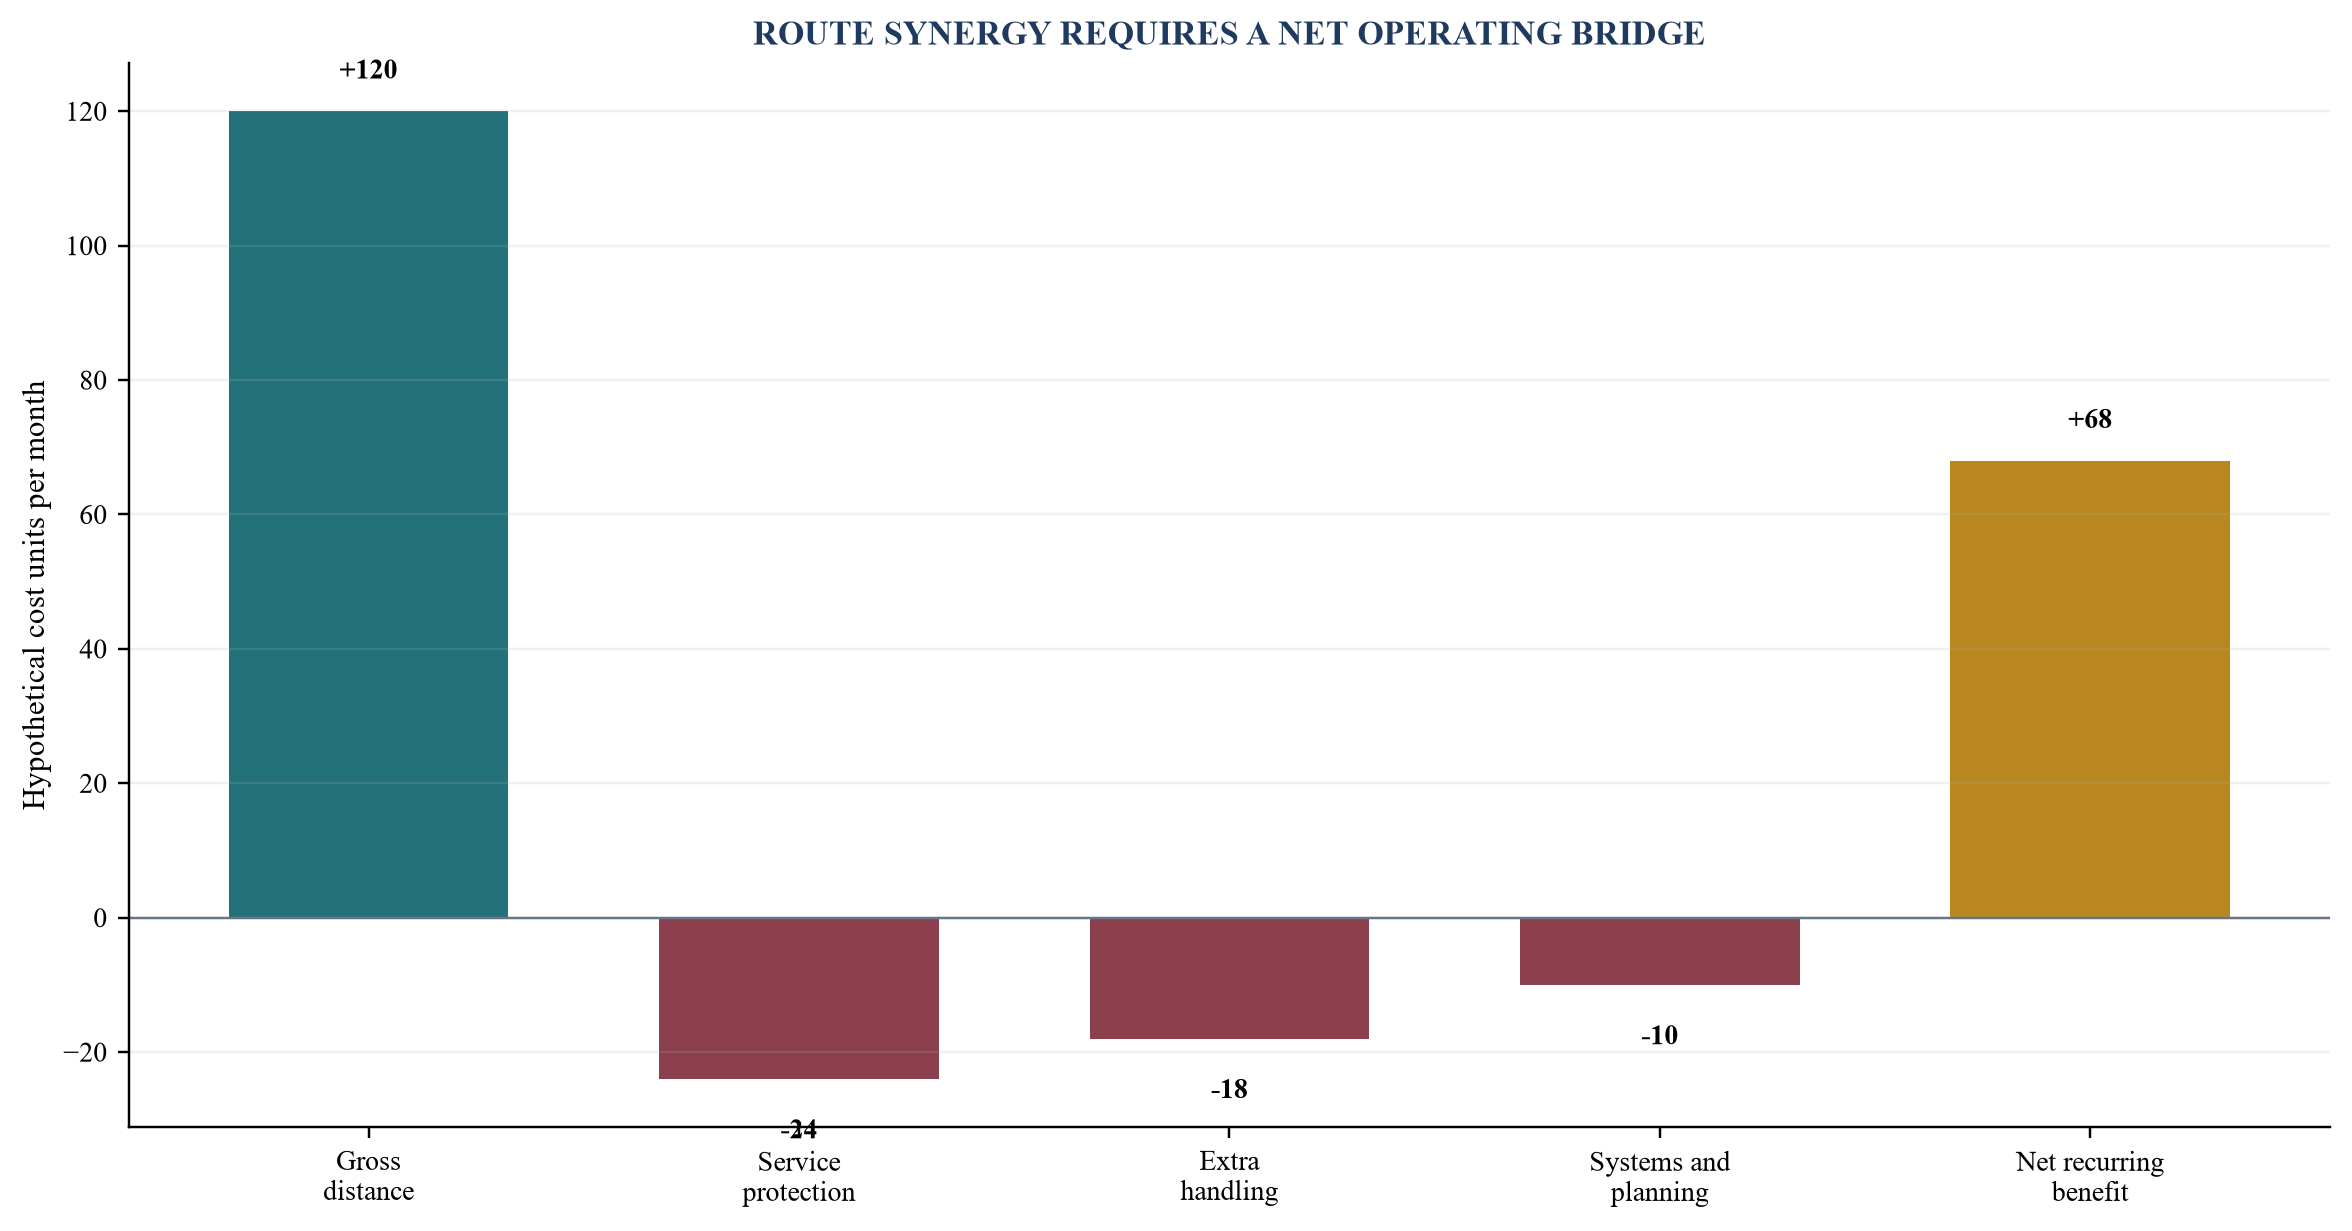
Values are hypothetical modelling assumptions in cost units per month and demonstrate the bridge from gross distance opportunity to net recurring benefit.
5. Measure fleet productivity through a capacity ladder
Fleet utilisation is frequently expressed as one percentage, although several different capacities are involved. Theoretical capacity is the maximum physical capacity of the fleet. Available capacity removes assets that are legally or mechanically unavailable. Scheduled capacity reflects the operating plan. Dispatched capacity reflects movements actually started. Loaded capacity measures productive payload or space. Paid capacity measures customer-billed work. Collected capacity measures the economic activity that has converted into cash.
Each step has a different owner and remedy. Maintenance can improve availability. Network planning can improve schedules. Dispatch can reduce cancellations and empty repositioning. Sales and customer operations can improve demand and mix. Billing and collections can improve conversion into cash. A combined fleet can show higher loaded utilisation while collected contribution deteriorates if price, claims, waiting time or payment terms weaken.
The integration team should segment vehicles by capability, age, ownership, lease terms, emissions standard, jurisdiction, maintenance profile, telematics, driver requirement and resale value. Vehicle counts alone obscure incompatibility. A refrigerated trailer cannot substitute freely for a dry-van movement; an urban electric vehicle may not serve a long-haul duty cycle; and a leased asset can carry termination or mileage obligations.
Fleet decisions should separate operational productivity from asset strategy. The company can redeploy, resize, refinance, dispose, extend, convert or replace assets. Each route should show capital expenditure, lease effects, tax, maintenance, residual value, charging or fuelling infrastructure, downtime and implementation risk. Finance should avoid claiming both a cost reduction and an asset-sale benefit when the same capacity is needed for growth.
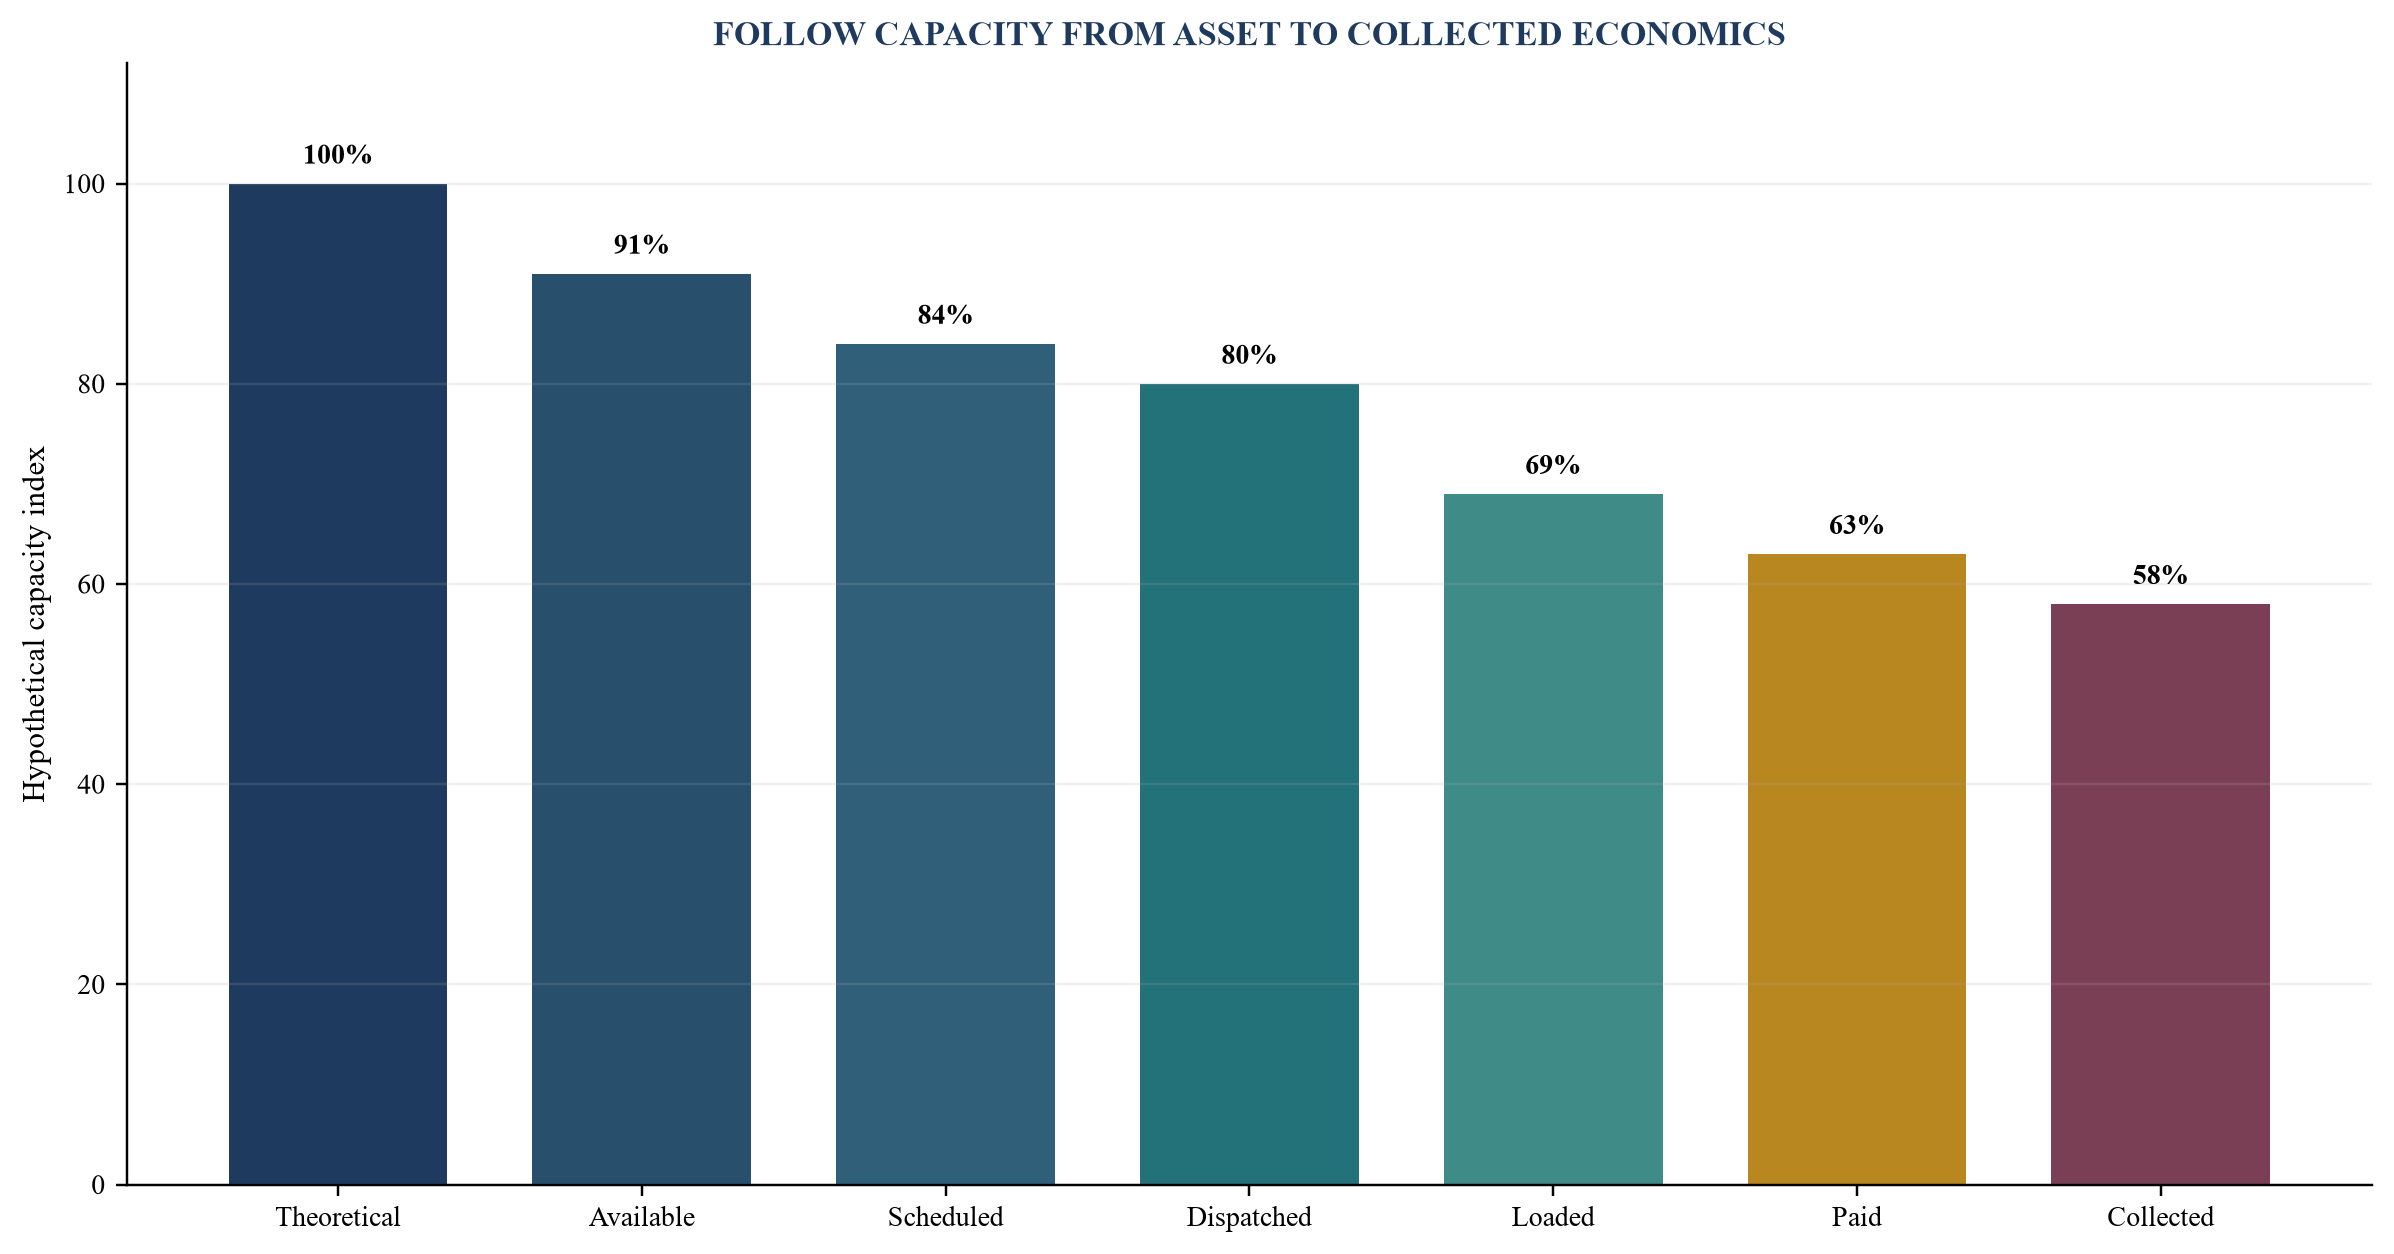
Hypothetical percentages show why one utilisation ratio can conceal the point at which capacity and value are lost.
6. Treat depots and line-haul as one network
Depot consolidation can create rent, labour, utilities, handling and management savings. It can also increase stem mileage, congestion, inventory, damage, cut-off pressure and customer distance. A property saving should therefore be modelled with the line-haul and last-mile consequences in the same initiative.
The depot model should include catchment, inbound and outbound flows, dock and yard capacity, operating hours, labour availability, automation, permits, environmental obligations, lease terms, landlord consents, security, maintenance, inventory, customs status and business continuity. Peak-hour capacity matters more than average throughput. A network with adequate annual capacity can fail on a small number of critical days.
Shared locations can create new operating options before a permanent closure. The businesses can cross-utilise yards, maintenance facilities, charging infrastructure, customs expertise or overflow capacity while customer and labour transitions are tested. Temporary dual running has a cost and can reduce execution risk. The ledger should show the approved transition period and the evidence required before exit.
Property, asset and workforce decisions often have long lead times. Lease break dates, redundancy consultation, relocation, systems integration and permitting can delay cash. The board should see a dated path from operational decision to contractual action, accounting treatment and cash release. An announced target date is not a realised benefit.
7. Build procurement synergy from addressable spend
Procurement synergy begins with a supplier and category cube reconciled to the general ledger, purchase orders, receipts, invoices, contracts, rebates, inventory and payment data. Categories can include fuel or energy, tyres, maintenance, vehicles, equipment, subcontracted transport, warehousing, packaging, technology, insurance, telecommunications and professional services. Spend should be mapped to legal entity, site, route, asset and operating owner.
Addressable spend is the portion that can realistically be influenced within the ownership horizon. It excludes taxes or regulated charges where appropriate, pass-through items that cannot be retained, committed contracts without an economic exit, constrained suppliers, and volume that will disappear under the network plan. A weighted average price difference across two businesses is only a diagnostic. Specification, service level, delivery location, quality, currency, indexation, credit terms and rebates must be normalised.
Procurement waves should follow operational criticality and contract timing. Low-risk common supplies may enter an early wave. Fuel, maintenance, tyres, insurance and strategic subcontractors require operational and safety challenge. Vehicles, automation and technology can change the network design and capital plan. Each wave should include demand management, specification challenge, make-or-buy analysis, supplier competition, negotiation, contract control and compliance.
Savings should be measured through a price-volume-mix bridge. Contracted unit price is evidence of a commercial result; realised margin depends on actual compliant purchases, operating volume, mix, rebates, quality and service. Realised cash depends on payment timing, inventory, implementation costs and taxes. The ledger should capture supplier concentration and continuity risk alongside savings.
Table 3. Procurement synergy measurement chain
| Step | Measure | Evidence | Common leakage |
|---|---|---|---|
| spend baseline | normalised quantity, specification and total cost | ledger, purchase order, receipt, invoice and contract | duplicate suppliers, missing rebates or mixed specifications |
| addressable spend | spend open to change within the plan | expiry, termination, operating demand and constraints | gross spend treated as negotiable |
| sourced result | evaluated supplier offer and total-cost comparison | tender, negotiation record and risk assessment | headline price ignores service or transition cost |
| contracted result | signed price, volume, rebate, index and service terms | executed contract and authorised award | minimum volume or indexation dilutes saving |
| realised margin | actual compliant quantity at controlled total cost | receipt, usage, quality, claims and finance records | off-contract buying, mix shift or quality failure |
| realised cash | payment and working-capital effect after implementation | payable, bank, inventory and tax records | longer inventory cycle or front-loaded implementation cash |
Each step requires evidence before the initiative advances to the next benefit state.
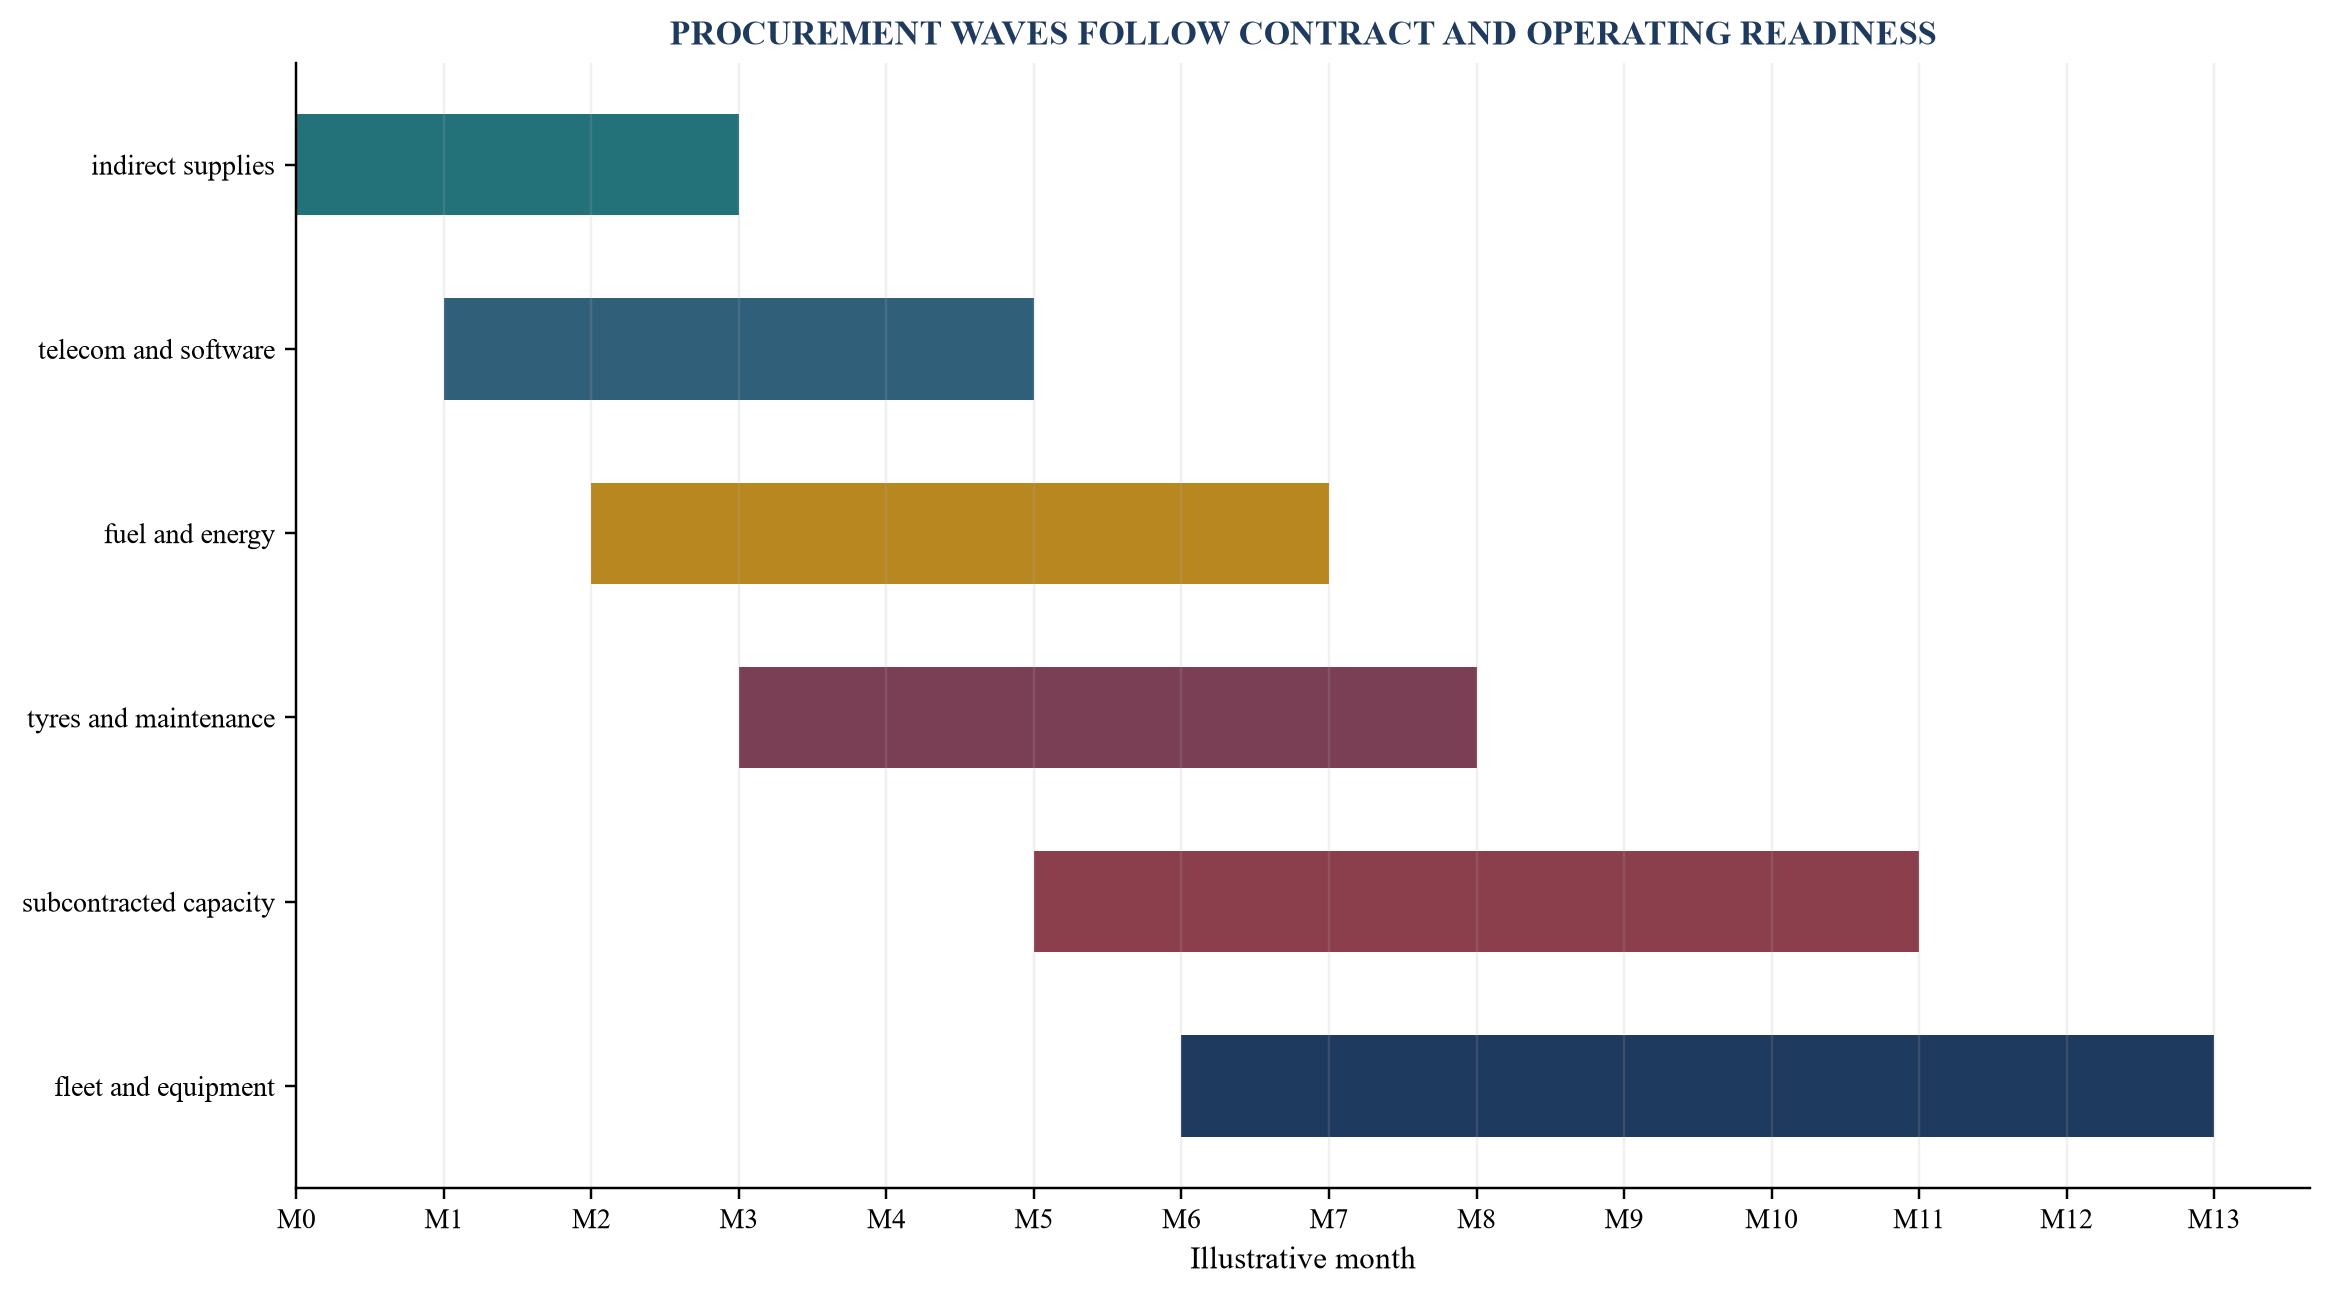
The plan shows sequencing by readiness and operational risk; actual category timing depends on contracts, regulation and operating requirements.
8. Protect customers, safety and workforce continuity
Service protection is an economic control. Customer attrition, claims, penalties and emergency subcontracting can remove the apparent benefit of a network change. Every material initiative should identify affected customers, contractual commitments, communication, acceptance, contingency and monitoring. High-concentration accounts deserve explicit executive ownership.
The customer baseline should include on-time performance, claims, complaints, net revenue, contribution, payment terms, concentration and contract renewal. A route or depot pilot should define thresholds for each relevant measure and the authority to pause or reverse. Customer communication should state operational facts and responsibilities without promising outcomes that have not been tested.
Safety, licensing and labour requirements are mandatory gates. Management should identify applicable driver hours, vehicle standards, dangerous-goods rules, customs authorisations, environmental permits, workplace consultation, union or employee representation, transfer rules, data protection and local employment law. Qualified advisers and accountable executives should confirm each jurisdiction-specific conclusion.
Workforce design should preserve operating knowledge. Dispatchers, drivers, warehouse teams, mechanics and customer-service staff often hold route and exception knowledge that systems do not capture. The integration plan should map critical roles, decision rights, retention risk, training, consultation, transfer, succession and handover. Headcount reduction should not be recorded as a benefit before the operating model, legal process, cost and service effect are approved.
9. Put one-off cost, dis-synergy and capital in the ledger
Gross benefits become investable only after implementation economics are visible. One-off costs can include advisers, systems, data remediation, integration teams, duplicate facilities, lease termination, asset impairment, relocation, severance, training, branding, contract termination, customer concessions and contingency. Capital can include vehicles, charging infrastructure, depot modifications, automation, cyber controls and integration interfaces.
Dis-synergies should receive the same discipline as benefits. They can include lost revenue, reduced price, lower capacity during transition, extra distance, dual running, supplier disruption, claims, higher inventory, employee attrition and management distraction. The ledger should show gross benefit, gross dis-synergy, one-off operating cost, capital expenditure, working-capital effect, tax and net cash by period.
Accounting boundaries require transaction-specific analysis. IFRS 3 establishes principles for recognising and measuring acquired assets, assumed liabilities, goodwill and consideration, and generally requires acquisition-related costs to be expensed as incurred apart from specified issuing costs.[1] IAS 37 states that a restructuring provision includes only direct expenditures necessarily entailed by the restructuring and not associated with ongoing activities; retraining, relocating continuing staff, marketing and investment in new systems or distribution networks are excluded from that provision.[2]
IAS 36 requires assets to be carried at no more than recoverable amount and applies to cash-generating units, including those containing goodwill.[3] A weak or delayed synergy case can therefore affect impairment analysis, although the impairment test follows the standard and the entity's facts. Management should maintain a controlled bridge between transaction valuation assumptions, integration initiatives, accounting judgements, board reporting and later impairment evidence.
Table 4. Net value bridge for one logistics initiative
| Component | Year 1 cash | Year 2 cash | Recurring run-rate | Evidence owner |
|---|---|---|---|---|
| route and empty-distance reduction | 42 | 72 | 72 | network operations |
| fleet maintenance and availability | 10 | 18 | 18 | fleet director |
| procurement price and specification | 20 | 36 | 36 | procurement and finance |
| customer and service protection | -8 | -4 | -4 | commercial operations |
| dual running and systems | -34 | -8 | 0 | integration office |
| capital expenditure | -28 | -6 | 0 | CFO and operations |
| working-capital effect | -6 | 5 | 0 | treasury and finance |
| net cash effect | -4 | 113 | 122 | finance controller |
Values and timing are hypothetical modelling assumptions expressed in cost units.
10. Connect technology, AI and data to controlled decisions
Transport-management systems, warehouse-management systems, telematics, enterprise resource planning, customer portals, supplier systems and spreadsheets often hold different versions of a shipment. Integration should establish common identifiers for orders, loads, routes, vehicles, drivers, depots, suppliers, invoices and payments. Without common identity and reconciliation, automated dashboards can accelerate inconsistent claims.
Optimisation and machine-learning tools can support routing, demand forecasting, arrival prediction, maintenance, pricing, supplier analysis and anomaly detection. Their use should begin with a defined decision and a baseline for comparison. Inputs, constraints, objective functions, training period, exclusions, overrides and performance should be recorded. Safety, legal, contractual and customer constraints should remain explicit rather than hidden inside a score.
A digital twin can test network alternatives before physical change. Its value depends on whether the model reproduces observed behaviour across normal, peak and disrupted periods. Validation should include back-testing, sensitivity, edge cases and operator review. Recommendations should show which constraints bind and why the result changes. Management remains responsible for the decision.
Access, cyber and continuity require integration controls. The combined business should inventory interfaces, credentials, privileged roles, devices, data transfers, third parties, recovery procedures and incident obligations. A route or fleet initiative should not advance when the required system and fallback control are untested. The COSO framework's components of control environment, risk assessment, control activities, information and communication, and monitoring provide a useful governance architecture.[8]
11. Govern the first 100 days through evidence gates
The first 100 days should separate continuity from structural change. Day One establishes lawful authority, cash and payment control, customer and supplier communication, system access, safety responsibilities, critical staffing, incident response and decision escalation. Network, depot, fleet and supplier changes then proceed through evidence gates suited to their risk.
The integration office should maintain one route and synergy issue register. Each finding should route to price, contract protection, Day-One control, initiative design, budget, customer action, accounting conclusion or the decision to stop. Parallel registers allow assumptions to disappear between diligence, integration and finance.
A weekly logistics value review should examine service deviations, safety, customer risk, route and fleet pilots, supplier awards, systems, workforce, one-off cost, capital, working capital and benefit evidence. The meeting should decide exceptions that require enterprise authority. Workstream updates can be handled beforehand.
The board or investment committee should receive a monthly net value bridge. It should compare the transaction case, approved plan, current forecast, validated run-rate, accounting result and realised cash. Changes should identify source, owner, reason, approval and effect. A strong governance process permits benefits to be reduced or reversed when evidence changes.
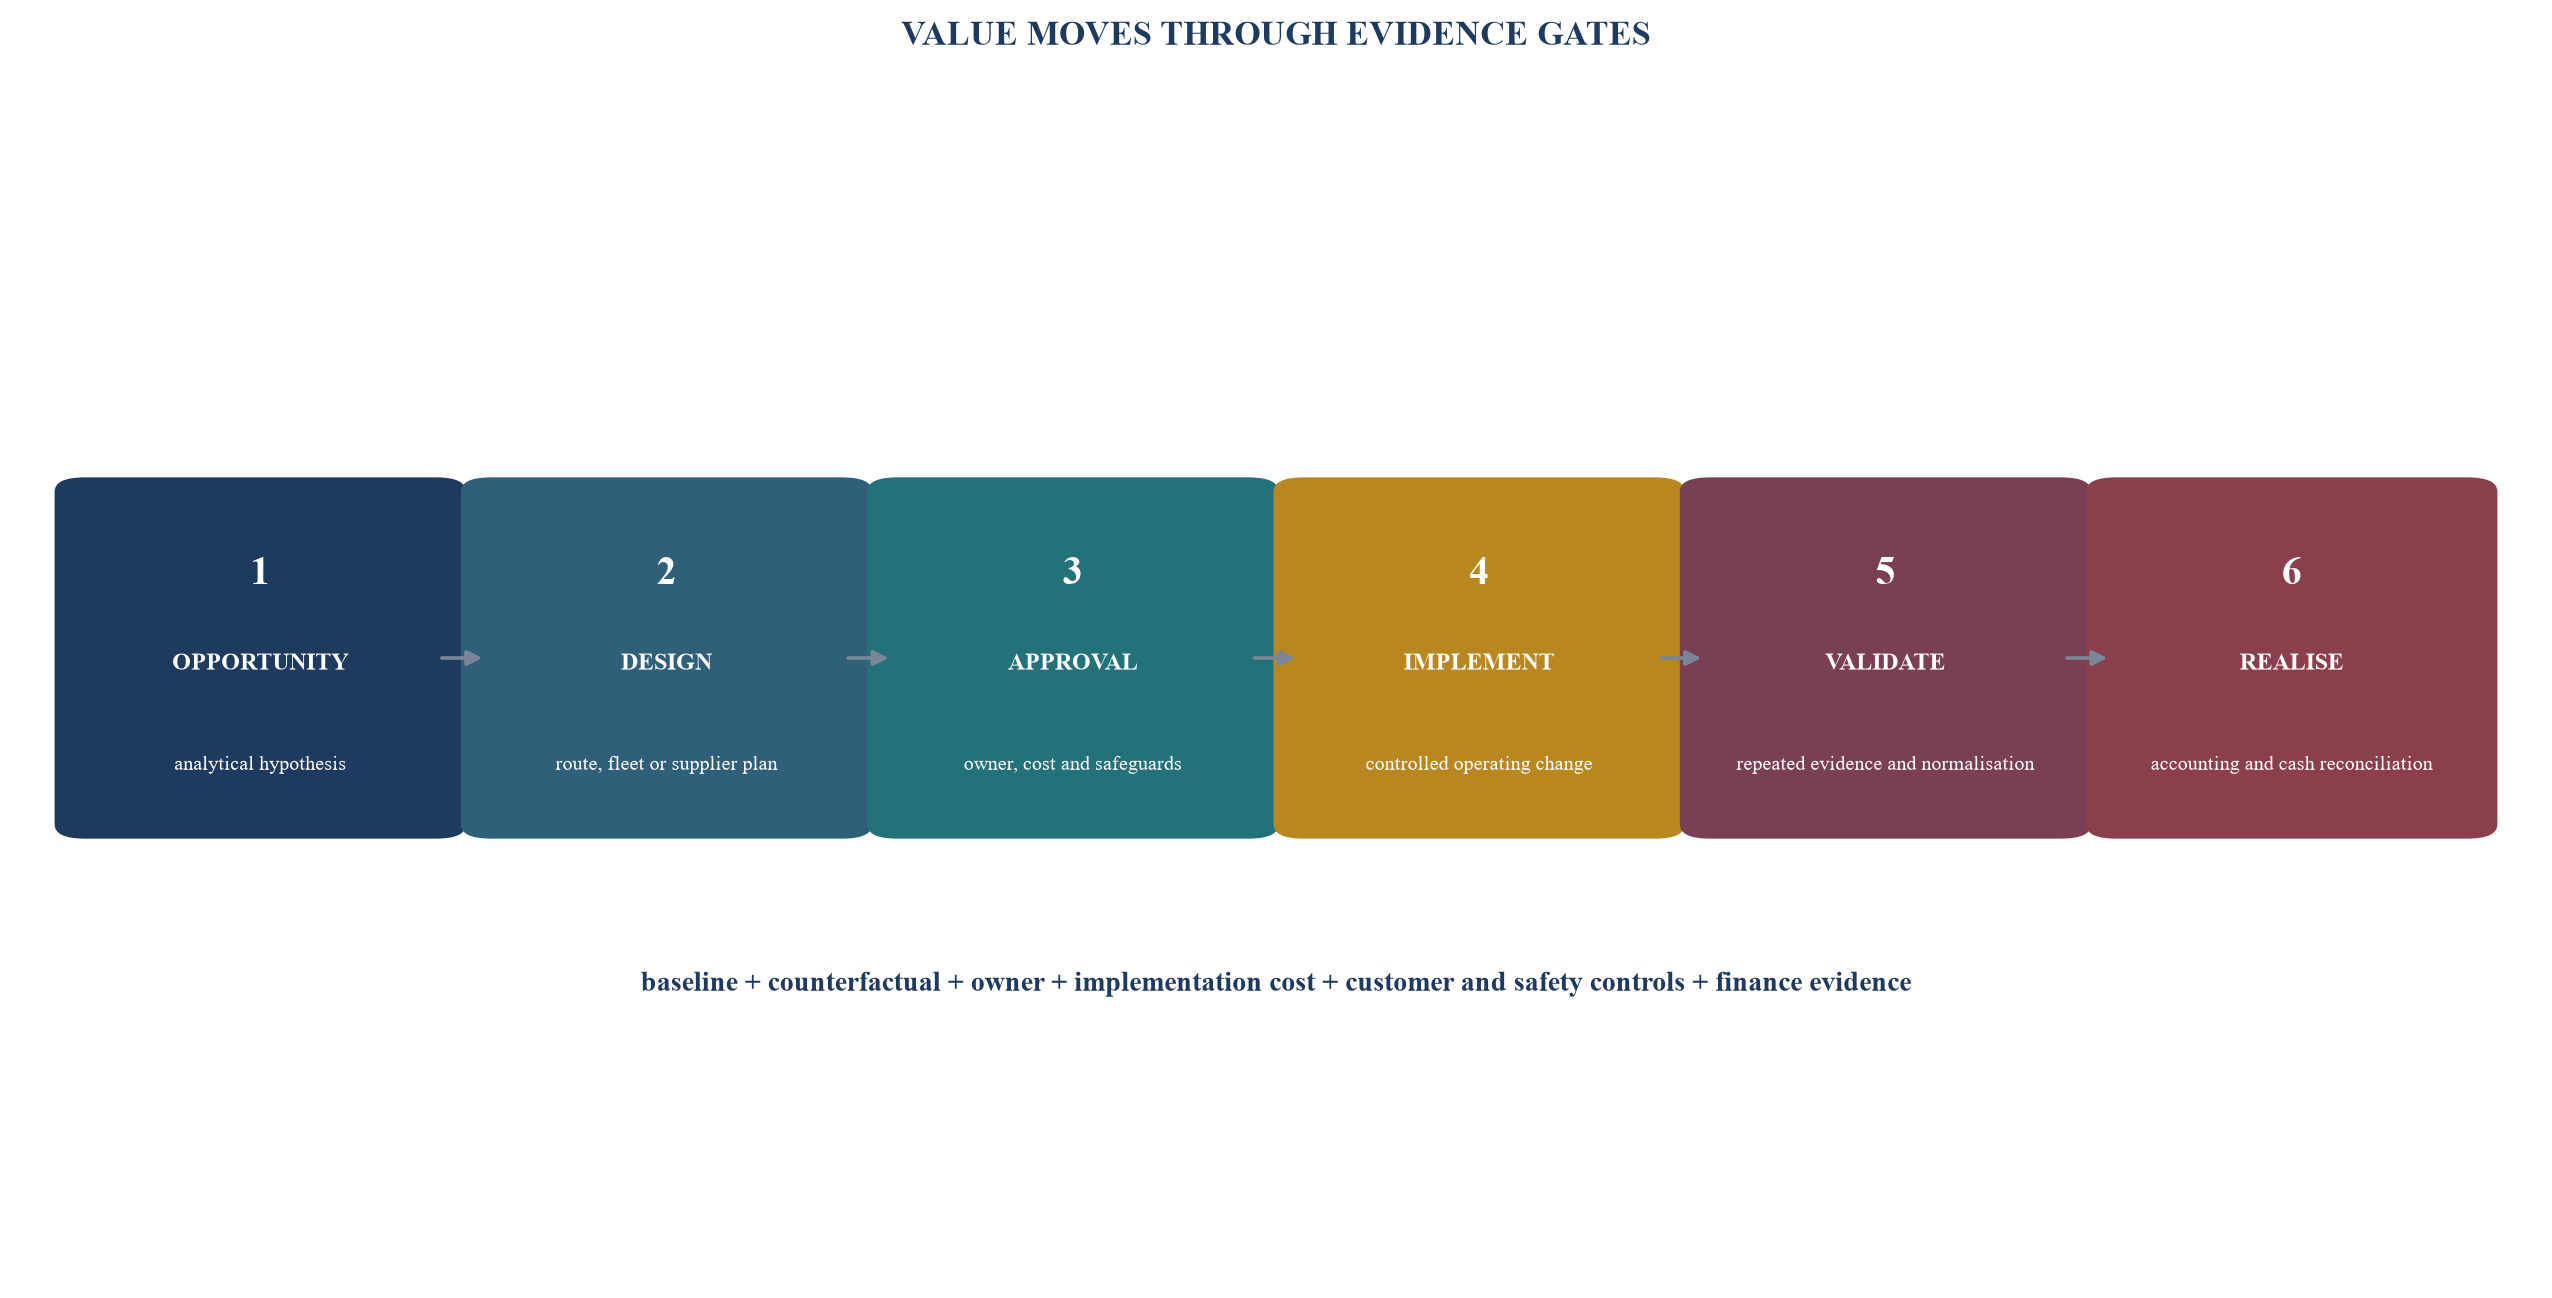
Each initiative moves through controlled gates; the status can move backwards when evidence fails or assumptions change.
Table 5. First-100-day logistics value programme
| Period | Principal work | Acceptance evidence | Board decision |
|---|---|---|---|
| pre-close planning | perimeter, baseline, constraints, critical customers, safety and Day-One controls | reconciled data and legal operating boundaries | approve continuity plan and delegated authority |
| Day 1 to 15 | establish control room, incident path, data access and no-regret diagnostics | authority, access, cash, service and safety tests | approve diagnostic priorities and pilot design |
| Day 16 to 35 | route, fleet, depot and supplier opportunity challenge | initiative records with net economics and safeguards | release pilot budget and capacity |
| Day 36 to 65 | run pilots, tender early waves and test systems | repeated operational, customer and finance evidence | approve, redesign or stop each initiative |
| Day 66 to 100 | scale accepted initiatives and lock benefit controls | signed contracts, schedules, control tests and reconciliations | approve scale plan, capital and ownership handover |
| after Day 100 | validate recurring result and cash; retain reversals | ledger, general ledger, bank and operational evidence | accept realised value or revise the deal bridge |
Timing is an illustrative management sequence; transaction facts, approvals and consultation can require a different timetable.
12. Report value without misleading labels
Synergy reporting often uses adjusted EBITDA and run-rate measures. These measures can support management decisions when their calculation, purpose and reconciliation are controlled. The SEC's guidance states that non-GAAP adjustments can be misleading when they remove normal recurring cash operating expenses, use inconsistent treatment between periods, change accounting recognition principles or carry unclear labels.[9] The specific regulatory requirements depend on the reporting entity and jurisdiction; the underlying discipline remains useful for private-company boards.
IFRS 18 requires disclosures for management-defined performance measures within its scope, including a clear description, calculation and reconciliation to the most directly comparable specified total or subtotal.[10] A logistics synergy dashboard should similarly define every management measure and reconcile it to controlled accounting and operating records. Run-rate benefit, annualised saving, cost avoided, capacity released and realised cash should remain separate.
Value creation should be linked to cash flow before applying a valuation multiple. A buyer can model the present value of recurring after-tax cash, implementation cost, capital, working capital, risk and timing. An exit-value bridge can then separate operating performance from leverage, market multiple movement, acquisitions and cash generation. The 2025 IPEV Valuation Guidelines frame fair value around market-participant assumptions and calibration, within their scope.[11]
The board should receive downside scenarios. Route consolidation can deliver only part of planned distance reduction; a depot exit can slip; customer attrition can increase; procurement compliance can be lower than contracted; fuel, labour or interest rates can move. Scenario triggers should identify decisions and funding requirements rather than provide a single optimistic range.
Table 6. Board dashboard for logistics synergy
| Dimension | Board measure | Reconciliation | Escalation example |
|---|---|---|---|
| service and safety | on-time delivery, claims, incidents and critical exceptions | jobs, customer records and incident systems | threshold breach on a pilot or key account |
| network | loaded and empty distance, dwell, node throughput and resilience | transport system, telematics and depot records | benefit depends on unapproved constraint removal |
| fleet | availability, scheduled, loaded, paid and collected capacity | asset, maintenance, job, invoice and cash data | utilisation rises while contribution declines |
| procurement | addressable, contracted, compliant and realised value | contracts, orders, receipts, invoices and payments | price saving offset by quality or inventory |
| economics | gross benefit, dis-synergy, cost, capital and working capital | initiative ledger to finance records | net present value or liquidity headroom falls below gate |
| evidence | status, owner, changes, validation and reversals | controlled synergy ledger and decision log | unsupported upgrade from opportunity to realised value |
Definitions and thresholds require approval for the transaction and reporting framework.
13. Apply the framework to a hypothetical acquisition
Consider a hypothetical buyer combining two regional road-logistics businesses. The businesses operate 180 vehicles across six depots, use a mixture of owned and subcontracted capacity, and serve industrial, retail and project customers. Their route records suggest overlapping trunk lanes, opposite-direction empty movement, duplicate fuel and tyre suppliers, and two depots within related catchments. These figures are modelling assumptions rather than observed market data.
The initial gross opportunity appears large. Management identifies 120 cost units per month from route and empty-distance reduction, 45 from fleet and maintenance, 60 from procurement and 25 from overhead. The integration office challenges the claim against service windows, vehicle compatibility, depot capacity, labour, customer requirements and contractual timing. It removes ineligible spend, records dual running and systems cost, and separates capacity headroom from cash.
Three route pilots demonstrate 68 units of recurring monthly benefit after service protection, handling and planning cost. Fleet analysis shows that twelve vehicles can be redeployed after peak testing, while six older assets need additional maintenance before any disposal decision. Procurement waves produce signed terms, followed by lower realised benefit because volumes shift toward specialist tyres and subcontracted capacity. The depot team delays one exit after peak modelling shows an unacceptable resilience risk.
The board receives a lower benefit than the original headline and a stronger evidence base. It can release investment selectively, protect liquidity and explain the path from premium paid to cash realised. The result illustrates the purpose of the ledger: disciplined conversion of a transaction thesis into operating choices, including decisions to delay or reject apparent savings.
14. Implementation principles
First, establish one source of truth for initiative identity, baseline, economics, owners and evidence. Operational systems remain sources for movements, assets and suppliers; the ledger controls the value claim and its history. Second, freeze definitions before reporting. Every unit, period, currency, perimeter and sign convention should be explicit.
Third, place customer, safety, workforce and regulatory gates beside the economics. A benefit cannot advance when a mandatory gate is unresolved. Fourth, give finance independent validation rights. Operating teams own delivery; finance owns the approved measurement method, accounting reconciliation and cash evidence. Fifth, preserve reversals. A benefit that later fails should reduce the bridge without deleting the earlier record.
Sixth, use technology to improve decisions and evidence. Models should expose assumptions, constraints and sensitivity. Seventh, manage time through contract and operating milestones rather than an undifferentiated annual target. Finally, keep the board focused on exceptions, decisions, cash and risk. Detailed activity reporting belongs in workstreams.
15. Limitations and further research
This framework does not determine the optimal network for a specific transaction. Freight modes, geographies, customer contracts, labour models, safety regimes, tax, permits, fleet technology, property, financing and accounting policies vary materially. Real analysis requires validated transaction data and qualified advice.
The worked examples use hypothetical modelling assumptions and do not estimate market-wide synergy. Benefits cannot be transferred from one acquisition to another without a fresh baseline and counterfactual. Historical route data can also understate latent demand, disruption and future regulation.
Further research can test how route and depot designs perform under extreme weather, border disruption, changing emissions rules and autonomous or electric fleets. It can also examine causal measurement methods for separating acquisition effects from market and management changes, and the governance of AI-assisted network decisions.
16. Conclusion
The logistics synergy ledger turns an acquisition promise into a controlled economic record. It begins with a reconciled perimeter and counterfactual, tests route overlap against service reality, follows fleet capacity from asset to collected value, measures procurement from addressable spend to cash, and records customer, safety, workforce, capital and working-capital consequences in the same initiative.
The board receives a traceable bridge from transaction thesis to operating evidence. That bridge can support faster decisions, disciplined investment and credible value reporting. Its strength comes from the willingness to reduce, delay or reverse claims when the evidence changes.
References
- IFRS Foundation. IFRS 3 Business Combinations. Official standard page and issued requirements. https://www.ifrs.org/issued-standards/list-of-standards/ifrs-3-business-combinations/
- IFRS Foundation. IAS 37 Provisions, Contingent Liabilities and Contingent Assets. Issued requirements, including restructuring provisions. https://www.ifrs.org/content/dam/ifrs/publications/pdf-standards/english/2021/issued/part-a/ias-37-provisions-contingent-liabilities-and-contingent-assets.pdf
- IFRS Foundation. IAS 36 Impairment of Assets. Official standard page. https://www.ifrs.org/issued-standards/list-of-standards/ias-36-impairment-of-assets/
- UK Competition and Markets Authority. Merger Assessment Guidelines, updated 3 June 2026. https://www.gov.uk/government/publications/merger-assessment-guidelines/merger-assessment-guidelines-html-version
- World Bank. Logistics Performance Indicators 2.0 and Connecting to Compete 2023. https://lpi.worldbank.org/en/about and https://lpi.worldbank.org/sites/default/files/2023-04/LPI_2023_report_with_layout.pdf
- US Bureau of Transportation Statistics. Freight Analysis Framework Version 5. https://www.bts.gov/faf/faf5
- UK Government Data Quality Hub. The Government Data Quality Framework. https://www.gov.uk/government/publications/the-government-data-quality-framework/the-government-data-quality-framework
- Committee of Sponsoring Organizations of the Treadway Commission. Internal Control; Integrated Framework, 2013 executive summary. https://www.coso.org/_files/ugd/3059fc_ada7bcee03a2437c9bf7f46948da818d.pdf
- US Securities and Exchange Commission. Non-GAAP Financial Measures Compliance and Disclosure Interpretations, updated 13 December 2022. https://www.sec.gov/rules-regulations/staff-guidance/corporation-finance-interpretations/non-gaap-financial-measures
- IFRS Foundation. IFRS 18 Presentation and Disclosure in Financial Statements, 2026 issued requirements, paragraphs 121 to 124. https://www.ifrs.org/content/dam/ifrs/publications/pdf-standards/english/2026/issued/part-a/ifrs-18-presentation-and-disclosure-in-financial-statements.pdf
- International Private Equity and Venture Capital Valuation Board. IPEV Valuation Guidelines 2025. https://www.privateequityvaluation.com/Valuation-Guidelines
Appendix A. Minimum Ledger Fields: . Initiative identity and scope
Each initiative should have a stable identifier, descriptive name, value category, affected entities, routes, depots, assets, suppliers, customers and systems. The record should state the baseline period, measurement unit, currency, perimeter, counterfactual and the source records used to reproduce the calculation. Any overlap with another initiative should be identified before approval.
. Economics and timing
The record should separate gross recurring benefit, recurring dis-synergy, one-off operating cost, capital expenditure, working-capital effect, tax and net cash by period. It should show the first operational change, first validated result, full run-rate date and cash-realisation date. Capacity released for growth or resilience should be stated separately from cost removed.
. Ownership and safeguards
The ledger should name the executive sponsor, operating owner, finance validator, data owner and decision authority. Customer, safety, workforce, legal, regulatory, cyber and business-continuity gates should identify the required evidence and the person authorised to accept it. A material unresolved gate should prevent the benefit from advancing.
. Evidence and change history
Every status change should retain its date, evidence, reviewer and decision. The record should preserve the approved case, current forecast, validated run-rate, accounting result, realised cash, changes and reversals. Source-system links, signed contracts, pilot results, general-ledger reconciliations and bank evidence should remain accessible under the organisation's retention and access policies.
