

1. Govern management incentives as an execution system
Equity participation creates an economic interest in an eventual ownership outcome. Execution requires a second layer: a controlled system that translates the value thesis into decisions people can make at the appropriate frequency. Without that translation, management may understand the prize yet remain uncertain about which customer, cash, capability or operating trade-off deserves priority this week.
The board should therefore treat incentive alignment as an operating system. The system connects five objects: the executed equity plan, the enterprise value bridge, the value-driver tree, accountable role scorecards and the weekly management cadence. Each object answers a different question. The plan defines rights and conditions. The value bridge explains how enterprise value may become equity value. The driver tree identifies operational causes. Scorecards assign controllable contributions. The cadence converts measures into decisions and follow-through.
The OECD states that executive remuneration should align with business strategy, governance, risk management and longer-term shareholder interests [1][2]. The UK Corporate Governance Code similarly connects executive remuneration with purpose, values, strategy and long-term sustainable success [6]. These principles become practical only when the board can trace an award outcome to performance evidence and can trace a weekly priority back to the approved strategy.
Three boundaries matter. Ownership economics are governed by plan documents and transaction outcomes. Annual variable compensation rewards performance over a defined period. Performance management governs role expectations, development and accountability. The three can share metrics, but they should not be collapsed into one instrument. A long-dated equity plan cannot replace clear weekly management. A weekly scorecard should not purport to amend vesting rights.
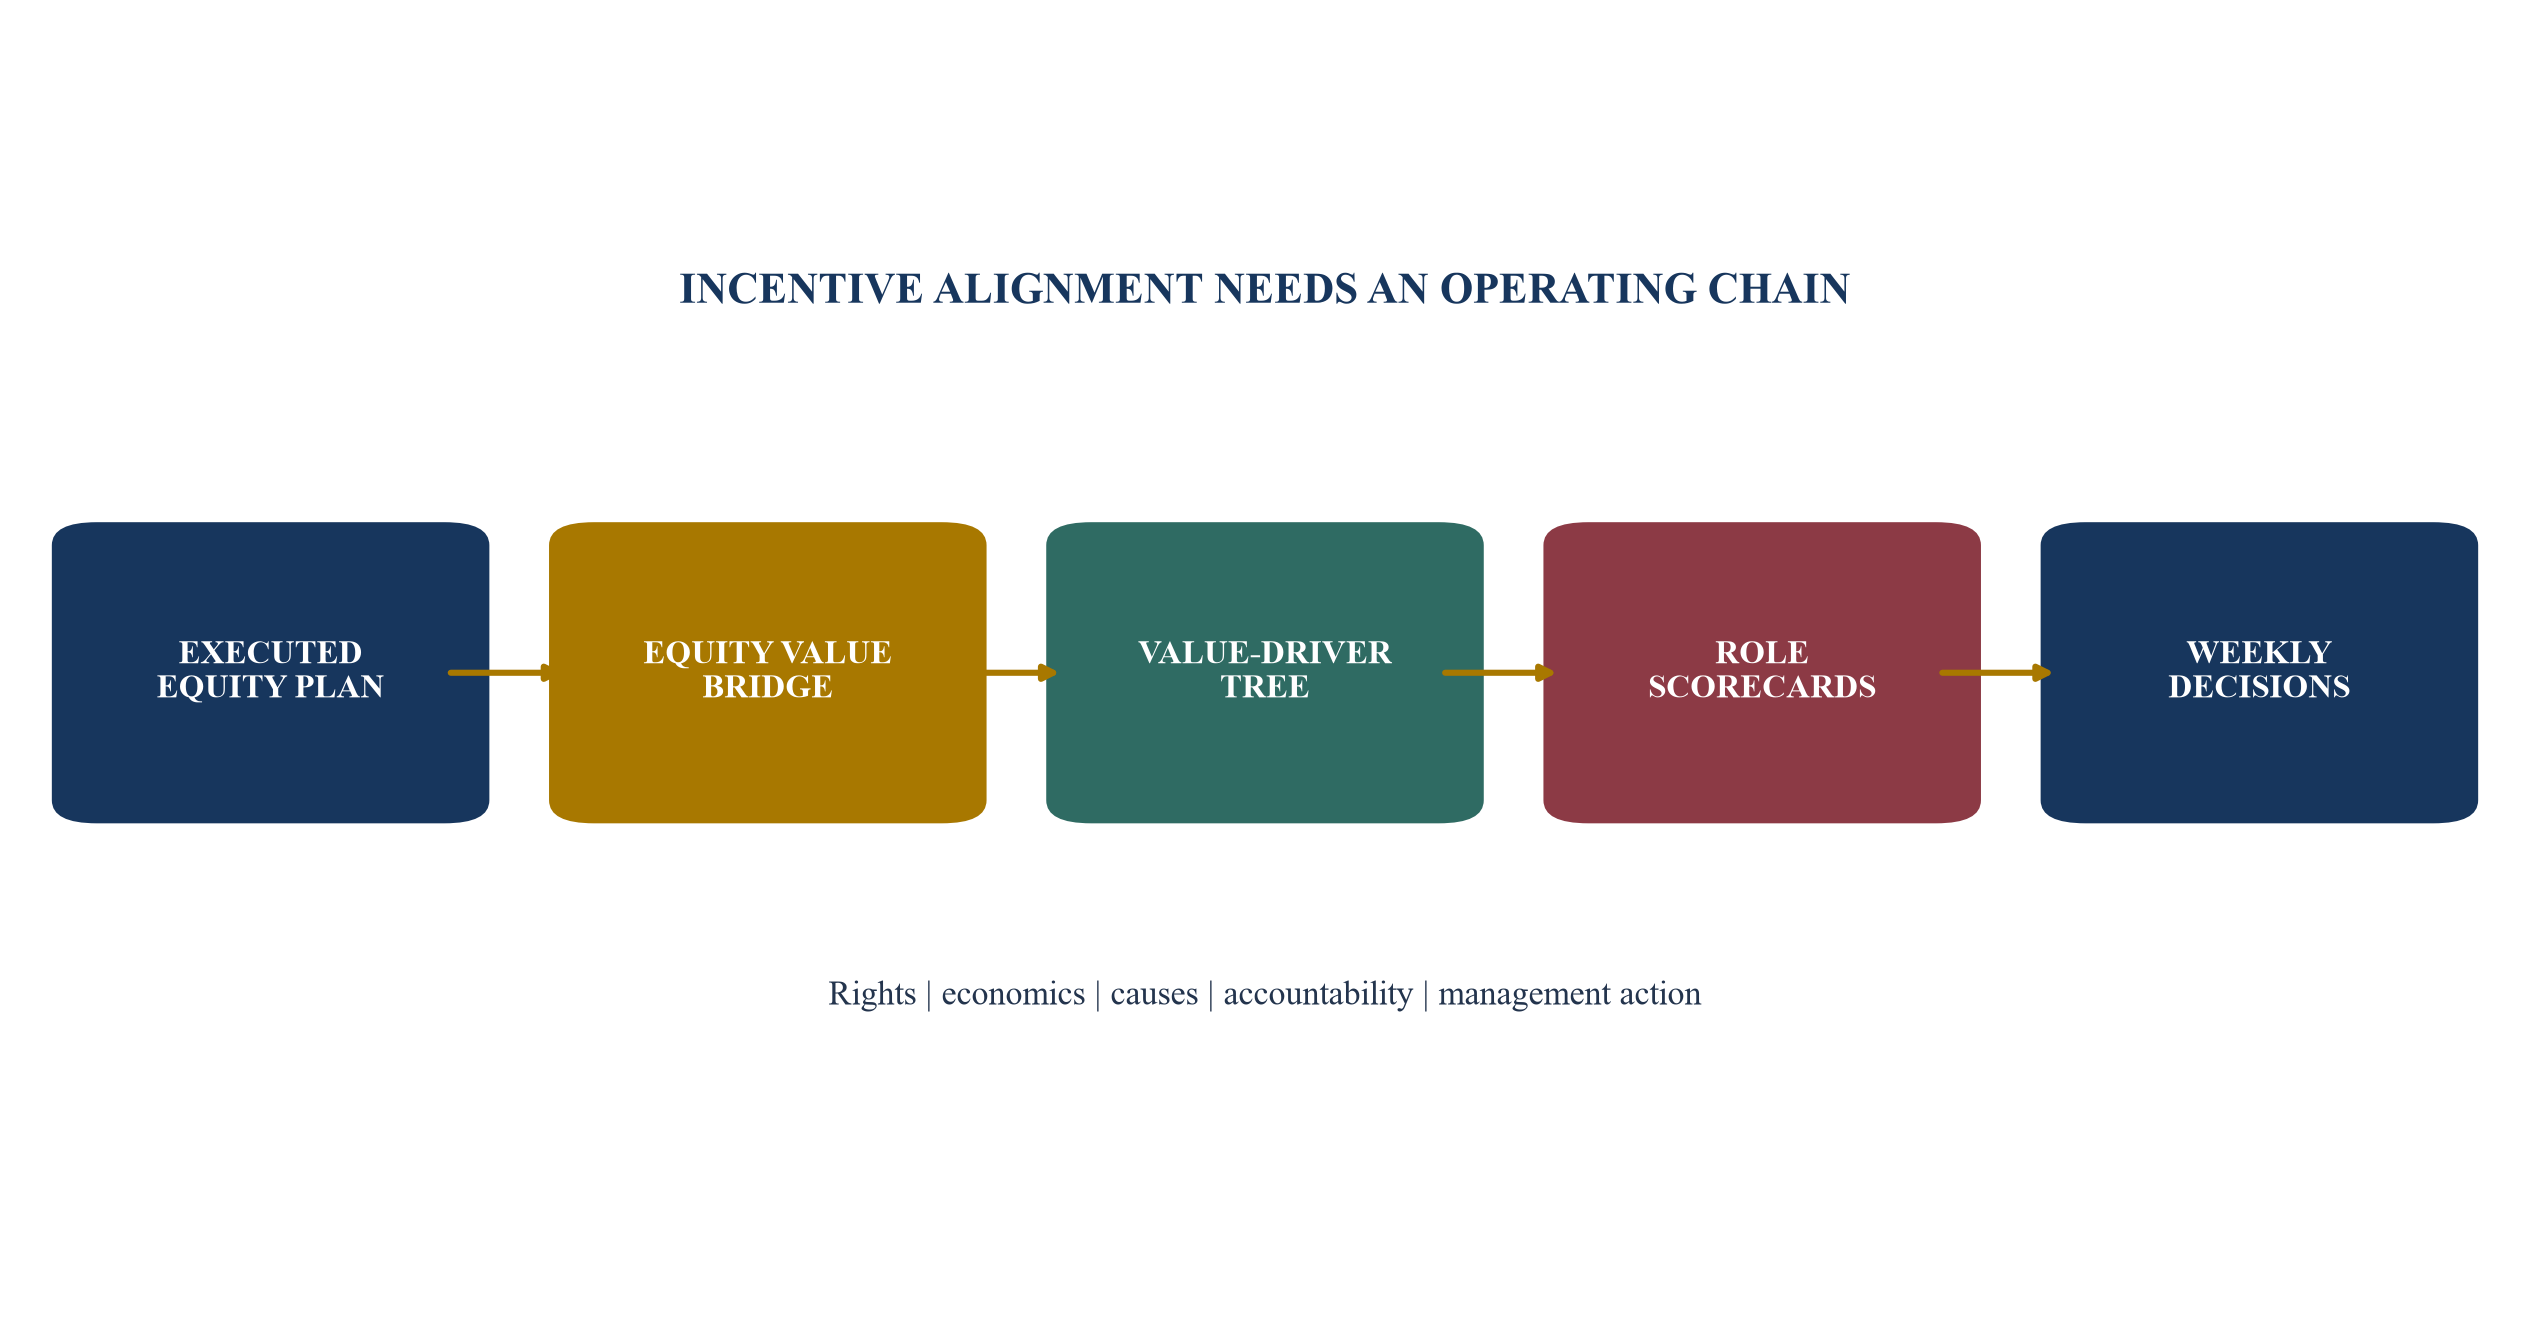
Each layer has a distinct purpose, owner, evidence set and decision frequency.
2. Start with the executed plan and participant perimeter
The authoritative starting point is the executed document set. It can include plan rules, individual award agreements, shareholder agreements, employment contracts, board and shareholder approvals, cap-table records, subscription documents, amendments, side letters, tax elections and transaction-specific terms. A presentation, recruiting discussion or spreadsheet model can assist understanding, but it should not replace executed rights.
The control file should identify each participant, employing entity, grant date, instrument, number or percentage, exercise or subscription price, vesting basis, performance conditions, hurdle, catch-up, dilution treatment, leaver provisions, change-of-control treatment and evidence of approval. It should also identify the governing law, dispute forum and advisers responsible for unresolved interpretation. Personal data and compensation information require access controls.
Plan language should be separated from management interpretation. Terms such as good leaver, bad leaver, cause, disability, retirement, performance condition, liquidity event and fair market value can have defined meanings. Management should not convert an informal commercial expectation into a legal entitlement. Any explanation given to participants should carry a version date and should state that executed documents govern.
The participant perimeter also determines whether an operating scorecard is appropriate. A chief executive can influence the enterprise portfolio. A functional leader may influence a narrower set of drivers. A manager deep in the organisation needs strong line of sight to controllable outcomes. The same equity instrument can sit beside different role scorecards without changing the instrument itself.
Table 1. Equity-plan and participant control inventory
| control object | authoritative evidence | operating use | accountable owner | review trigger | common failure |
|---|---|---|---|---|---|
| plan rules | executed plan and approvals | define instrument and conditions | company secretary and counsel | amendment or new grant | summary used instead of executed text |
| participant award | signed agreement and register | explain individual economics | HR and company secretary | joiner, role change or leaver | inconsistent side promises |
| capital structure | approved cap table and instruments | model dilution and value waterfall | CFO | financing, acquisition or conversion | stale fully diluted denominator |
| performance condition | award schedule and board record | determine vesting evidence | remuneration committee | target reset or measurement date | metric differs from legal wording |
| role scorecard | approved operating framework | assign weekly priorities | CEO and functional leader | strategy or role change | scorecard treated as plan amendment |
| communication | controlled participant statement | explain status and scenarios | HR, CFO and counsel | material change or annual refresh | projected value presented as entitlement |
The inventory keeps executed rights, commercial explanation and operating accountability distinct.
3. Build the equity value bridge before choosing metrics
An incentive framework should begin with the economics that shareholders and management are trying to influence. Enterprise value at exit may depend on sustainable earnings, growth, strategic position, resilience and the market's valuation of comparable risk. Equity value also depends on net debt, debt-like items, surplus cash, transaction adjustments, dilution and the distribution waterfall. An EBITDA-only plan can overlook cash, capital intensity, leverage and quality.
The value bridge should be explicit. Revenue growth can create value when it earns an adequate margin and converts to cash. Margin improvement can create value when it is sustainable and does not damage customers, people, safety or compliance. Working-capital release can increase equity value when it is structural rather than a temporary period-end movement. Capital expenditure can reduce near-term cash while building capacity or reducing future risk. Debt paydown can improve equity value even when the enterprise multiple is unchanged.
The board should distinguish controllable value creation from market movement. An exit multiple can rise because a sector rerates. Foreign exchange, interest rates and commodity prices can help or hurt results. Management should be accountable for the quality of response, not automatically rewarded or penalised for every external change. The framework can show reported outcome, constant-market outcome and management contribution separately.
The bridge should also make downside visible. A growth initiative can increase revenue and warranty exposure. A procurement saving can weaken supply resilience. A price increase can improve margin and accelerate churn. Each value lever needs its cost, cash requirement, risk and time to maturity. This creates the foundation for balanced metrics and board discretion.
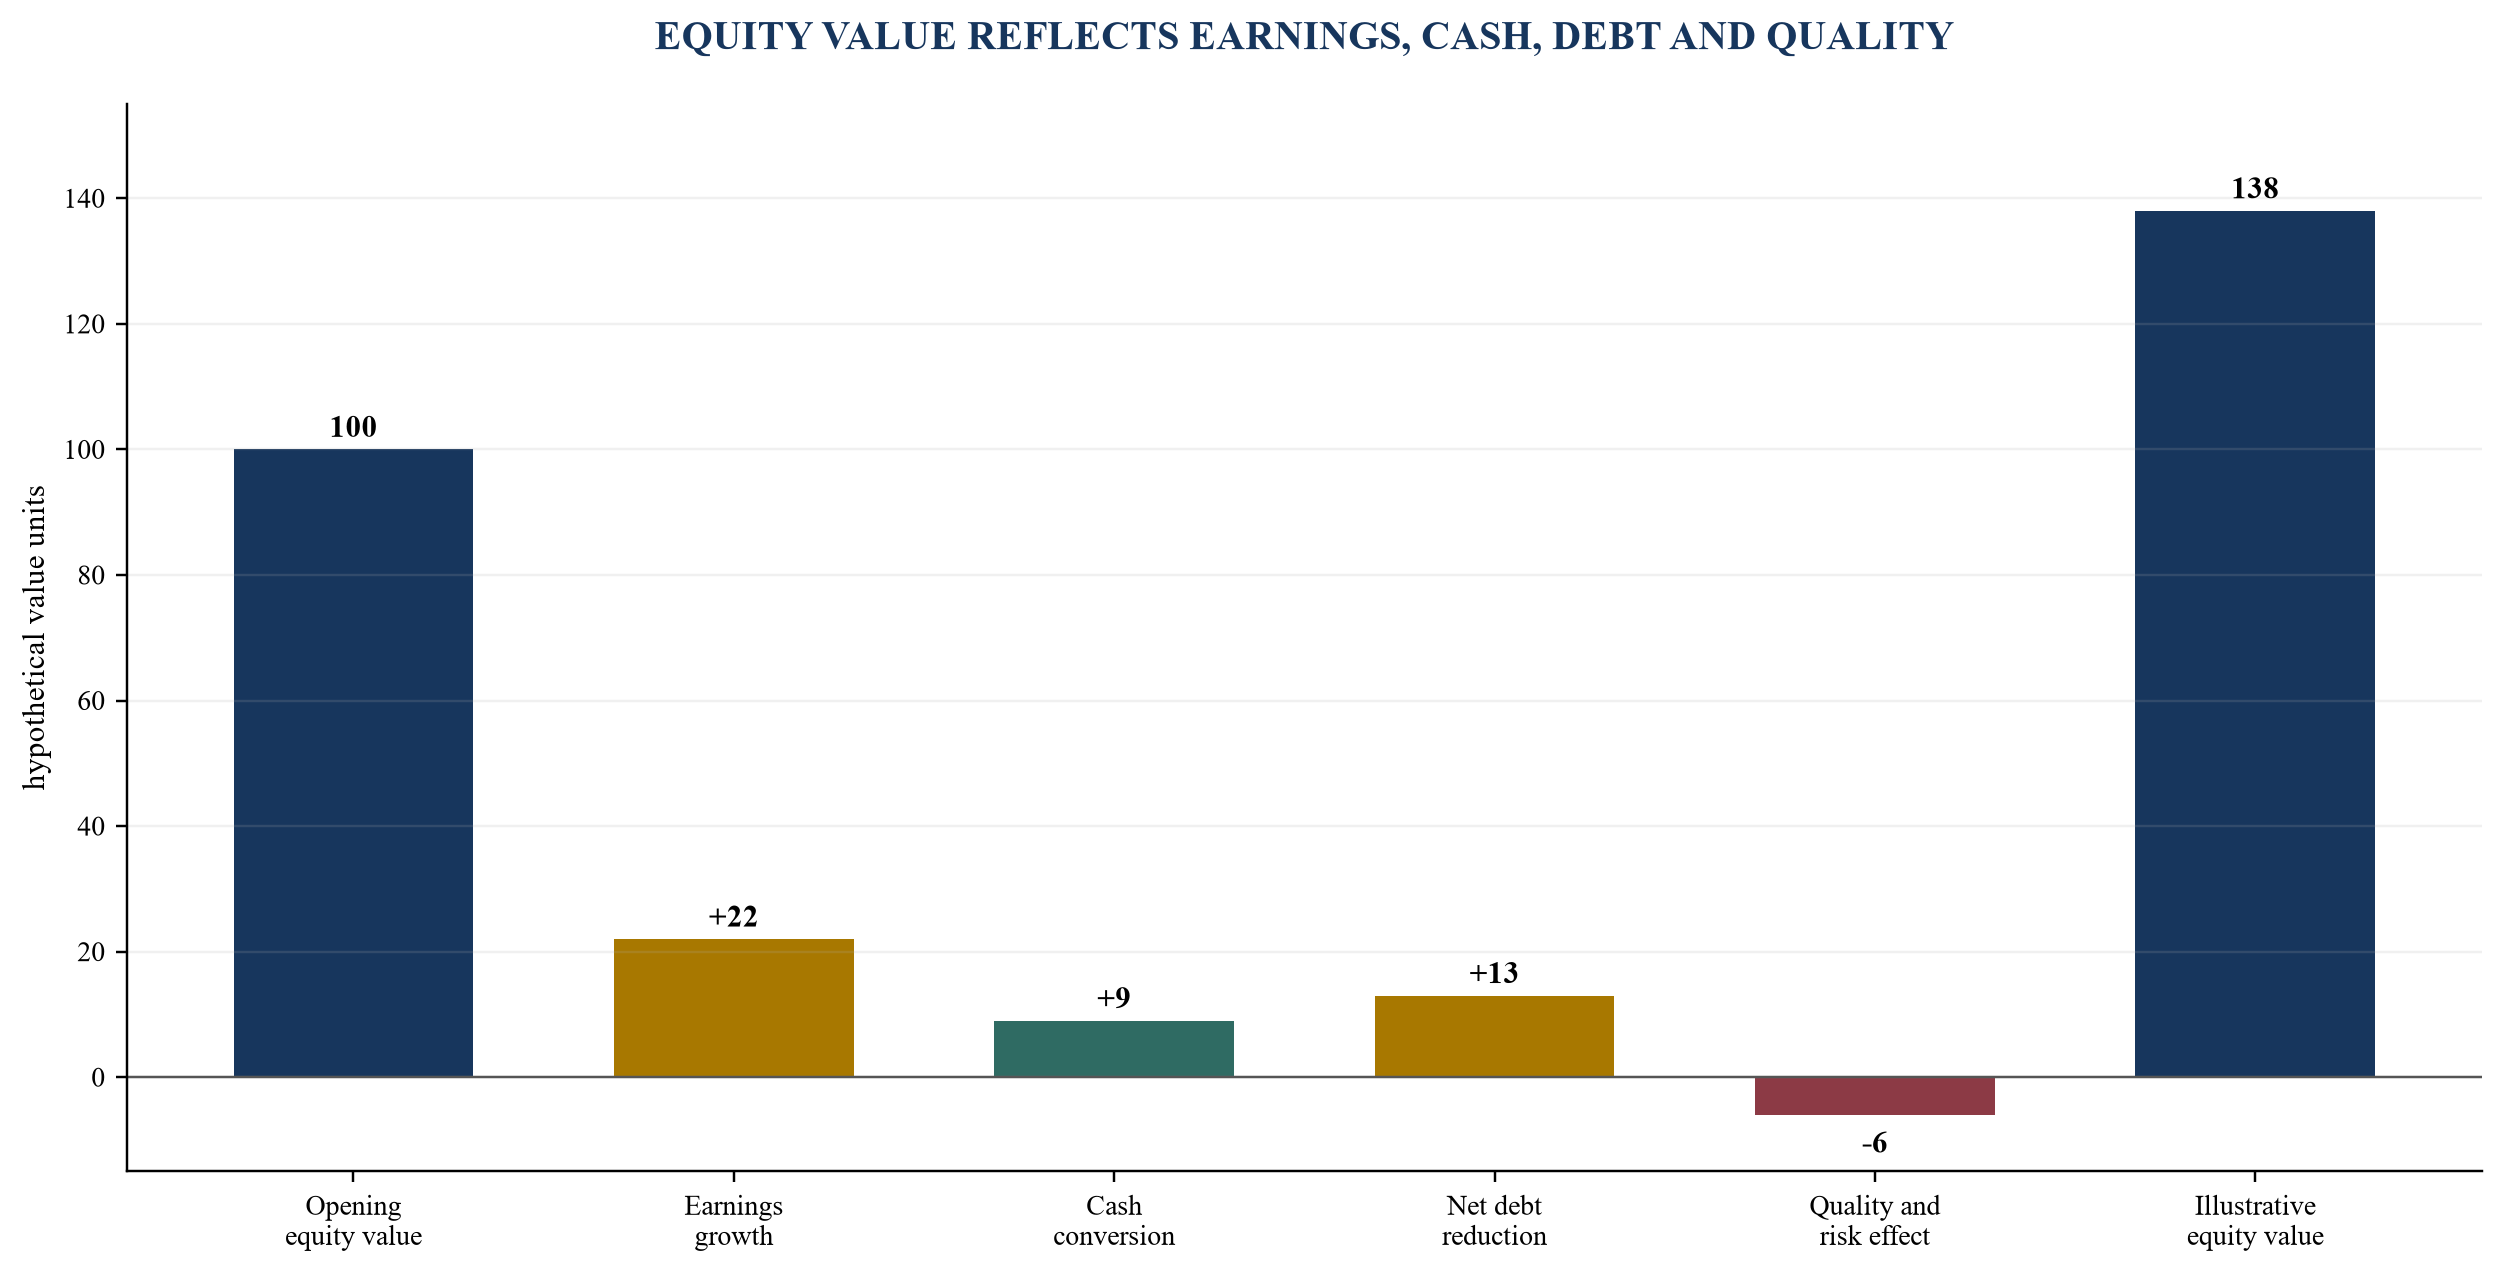
Values are hypothetical management assumptions and do not represent a valuation or investment outcome.
4. Translate the value thesis into a driver tree
The investment or ownership thesis usually contains a small number of enterprise claims: expand a market, improve unit economics, professionalise operations, consolidate a fragmented sector, release cash, build recurring revenue or reduce risk. Each claim should be decomposed into observable causes. Revenue can be separated into volume, price, mix, retention and new-customer conversion. Gross margin can be separated into procurement, yield, labour productivity, freight, warranty and mix. Cash can be separated into receivables, inventory, payables, capital expenditure and tax.
A useful driver tree has four levels. The first is the equity outcome. The second is the enterprise value bridge. The third is the operating driver. The fourth is the weekly controllable action or decision. For example, recurring revenue may connect to renewal rate, which connects to product adoption and service resolution, which connects to named weekly customer interventions.
The tree should remain causal rather than decorative. Each connection needs a reason supported by operating evidence. Management should test whether movement in the weekly indicator precedes movement in the financial result, whether the relationship remains stable and whether another variable could explain both. A weak relationship belongs in a learning agenda rather than a reward formula.
The board should approve the enterprise level and management should own decomposition. Functional leaders can then select the few drivers they can materially influence. This reduces the temptation to place the same corporate EBITDA target on every scorecard and call it alignment. Shared economics can coexist with differentiated accountability.
Table 2. From equity thesis to weekly operating priority
| equity thesis | enterprise driver | operating indicator | weekly priority | owner | guardrail |
|---|---|---|---|---|---|
| durable growth | recurring revenue | renewal pipeline and adoption | resolve named renewal risks before expiry | commercial and customer leaders | discount, complaints and service |
| margin expansion | productive capacity | yield, labour hours and rework | remove the highest-cost process constraint | operations leader | safety, quality and downtime |
| cash release | conversion cycle | overdue receivables and inventory ageing | close disputed invoices and excess-stock actions | CFO and operations | customer continuity and supply risk |
| platform scale | integration capacity | system, process and talent readiness | close critical integration dependencies | transformation leader | control and service continuity |
| strategic differentiation | product value | release adoption and unit economics | complete validated customer learning cycle | product leader | security, privacy and support burden |
| resilience | critical-service tolerance | incidents and remediation ageing | close the highest-harm control gap | accountable service owner | regulatory and customer harm |
The weekly priority names an action and owner while preserving its link to enterprise value.
5. Select metrics with line of sight and decision value
A metric earns a place in an incentive system when it improves a decision. It should have a defined owner, controlled source, calculation rule, frequency, baseline, target, tolerance and response. It should also have line of sight: the accountable person can influence the result through legitimate decisions within the performance period.
Metrics can be classified as outcome, driver, health and gate measures. Outcome measures show financial or strategic results. Driver measures show causes that management can influence earlier. Health measures show whether the operating system is degrading. Gates prevent reward when a minimum condition on liquidity, safety, conduct, compliance, customer harm or control is not met.
The board should test seven qualities. Relevance asks whether the measure links to strategy. Controllability asks whether the role can influence it. Timeliness asks whether it arrives before decisions expire. Reliability asks whether the data and calculation are controlled. Balance asks whether another measure is needed to expose cost or harm. Comparability asks whether periods and entities use consistent definitions. Simplicity asks whether the participant can explain the behaviour the measure is intended to support.
Too many metrics dilute accountability. Too few can invite optimisation of one result at the expense of the enterprise. A practical scorecard may contain three to six material measures plus gates. The number depends on role complexity, but each additional measure should justify the attention and control burden it creates.
Table 3. Metric quality and control test
| test | board question | evidence | failure signal | management response | status |
|---|---|---|---|---|---|
| strategic relevance | which value driver does it represent? | approved strategy and driver tree | no causal link | remove or classify as diagnostic | approve, revise or reject |
| controllability | which legitimate decisions influence it? | role mandate and decision rights | dominated by external movement | use contextual adjustment or wider team measure | documented assessment |
| timeliness | does it arrive before action is needed? | reporting calendar and latency | quarter-end discovery | add leading indicator | frequency approved |
| reliability | can another reviewer reproduce it? | source, formula and reconciliation | manual override without evidence | strengthen data control | control owner named |
| balance | what harm can improvement conceal? | paired guardrail | metric improves while value erodes | add quality, cash or risk measure | guardrail defined |
| comprehensibility | can the participant explain the intended behaviour? | tested communication | different interpretations | simplify and re-communicate | participant acknowledgement |
A proposed measure should pass decision, line-of-sight and evidence tests before it enters a scorecard.
6. Balance earnings, cash, growth, quality and risk
An earnings measure can support focus, but reported profit is not identical to sustainable value creation. Earnings can improve through delayed investment, temporary supplier stretch, reduced maintenance, capitalisation judgements or customer concessions that create future cost. A balanced framework pairs financial outcomes with the operating and risk evidence needed to assess durability.
Cash deserves explicit treatment. Revenue and EBITDA can grow while receivables, inventory and capital expenditure consume financing capacity. The scorecard should show gross cash generation, structural working-capital movement, capital intensity and liquidity. Period-end timing actions should remain separate from structural release. The board should understand whether cash arrived through improved economics, delayed obligations or an ownership funding decision.
Growth quality can be represented through retention, cohort margin, concentration, contracted backlog, implementation capacity and customer outcomes. Product or technology businesses may need adoption, reliability, security and unit-economics measures. Asset-intensive companies may need availability, yield, maintenance and safety. Regulated or critical-service businesses may require explicit conduct, compliance and resilience gates.
Balance does not mean equal weighting. The enterprise context determines materiality. A company with tight liquidity may place more weight on cash and financing capacity. A high-growth platform may emphasise durable revenue and contribution economics. A turnaround may use a sequence: stabilise liquidity, restore service, rebuild margin and then resume growth. The scorecard should change only through an approved process with a recorded rationale.
7. Distinguish measures, targets, thresholds and payout curves
A measure defines what is observed. A target defines the intended result. A threshold defines the minimum level at which an award begins or a gate remains open. A payout curve translates performance into an award outcome. A vesting condition determines whether an equity right becomes exercisable or transferable. These objects interact, yet they are not interchangeable.
The target-setting process should expose the relationship among budget, base case, downside, stretch case and approved strategy. A target below an achievable operating plan can reward normal delivery. A target set at an unsupported stretch can become irrelevant and encourage gaming. The board should see the probability, investment requirement, risk and controllability associated with each point.
Payout curves should avoid cliffs where a small measurement difference creates a disproportionate reward. They should also avoid unlimited leverage that encourages excessive risk. Caps, gates and modifiers need defined authority. The FRC expects remuneration committees to exercise independent judgement and discretion in outcomes [6][7]. ASIC similarly emphasises active, timely and consistent board discretion supported by contextual information and clear records [27][28].
Discretion should follow a framework. The committee should identify possible triggers before the period begins, such as a material safety event, financial restatement, customer harm, control failure, windfall gain or exceptional external shock. The final decision needs evidence, consistency, conflicts management and minutes. Discretion should correct the relationship between performance and outcome, not rewrite the plan casually after results are known.
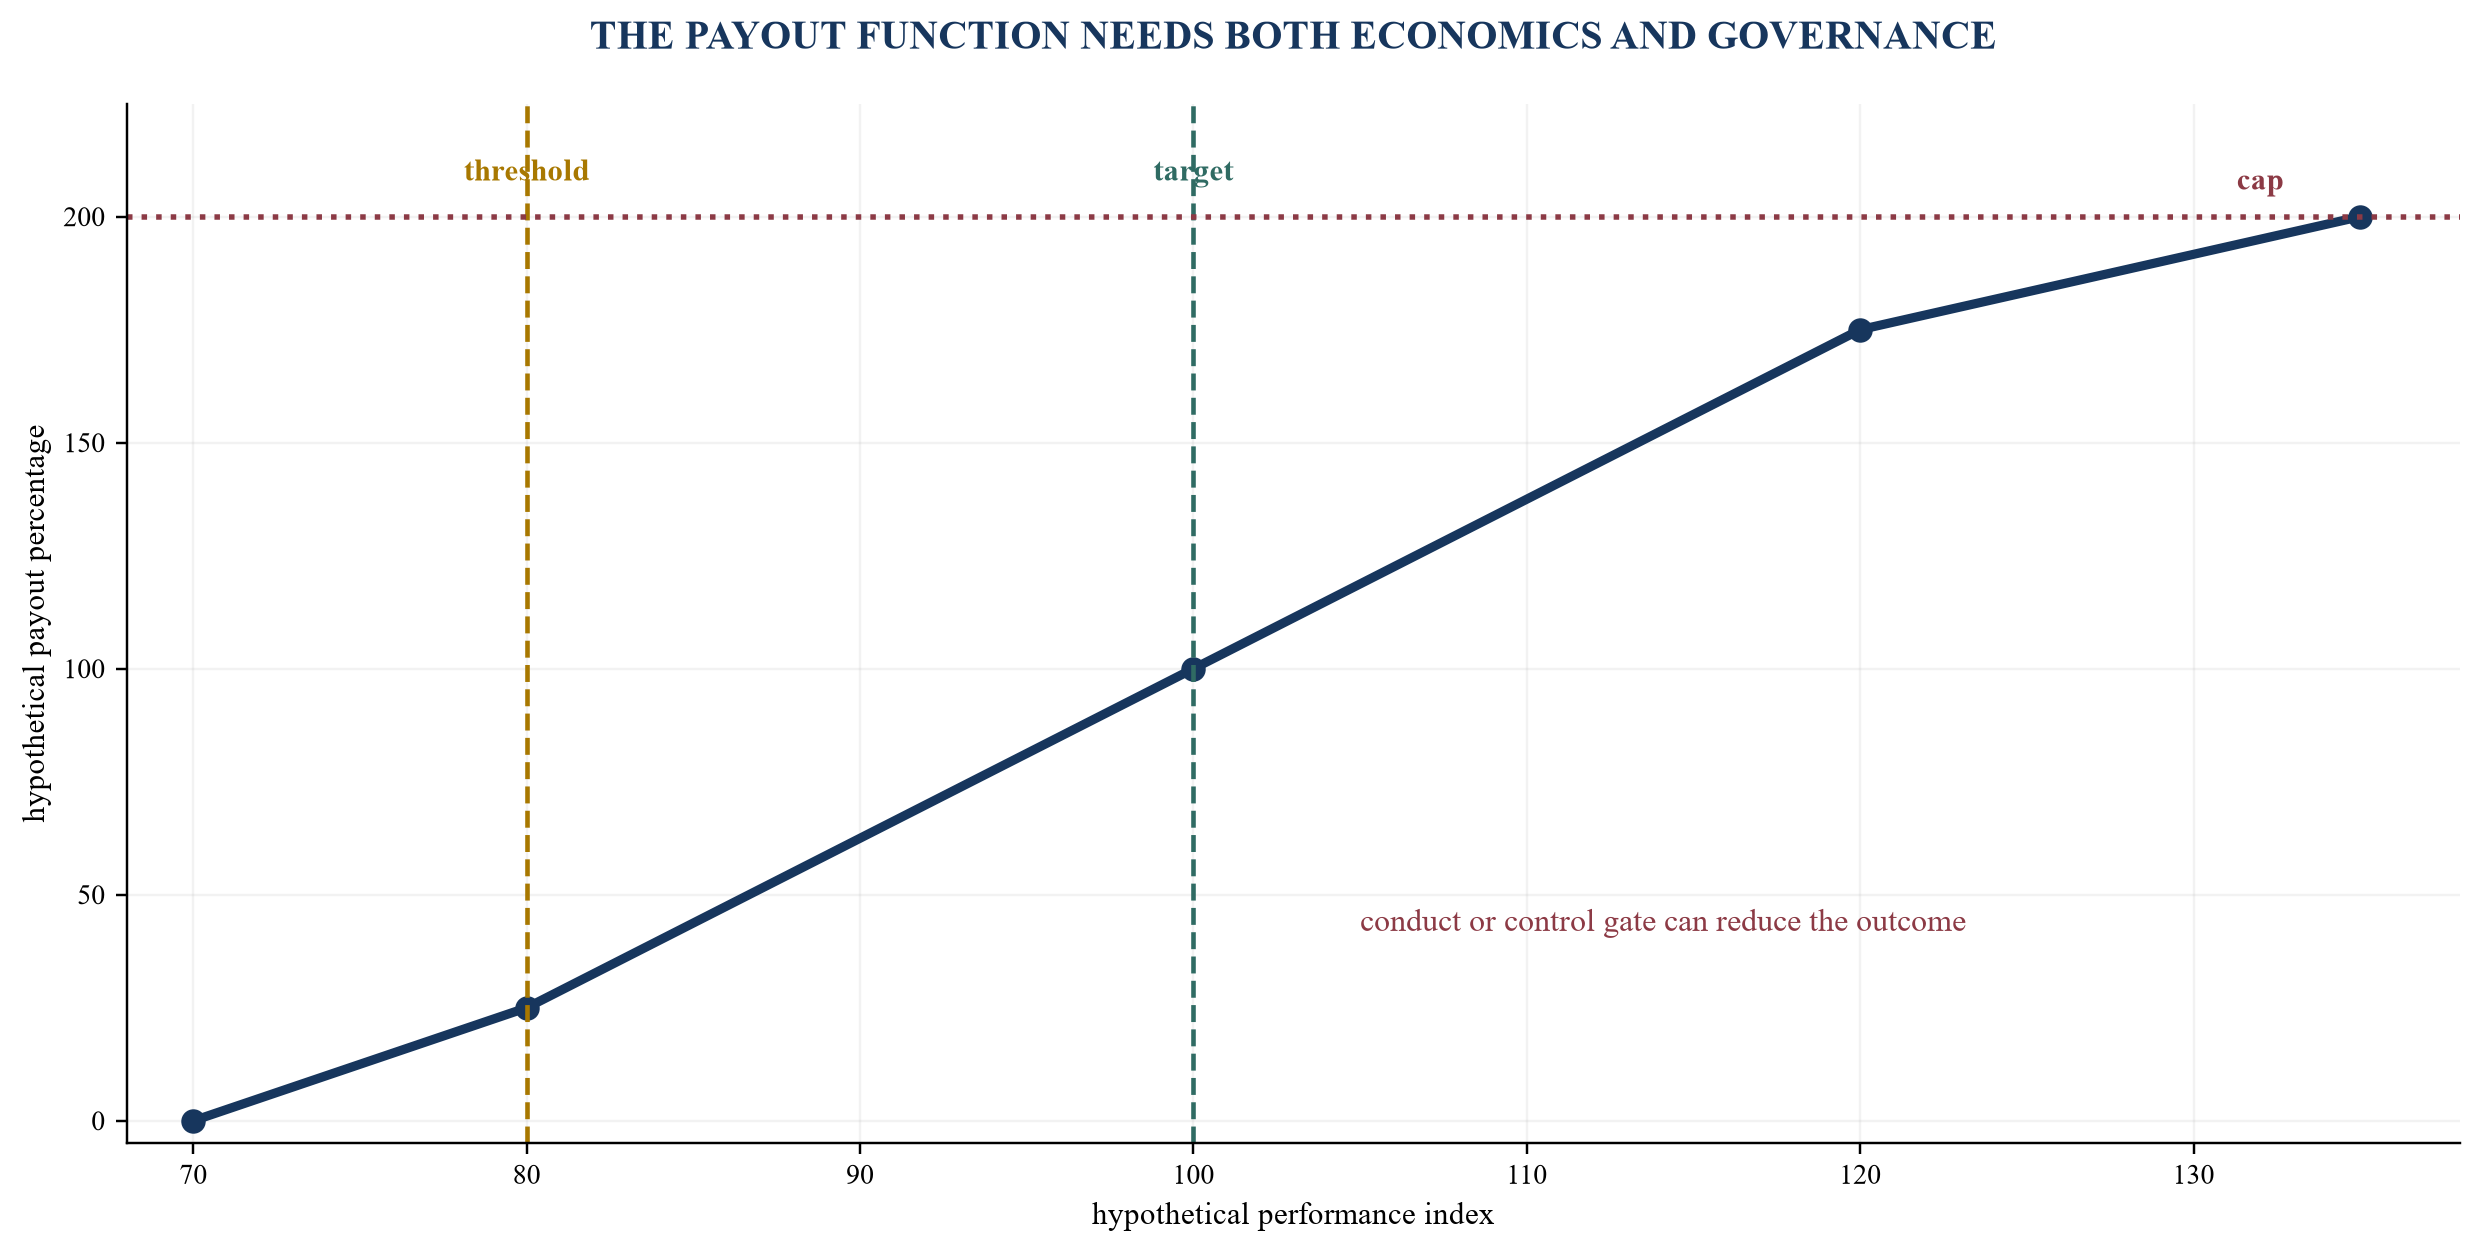
The illustration shows a controlled curve. It does not describe an actual plan or award.
8. Align the time horizon with the value-creation sequence
Equity value often develops over several years while operating decisions occur daily. The framework should connect horizons without forcing one measure to serve every purpose. The equity plan can carry long-term ownership economics. Annual variable pay can reflect delivery of a defined stage. Quarterly and monthly scorecards can track outcomes and drivers. Weekly priorities can govern actions and exceptions.
The value-creation plan should identify sequencing. A company may need to stabilise the management team, improve data, repair pricing, release cash and build acquisition capacity before pursuing accelerated growth. Rewarding only the final outcome can leave early enabling work invisible. Rewarding every activity can pay for motion without value. Stage gates solve this by linking defined capabilities to the next economic outcome.
Lagging measures should be paired with leading evidence. Revenue growth lags pipeline quality, product adoption and capacity. Cash conversion lags invoice accuracy, dispute resolution and inventory decisions. Employee retention lags role clarity, manager quality and succession actions. The leading indicator should remain a diagnostic until management demonstrates a stable relationship with the outcome.
Time horizons also influence risk. Short measurement periods can encourage delayed cost, aggressive recognition or weakened controls. Long periods can reduce urgency and perceived line of sight. A balanced design uses immediate operating accountability, annual assessment and long-term equity participation, with consistent definitions and no double counting of the same result.
9. Cascade enterprise priorities without fragmenting the business
A cascade should preserve enterprise coherence. The chief executive scorecard can contain company-wide outcomes, while functional scorecards show each leader's causal contribution. The commercial leader may own price, retention and pipeline quality. The operations leader may own capacity, yield and delivery. The CFO may own cash conversion, forecast integrity and financing capacity. Shared measures can encourage collaboration when responsibility genuinely overlaps.
Fragmentation occurs when each function optimises its own score. Sales can pursue volume that operations cannot deliver. Procurement can reduce unit cost while increasing stockouts. Operations can maximise utilisation while delaying maintenance. Finance can reduce working capital through actions that damage suppliers or customers. Paired measures and cross-functional priorities help expose these effects.
The cascade should distinguish accountability from contribution. One executive owns the result and convenes the decision. Other functions contribute named actions. This prevents collective ownership from becoming no ownership. The weekly review should identify the accountable owner, decision required, interdependency, due date and evidence of closure.
The number of enterprise priorities should remain small. A leadership team that names twenty priorities has created a catalogue. The board can require management to rank the few outcomes that constrain value this quarter and to state which activities will be deprioritised. Incentive design should reinforce those choices rather than preserve every legacy measure.
10. Build role scorecards around decisions and evidence
A role scorecard begins with the role mandate and decision rights. It should state the outcomes the role owns, the drivers it controls, the resources it can deploy, the dependencies it must manage and the boundaries it cannot cross. A metric without decision authority creates frustration. Decision authority without measurable accountability creates agency risk.
Each scorecard should show definition, source, baseline, target, threshold, frequency, weight, gate, owner and evidence. It should also identify the management action triggered by variance. A red indicator is useful only when the meeting decides who will act, by when and with what expected effect. Commentary should distinguish root cause, corrective action and forecast impact.
Role changes require controlled updates. A new acquisition, product launch, restructuring or leadership transition can make a prior scorecard incomplete. The board or delegated committee should approve material changes to executive scorecards, while the CEO can manage lower-level changes within policy. Changes should not retrospectively move targets simply because performance is weak.
The scorecard should be tested before it is tied to money. A shadow period can reveal data gaps, unintended behaviours and unstable relationships. Management can compare calculated outcomes with qualitative judgement and identify where the formula would have rewarded the wrong conduct.
Table 4. Executive scorecard and weekly decision architecture
| role outcome | lagging measure | leading evidence | frequency | decision on variance | gate or modifier |
|---|---|---|---|---|---|
| durable revenue | retained contribution and contracted growth | renewal risk, adoption and qualified pipeline | weekly and monthly | intervene on named accounts and capacity | customer harm and discount quality |
| sustainable margin | contribution margin and realised savings | yield, rework, price and procurement milestones | weekly and monthly | remove constraint or revise initiative | safety, quality and continuity |
| cash conversion | operating cash and structural working capital | overdue disputes, ageing and inventory actions | weekly | assign cash action and forecast effect | no overdue-obligation window dressing |
| scalable platform | unit cost and integration capacity | systems, controls, process and talent readiness | fortnightly and monthly | approve dependency resolution | control and service tolerance |
| controlled growth | return on deployed capital | business case milestones and post-investment review | monthly and quarterly | continue, redesign or stop capital | liquidity and covenant capacity |
| leadership strength | critical-role coverage and retention | succession readiness and capability actions | monthly | hire, develop, retain or redesign role | conduct and values |
The scorecard links a value outcome to controllable evidence, governance and a defined management response.
11. Choose the right balance of enterprise, team and individual outcomes
Enterprise measures align leaders with the whole company. Team measures recognise interdependent delivery. Individual measures preserve accountability for role-specific decisions. The appropriate mix depends on organisational maturity, role scope and the ability to measure contribution reliably.
Senior executives generally need meaningful enterprise exposure because their decisions shape shared outcomes. Functional measures can improve line of sight where the causal relationship is clear. Individual objectives can capture a transformation, succession or capability outcome that financial measures miss. Excessive individual weighting can encourage local optimisation and negotiation over attribution.
The board should inspect how the same measure propagates. If company EBITDA appears in the equity plan, annual bonus, functional scorecard and transaction bonus, the result may be rewarded several times. Multiple instruments can be legitimate, but the economics and purpose should be visible. The committee should understand total realised and potential compensation across scenarios.
Calibration meetings can improve consistency. Leaders review evidence, compare standards and challenge ratings across functions. The process requires conflicts controls and should not become a forced distribution. A rating should reflect the approved definition and evidence rather than relative advocacy in the room.
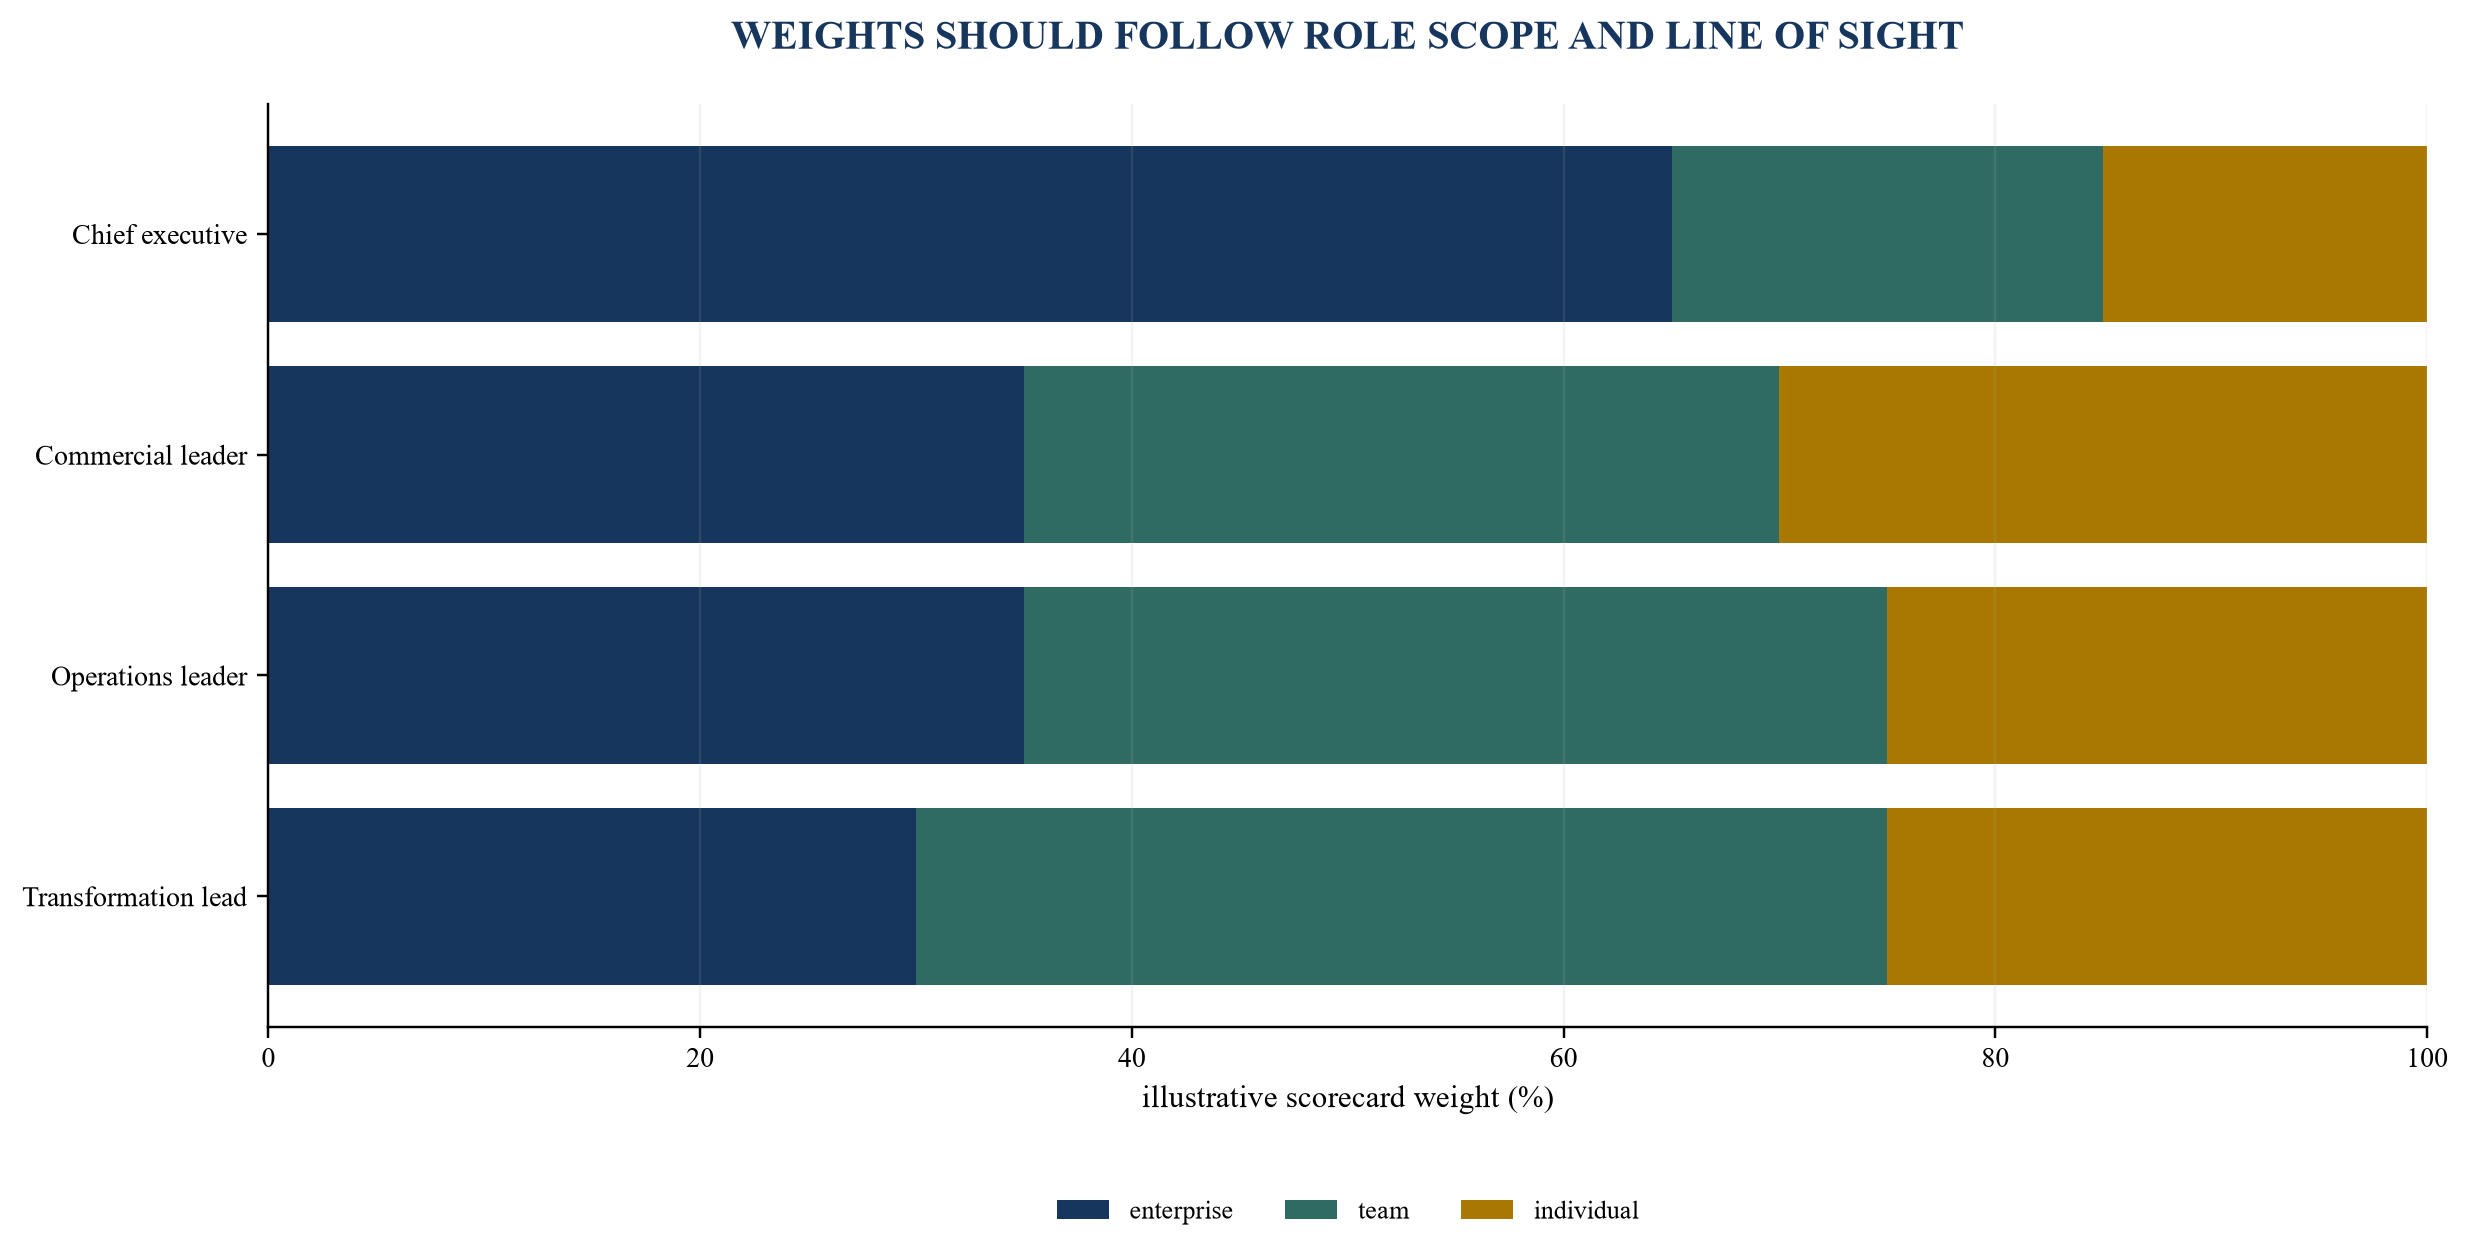
The relative weights are illustrative and should follow role scope, evidence quality and approved policy.
12. Integrate acquisitions, transformations and strategic projects
Acquisitions and transformations create measurement problems. Management can complete a transaction while overpaying, underfunding integration or weakening the core business. A transformation can deliver milestones while failing to create recurring economics. Incentives should therefore separate decision quality, execution readiness, realised performance and value outcome.
An acquisition scorecard can include strategic fit, diligence closure, financing capacity, Day-One readiness, customer and employee continuity, synergy validation, cash conversion and post-investment return. Deal completion should be a gateway to integration accountability rather than the final success measure. The board should decide which outcomes remain within management control and which depend on market or seller conditions.
Transformation measures should distinguish activity from capability. A system launch is an event. Adoption, data quality, process performance and control evidence show whether the capability works. Benefits should reconcile to the approved baseline, full cost and financial statements where appropriate. Capacity released without a management action is not automatically a cash saving.
Strategic projects also require stop decisions. The scorecard should not reward continuation of an initiative whose economics have deteriorated. A well-governed termination can preserve value. The board should evaluate whether management surfaced contrary evidence early, updated the business case and redeployed resources responsibly.
13. Design against gaming, metric substitution and windfalls
Any measure can influence behaviour. The design review should ask how a rational participant might improve the metric without improving enterprise value. Revenue can be accelerated with uneconomic terms. Margin can improve through deferred investment. Working capital can move through supplier delay or inventory understocking. Customer satisfaction can be sampled selectively. Project milestones can be redefined after slippage.
Controls should address definition, timing, perimeter, override and evidence. Measures should reconcile to authoritative systems. Material manual adjustments need independent review. Period-end movements should be visible. Acquisitions and disposals require consistent pro forma rules. One-off items should follow approved treatment. Restatements should trigger re-performance.
Paired indicators expose substitution. Price growth pairs with retention and complaints. Procurement savings pair with quality and continuity. Inventory reduction pairs with service, downtime and expedite cost. Headcount productivity pairs with capacity, control and employee risk. A gate can reduce or eliminate an outcome when serious misconduct or harm occurs, subject to the executed terms and applicable law.
Windfalls require contextual analysis. Commodity prices, sector rerating, currency or an unsolicited strategic premium can create value beyond management's contribution. External shocks can depress results despite strong decisions. The framework should define how the board considers market movement, avoids hindsight and records consistent use of discretion.
14. Govern discretion, malus and clawback
Formulae provide consistency, while judgement addresses circumstances a formula cannot fully anticipate. The remuneration committee or equivalent board body should define its authority, information rights, conflicts process and decision calendar. Executives should not determine their own outcomes. The OECD, FRC, Saudi CMA, Singapore Code and ASIC all emphasise independent oversight, links to long-term performance and transparent decision processes [1][6][20][24][27].
Malus allows an unvested or unpaid award to be reduced. Clawback allows recovery after payment or vesting in defined circumstances. The precise scope, trigger, enforceability, process and limitation period depend on the plan, contract and law. A broad policy statement does not establish a recoverable right by itself. The United States SEC adopted listing-standard requirements for recovery of erroneously awarded incentive compensation for specified listed issuers [15]. Other regimes and private plans differ.
The committee should maintain a trigger matrix covering financial restatement, misconduct, material risk failure, reputational harm, error and other approved events. It should identify who investigates, who advises, how conflicts are handled, which awards and periods are affected and what evidence supports the decision. The company should protect due process and confidentiality.
Committee minutes should record the outcome, alternatives, evidence, conflicts, policy basis and rationale. ASIC highlights accurate records of how and why variable-pay decisions were made [27]. Consistent records also help future committees compare precedents and avoid arbitrary treatment.
15. Build controlled data lineage for every reward outcome
An incentive calculation is a financial and governance process. Each input needs an authoritative source, calculation rule, period, perimeter, owner and reviewer. Financial measures should reconcile to approved accounts or controlled management reporting. Operational measures should come from governed systems with clear cut-off and exception treatment. Qualitative outcomes need evidence and an approved assessment method.
The calculation file should be protected from uncontrolled edits. It should preserve versions, formulas, overrides, approvals and final results. A change log should identify definition changes, data corrections, target amendments and committee decisions. Access should separate preparation, review and approval.
Share-based payments can have accounting consequences under IFRS 2, including measurement and recognition requirements that depend on award terms and classification [18]. Dilution and earnings-per-share presentation can engage IAS 33 [19]. United States issuers may face executive-compensation disclosure and recovery rules [13][14][15]. These sources do not determine a private company's design, but they demonstrate why legal rights, performance evidence, accounting treatment and communication should remain connected.
The board should receive both calculated outcome and control confidence. A result based on estimated data or unresolved interpretation should be identified before approval. Material corrections should trigger re-performance and an assessment of prior communication.
Table 5. Incentive data-lineage and evidence matrix
| evidence family | authoritative source | transformation | primary control | reviewer | escalation trigger |
|---|---|---|---|---|---|
| financial outcome | approved ledger and reporting pack | approved definition and perimeter | reconciliation and period lock | controller | post-close change or judgement |
| operating driver | governed operational system | documented formula and cut-off | source-to-scorecard tie-out | functional finance | missing, late or overridden data |
| equity economics | cap table and executed instruments | dilution and waterfall model | instrument reconciliation | CFO and counsel | financing or capital-structure change |
| qualitative assessment | approved objective and evidence file | documented rating standard | independent calibration | CEO or committee | unsupported rating or conflict |
| modifier or gate | incident and control record | policy trigger assessment | legal and control-function review | committee | material harm, restatement or misconduct |
| final outcome | controlled calculation and minutes | approved curve and discretion | re-performance and sign-off | committee chair | inconsistency or unresolved interpretation |
The matrix separates calculation ownership, independent review and committee judgement.
16. Communicate the system so participants can act
An incentive cannot guide behaviour when participants do not understand it. Communication should explain the instrument, value logic, performance measures, governance, risks and scenarios in plain language. It should separate current legal rights from illustrative value. It should explain that enterprise value, debt, dilution, taxes, vesting and transaction terms can change realised proceeds.
The annual explanation is insufficient for execution. Leaders need a weekly view of priorities, measures, variance and decisions. Participants should know which indicators are diagnostic, which affect annual pay, which affect vesting and which remain board judgements. The same term should not carry different meanings across the plan, budget and operating review without an explicit reconciliation.
Scenario tools can improve understanding. A participant statement can show hypothetical enterprise value, debt and dilution cases with clear assumptions. It should avoid presenting a projected exit value as a promise. The company should control access and confirm which communication was provided, when and in which language.
Managers also need training on behavioural effects. They should understand that a target does not authorise conduct outside policy or law. They should be able to escalate a conflict between metric achievement and customer, employee, safety or control outcomes. The governance system should reward early disclosure of problems rather than concealment until the measurement date.
17. Connect retention, leaver treatment and succession
Equity can support retention when the participant understands the value, believes the plan is credible and sees a fair connection between contribution and outcome. Retention can weaken when vesting is remote, communication is opaque, liquidity is uncertain or leaver treatment feels arbitrary. More equity does not automatically solve role ambiguity, weak leadership or poor development.
The board should identify critical roles, succession depth, retention risk and knowledge concentration. The participant register can be linked to the talent map without exposing confidential compensation broadly. This allows the board to see where value creation depends on one individual, where an award has lost retention power and where succession actions are overdue.
Leaver treatment must follow executed terms and applicable law. The control process should identify notice date, cessation date, reason, board determination, vested and unvested interests, exercise window, repurchase rights, valuation basis, tax and communication. The participant should receive a controlled statement after legal review.
Succession should not be discouraged by poorly designed incentives. A leader who develops a successor and hands over responsibly should not automatically lose recognition for long-term value created. The framework can include capability building and transition quality as assessed outcomes while preserving the legal terms of the award.
18. Apply jurisdiction, listing and sector overlays deliberately
The governance architecture varies by entity and jurisdiction. The UK Corporate Governance Code applies on its stated basis and contains detailed remuneration principles and provisions [6]. The EU Shareholder Rights Directive addresses remuneration policy and reporting for in-scope listed companies [10][11]. United States securities rules contain executive-compensation and pay-versus-performance disclosures for specified registrants [13][14].
Saudi Arabia's Corporate Governance Regulations require remuneration policy to connect with strategy, objectives, long-term performance, risk and recovery where remuneration was based on inaccurate information [20]. India's SEBI share-based employee benefit regulations govern specified listed-company schemes and were amended through December 2025 [22]. Singapore's Code and listing rules address remuneration governance, performance linkage and disclosure [23][24][25]. Australia's ASIC and ASX materials address board oversight, discretion and governance disclosure [26][27][29].
Financial institutions can face additional rules. EBA guidelines address sound remuneration policies under the EU capital framework [12]. APRA CPS 511 applies to specified Australian regulated entities [30]. Federal Reserve, OCC and FSB materials address incentive compensation and risk in financial organisations [31][32][33]. These regimes should not be applied automatically to an industrial portfolio company. Their risk-alignment logic can inform a proportionate design when the board documents applicability.
Cross-border groups also face employment, tax, securities, exchange-control, data and accounting issues. A single global commercial philosophy may require local instruments and communications. Management should maintain a jurisdiction matrix and obtain qualified advice before grant, amendment, vesting, exercise, transfer, leaver action or payment.
19. Test the framework through a hypothetical portfolio-company case
Consider a hypothetical business acquired at an enterprise value of 240 value units, funded with 100 units of net debt and 140 units of equity. The ownership thesis assumes that enterprise value can increase through durable revenue growth, margin improvement and a more resilient operating platform, while cash conversion reduces net debt. The plan provides management with a share of equity value above an agreed hurdle, subject to vesting and leaver terms.
The original scorecard uses revenue and EBITDA. During the first quarter, revenue grows, but overdue receivables, implementation backlog and customer complaints also rise. EBITDA benefits from delayed hiring and maintenance. The formula indicates strong performance while the operating evidence shows future cost and cash pressure.
The redesigned system maps equity value into four outcomes: durable contribution growth, cash conversion, platform readiness and leadership depth. The commercial leader receives a scorecard containing retained contribution, renewal risk and implementation capacity. The operations leader owns yield, delivery, maintenance and service tolerances. The CFO owns structural cash, forecast integrity and financing capacity. The chief executive carries enterprise outcomes, cross-functional execution and succession.
Weekly meetings focus on exceptions and decisions. Monthly reviews reconcile operating drivers to financial and cash results. Quarterly board reviews assess progress, data confidence, risk and whether the scorecard still represents the value thesis. The equity plan remains governed by its executed terms. The operating system improves line of sight without claiming that weekly metrics determine legal vesting unless the plan expressly says so.
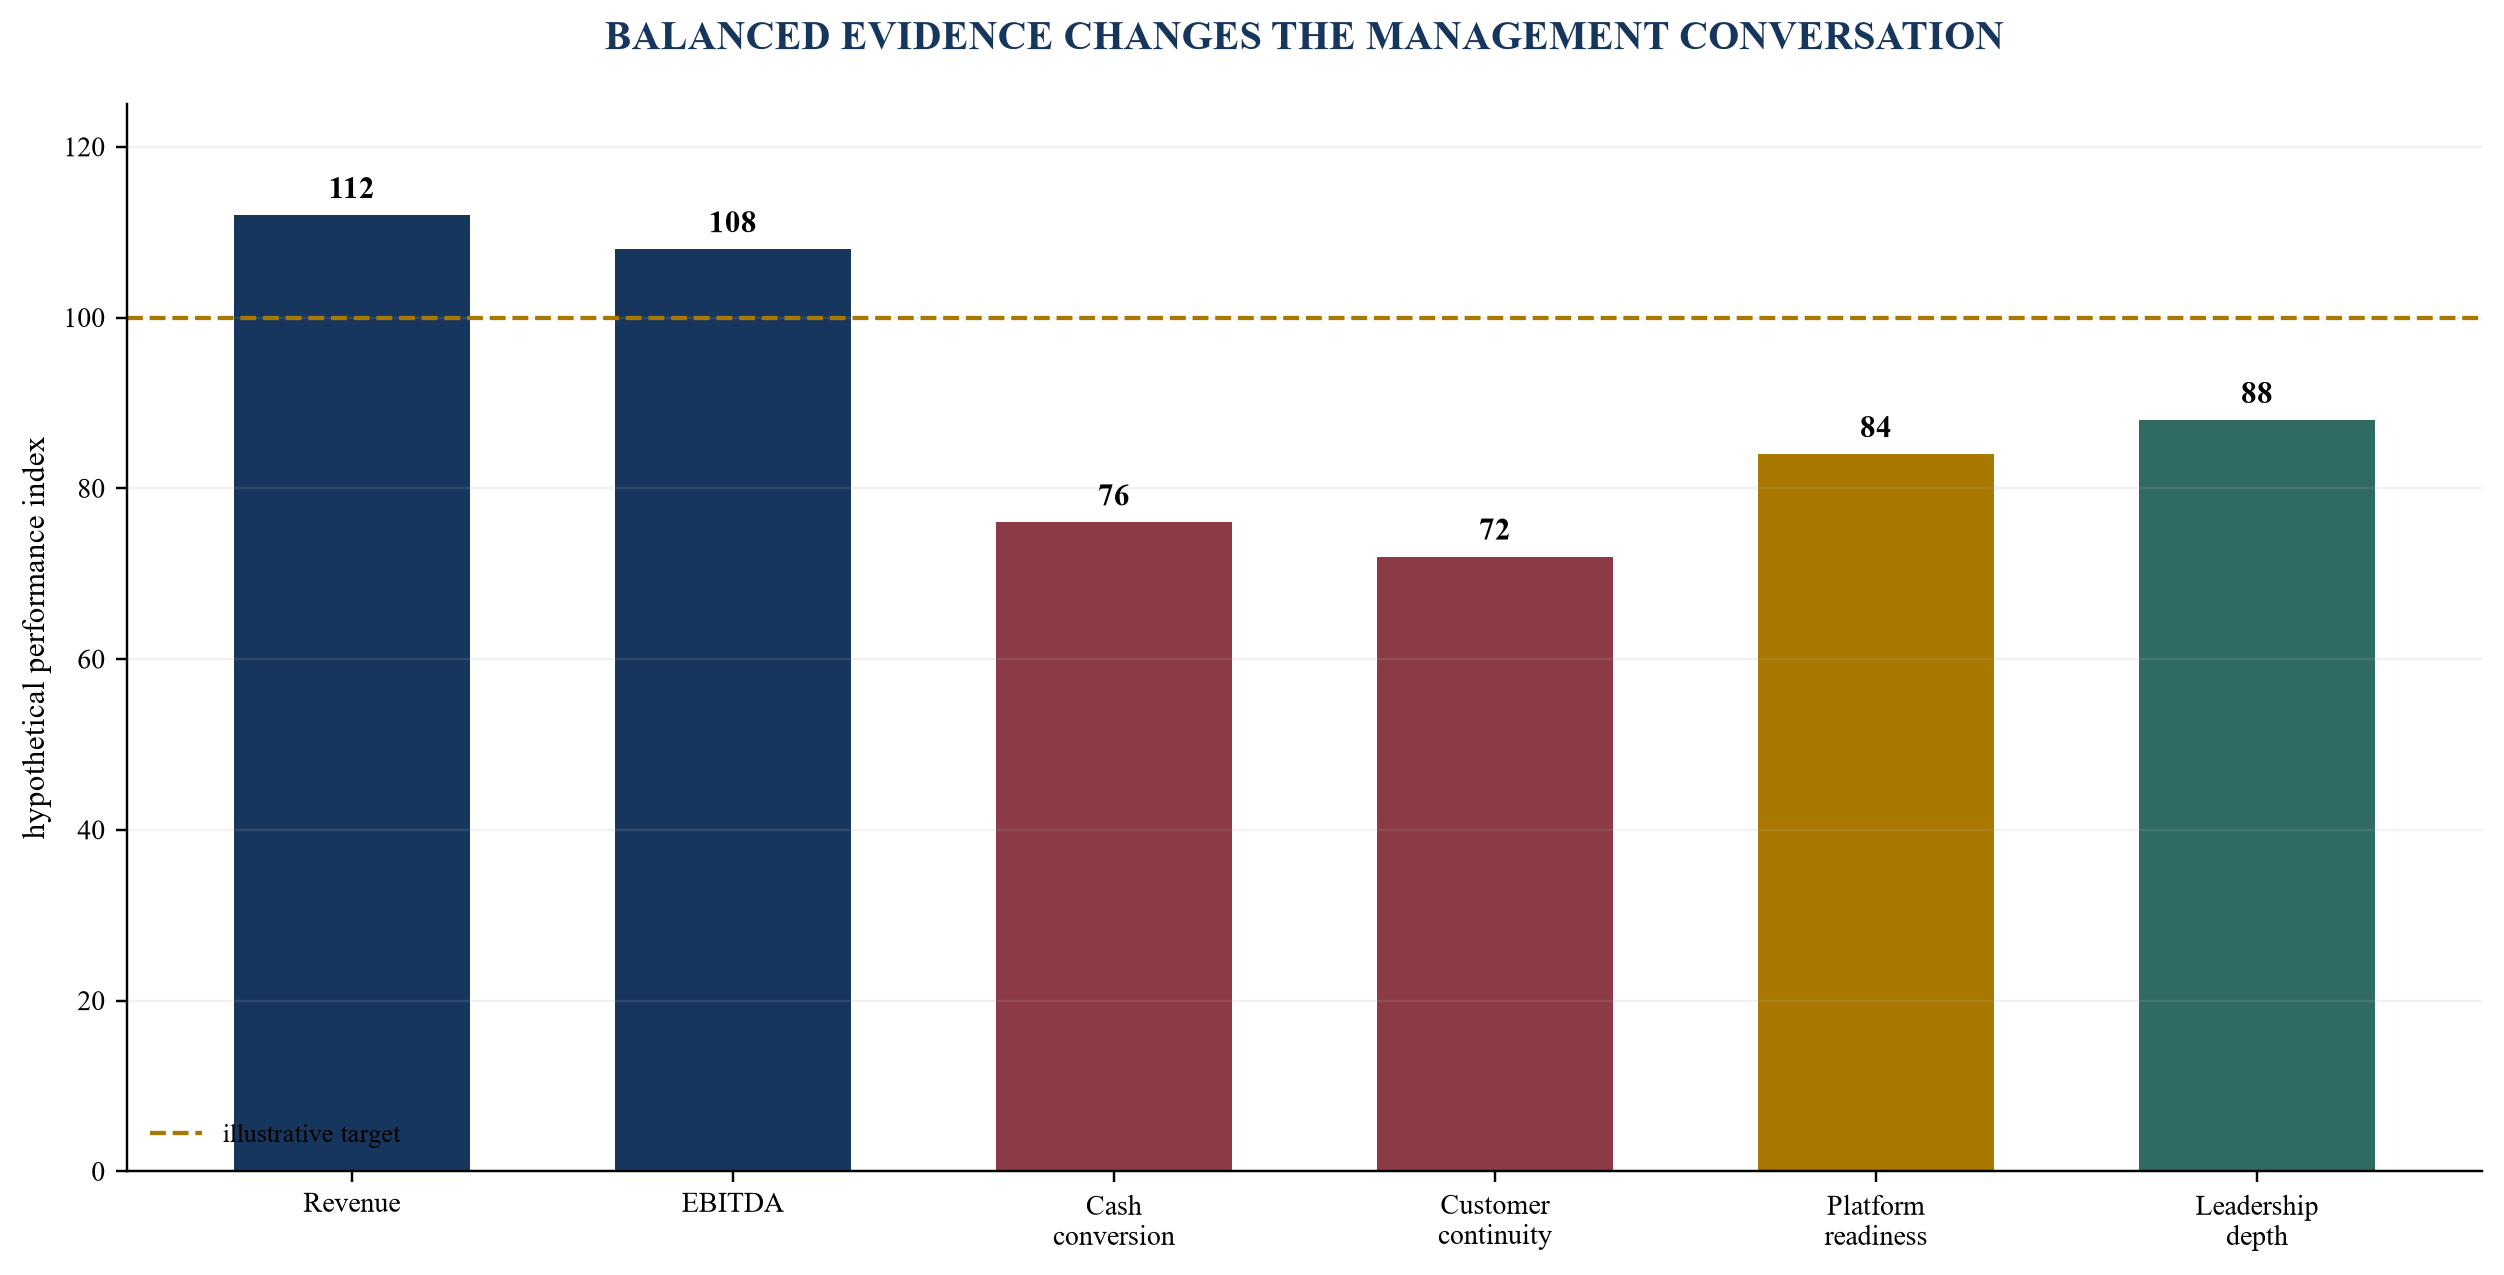
The values are illustrative indices. A headline financial result can coexist with weak cash, service or capability evidence.
20. Run a weekly cadence that converts variance into decisions
The weekly meeting should manage the few priorities that constrain value. It is not a compressed board meeting and should not repeat every functional update. The agenda begins with prior decisions, then reviews material outcome and driver exceptions, tests root cause, approves action and records forecast effect.
Each exception should identify measure, threshold, magnitude, trend, owner, cause, customer or control consequence, proposed decision and due date. Management should distinguish information, discussion and decision items. The meeting chair should close each decision with one accountable owner and evidence expected at the next review.
Financial and operating views should remain connected. A pricing action should show expected revenue, margin, cash and customer effect. A working-capital action should show operational guardrails. A hiring delay should show capacity and control impact. The CFO or performance office can maintain the integrated value bridge while functional owners retain accountability for action.
The cadence should escalate with materiality. A stable business may use weekly functional reviews and monthly enterprise review. A turnaround, integration or major launch may require more frequent workstream governance. The board should define which exceptions require immediate escalation, such as liquidity pressure, serious customer harm, control failure or a forecast miss that changes the value-creation plan.
21. Give the board a compact evidence and decision pack
The board pack should show whether management is creating value, whether the evidence is reliable and which decisions are required. A compact opening page can present equity value drivers, financial and cash outcomes, operating health, talent, risk, data confidence and the few exceptions that require board action.
The pack should reconcile actual, plan, prior forecast and latest forecast. It should separate market movement from management contribution where practicable. It should identify structural improvement, timing effects and one-offs. The board should be able to see whether a positive outcome came with a deterioration in customer, employee, safety, compliance or resilience evidence.
Incentive governance should remain a distinct section. The remuneration committee needs scorecard progress, potential outcomes, data-confidence issues, discretion triggers, leaver matters, plan changes and total reward scenarios. Sensitive individual data should be restricted. The full board retains responsibility for strategy, risk and performance even when a committee handles remuneration.
Board decisions should be recorded with owner, authority, evidence and review date. If the board changes a target, metric or weight, the pack should show why, who approved it, whether participant consent or disclosure is required and how prior periods are treated.
Table 6. Board incentive-execution scorecard
| board lens | current evidence | forward view | confidence | decision required | accountable owner |
|---|---|---|---|---|---|
| enterprise value drivers | earnings, cash, debt and quality bridge | base and downside cases | reconciled or provisional | approve value-creation reprioritisation | CEO and CFO |
| operating execution | leading and lagging driver scorecard | constraints and interventions | source and latency status | remove constraint or stop initiative | functional leader |
| incentive exposure | accrued, potential and vested outcomes | scenario range and dilution | legal and calculation review | approve, defer or request analysis | remuneration committee |
| conduct and risk | incidents, control exceptions and harm | remediation and residual exposure | control-function assessment | apply gate, modifier or escalation | board and control owner |
| talent and succession | critical-role coverage and retention | succession readiness | evidence and management judgement | appoint, retain, develop or transition | CEO and nomination committee |
| governance | plan changes, conflicts and disclosures | calendar and approvals | counsel and company-secretary review | approve action and communication | chair and company secretary |
The board view integrates value, evidence, behaviour and required decisions.
22. Implement the first controlled cycle in one hundred days
Days 1 to 20 establish governance and perimeter. The board names an executive sponsor and committee authority. Management assembles executed plan documents, approvals, participant records and the current cap table. Counsel identifies unresolved interpretation and jurisdiction issues. The team documents existing bonus, scorecard and performance-management systems.
Days 21 to 40 build the value architecture. The CFO reconciles enterprise and equity value, net debt, dilution and waterfall scenarios. The CEO and board identify the few value-creation priorities. Management decomposes them into driver trees and names accountable owners. Finance tests baselines and data availability.
Days 41 to 65 design scorecards and controls. Each role receives a mandate, outcome set, leading evidence, frequency, thresholds, targets, gates and decision rights. The team documents sources, formulae, cut-offs, review and change control. Counsel, tax and accounting advisers assess plan and reporting implications. The remuneration committee reviews possible gaming and discretion triggers.
Days 66 to 85 run a shadow cycle. Weekly and monthly reviews use the proposed scorecards without changing legal rights. Management compares calculated outcomes with operating evidence, tests participant comprehension and identifies unintended behaviour. Data owners close critical control gaps.
Days 86 to 100 approve and communicate. The board or delegated body approves the operating framework and any properly documented changes to remuneration arrangements. Participants receive controlled explanations. The first formal cycle begins with an evidence calendar, decision log and scheduled board review.
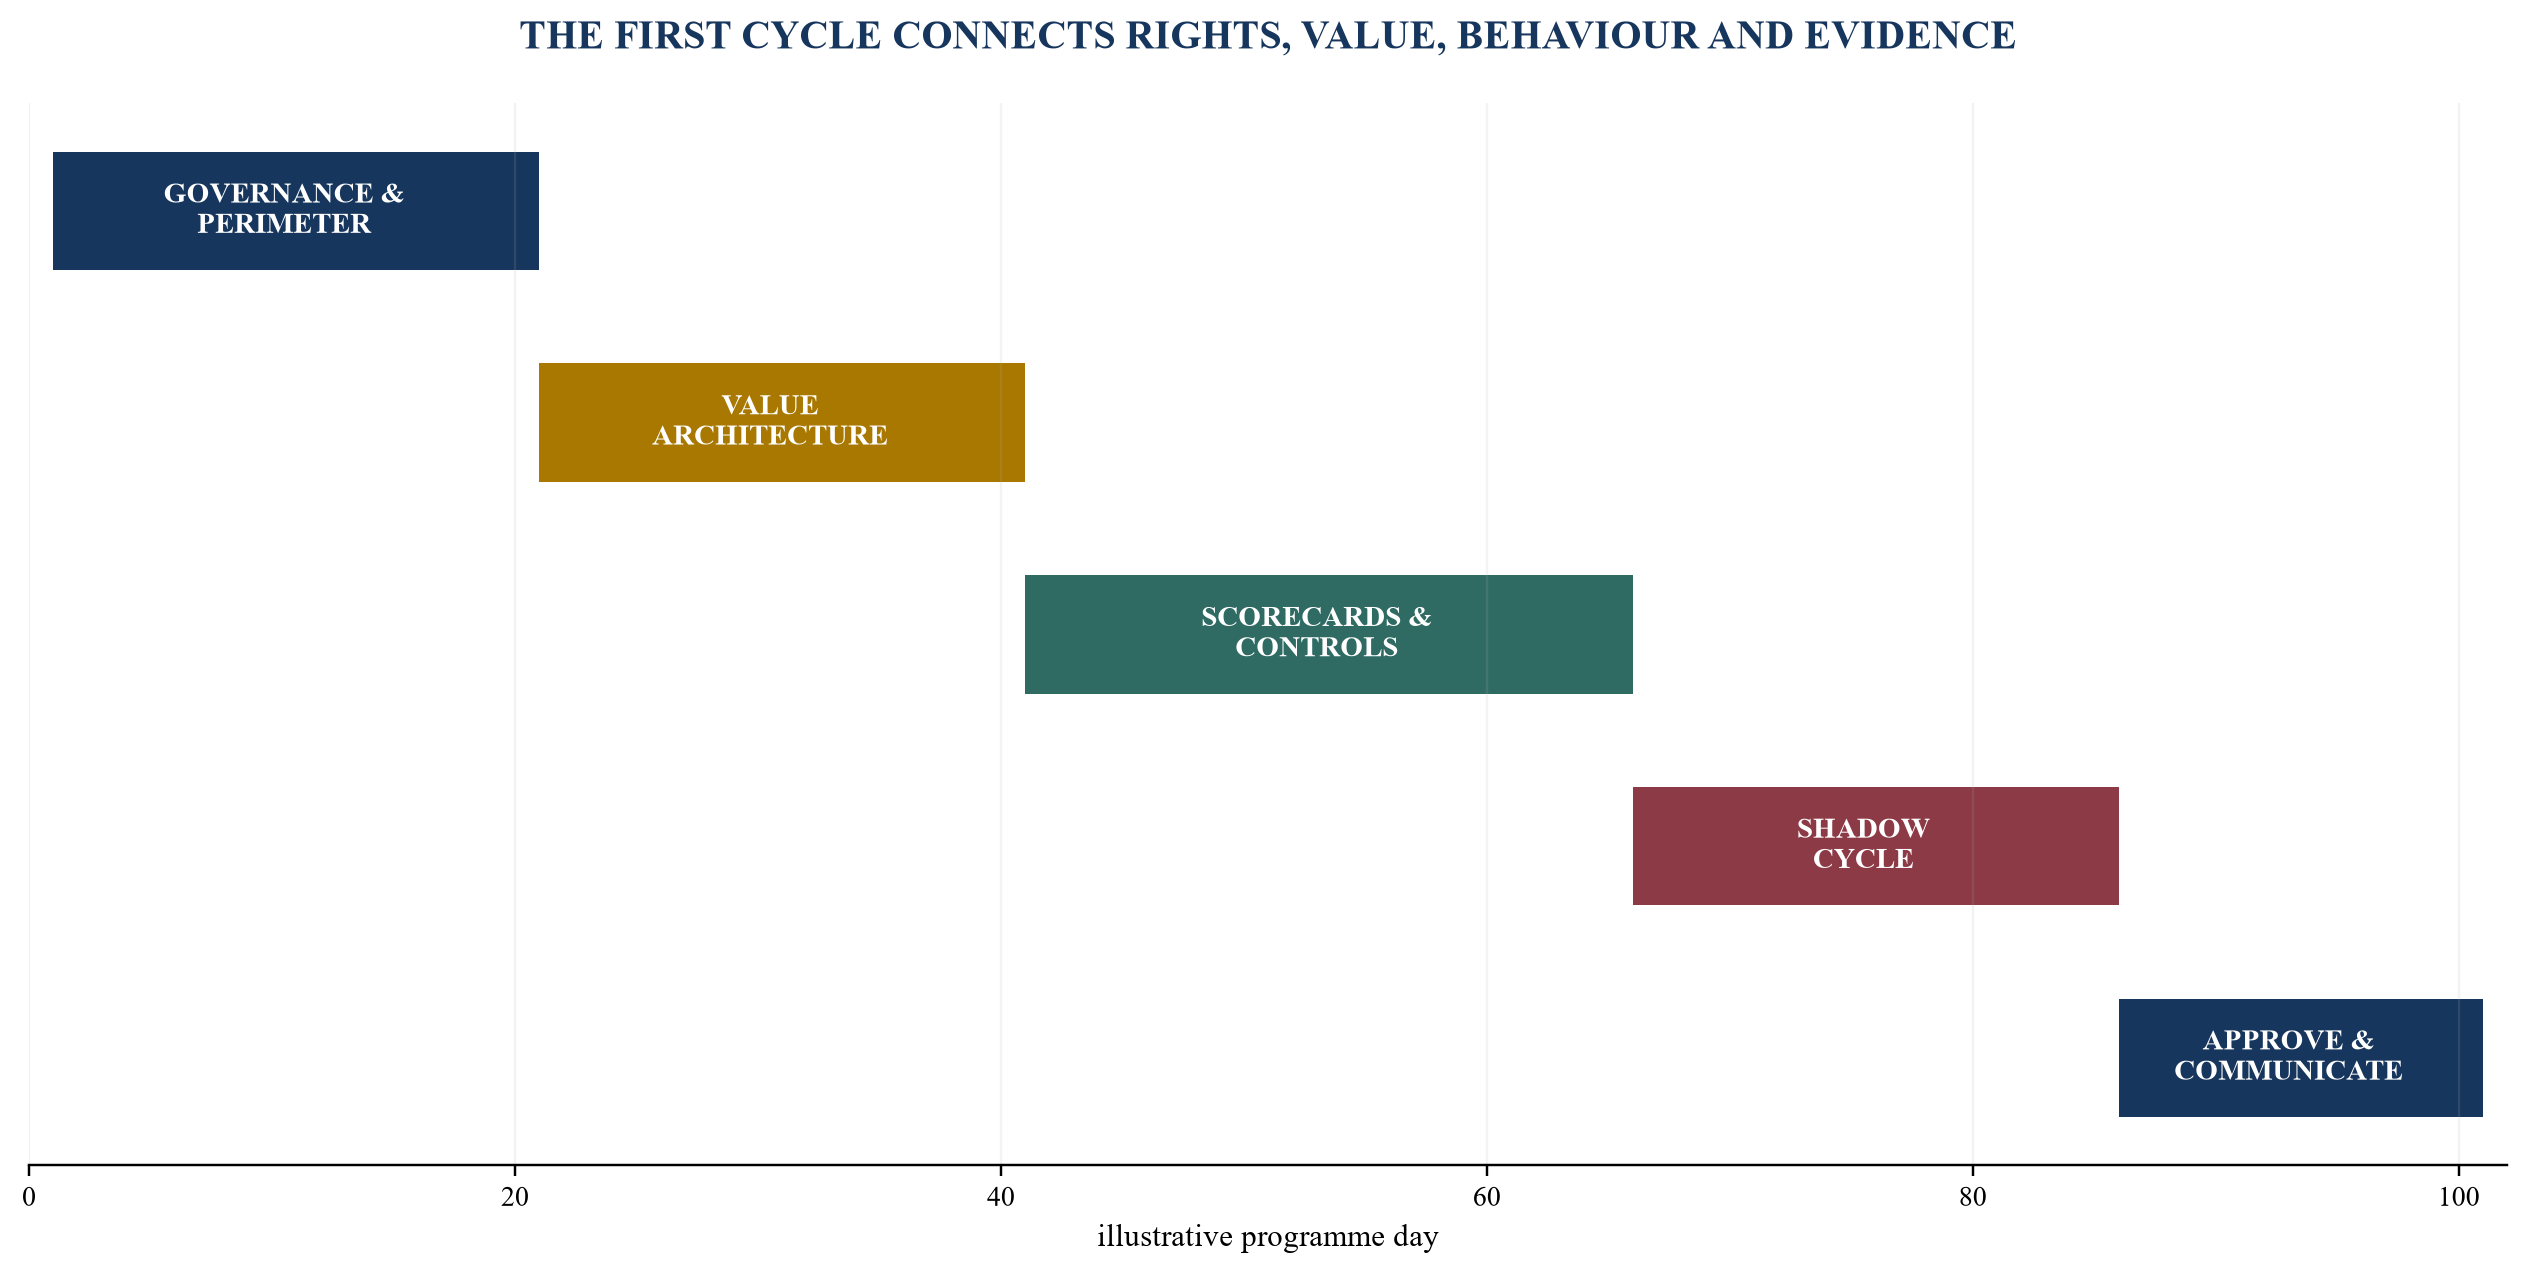
The sequence should be adapted to legal requirements, data maturity and the company's decision calendar.
23. Recognise the limits and preserve the decision boundary
An incentive system cannot prove causation between one executive action and enterprise value. Results emerge from teams, market conditions, prior investment and delayed effects. Measures simplify reality and can become less useful as strategy changes. Board judgement remains necessary, and judgement requires evidence, conflicts management and consistency.
The framework does not determine whether an award is lawful, tax-efficient, enforceable, correctly valued or appropriately accounted for. It does not replace plan documents, employment terms, securities analysis, shareholder approvals or professional advice. Cross-border participants can have different consequences under similar commercial terms.
The system also cannot guarantee retention, performance, a transaction or an investment return. It can improve clarity by connecting rights, economics, operating causes, accountability and governance. Its value should be assessed through observable management quality: fewer conflicting priorities, faster exception decisions, stronger data confidence, clearer cash and risk trade-offs, more consistent committee records and better participant understanding.
The board should review the framework when strategy, ownership, capital structure, leadership, regulation or data materially changes. It should retire measures that no longer support decisions, preserve comparability where possible and document amendments. The objective is a disciplined line from the ownership thesis to the next legitimate management action.
References
- OECD, G20/OECD Principles of Corporate Governance 2023, https://www.oecd.org/en/publications/g20-oecd-principles-of-corporate-governance-2023_ed750b30-en.html
- OECD, The Responsibilities of the Board, G20/OECD Principles of Corporate Governance 2023, https://www.oecd.org/en/publications/g20-oecd-principles-of-corporate-governance-2023_ed750b30-en/full-report/component-8.html
- OECD, Disclosure and Transparency, G20/OECD Principles of Corporate Governance 2023, https://www.oecd.org/en/publications/g20-oecd-principles-of-corporate-governance-2023_ed750b30-en/full-report/component-7.html
- OECD, Shareholder Rights and Ownership Functions, G20/OECD Principles of Corporate Governance 2023, https://www.oecd.org/en/publications/g20-oecd-principles-of-corporate-governance-2023_ed750b30-en/full-report/component-5.html
- OECD, Corporate Governance Factbook 2023, https://www.oecd.org/en/publications/oecd-corporate-governance-factbook-2023_6d912314-en.html
- Financial Reporting Council, UK Corporate Governance Code 2024, https://media.frc.org.uk/documents/UK_Corporate_Governance_Code_2024_a2hmQmY.pdf
- Financial Reporting Council, Corporate Governance Code Guidance, https://www.frc.org.uk/library/standards-codes-policy/corporate-governance/corporate-governance-code-guidance/
- UK Legislation, Companies Act 2006 Section 439, Quoted Companies: Members' Approval of Directors' Remuneration Report, https://www.legislation.gov.uk/ukpga/2006/46/section/439
- UK Legislation, Companies Act 2006 Section 439A, Quoted Companies: Members' Approval of Directors' Remuneration Policy, https://www.legislation.gov.uk/ukpga/2006/46/section/439A
- EUR-Lex, Directive EU 2017/828 as Regards the Encouragement of Long-term Shareholder Engagement, https://eur-lex.europa.eu/eli/dir/2017/828/oj
- European Commission, Stewardship and Engagement in Transition Finance, Including Shareholder Rights Directive II, https://finance.ec.europa.eu/document/download/22e45a45-85a8-4bc8-bcb1-fb0aa5f33e35_en?filename=241113-stewardship-and-engagement-in-transition-finance_en.pdf
- European Banking Authority, Guidelines on Sound Remuneration Policies under CRD, https://www.eba.europa.eu/activities/single-rulebook/regulatory-activities/remuneration/guidelines-sound-remuneration-policies-under-crd
- United States Securities and Exchange Commission, Pay Versus Performance, https://www.sec.gov/rules-regulations/2022/08/pay-versus-performance
- Electronic Code of Federal Regulations, 17 CFR 229.402 Executive Compensation, https://www.ecfr.gov/current/title-17/chapter-II/part-229/subpart-229.400/section-229.402
- United States Securities and Exchange Commission, Listing Standards for Recovery of Erroneously Awarded Compensation, https://www.sec.gov/rules-regulations/2022/10/listing-standards-recovery-erroneously-awarded-compensation
- United States Securities and Exchange Commission, Regulation S-K Compliance and Disclosure Interpretations, https://www.sec.gov/rules-regulations/staff-guidance/compliance-disclosure-interpretations/regulation-s-k
- Financial Accounting Standards Board, Compensation: Stock Compensation, https://asc.fasb.org/topic&trid=2129945
- IFRS Foundation, IFRS 2 Share-based Payment, https://www.ifrs.org/issued-standards/list-of-standards/ifrs-2-share-based-payment/
- IFRS Foundation, IAS 33 Earnings per Share, https://www.ifrs.org/issued-standards/list-of-standards/ias-33-earnings-per-share/
- Saudi Capital Market Authority, Corporate Governance Regulations, https://cma.org.sa/en/RulesRegulations/Regulations/Documents/CorporateGovernanceRegulations1.pdf
- UAE Securities and Commodities Authority, Decision Approving the Guide to the Governance of Public Joint-Stock Companies, https://www.uaecma.gov.ae/en/media-center/news/4/2/2020/chairman-of-the-board-of-directors-issues-new-decisions.aspx
- Securities and Exchange Board of India, Share Based Employee Benefits and Sweat Equity Regulations 2021, Last Amended 4 December 2025, https://www.sebi.gov.in/legal/regulations/dec-2025/securities-and-exchange-board-of-india-share-based-employee-benefits-and-sweat-equity-regulations-2021-last-amended-on-december-4-2025-_98638.html
- Singapore Exchange, Code of Corporate Governance 2018, https://rulebook.sgx.com/rulebook/code-corporate-governance-2018
- Singapore Exchange, Remuneration Matters, https://rulebook.sgx.com/rulebook/report-committee-and-code-corporate-governance
- Singapore Exchange, Listing Rule 1207, https://rulebook.sgx.com/rulebook/1207
- Australian Securities and Investments Commission, Executive Remuneration, https://asic.gov.au/regulatory-resources/corporate-governance/executive-remuneration/
- Australian Securities and Investments Commission, Board Oversight of Executive Variable Pay Decisions, https://www.asic.gov.au/regulatory-resources/corporate-governance/executive-remuneration/board-oversight-of-executive-variable-pay-decisions
- Australian Securities and Investments Commission, Information Sheet 245 Media Release, https://asic.gov.au/about-asic/news-centre/find-a-media-release/2020-releases/20-133mr-info-sheet-245-board-oversight-and-discretion-in-executive-variable-pay-schemes/
- Australian Securities Exchange, Corporate Governance Principles and Recommendations, https://www.asx.com.au/about/regulation/corporate-governance-principles-and-recommendations
- Australian Prudential Regulation Authority, CPG 511 Remuneration, https://www.apra.gov.au/practice-guides/cpg-511
- Board of Governors of the Federal Reserve System, Guidance on Sound Incentive Compensation Policies, https://www.federalreserve.gov/frrs/guidance/guidance-on-sound-incentive-compensation-policies.htm
- Board of Governors of the Federal Reserve System, Federal Reserve, OCC, OTS and FDIC Issue Final Guidance on Incentive Compensation, https://www.federalreserve.gov/newsevents/pressreleases/bcreg20100621a.htm
- Financial Stability Board, Principles for Sound Compensation Practices and Implementation Standards, https://www.fsb.org/2009/09/principles-for-sound-compensation-practices-implementation-standards/
Sources and further reading
- OECD, G20/OECD Principles of Corporate Governance 2023, Official source
- OECD, The Responsibilities of the Board, G20/OECD Principles of Corporate Governance 2023, Official source
- OECD, Disclosure and Transparency, G20/OECD Principles of Corporate Governance 2023, Official source
- OECD, Shareholder Rights and Ownership Functions, G20/OECD Principles of Corporate Governance 2023, Official source
- OECD, Corporate Governance Factbook 2023, Official source
- Financial Reporting Council, UK Corporate Governance Code 2024, Official source
- Financial Reporting Council, Corporate Governance Code Guidance, Official source
- UK Legislation, Companies Act 2006 Section 439, Quoted Companies: Members' Approval of Directors' Remuneration Report, Official source
- UK Legislation, Companies Act 2006 Section 439A, Quoted Companies: Members' Approval of Directors' Remuneration Policy, Official source
- EUR-Lex, Directive EU 2017/828 as Regards the Encouragement of Long-term Shareholder Engagement, Official source
- European Commission, Stewardship and Engagement in Transition Finance, Including Shareholder Rights Directive II, Official source
- European Banking Authority, Guidelines on Sound Remuneration Policies under CRD, Official source
- United States Securities and Exchange Commission, Pay Versus Performance, Official source
- Electronic Code of Federal Regulations, 17 CFR 229.402 Executive Compensation, Official source
- United States Securities and Exchange Commission, Listing Standards for Recovery of Erroneously Awarded Compensation, Official source
- United States Securities and Exchange Commission, Regulation S-K Compliance and Disclosure Interpretations, Official source
- Financial Accounting Standards Board, Compensation: Stock Compensation, Official source
- IFRS Foundation, IFRS 2 Share-based Payment, Official source
- IFRS Foundation, IAS 33 Earnings per Share, Official source
- Saudi Capital Market Authority, Corporate Governance Regulations, Official source
- UAE Securities and Commodities Authority, Decision Approving the Guide to the Governance of Public Joint-Stock Companies, Official source
- Securities and Exchange Board of India, Share Based Employee Benefits and Sweat Equity Regulations 2021, Last Amended 4 December 2025, Official source
- Singapore Exchange, Code of Corporate Governance 2018, Official source
- Singapore Exchange, Remuneration Matters, Official source
- Singapore Exchange, Listing Rule 1207, Official source
- Australian Securities and Investments Commission, Executive Remuneration, Official source
- Australian Securities and Investments Commission, Board Oversight of Executive Variable Pay Decisions, Official source
- Australian Securities and Investments Commission, Information Sheet 245 Media Release, Official source
- Australian Securities Exchange, Corporate Governance Principles and Recommendations, Official source
- Australian Prudential Regulation Authority, CPG 511 Remuneration, Official source
- Board of Governors of the Federal Reserve System, Guidance on Sound Incentive Compensation Policies, Official source
- Board of Governors of the Federal Reserve System, Federal Reserve, OCC, OTS and FDIC Issue Final Guidance on Incentive Compensation, Official source
- Financial Stability Board, Principles for Sound Compensation Practices and Implementation Standards, Official source
