

1. Introduction
Geopolitics enters a portfolio through cash flows, assets, contracts and market access. A tariff changes landed cost. An export control changes the equipment or customer set available to a business. A shipping disruption changes inventory days, insurance and working capital. An energy shock changes margins, inflation, interest rates and sovereign revenue. A payments restriction changes settlement and counterparty choices. These effects often arrive together.
Official assessments in 2026 illustrate the interaction. The WTO's March baseline projected world merchandise trade growth of 1.9 per cent in 2026 and 2.6 per cent in 2027. Its high-energy-price scenario reduced the 2026 merchandise figure to 1.4 per cent and services growth from 4.8 per cent to 4.1 per cent.[1] The IMF's July update projected Middle East and Central Asia growth of 0.7 per cent in 2026 followed by 6.5 per cent in 2027, reflecting the assumed timing and economic effects of the Strait of Hormuz disruption.[2] The World Bank's June Global Economic Prospects described a separate forecast based on its own assumptions, including materially slower Gulf growth in 2026 and a recovery thereafter.[3] These are forecasts and scenarios, not certainties.
The same evidence contains adaptation. The WTO Goods Trade Barometer remained above trend in June, supported by electronic components related to artificial-intelligence investment.[4] The IEA reported that new non-Gulf LNG supply partly offset lost Gulf deliveries during March to June, while warning that global gas balances remained tight and restoration timing uncertain.[5] UNCTAD reported that global foreign direct investment rose in 2025, although flows and projects were highly concentrated in a narrow set of economies and strategic sectors.[6] The UAE's network of Comprehensive Economic Partnership Agreements provides another adaptation mechanism by changing market access and commercial rules across bilateral corridors.[7]
An institutional investor therefore needs an exposure system rather than one geopolitical narrative. The Gulf can be a shock transmitter, shock absorber, strategic supplier, capital provider and growth market within the same portfolio. The role changes by country, sector, asset and financing structure.
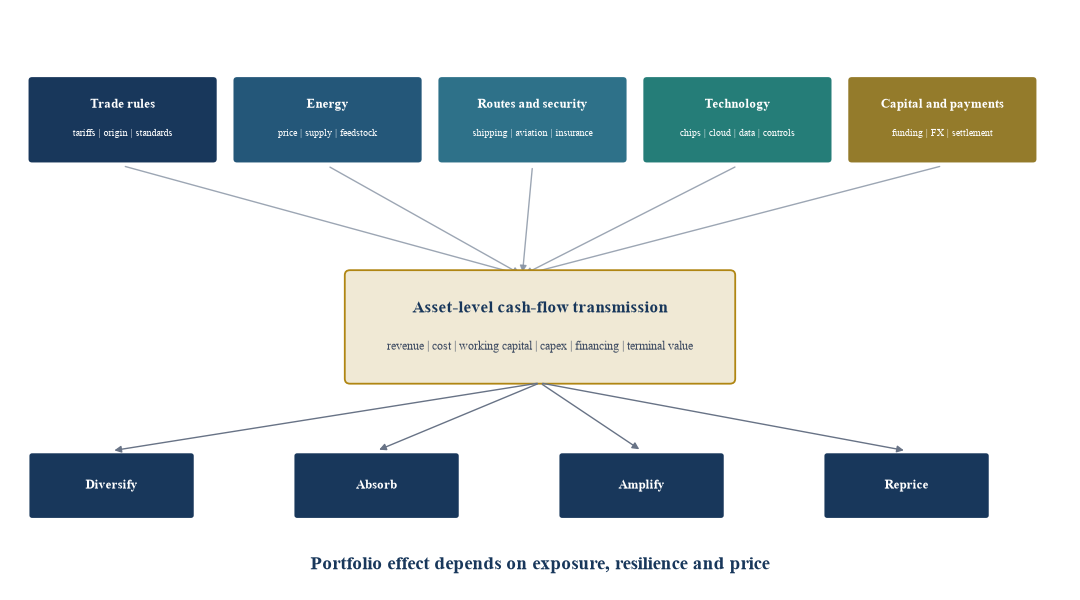
Author framework. Transmission varies by asset, contract, jurisdiction and financing structure.
2. Read official signals as a scenario set
Institutional research should preserve the differences among official sources. Each organisation uses its own data cutoff, model and assumptions. A portfolio team can use the publications as scenario inputs while retaining the source date and conditional language.
The WTO trade outlook supplies a trade-volume and services channel. Its March 2026 publication identifies slower merchandise growth after strong 2025 trade in AI-enabling products and earlier import front-loading. Its high-energy scenario estimates how persistent oil and LNG prices could affect trade and services.[1] The WTO-IMF Trade Policy Activity Index, updated through May 2026, indicates a broad rise in trade-policy activity driven predominantly by restrictive measures, alongside subsidies and other measures.[8] The index measures policy activity; it does not translate directly into a portfolio return.
The IMF and World Bank supply macroeconomic and financial transmission. The IMF July outlook describes a V-shaped regional pattern under its assumptions and substantial variation among commodity producers and countries with more diversified export routes.[2] The World Bank's June publication links the conflict shock to energy prices, inflation and borrowing costs, and presents a downside scenario involving a more severe supply disruption and financial stress.[3]
The IEA supplies physical gas-market evidence. Its July report states that the Strait disruption affected a route that had accounted for almost 20 per cent of global LNG supply. It records a 35 billion cubic metre year-on-year decline in Qatar and UAE LNG loadings from March through June, partly offset by higher non-Gulf production.[5] It also identifies effects on gas-intensive industries and fertiliser supply chains. These observations make energy security both a Gulf asset issue and a global input-cost issue.
UNCTAD supplies the capital-allocation channel. It reported global FDI of $1.6 trillion in 2025, up 6 per cent, with the top twenty host economies attracting more than 80 per cent and strategic sectors accounting for 44 per cent of greenfield project value.[6] The concentration creates exposure to technology, energy-transition and advanced-manufacturing policies even when the physical asset sits elsewhere.
Table 1. Current official signals and institutional underwriting use
| Official source | Current signal | Underwriting translation | Evidence to refresh |
|---|---|---|---|
| WTO trade outlook | slower baseline merchandise growth and a lower high-energy scenario | test volumes, landed cost, transport and services revenue | monthly trade, orders, freight and route activity |
| WTO-IMF policy index | restrictive trade-policy activity rose broadly through 2025 and 2026 | map tariff, subsidy, origin and market-access sensitivity | product-level policy changes and implementation dates |
| IMF outlook | sharp 2026 regional slowdown and 2027 rebound under its assumptions | use a path-dependent recovery scenario, country differentiation and funding stress | output, inflation, fiscal, credit and route indicators |
| World Bank outlook | energy shock, higher inflation and financing pressure | test global second-round effects and severe disruption case | oil, food, borrowing cost and financial-stress measures |
| IEA gas report | disrupted Gulf LNG, partial non-Gulf substitution and uncertain restoration | test energy revenue, feedstock, industrial availability and buyer substitution | cargoes, facility status, inventories and spot prices |
| UNCTAD investment report | FDI recovery concentrated in hosts, sectors and megaprojects | test crowding, strategic-sector policy and project execution | announced and realised investment by sector and economy |
| UAE CEPA programme | bilateral agreements expand defined market-access routes | underwrite agreement-specific tariff and rule-of-origin benefits | entry into force, product schedules and utilisation |
Forecasts and scenarios remain conditional on each source's assumptions and data cutoff.
3. Define the Gulf as a portfolio hinge
A hinge connects systems and carries stress between them. The Gulf plays this role across energy, trade, logistics, capital and technology. The description is analytical. It does not imply that every Gulf asset benefits from cross-border connectivity.
The first connection is energy. Gulf producers affect global oil, LNG, petrochemical and fertiliser markets. Export route, facility, contract and product matter. A producer with alternative routes has a different risk profile from one reliant on a single waterway. A downstream industrial asset may benefit from feedstock access and face export, power or logistics constraints at the same time.
The second connection is commerce. Ports, free zones, airlines, warehouses, trading companies and financial centres connect Europe, Asia and Africa. Their revenue can diversify across origins and destinations. Their operating model can also concentrate route, insurance, airspace, customs and sanctions exposure.
The third connection is domestic transformation. Public investment, population growth, tourism, infrastructure, industrial policy and service-sector development can support locally generated cash flow. The investment case still needs fiscal sensitivity, contractor exposure, labour inputs, imported equipment and demand quality.
The fourth connection is capital. Sovereign investors, family offices, pension institutions, banks and capital markets can fund regional and global assets. A portfolio should distinguish domestic-liquidity support from global-market beta, state-linked counterparties from private demand, and committed capital from executable financing.
The fifth connection is technology. AI infrastructure, data centres, cloud services, fintech and advanced industry link electricity, cooling, land, networks, semiconductors, data rules and international vendors. UNCTAD's evidence on strategic-sector investment concentration and WTO evidence on AI-enabling trade show why technology exposure needs supply-chain and policy decomposition.[4][6]
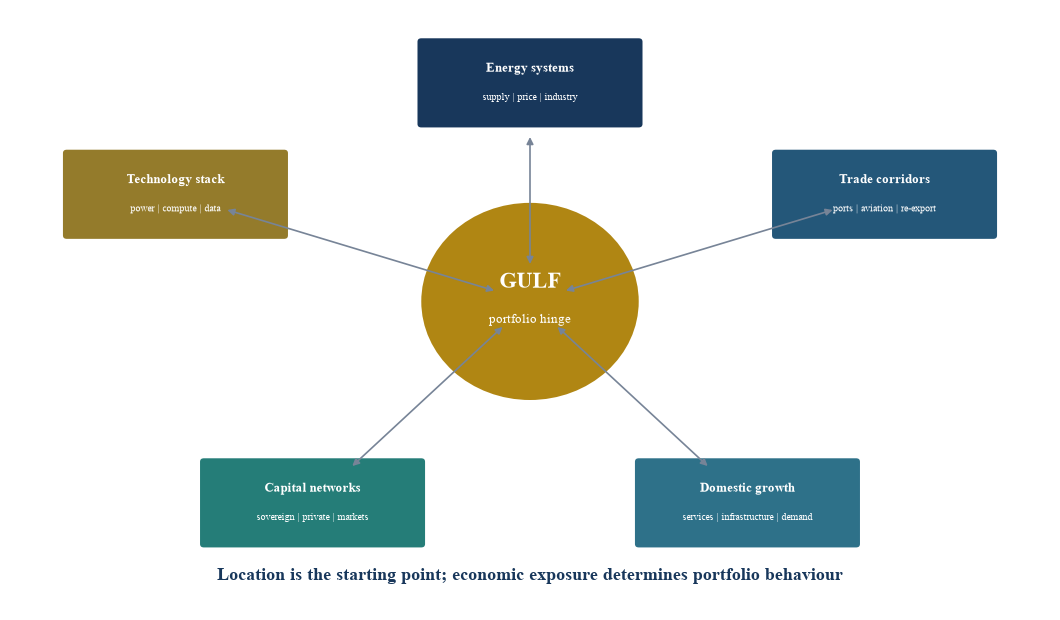
Author framework. Each system can create opportunity, dependence or both.
4. Build an asset-level exposure dictionary
The exposure dictionary is a structured record for every asset, fund and material counterparty. It separates legal location, operating location and economic exposure. A UAE-domiciled company can earn revenue in South Asia, buy European equipment, settle in US dollars and ship through several corridors. A global company can have Gulf demand, energy or capital dependencies without regional domicile.
Revenue exposure records customer country, customer concentration, contract currency, indexation, term, termination rights and collection history. It distinguishes domestic demand, intra-GCC demand, exports and re-exports. It identifies whether a customer is public, government-related or private.
Input exposure records energy, feedstock, equipment, components, labour, water, data and critical services. For each material input, the schedule identifies origin, supplier, substitutability, inventory, qualification time and switching cost. Technology inputs need export-control, licensing and vendor-support fields.
Corridor exposure records port, airport, waterway, land route, pipeline and digital connectivity. It identifies normal and alternative routes, capacity, transit time, insurance, customs, security and contractual allocation of delay cost. The IEA's current LNG evidence demonstrates why a route field cannot be replaced by country exposure.[5]
Financial exposure records currency, debt source, maturity, covenant, interest-rate basis, hedging, cash location and settlement bank. It also identifies committed facilities, conditions precedent and refinancing assumptions. A currency peg can reduce one form of volatility while leaving liquidity, basis, counterparty and funding risks.
Policy exposure records licence, concession, tariff, subsidy, local-content requirement, data rule, foreign-ownership rule, tax, sanctions and trade agreement. The field should link to the governing instrument and review date. CEPA benefits should be attributed to the relevant product, origin rule and effective agreement rather than a general country narrative.[7]
Table 2. Minimum asset-level multipolar exposure dictionary
| Exposure domain | Required fields | Key test | Portfolio use |
|---|---|---|---|
| Revenue | customer market, concentration, contract, currency, indexation and collection | which political or economic event changes demand or payment? | cash-flow sensitivity and concentration limit |
| Inputs | energy, feedstock, equipment, technology, labour, water and critical service | how long and at what cost can the asset substitute? | margin, capex and continuity stress |
| Corridors | normal route, alternatives, capacity, transit, insurance, customs and security | can the asset operate during route impairment? | working capital, inventory and liquidity reserve |
| Currency and funding | debt, maturity, rate, hedge, cash location, banks and settlement | which market closure or repricing creates a funding gap? | refinancing risk and currency risk budget |
| Counterparties | owners, customers, suppliers, lenders, insurers and state links | where does control, sanctions or credit risk enter? | limits, diligence and escalation rights |
| Policy | licence, concession, tariff, origin, local content, data, tax and sanctions | which rule protects or impairs the investment case? | scenario trigger and valuation adjustment |
| Security and continuity | facilities, people, cyber, transport and business continuity | what is the tested recovery path? | insurance, reserve and operational remedy |
| Liquidity and exit | market depth, buyer universe, transfer rights and exit routes | how does fragmentation change time to exit? | pacing, valuation and portfolio liquidity |
Materiality thresholds should reflect the strategy, asset and investment committee mandate.
5. Convert the dictionary into a factor ledger
The factor ledger aggregates asset fields into portfolio-relevant exposures without losing the underlying evidence. It allows the committee to see where apparently different holdings share the same economic dependency.
An energy factor includes production volume, realised price, feedstock cost, electricity intensity and transport route. A trade factor includes tariff, origin, customer market and customs exposure. A route factor includes chokepoints, airports, ports, pipelines and alternative capacity. A technology factor includes restricted components, cloud concentration, data residency and vendor dependence. A financial factor includes dollar funding, local liquidity, interest rates and refinancing dates.
Each exposure receives three attributes. Magnitude estimates the share of value or cash flow affected. Sensitivity estimates the direction and shape of the response. Resilience records the contractual, operational and financial mitigants. Confidence records the quality and age of evidence.
The ledger avoids false netting. Oil-price upside for one holding may offset input-cost pressure elsewhere at portfolio level, but the cash flows can arrive at different times and in different currencies. A sovereign or energy-linked gain cannot be assumed to fund a private asset during a market closure. Liquidity and ownership remain separate.
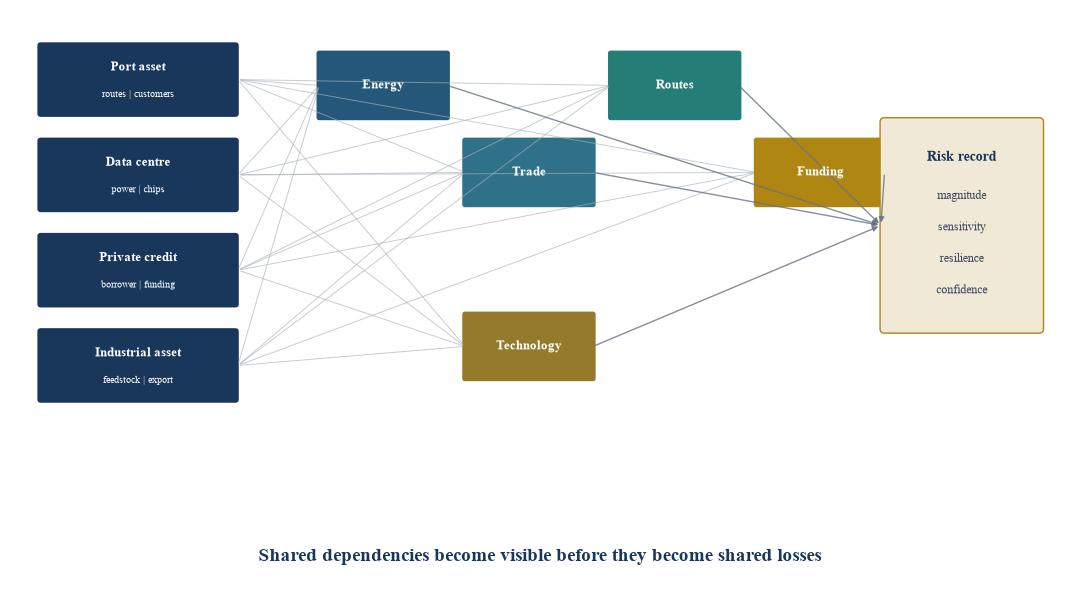
Author framework. Common-factor aggregation preserves asset and evidence identifiers.
6. Underwrite sectors through transmission channels
Sector labels need a transmission statement. Energy assets depend on product, route, contract, cost position, capex and fiscal terms. Logistics assets depend on throughput origin and destination, route alternatives, insurance and customer concentration. Banks and private-credit portfolios depend on borrower exposure, liquidity, collateral, refinancing and sovereign-financial linkages.
Real estate separates domestic occupancy from tourism, trade, expatriate demand, construction inputs and financing. A residential asset serving local households behaves differently from a hotel, logistics warehouse or office tied to international business. Development assets add imported-material, contractor and completion risk.
Digital infrastructure combines domestic capacity demand with globally concentrated equipment and cloud ecosystems. Data-centre value can benefit from AI investment and regional data needs. Delivery depends on grid capacity, generation, cooling, fibre, chips, vendor support and customer contracts. The WTO's 2026 evidence on above-trend electronic-component trade provides a current demand signal, while UNCTAD's strategic-sector concentration warns that capital and policy are clustered.[4][6]
Consumer and healthcare assets can have locally generated demand and imported input exposure. Industrial assets can benefit from energy and logistics positioning while relying on export markets and specialist equipment. Fund investments add manager, valuation, liquidity and underlying-asset transparency.
Table 3. Illustrative Gulf sector transmission map
| Sector | Potential portfolio role | Main fragmentation channels | Required resilience evidence |
|---|---|---|---|
| Energy and petrochemicals | strategic supply and price exposure | route, facility, contract, feedstock, sanctions and fiscal terms | route alternatives, cost curve, insurance, liquidity and restoration plan |
| Ports, aviation and logistics | corridor connectivity and trade services | traffic, airspace, chokepoint, insurance, customs and customer mix | alternative network, capacity, contracts and continuity testing |
| Banks and private credit | domestic growth funding and income | borrower concentration, liquidity, collateral, sovereign link and refinancing | look-through exposures, funding ladder, stress tests and workout rights |
| Real estate | domestic demand, tourism, logistics and inflation linkage | occupancy, visitors, trade, construction input, rates and refinancing | tenant data, pre-leasing, fixed-price contracts and debt headroom |
| Digital infrastructure | AI, cloud and data capacity | grid, chips, export control, cloud, fibre, water and cyber | reserved power, vendor alternatives, permits, contracts and recovery tests |
| Industrial and manufacturing | diversification, local content and export growth | energy, equipment, origin, tariff, customer market and logistics | qualification, inventory, corridor options and CEPA utilisation evidence |
| Consumer and healthcare | population and service demand | imported inputs, labour, inflation, reimbursement and currency | supplier diversity, pricing power, working capital and staffing plan |
| Private funds | specialist sourcing and operational access | look-through exposure, valuation, liquidity, key person and capital calls | data standard, exposure reporting, side-letter rights and liquidity plan |
The table identifies questions for diligence; it does not assign expected returns.
7. Treat trade agreements as asset-level options
The UAE describes its CEPA programme as a mechanism to improve market access, reduce or remove tariffs, facilitate customs and establish clearer rules.[7] The Ministry lists agreements across a broad set of partners. One example, the UAE-Azerbaijan CEPA, entered into force on 15 April 2026 and links the UAE with a Caucasus and Central Asian corridor.[9]
An agreement creates an option only when the asset can use it. Diligence should confirm the product classification, rule of origin, tariff schedule, customs documentation, services provision, investment terms and effective date. The company must have systems to document origin and claim preference. Capacity, customer demand, shipping and working capital still determine economics.
The portfolio team should maintain a corridor register. Each register entry identifies the agreement, partner, covered products or services, asset relevance, utilisation, value captured and operational constraint. A scenario can then test the loss of one corridor and substitution through another.
Trade agreements can also affect exit. A buyer may value an operating platform with proven access and compliance capability across several corridors. The investment case should separate realised commercial evidence from strategic narrative.
8. Make energy security a two-sided portfolio factor
Energy exposure has revenue and cost sides. Higher hydrocarbon prices can improve producer revenue and fiscal capacity. They can reduce margins for transport, manufacturing and energy-importing customers, raise inflation and tighten financial conditions. Physical disruption can prevent a producer from realising the price benefit.
The IEA's Q3 2026 report provides a live example of substitution and constraint. It estimated that non-Gulf LNG production grew by about 27 billion cubic metres year on year during March to June and offset around three quarters of the decline in Gulf LNG deliveries over that period.[5] Global LNG production still fell by about 4 per cent. The institutional lesson is that alternative supply can reduce a shock without restoring the original asset's cash flow.
An energy ledger should record production location, facility, evacuation route, customer, contract type, price formula, cost, insurance, storage and alternative capacity. For energy-consuming assets, it records fuel source, tariff, pass-through, efficiency, backup and curtailment plan.
The committee should examine timing. Producer cash may arrive after lifting resumes. Consumer margin pressure can occur immediately. Public spending can be buffered by reserves or reduced by fiscal prioritisation. Inflation and interest rates can affect global holdings beyond the Gulf. Liquidity reserves should reflect these lags.
9. Separate physical security from market risk
Physical continuity, market price and legal enforceability are different risks. A listed security can remain tradable while its operating asset is impaired. A private asset can operate while refinancing markets are closed. A contract can allocate force majeure without eliminating the cash-flow loss.
The security record should identify facility protection, people, evacuation, cyber, supplier continuity, transport, communications, insurance and recovery. It should record the last test, owner, dependency and unresolved action. Sensitive detail belongs in controlled systems and specialist reviews.
Insurance needs policy-level review. The committee should understand insured peril, exclusion, sublimit, deductible, waiting period, business-interruption basis, counterparty, claims process and reinstatement. An insured value should not be treated as available liquidity before coverage and collection are assessed.
Legal and sanctions analysis requires qualified advice and current screening. Ownership, control, counterparties, goods, vessels, banks, currencies and end use can all matter. The investment team needs escalation and abstention rules, evidence retention and periodic rescreening.
10. Construct scenarios without pretending to predict events
A scenario is a coherent set of variables. It is valuable because it exposes dependencies and decision thresholds. It is not a forecast unless the organisation explicitly adopts it as one.
The baseline should use the institution's approved macro and market assumptions with a stated date. The policy-fragmentation case adds tariffs, export controls, subsidies, origin requirements and slower trade. The energy-route case adds physical constraint, high prices, insurance and transport effects. The technology-split case adds restricted components, vendor separation, data rules and duplicated capex. The compound case combines route, policy and financial stress.
Each scenario specifies duration, recovery shape and second-round effects. A short interruption with rapid restoration differs from a multi-quarter impairment that changes supply chains. The IMF, World Bank and IEA publications demonstrate how assumptions about closure and restoration timing materially affect reported forecasts.[2][3][5]
Asset models should translate the variables into volume, price, cost, working capital, capex, funding, covenant and exit. The portfolio model then aggregates shared factors and liquidity. Outputs should show ranges and drivers. Decimal precision cannot compensate for uncertain assumptions.
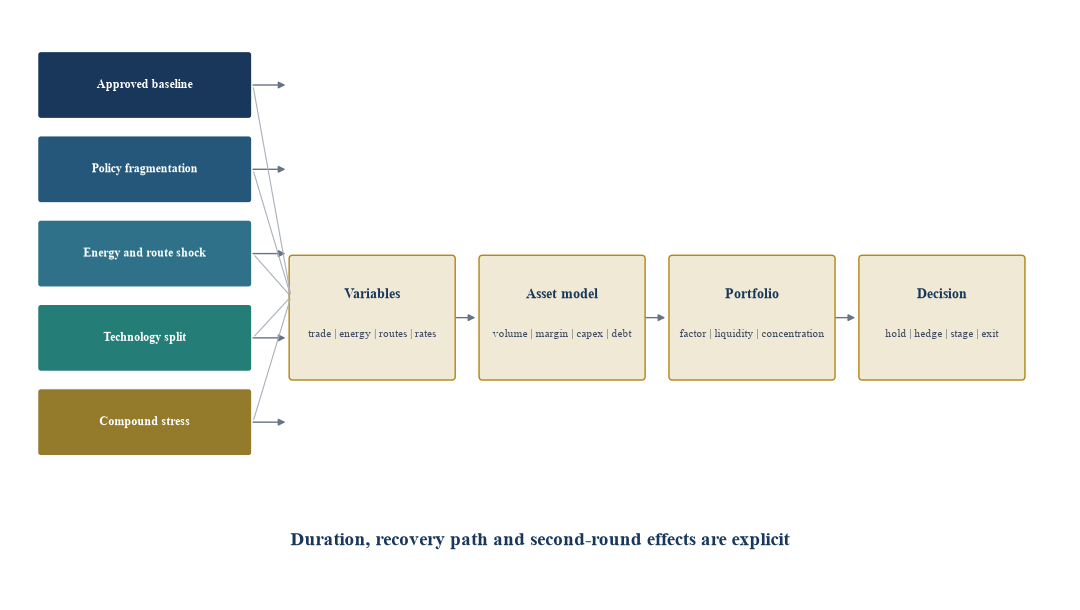
Author framework. Scenario variables and durations are approved management assumptions.
Table 4. Scenario specification for a multipolar portfolio
| Scenario | Variable set | Asset model response | Portfolio decision test |
|---|---|---|---|
| Approved baseline | current approved growth, prices, rates, trade and route assumptions | plan cash flow, funding and exit | does the investment meet mandate and return requirements? |
| Policy fragmentation | tariff, export control, subsidy, origin, data and investment-screening changes | landed cost, market access, capex and customer change | where does shared policy exposure exceed budget? |
| Energy and route shock | supply impairment, oil and gas price, freight, insurance and delay | revenue, feedstock, inventory, working capital and continuity | is liquidity sufficient through the assumed duration? |
| Technology split | component restriction, cloud separation, data rule and duplicated systems | delivery delay, vendor change, compliance and capex | which assets lack qualified alternatives or contractual relief? |
| Funding stress | wider credit spread, lower market depth, delayed exit and bank constraint | interest, covenant, refinancing, valuation and distributions | which commitments compete for the same liquidity? |
| Compound stress | selected policy, physical, energy, technology and funding variables | integrated downside and recovery path | which pre-agreed actions protect solvency and strategic option value? |
Values, durations and probabilities should be approved and documented by the institution.
11. Allocate through risk budgets, pacing and liquidity
A regional target is incomplete. The portfolio needs limits for the shared factors identified in the ledger. Examples include exposure to one export route, one government-related counterparty, one commodity price, one technology vendor, one funding market or one currency settlement channel.
Risk budgets can be expressed through capital at risk, cash-flow sensitivity, liquidity need and concentration. Private assets need commitment pacing and capital-call stress. Listed assets need market depth and settlement analysis. Direct investments need operational and governance rights.
Staging preserves option value. An institution can commit in tranches, use milestones, negotiate conditions precedent, syndicate exposure, hold co-investment capacity or obtain information rights before increasing capital. The structure should match the risk. A minority equity position has different remedies from senior secured credit or a controlled platform.
The liquidity reserve should cover portfolio obligations under the compound scenario, including capital calls, margin, debt service, working capital and remediation. It should use cash that is legally and operationally available. Expected distributions from stressed assets should be discounted or excluded according to policy.
12. Demonstrate the method with a hypothetical portfolio
Consider a hypothetical 100-unit global alternatives portfolio. It allocates 18 units to Gulf-related exposures: five to energy and industrial assets, four to logistics and trade infrastructure, three to digital infrastructure, three to private credit, and three to domestic services and real estate. The remaining 82 units are spread across other regions and strategies. Every number in this example is a management assumption for demonstration.
The location view reports 18 Gulf units. The factor ledger reports different totals because assets can carry several exposures. It identifies 11 units sensitive to energy prices, eight to Gulf transport corridors, seven to government-related demand, six to restricted technology inputs, ten to US-dollar refinancing and five to tourism or aviation. The portfolio also has non-Gulf assets with Gulf energy and route exposure.
Management assumes a compound stress lasting two quarters followed by a gradual four-quarter recovery. It assigns no claim of likelihood. The scenario reduces near-term value across route-dependent and leveraged holdings and improves some upstream energy cash flows. The liquidity model assumes delayed distributions and additional working capital. The committee responds through a larger reserve, reduced concentration in one corridor, staged digital-infrastructure capex and tighter reporting rights.
The example shows why net regional exposure can mislead. A positive energy-price sensitivity does not eliminate a physical export constraint. Domestic revenue can provide resilience while imported equipment delays capex. A dollar peg can reduce currency volatility while refinancing remains exposed to global rates.
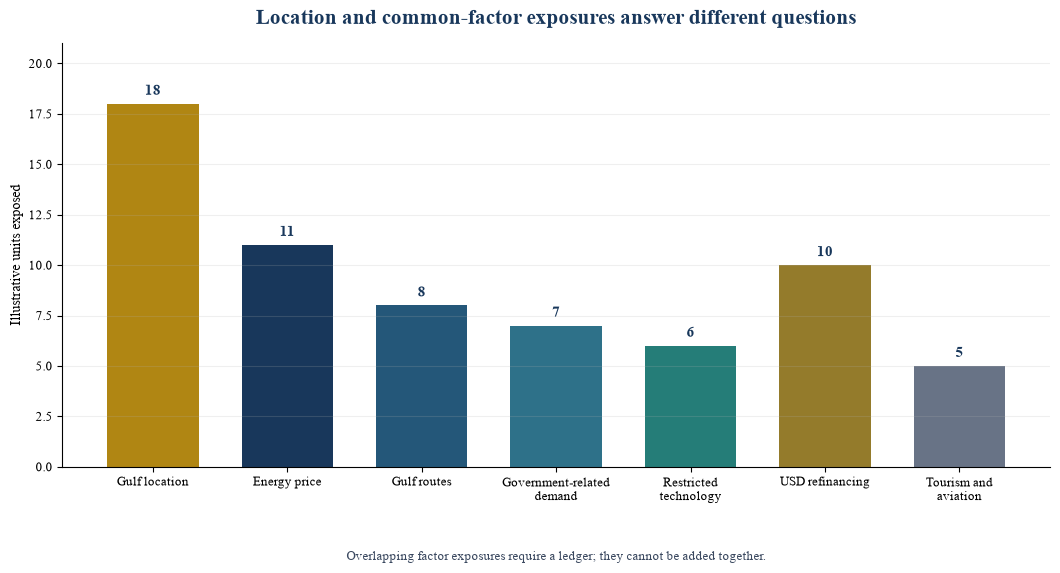
All values are management assumptions created solely to demonstrate the method. Factor exposures overlap and do not sum to portfolio size.
13. Establish decision rights before a shock
The investment policy should identify who owns the evidence, scenario, action and communication. The portfolio team maintains exposures and valuation. Risk challenges assumptions and aggregates factors. Operations confirms cash, settlement and continuity. Legal and compliance address contracts, sanctions and market access. The investment committee approves limits, exceptions and material actions.
Triggers should connect to decisions. A route trigger can require a liquidity refresh and asset-level continuity confirmation. A policy trigger can freeze new exposure until origin, licence or export-control analysis is complete. A funding trigger can reduce commitment pacing. A security trigger can activate specialist review and controlled communications.
Decision rights matter across funds. A limited partner may have information and advisory-committee rights while the manager controls assets. A direct lender may have covenants and security. A minority shareholder may need reserved matters and information rights. The portfolio record should distinguish influence from control.
Communication should use a verified fact record with timestamps and source owners. Market commentary, official announcements, manager reports and internal estimates remain separate. This discipline reduces the risk that an unverified headline enters valuation or action as fact.
14. Operate a multipolar monitoring dashboard
The dashboard joins high-frequency signals to slower asset evidence. It is designed to prompt investigation and decisions. It does not automate an investment conclusion.
Trade indicators include WTO releases, product-level policies, customs time, order data and corridor utilisation. Energy indicators include production, cargoes, route status, inventories, prices and industrial curtailment. Transport indicators include vessel and flight activity, freight, insurance and alternative-route capacity. Financial indicators include spreads, liquidity, exchange basis, refinancing and settlement.
Asset evidence includes revenue, margin, cash, inventory, capex, covenant, incidents and customer or supplier changes. The portfolio team links each indicator to affected holdings. A stale or missing field receives an owner and deadline.
The committee receives a concise decision pack. It shows changes since the prior meeting, threshold breaches, source confidence, liquidity, valuation sensitivity and recommended actions. A separate annex preserves detailed evidence and model versions.
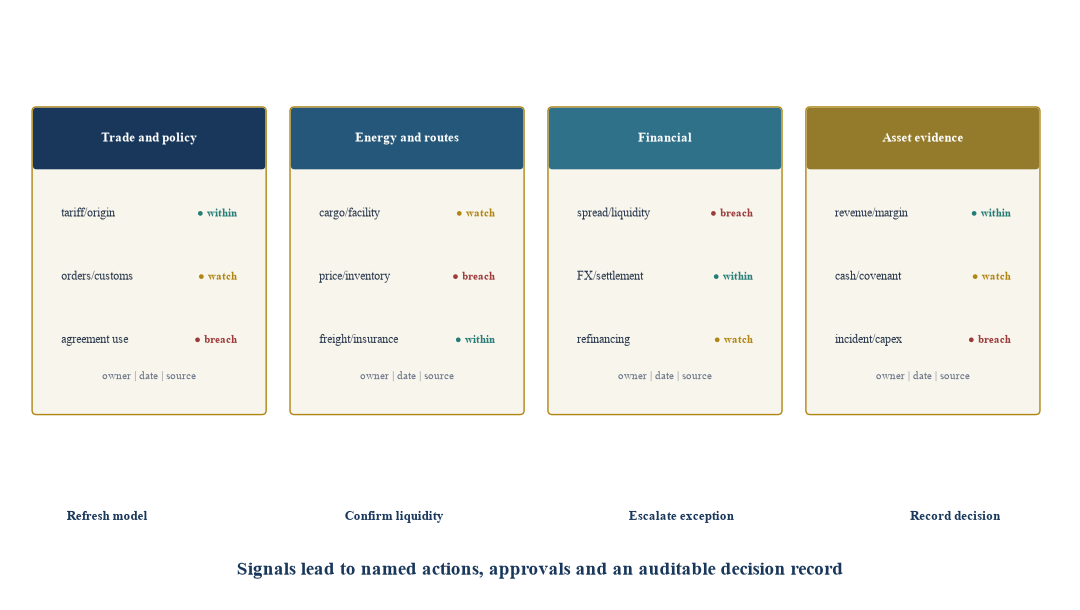
Author framework. Thresholds and escalation rules require institutional approval.
Table 5. Multipolar portfolio monitoring pack
| Frequency | Evidence | Portfolio output | Decision owner |
|---|---|---|---|
| Daily or event-driven | official route, security, sanctions, facility and market notices | affected holdings, immediate liquidity and compliance action | operations, compliance and portfolio lead |
| Weekly during stress | cargoes, flights, freight, insurance, energy, spreads and manager updates | scenario refresh, cash runway and threshold report | portfolio risk group |
| Monthly | trade policy, orders, customers, suppliers, inventory, capex and refinancing | factor ledger changes and pacing proposal | portfolio management |
| Quarterly | financial statements, valuation, covenants, exposures and continuity testing | investment-committee pack and risk-budget use | investment committee |
| Annual | strategy, mandate, counterparty, insurance, legal terms and scenario design | policy, limit and governance review | board or delegated committee |
| Transaction-driven | new asset, financing, exit or material contract | complete exposure dictionary and downside case | transaction committee |
Frequency should increase when a trigger or material event occurs.
15. Implement the architecture in twelve weeks
Weeks one and two establish scope and governance. The institution defines the portfolios, entities, asset classes and decisions covered. It appoints owners for investments, risk, treasury, operations, legal and compliance. It records existing regional and factor limits.
Weeks three and four create the exposure dictionary. The team inventories holdings and funds, assigns stable identifiers and captures revenue, inputs, corridors, currencies, counterparties, policy, security and liquidity. It records source, date and confidence.
Weeks five and six build the factor ledger and corridor register. The team maps common dependencies, prevents double counting and identifies missing look-through data. Fund managers and asset teams receive targeted data requests.
Weeks seven and eight design scenarios. The institution approves variables, duration, recovery paths and second-round effects. Asset owners translate the shocks into cash flow, working capital, capex, debt and exit. Treasury completes the portfolio liquidity model.
Weeks nine and ten set risk budgets, pacing and decision rights. Limits reflect route, commodity, technology, counterparty and funding concentrations. Legal and compliance confirm information, covenant, sanctions and governance routes.
Weeks eleven and twelve launch the dashboard and committee pack. The team tests one event, validates escalation and freezes a controlled version. Refresh dates, exception owners and change logs enter normal portfolio operations.
Table 6. Twelve-week multipolar portfolio implementation
| Weeks | Workstream | Deliverable | Approval gate |
|---|---|---|---|
| 1 to 2 | scope and governance | portfolio perimeter, owners, decisions and current limits | mandate and accountability accepted |
| 3 to 4 | exposure dictionary | asset-level revenue, input, corridor, currency, policy and liquidity data | material holdings have dated source records |
| 5 to 6 | factor and corridor mapping | common dependencies, confidence and data-gap register | concentration and missing evidence are visible |
| 7 to 8 | scenarios and liquidity | approved variables, asset translations and cash requirement | models reconcile and durations are explicit |
| 9 to 10 | limits and rights | risk budgets, pacing, triggers, covenants and escalation | committee can act through available rights |
| 11 to 12 | operating launch | dashboard, committee pack, event test and change log | controlled process enters quarterly operation |
Timing should reflect data availability, strategy complexity and live transaction requirements.
16. Limitations and conclusion
Geopolitical and macroeconomic conditions can change quickly. The official publications cited in this paper have different dates, scopes and assumptions. Forecasts and scenarios should be refreshed from their source and should retain their conditional status.
The Gulf is not one exposure. Countries, currencies, fiscal positions, legal regimes, routes, industries and assets differ. The framework requires country and asset analysis, specialist legal and sanctions advice, technical diligence and local evidence.
Data can be incomplete. Private funds may provide limited look-through information. Security information may be restricted. Commercial contracts can be confidential. The investment file should record the actual evidence reviewed, access limitation and decision effect.
The hypothetical portfolio uses management assumptions solely to demonstrate mechanics. It does not describe Matchpoint Partners, a client, a market portfolio, a target allocation, expected performance or a probability forecast.
A multipolar portfolio begins with transparency. The institution identifies how trade rules, energy, routes, technology and finance enter each holding. It aggregates common factors, tests coherent scenarios, reserves liquidity and defines action rights. This approach allows a Gulf allocation to be judged by the cash flows, resilience and strategic options it contributes.
The Gulf's portfolio role can include energy exposure, corridor access, domestic transformation, capital networks and technology infrastructure. Each role carries dependencies. Institutional advantage comes from seeing those dependencies early, pricing them, structuring the investment and maintaining an evidence-led decision system as the world changes.
References
- [1] World Trade Organization, Global Trade Outlook and Statistics, March 2026. https://www.wto.org/english/res_e/publications_e/gtos0326_e.htm
- [2] International Monetary Fund, World Economic Outlook Update: Global Economy in Crosscurrents of War and Technology, July 2026. https://www.imf.org/-/media/files/publications/weo/2026/update/july/english/text.pdf
- [3] World Bank, Global Economic Prospects, June 2026, press release and report portal. https://www.worldbank.org/en/news/press-release/2026/06/11/global-economic-prospects-june-2026-press-release
- [4] World Trade Organization, Goods Trade Holding Up Despite Middle East Conflict and High Energy Prices, 5 June 2026. https://www.wto.org/english/news_e/news26_e/wtoi_05jun26_405_e.htm
- [5] International Energy Agency, Gas Market Report, Q3 2026, published 7 July 2026. https://www.iea.org/reports/gas-market-report-q3-2026/executive-summary
- [6] UN Trade and Development, World Investment Report 2026: International Investment in a Turbulent Era, 7 July 2026. https://investmentpolicy.unctad.org/publications/1324/world-investment-report-2026-international-investment-in-a-turbulent-era
- [7] UAE Ministry of Economy and Tourism, Comprehensive Economic Partnership Agreements, accessed 12 August 2026. https://www.moet.gov.ae/en/cepa
- [8] World Trade Organization, Updated WTO-IMF Trade Policy Activity Index Shows Continued Rise in Global Trade Policy Activity, 23 July 2026. https://www.wto.org/english/news_e/news26_e/rese_23jul26_463_e.htm
- [9] UAE Ministry of Economy and Tourism, UAE-Azerbaijan Comprehensive Economic Partnership Agreement, accessed 12 August 2026. https://www.moet.gov.ae/en/cepa-azerbaijan
- [10] World Trade Organization, Middle East Conflict Weighs Further on Slowing Trade Outlook, 19 March 2026. https://www.wto.org/english/news_e/news26_e/stat_19mar26_329_e.htm
- [11] International Monetary Fund, World Economic Outlook Update Press Briefing Transcript, 8 July 2026. https://www.imf.org/en/news/articles/2026/07/08/tr070826-weo-press-briefing-transcript-july-8-2026
- [12] UN Trade and Development, World Investment Report series and 2026 regional materials. https://unctad.org/topic/investment/world-investment-report
- [13] World Bank, Conflict Hits MENAAP Economies, 8 April 2026. https://www.worldbank.org/en/news/press-release/2026/04/08/conflict-hits-menaap-economies-underscoring-need-for-action-to-boost-resilience-create-jobs
- [14] International Energy Agency, Gas Market Report Q3 2026 report page and citation information. https://www.iea.org/reports/gas-market-report-q3-2026
