

Introduction
Electricity prices can fall below zero when the system has more offered generation than it can absorb, move or store. A negative price tells market participants that an additional unit of electricity imposes a short-run system cost. The condition can arise from high wind or solar output, low demand, transmission congestion, inflexible thermal or nuclear generation, environmental constraints on hydropower, production incentives, must-run obligations and the cost of shutting down and restarting equipment.
The frequency of negative prices has increased in several mature electricity markets. ACER reported that the share of negatively priced time across the European Union and Norway rose from 1.9 percent in 2023 to 2.8 percent in 2024. Its country data showed much higher exposure in some bidding zones. AEMO reported negative prices in 23.1 percent of National Electricity Market dispatch intervals in the fourth quarter of 2024. The IEA identified negatively priced hours in Southern California above 20 percent in the first half of 2024 and about 20 percent in South Australia since 2023. These measures use different market intervals and geographies, so they should not be treated as directly comparable benchmarks.
The financing question begins after the market statistic. A project earns the price, contract settlement and ancillary revenue that apply to its node, profile and dispatch. A solar plant may receive a fixed physical tariff, a financial swap, a contract for difference, a merchant price or a combination. A battery can be paid for charging during negative intervals, earn discharge revenue later, provide reserves and capacity, or lose value through congestion, degradation and market saturation. A lender receives debt service from the resulting cash flow rather than from the headline market average.
This paper sets out a practical framework for connecting the market event to project cash flow and financing. It is designed for boards, investment committees, developers, utilities, storage operators, lenders, infrastructure funds, corporate offtakers and transaction advisers. The analysis covers observed market data, contractual allocation, operating control, downside modelling and governance. Jurisdiction-specific rules and contracts require local legal, regulatory, tax, accounting and technical advice.
1. Understand why a price becomes negative
Wholesale electricity markets normally dispatch offered generation in merit order, subject to network and security constraints. The clearing price can become negative when enough generators are willing to pay to remain online. Their willingness can reflect a production credit, renewable certificate, fixed support payment, fuel or water constraint, minimum stable generation level, heat obligation, start-up cost or contractual commitment.
Negative prices therefore reveal several conditions at once. They show that energy is abundant at the affected time and place. They also show that part of the supply stack or demand side does not respond fully to the price signal. Transmission may be unable to move the surplus. Storage and flexible loads may be too small, unavailable, full or commercially constrained. The system operator may still need specific units for voltage, inertia, reserve or local security.
The price interval matters. A market that settles every five minutes can record many negative intervals whose financial effect differs from an hourly day-ahead market. Day-ahead and real-time prices can move in opposite directions when weather or outages differ from forecasts. A project can be hedged at one settlement point and physically exposed at another. The analyst should identify the market, interval, node, currency, loss factor and settlement formula before calculating exposure.
Policy can affect bidding incentives. A support scheme that pays for output regardless of the wholesale price may allow a renewable generator to bid below zero and remain profitable. Reformed European market rules emphasise two-way contracts for difference and more market-responsive support. The purpose is to preserve investment signals while reducing incentives to generate when electricity has negative system value. The exact effect depends on the support instrument and local implementation.
2. Separate the market price from the project settlement
A reported negative price does not establish a project's realised revenue. The project settlement can combine the physical market price, a PPA payment, a hedge, certificates, imbalance charges, curtailment compensation, network charges, ancillary services and support revenue. Each component can use a different volume, interval and reference price.
A physical PPA may require the offtaker to purchase delivered output at a fixed or indexed price. It may suspend payment during negative-price intervals, apply a floor, limit annual negative hours, allow curtailment or require the generator to follow dispatch instructions. A virtual or synthetic PPA usually settles a financial difference between a fixed strike and a market reference. The generator can remain exposed to the difference between its nodal sale price and the hedge reference, known as basis risk.
The analyst should construct a settlement waterfall for every contract and revenue stream. The waterfall starts with metered generation or consumption. It then applies availability, dispatch, losses, imbalance, curtailment, reference price, strike price, floor, cap, negative-price clause, certificate allocation, support payment, fees, collateral and tax. The output should reconcile to invoices and market statements.
This process often reveals that a fixed price is conditional. A PPA can protect energy price while leaving volume, shape, basis, imbalance and curtailment with the generator. A floor can apply to the reference price while network charges remain negative. A tolling or capacity contract can move dispatch risk to the offtaker while retaining performance risk with the asset. Lenders should underwrite the actual allocation instead of the contract label.
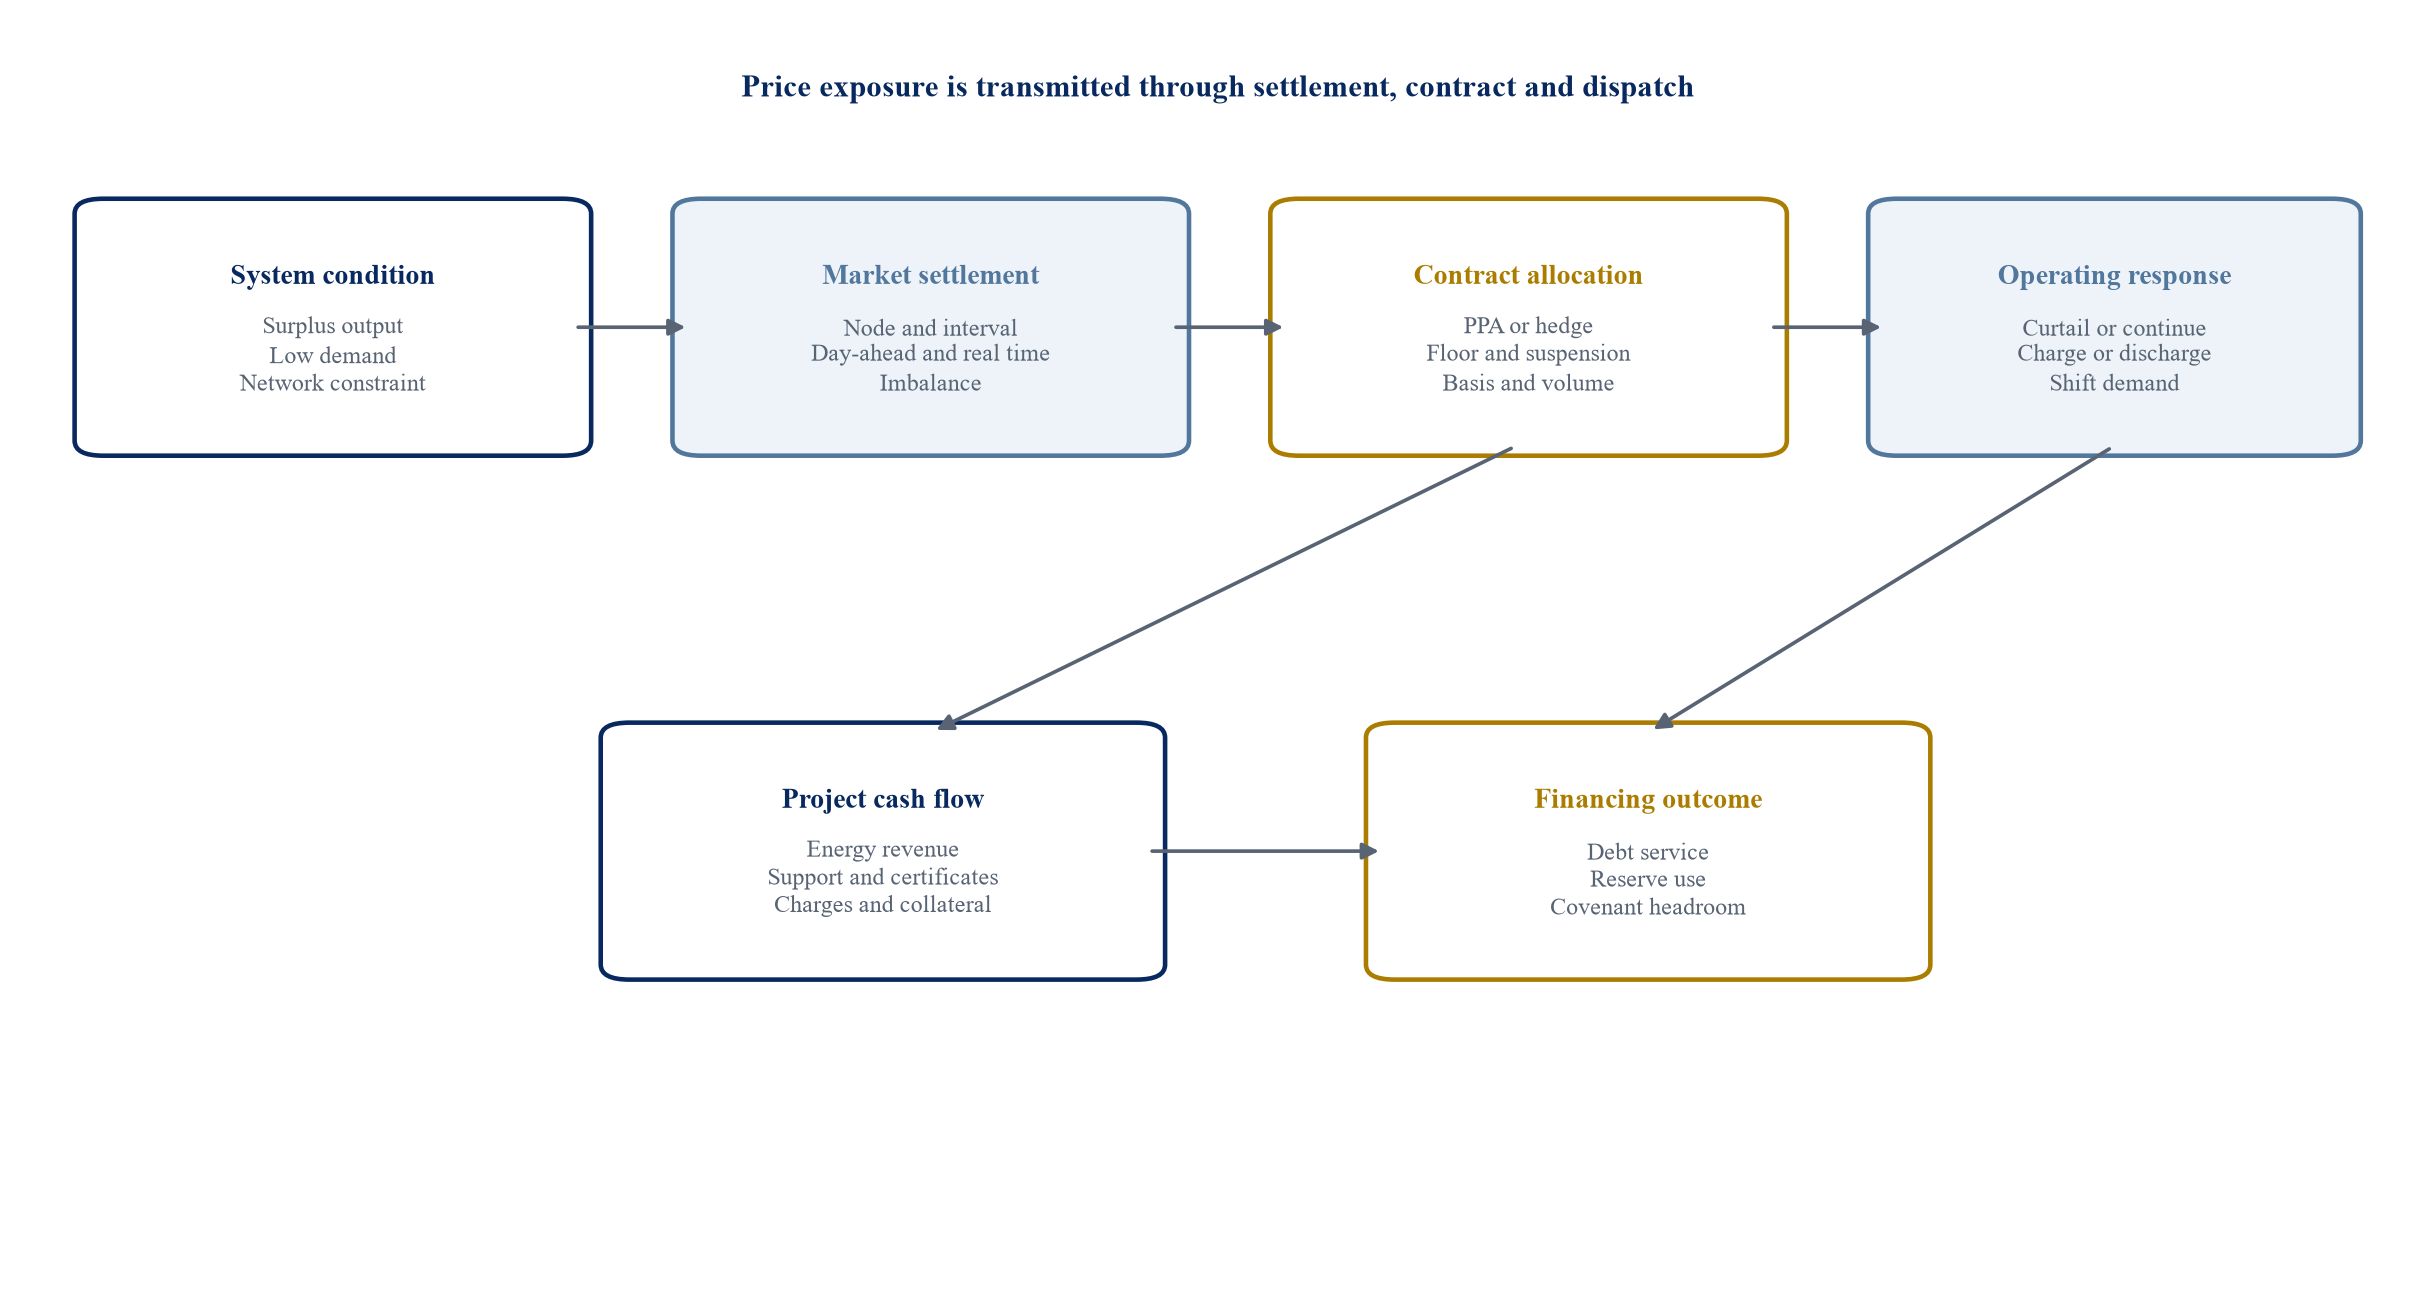
Contract, location and operating conditions determine whether the market event becomes a cash cost, a neutral settlement or a source of flexibility revenue.
3. Measure frequency, depth and duration
Three price statistics serve different purposes. Frequency counts the share of settlement intervals below zero. Depth measures how negative the price becomes. Duration measures whether events occur as isolated intervals or sustained blocks. A project can tolerate frequent shallow events differently from rare deep events that trigger collateral, hedge or operational consequences.
The distribution should be measured at the project's settlement node and relevant hedge hub. System-wide averages can conceal local congestion. The analyst should show monthly and intraday patterns, weekday effects, weather conditions, renewable output, demand, interconnector availability and binding constraints. A duration curve helps distinguish a gradual left tail from a small number of extreme events.
Historical data need a quality review. Market rule changes, bidding zones, price caps, interval length, network topology and generation capacity can change over time. A ten-year average may combine regimes that no longer represent the asset. A short sample can omit droughts, fuel shocks, outages and build-out cycles. The underwriting case should document the selected period and structural adjustments.
Negative-price exposure should also be expressed as megawatt-hours and cash, not only hours. A solar project produces more during midday surplus periods, so its generation-weighted exposure can exceed the market's time-weighted frequency. Wind exposure depends on local correlation. A flexible thermal plant may avoid negative output but incur start costs or lose availability revenue.
4. Use capture price rather than the annual average
The capture price is the generation-weighted average price received by a technology or asset before contractual adjustments. It links the price profile to the output profile. A solar plant can face a lower capture price as solar penetration increases because its output becomes concentrated in hours when electricity is abundant. Wind can face a similar effect during windy periods. The ratio of capture price to the baseload average is often called the capture rate.
Annual average prices can therefore rise while a renewable project's capture rate falls. The reverse can also occur when scarcity hours dominate the average but the project produces little during them. Lenders and investors should model hourly or sub-hourly generation against nodal prices, losses, curtailment and availability.
The model should separate historical capture, forward capture and contract capture. Historical capture describes observed prices and output. Forward capture depends on the scenario for generation additions, transmission, storage, demand flexibility, fuel, carbon and market design. Contract capture reflects the project's negotiated settlement. A fixed PPA can stabilise part of the revenue while basis, volume and negative-price clauses leave residual exposure.
The key question is how the capture distribution affects cash available for debt service. A project with a stable annual average can still experience seasonal cash deficits. A debt facility with quarterly tests may fail before the annual result recovers. The financing model should preserve settlement intervals through to monthly cash flow and covenant periods.
5. Map the generator revenue stack
Generator revenue can include spot energy, contracted energy, capacity, ancillary services, renewable certificates, tax credits, balancing payments, congestion rights and curtailment compensation. Negative energy prices affect these streams differently.
A generator may rationally continue operating at a negative spot price when another payment exceeds the loss. The decision should include variable cost, production support, certificate value, shutdown cost, restart cost, wear, minimum run time, forecast scarcity and contractual penalties. The market bid should reflect the project's lawful commercial position and applicable market rules.
Inflexible plants face a different calculation. Nuclear, coal, combined heat and power, hydropower and some industrial generators can have minimum output or non-energy obligations. Shutting down can create safety, technical, environmental or customer costs. The plant may accept a negative price to avoid a larger loss. That behaviour can deepen negative events when several inflexible units remain online.
The board should approve a dispatch policy that identifies economic thresholds, technical limits and authority. The policy should distinguish forecast action from real-time action. It should capture every reason for uneconomic dispatch and reconcile it to market, contract and operating data. A recurring negative-margin pattern may justify maintenance changes, flexible retrofits, storage, demand partnerships, contract amendment or asset sale.
Table 1. Transmission of negative-price risk through the power value chain
| Participant | Primary exposure | Evidence required | Decision response |
|---|---|---|---|
| Merchant renewable generator | Capture-price erosion, basis, curtailment and imbalance | Nodal price and output history; forecast shape; grid constraints | Recontract, add flexibility, resize debt or change dispatch |
| Contracted renewable generator | Negative-price suspension, volume and basis risk | Full settlement formula; PPA invoices; hedge reference | Amend floor, collar, volume or curtailment terms |
| Thermal or nuclear generator | Minimum-load losses, start cost and lost ancillary value | Unit commitment, heat rate, technical minimum and restart cost | Optimise outage plan, retrofit flexibility or retire |
| Battery storage | Spread compression, degradation and revenue saturation | Charging and discharge prices; cycles; state of charge; service awards | Optimise dispatch, duration, augmentation and revenue mix |
| Corporate offtaker | Hedge settlement cost, profile mismatch and collateral | Load shape; reference price; contract volume; credit support | Shape contract, add floor or combine with flexibility |
| Project lender | Lower cash available for debt service and covenant headroom | Interval model; contract allocation; downside and reserve schedule | Reduce leverage, sculpt debt, add reserves or cash sweep |
| System operator | Balancing, congestion and security cost | Dispatch, constraints, reserves and network availability | Procure flexibility, reinforce grid and improve price signals |
The matrix identifies common exposures. Project contracts and market rules determine the actual allocation.
6. Read negative-price clauses precisely
Negative-price clauses can stop, reduce or defer payment when the reference market price falls below a threshold. The trigger may require one interval, a continuous block, a minimum number of hours or an annual allowance. The clause may apply to energy only, the hedge settlement only or the entire contracted payment.
Drafting details can change value materially. The reference can be day-ahead, intraday, real-time, hub or node. The contract can use local time, market time or coordinated universal time. Daylight-saving transitions can create repeated or missing hours. The trigger can use a strict negative value or include zero. The treatment of curtailment, deemed energy, losses, certificates and imbalance during the suspension period should be explicit.
Operational control must align with the clause. An offtaker that stops paying but cannot direct curtailment leaves the generator to decide whether to produce. A generator that must follow an offtaker instruction needs a reliable communication and metering process. Compensation for non-market curtailment should remain distinct from voluntary economic curtailment.
For financing, the model should reproduce the contract algorithm. A simplified annual haircut can miss clustering and threshold effects. The diligence team should test historical intervals through the settlement code, reconcile the output to sample invoices and review disputes. Contract ambiguity should remain a risk until resolved by amendment or qualified legal advice.
7. Control basis, shape and volume risk
A fixed price can coexist with substantial residual exposure. Basis risk arises when the project's physical sale price differs from the hedge reference. Shape risk arises when generation or load differs from the contracted hourly profile. Volume risk arises when actual output differs from contracted quantity. Negative prices can magnify each difference.
A virtual PPA settled at a liquid hub can produce a positive hedge receipt while the project node is more negative, leaving an unhedged basis loss. A pay-as-produced contract reduces volume mismatch but transfers generation shape to the offtaker. A fixed-volume contract can force the generator to buy replacement power when output is low and prices are high. A baseload hedge can be expensive for solar because its output concentrates in daylight hours.
The project model should build a joint distribution of resource, node, hub and load. Correlations matter. Solar output, negative prices and congestion can occur together. Wind output across a region can depress both hub and node prices. Load from data centres, electrolysers, desalination or cooling can change the local profile when it is genuinely flexible and connected to the constrained area.
Hedging should target the exposure the project can evidence. Over-hedging can create losses and collateral calls. A layered approach can combine a fixed PPA for core output, a floor or collar for residual energy, congestion hedges where liquid, and merchant upside. The financing case should test counterparty default and replacement cost.
8. Distinguish curtailment from economic shutdown
Curtailment can result from system security, network congestion, negative prices, contractual instruction or voluntary bidding. These events can have different compensation and reporting treatment. The project should classify every curtailed megawatt-hour by cause and contractual consequence.
Physical curtailment reduces output and can protect the project from negative settlement. It can also reduce certificate, tax-credit, availability or PPA revenue. A grid instruction may qualify for compensation where voluntary economic curtailment does not. A negative-price clause can remove the contracted payment even when the plant remains technically available.
The lender should review the curtailment regime, grid agreement, dispatch priority and historical local constraints. Compensation can be capped, delayed, disputed or dependent on availability evidence. A model that assumes full compensation should identify the legal and credit basis.
Asset operations need an auditable decision log. It should record forecast price, dispatch instruction, technical availability, contract position, support value, avoided loss and actual settlement. The log allows the board to compare the economic choice with the outcome. It also supports warranty, insurance, PPA and lender reporting.
9. Evaluate flexible generation options
Negative prices create value for generators that can reduce output cheaply and resume when prices recover. Flexibility depends on ramp rate, minimum stable level, minimum up and down time, start cost, heat rate, emissions limit, maintenance effect, fuel nomination and staffing.
A retrofit can improve the minimum load or ramp rate of a thermal plant. The value comes from avoided negative-margin generation, improved scarcity capture and possible ancillary services. The analysis should include capital cost, outage, efficiency penalty, cycling wear and remaining asset life. A faster plant can still lose value if market spreads narrow or emissions policy shortens operation.
Renewable plants can use advanced controls, forecasting and automated bidding to reduce uneconomic output. The investment case depends on whether curtailed generation forfeits support or contract revenue. Hardware and software should meet grid-code, cybersecurity and metering requirements.
Hybridisation can add storage, flexible load or another generation technology behind the same connection. The existing grid right can be valuable where queues are long. The transaction must address export limits, import rights, metering, losses, market registration, tax, support eligibility and the allocation of shared infrastructure.
10. Value storage from the full revenue stack
Storage can convert low or negative-priced electricity into later energy, reserve or capacity. EIA describes energy arbitrage as charging at low prices and discharging at high prices. AEMO reported that charging during negative-price periods contributed to battery revenue in the fourth quarter of 2024. These observations show an available mechanism, not a guaranteed return.
Battery value depends on the distribution of spreads, duration, cycle limit, round-trip efficiency, degradation, availability, connection, market access and competing capacity. A battery can earn money while charging during a negative interval, but the value is reduced by losses, network charges, taxes and degradation. It needs a later discharge opportunity or another paid service.
Revenue stacking can combine energy arbitrage, frequency response, reserves, capacity, congestion relief, network services and contracted availability. The same megawatt cannot always serve several markets simultaneously. Qualification, telemetry, response time, state of charge and dispatch obligations can conflict. The model should use feasible co-optimisation rules.
Market saturation matters. As storage capacity increases, batteries can reduce negative prices and compress the spreads they seek to capture. Historical revenue from an undersupplied ancillary market can fall after entry. The base case should use forward market depth and competitor build-out rather than capitalising a short sample at a constant rate.
11. Design co-located renewable and storage projects
Co-location can use one site, connection, control system and operating team. Storage can absorb renewable output that would otherwise face a negative price or curtailment. It can reshape delivery under a PPA and provide grid services. These benefits depend on the connection and contract architecture.
An AC-coupled battery can import from the grid and operate independently within connection limits. A DC-coupled battery can capture clipped solar energy and share equipment but may have different operating constraints. The model should include charging source, tax-credit rules, meter configuration, conversion losses, augmentation and warranty limits.
The value of avoided curtailment should use observed or modelled renewable output at the affected intervals. It should not assume every curtailed megawatt-hour can be stored. Power, energy duration, state of charge, round-trip efficiency, export timing and degradation limit the recoverable amount.
Contracts need to allocate dispatch and settlement between assets. A renewable PPA may restrict storage charging or require proof of source. A battery tolling agreement can reserve capacity for an offtaker. Lenders need security over shared assets and clear rules for operating expenses, insurance, outages, step-in and enforcement.
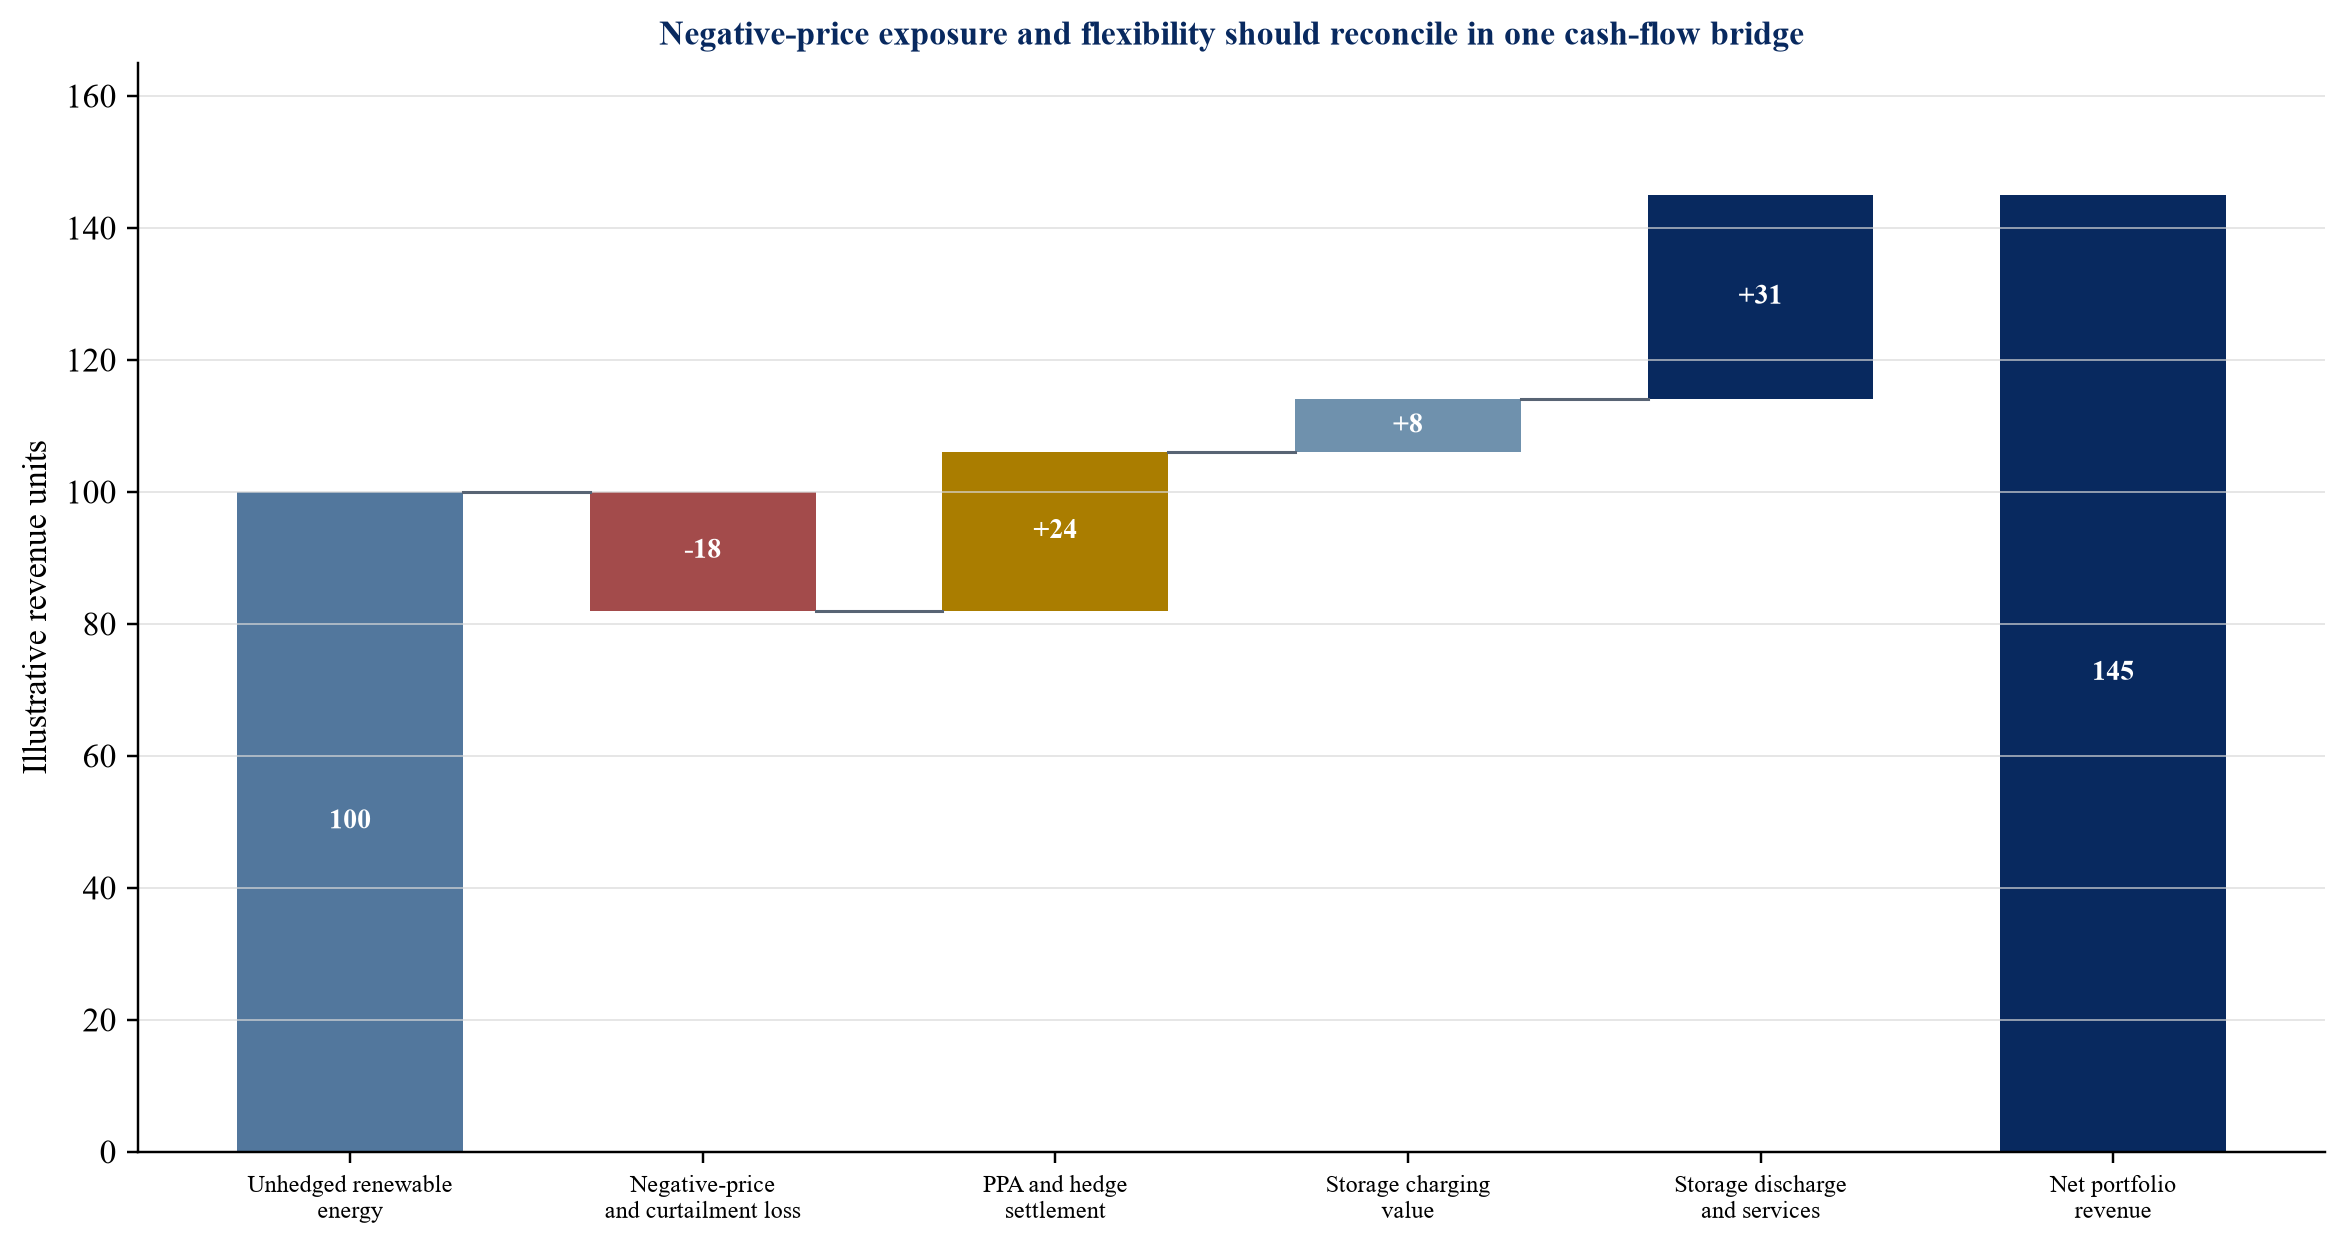
Values are illustrative and show the structure of a revenue bridge rather than a forecast or market benchmark.
12. Forecast structural change rather than extrapolating one year
Negative prices reflect the evolving power system. A forecast should model generation additions, retirements, transmission, interconnection, storage, demand flexibility, electrification, fuel, carbon, hydrology and outages. It should also model market rules and support incentives that affect bidding.
The IEA links rising negative prices to insufficient flexibility and identifies storage, demand response and regulatory reform as important responses. ACER recommends greater cross-zonal capacity, market integration and flexibility. These responses can reduce some negative events while changing scarcity and ancillary-service revenue.
The underwriting model should use several internally consistent scenarios. A high-renewables, slow-grid scenario may increase local oversupply and curtailment. A high-storage scenario can reduce negative prices and compress battery arbitrage. A strong flexible-demand scenario can raise midday prices while increasing electricity consumption. A delayed-retirement scenario can retain inflexible supply.
Forecast vendors can disagree because of different capacity assumptions, weather years, bidding behaviour and network representation. The investment committee should see the drivers rather than one price series. Sensitivities should preserve correlations between output, price, congestion and curtailment. Independent review is useful when leverage depends heavily on a merchant tail.
13. Underwrite policy and market-design change
Market design determines which services receive revenue and who bears imbalance, congestion and adequacy risk. The European electricity-market reform that entered into force in July 2024 promotes longer-term contracts, PPAs and two-way contracts for difference. The implementation of support schemes, flexibility procurement and capacity mechanisms can change project cash flows.
Policy analysis should identify enacted rules, adopted methodologies, pending consultations and management assumptions. A proposal should not enter the base case as though effective. The model should show the date, eligibility, term, indexation, funding source, settlement and clawback for each support instrument.
Negative-price rules can change eligibility for renewable support. Some schemes suspend support after consecutive negative hours. Tax credits or certificates can affect the price at which a generator remains economically willing to produce. A policy change can therefore affect both project revenue and market behaviour.
The financing documents should address change in law, market suspension, price-cap reform, settlement changes and new charges. Protection may include pass-through, compensation, reserve, mandatory prepayment or reopener provisions. Legal enforceability and counterparty credit require jurisdiction-specific advice.
14. Build the lender's interval model
Project-finance debt is repaid from project cash flow. The World Bank describes the PPA pricing and risk-allocation regime as central to bankability. It also notes that lenders assess whether operating cash flow can cover debt service with an acceptable margin and whether variability can remain within that margin.
An interval model begins with weather and availability, calculates generation, applies node and reference prices, runs the PPA or hedge algorithm, adds support and ancillary revenue, and subtracts market, network, operating, tax, lease and maintenance costs. The result aggregates to the period used for debt service and covenants.
The model should reproduce negative-price thresholds, consecutive-hour rules, floors, caps, annual allowances and curtailment. It should include settlement lag, collateral and working capital. A project can show positive annual EBITDA and still require liquidity because hedge collateral is posted before PPA or market receipts arrive.
The lender should compare modelled settlements with historical invoices where the asset operates. For a greenfield project, the independent engineer and market adviser should review resource, availability, degradation, congestion and price. Model governance should record versions, source data, approvals and changes.
15. Size debt to durable cash flow
Debt sizing should use the revenue that remains after credible downside tests. Fully contracted revenue can support more leverage when the contract is enforceable, the offtaker is creditworthy and residual risks are limited. Merchant and basis-exposed revenue generally requires lower leverage, stronger reserves or faster amortisation.
The lender should calculate debt-service coverage under base and downside cases, loan life coverage, project life coverage and minimum liquidity. The definitions must match the finance documents. Cash available for debt service should not include restricted cash, uncommitted support, uncertain damages or unrealised terminal value.
Debt can be sculpted to seasonal cash flow. A spring solar project with frequent negative midday prices may need lower scheduled debt service during exposed months. Cash sweeps can accelerate repayment when merchant spreads exceed the base case. A balloon can increase refinancing risk when negative-price exposure rises late in the loan.
The merchant tail requires special attention. A PPA can expire before debt maturity, or debt can be sized partly to post-contract cash flow. The tail model should use current capacity, market-design and capture-price assumptions. Refinancing should remain a scenario until committed.
16. Set reserves and liquidity controls
Negative-price events can create operating losses, lower receipts, collateral calls and delayed settlements. A debt-service reserve designed only around scheduled payments may not cover working-capital volatility. The project may need separate operating, maintenance, collateral or major-repair reserves.
Reserve sizing should use the cash-flow path, not a fixed market convention. The model should identify the largest cumulative deficit across credible stress periods. It should include PPA settlement timing, margin calls, certificate receipts, tax refunds, insurance and cure periods.
Distribution conditions protect liquidity. They can require minimum historic and projected coverage, funded reserves, no default, approved budget, hedge compliance and no unresolved material claim. A lock-up can retain cash before a payment default occurs. A cash sweep can reduce debt when volatility produces upside.
Sponsor support can cover construction, ramp-up or a defined merchant exposure. The obligation should specify amount, term, credit support and draw mechanics. A management expectation of voluntary support is not a financing source.
17. Use covenants as operating controls
Covenants should respond to the mechanism of risk. A general debt-service test can identify deterioration after cash has fallen. Earlier indicators can include capture rate, negative-price megawatt-hours, curtailment, basis spread, hedge volume, state of charge, battery availability, degradation, offtaker credit and collateral headroom.
The reporting package should reconcile market statements, PPA invoices, meters, operating records and the financial model. Variance thresholds should trigger investigation and forecast updates. Repeated manual adjustments or unexplained settlement differences can indicate control weakness.
Hedge covenants can limit tenor, volume, counterparty concentration, collateral and speculative positions. Operating covenants can require approved dispatch, maintenance, cybersecurity, insurance and market registration. Storage covenants can address cycle limits, warranties, augmentation and minimum availability.
Remedies should be proportionate. A reporting delay can require cure. A sustained cash-flow shortfall can trigger distribution lock-up, cash sweep, reserve funding, hedge amendment or debt prepayment. Loss of a material contract, connection or licence can justify mandatory action. The documents should preserve lender step-in where legally and operationally feasible.
Table 2. Illustrative lender controls for negative-price exposure
| Control | Measurement | Illustrative trigger | Potential response |
|---|---|---|---|
| Capture-price variance | Actual versus approved quarterly capture price | More than 15 percent below case for two quarters | Update forecast and lock distributions |
| Negative-price production | Megawatt-hours generated below zero | Exceeds approved annual volume by 25 percent | Review dispatch and contract terms |
| Basis exposure | Node less hedge-reference settlement | Downside exceeds funded reserve | Add hedge, resize distributions or prepay debt |
| Curtailment | Lost output by cause and compensation | Uncompensated curtailment exceeds case | Enforce rights, revise model and fund reserve |
| Battery availability | Dispatchable power and energy duration | Below contracted or warranty level | Cure operations, claim warranty or augment |
| Debt-service coverage | Cash available for debt service divided by debt service | Below finance-document threshold | Lock cash, sweep or cure support |
| Collateral liquidity | Available cash against margin requirement | Less than stressed 30-day requirement | Fund collateral reserve or reduce hedge |
Thresholds are illustrative. Transaction documents require project-specific calibration and legal review.
18. Govern hedging and collateral
Hedges can stabilise revenue while introducing counterparty, basis, volume and collateral risk. The board should approve the exposure being hedged, permitted instruments, limits, counterparties, credit support and reporting. Hedge accounting treatment requires separate accounting advice.
A fixed-for-floating swap can protect a market reference price. It does not automatically protect the project's node or generation profile. A floor can limit downside at a premium. A collar can fund the floor by surrendering upside. A proxy hedge can create correlation risk. Congestion products may be unavailable, illiquid or imperfectly matched.
Collateral can create a liquidity event even when the hedge is economically valuable over its life. Rising forward prices can require the generator to post cash against a fixed-price sale before future physical revenue is received. Negative prices can interact with settlement timing and credit thresholds. The model should calculate collateral under joint price and volume stresses.
Counterparty default can remove protection when market replacement cost is high. The project should monitor credit, netting, termination rights and concentration. Lender security and direct agreements should address hedge termination, replacement and step-in.
19. Operate storage with evidence and discipline
Storage dispatch is an optimisation problem with physical constraints. The operator chooses charging, discharging and reserve commitments subject to state of charge, power, duration, efficiency, degradation, temperature, warranty, connection and market rules.
Forecasts should combine price, renewable output, load, outages and service demand. The operating policy should preserve state of charge for contracted obligations and scarcity events. A strategy that captures frequent small negative-price payments can destroy value if it consumes cycles needed for larger spreads or accelerates augmentation.
Performance reporting should show gross charging revenue, charging cost above zero, discharge revenue, ancillary revenue, network charges, losses, degradation cost and availability. AEMO's reporting separates charging during negative prices from other charging cost, which illustrates the value of a transparent bridge.
Algorithms should have governance. The owner should test model drift, data quality, cyber access, bidding limits and exceptional overrides. A trading strategy requires documented authority and market-conduct controls. Lenders need visibility into material changes that alter revenue or warranty risk.
20. Use flexible demand where the economics are real
Flexible demand can absorb low-price electricity and reduce system stress. Batteries, electric vehicles, heat pumps, industrial heating, cooling, pumping, desalination, hydrogen and data centres can shift some consumption. The IEA identifies demand flexibility as an important response to variable renewable generation and rising system costs.
The project case should establish physical flexibility. A load that must operate continuously cannot be counted as dispatchable. Shifting can affect production, service levels, water inventories, temperature, equipment life or customer obligations. Connection capacity and network tariffs can limit the benefit.
Commercial structure matters. A generator and flexible consumer can share the value of avoided curtailment and lower procurement cost. A co-located load may use private-wire arrangements, shared connection or local energy contracts. The parties need metering, dispatch, availability, credit, outage and change-in-law provisions.
The financing model should include only contracted or demonstrated flexibility in the base case. Future data-centre, hydrogen or industrial demand can support a scenario when no binding commitment exists. The investment committee should distinguish an identified customer from a commissioned, creditworthy and dispatchable load.
21. Compare markets without forcing one benchmark
Negative-price statistics depend on market design. Europe commonly reports hourly day-ahead bidding-zone prices. Australia's National Electricity Market uses five-minute dispatch intervals. US markets include nodal day-ahead and real-time prices. Great Britain combines wholesale trading with balancing and constraint arrangements. A frequency measured in one system cannot be transferred directly to another project.
The IEA reported negative-price exposure across Europe, Australia and the United States. ACER recorded a European increase in 2024. AEMO reported both high negative-price frequency and increased battery arbitrage revenue in late 2024. EIA associated lower US wholesale prices with lower gas prices, renewable generation and new battery capacity. These observations show common drivers and different outcomes.
The underwriting process should use the project's own market. It should identify gate closure, dispatch interval, imbalance exposure, price caps and floors, congestion, support, capacity, ancillary markets, settlement and prudential requirements. Cross-market evidence can test mechanisms and scenarios. It should not replace local data.
Geographic diversification can reduce exposure when weather, demand and constraints are imperfectly correlated. It can also add currency, regulatory and operational complexity. A portfolio model should preserve each asset's price and output distribution before aggregating cash flow.
22. Apply a hypothetical portfolio case
Consider an illustrative portfolio containing a 200 MW solar plant, a 150 MW wind plant, a 100 MW four-hour battery and a flexible gas plant. The amounts are educational and do not represent an actual asset, transaction, forecast or market benchmark.
The solar and wind assets sell physical electricity at their nodes and hedge part of revenue at regional references. The contracts suspend hedge payments after six consecutive negative hours. The battery earns energy, reserve and capacity revenue. The gas plant provides energy and reserve but incurs start cost and cycling wear.
In the central case, negative-price frequency rises while storage and flexible demand moderate the deepest events. Solar capture declines, wind basis widens and battery charging value increases. The portfolio remains able to service debt because contracted revenue, storage and the gas plant diversify cash flow.
In the downside case, transmission is delayed, renewable capacity grows faster, battery competition compresses spreads, the solar node experiences more severe negative prices and the offtaker is downgraded. Cash available for debt service falls, collateral requirements rise and distributions lock. The lender response includes reserve funding, debt sweep, hedge amendment and a revised dispatch plan.
Table 3. Illustrative portfolio downside and financing response
| Measure | Central case | Illustrative downside | Financing consequence |
|---|---|---|---|
| Solar capture rate | 74 percent | 57 percent | Lower merchant and PPA settlement cash |
| Wind node to hub basis | Negative 6 units per MWh | Negative 15 units per MWh | Hedge protection weakens |
| Uncompensated curtailment | 4 percent of available output | 11 percent | Revenue and certificate loss |
| Battery net spread after losses | 92 units per discharged MWh | 48 units | Reduced arbitrage and augmentation headroom |
| Portfolio debt-service coverage | 1.48 times | 1.09 times | Distribution lock and cash sweep |
| Collateral requirement | 12 value units | 31 value units | Collateral reserve draw |
| Debt balance after five years | 61 percent of opening | 52 percent after sweep | Faster deleveraging preserves coverage |
Values are illustrative and have no predictive or valuation status.
The example demonstrates why portfolio-level stability should be tested at asset level. A battery can gain from negative charging prices while losing ancillary revenue to saturation. A flexible gas plant can gain scarcity revenue while suffering more starts. A fixed PPA can stabilise price while basis and suspension clauses remain exposed.
23. Run transaction diligence before acquisition or refinancing
Commercial diligence should reconstruct historical revenue from raw market, meter and contract data. It should identify price node, hedge reference, capture rate, negative-price generation, curtailment, imbalance, support, certificates, ancillary awards and settlement disputes. The team should reconcile the analysis to audited accounts and invoices.
Technical diligence should assess availability, ramping, minimum load, control systems, connection, metering, forecast accuracy, degradation, warranty and maintenance. Storage diligence should review cell condition, thermal management, augmentation, cycle history and state-of-charge controls. Renewable diligence should review resource, wake or clipping losses and curtailment capability.
Legal diligence should review PPAs, hedges, grid agreements, licences, support, land, market registration, direct agreements and security. It should identify negative-price clauses, curtailment allocation, change in law, termination, credit support, assignment and step-in. Market rules retrieved during diligence are evidence; summaries require confirmation against the rules in force.
Financial diligence should rebuild the interval model, test tax and accounting treatments, review working capital and collateral, and calculate covenant headroom. The valuation should separate contracted, merchant and optional revenue. An uncontracted storage retrofit or prospective flexible load should remain a scenario until its approvals, capital and commercial terms are evidenced.
24. Establish the first 100 day control plan
The first 100 days after acquisition or refinancing should establish a common data and decision system. The owner should validate meters, market statements, contract algorithms, hedge positions, dispatch authority, forecasts, reserves and lender reporting.
The board should approve a negative-price response policy. It should define price and contract thresholds, technical constraints, control-room authority, storage priorities, forecast update frequency, exception logging and escalation. Operations, trading, finance, legal and asset management should use the same settlement definitions.
The owner should back-test at least one year of intervals through the approved model where data permit. Differences between model and invoices should be resolved. The team should identify recurring loss intervals and rank actions by value, cost, timing and dependency.
Contract discussions can focus on a floor, collar, suspension threshold, curtailment, basis, volume, collateral or flexibility sharing. Physical actions can include controls, forecasting, storage, flexible load, connection modification or retrofit. Financing actions can include reserves, hedge limits, sculpting and cash sweeps.
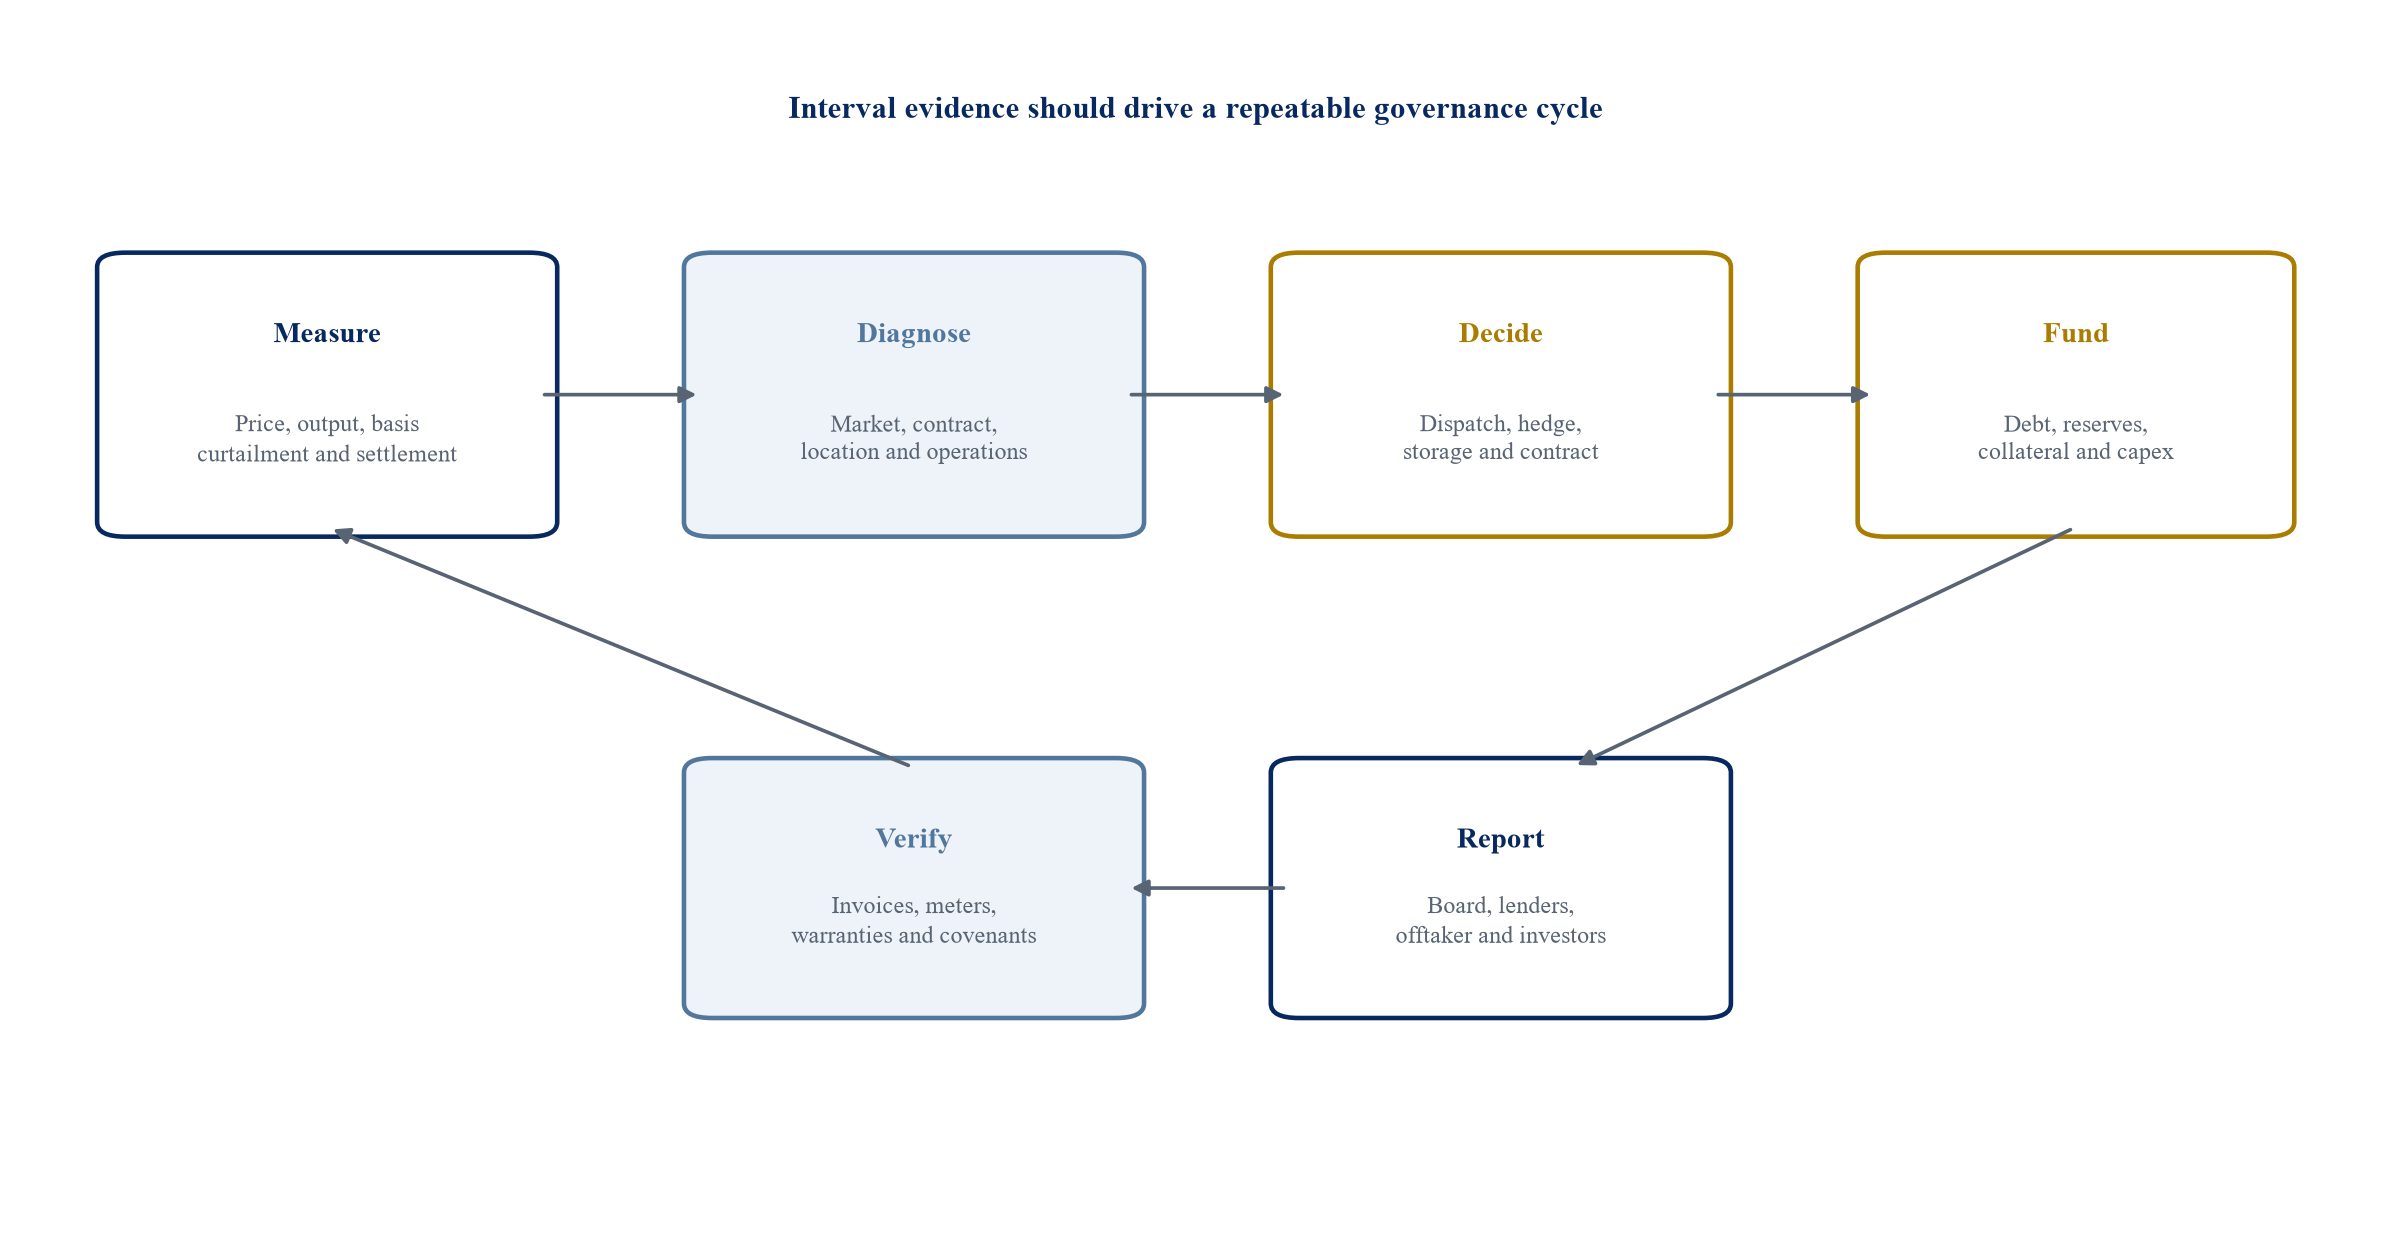
The cycle links interval evidence to commercial, operating and financing decisions.
25. Recognise the limits of the framework
Negative-price models depend on weather, demand, generation, transmission, storage, bidding and policy assumptions. Historical relationships can change when new capacity, network or rules enter service. A forecast is a scenario rather than an observed future fact.
Price data can be incomplete or inconsistent across markets. Day-ahead, real-time, balancing and bilateral prices serve different purposes. A project can settle at a node that lacks a long transparent history. Proxy data should be identified and tested.
Contract interpretation requires qualified legal advice. Tax credits, certificates, support, hedge accounting, collateral and insolvency can alter cash flow. Technical dispatch must respect safety, warranty, licence and grid-code requirements. A model should not direct an operator to violate those obligations.
The illustrative portfolio explains a structure. Its price, capture, debt and collateral values should not be transferred to another asset. A project-specific decision requires verified contracts, local market data, engineering limits, approved management assumptions and professional advice.
Conclusion
Negative prices are a market signal with different consequences for each project. Their frequency matters, but the investment decision depends on depth, duration, location, output profile, contract, support, flexibility and financing.
Generators should measure capture price, basis, negative-price production, curtailment and settlement. Storage operators should separate charging value, discharge revenue, ancillary services, losses, degradation and saturation. Offtakers should assess profile mismatch, collateral and contract control. Lenders should reproduce the settlement at interval level and size debt to durable downside cash flow.
The strongest control is a reconciled chain from market interval to meter, contract, invoice, cash flow and covenant. That chain allows the board to decide whether to curtail, store, shift demand, amend a contract, hedge, invest, deleverage or exit.
Negative-price exposure should remain visible throughout acquisition, ownership, refinancing and sale. A fixed-price label or annual market average cannot replace the underlying analysis. Bankability comes from evidenced risk allocation, operational capability, liquidity and cash flow that can service debt under credible stress.
Frequently Asked Questions
1. Does a negative wholesale price mean every generator pays to produce?
No. The project outcome depends on its node, settlement interval, contract, support, imbalance, curtailment and other revenue. Some generators pay the market, some receive a contracted payment, some curtail and some remain profitable because another revenue exceeds the negative price.
2. What is the most useful generator metric?
The generation-weighted capture price is central. It should be reviewed with capture rate, negative-price megawatt-hours, basis, curtailment, imbalance and the contractual settlement received by the project.
3. Can a fixed PPA remove negative-price risk?
It can reduce energy-price exposure. Negative-price suspension, basis, volume, shape, imbalance, curtailment, collateral and counterparty credit can remain. The full settlement formula determines protection.
4. Why can a generator rationally produce at a negative price?
Production support, certificates, heat obligations, hydrological constraints, technical minimums, restart cost or ancillary obligations can exceed the spot loss. The operator should document the economic and technical basis.
5. Are negative prices always good for batteries?
They can create charging revenue or low-cost energy. Battery value also depends on later discharge spreads, losses, degradation, availability, network charges, service revenue and market saturation.
6. How should lenders model the risk?
Lenders should model price and generation at the relevant interval, apply the actual contract and support algorithms, include basis, curtailment, collateral and operating costs, and aggregate the result to debt-service periods under several scenarios.
7. Which lender protections are most relevant?
Debt sculpting, reserves, distribution tests, cash sweeps, hedge limits, capture and curtailment reporting, collateral controls, sponsor support and step-in can be relevant. The appropriate package depends on the project and jurisdiction.
8. What should trigger a restructuring review?
A sustained capture-price decline, wider basis, uncompensated curtailment, storage underperformance, collateral stress, contract loss, reduced covenant headroom or an unfunded flexibility investment should trigger an updated model and board and lender review.
References
- European Union Agency for the Cooperation of Energy Regulators. Key developments in European electricity and gas markets, 2025 Monitoring Report. https://acer.europa.eu/monitoring/MMR/electricity_gas_key_developments_2025
- European Union Agency for the Cooperation of Energy Regulators. Progress of EU electricity wholesale market integration, 2024 Market Monitoring Report. https://www.acer.europa.eu/monitoring/electricity_market_integration_2024
- European Union Agency for the Cooperation of Energy Regulators. Key developments in European electricity markets, 2024 Market Monitoring Report. https://acer.europa.eu/monitoring/MMR/electricity_key_developments_2024
- International Energy Agency. Electricity Mid-Year Update, July 2024. https://www.iea.org/reports/electricity-mid-year-update-july-2024/executive-summary
- International Energy Agency. The Value of Demand Flexibility, 2025. https://www.iea.org/reports/the-value-of-demand-flexibility/executive-summary
- International Energy Agency. Duration curves for negative wholesale electricity prices in selected regions, 2024. https://www.iea.org/data-and-statistics/charts/duration-curves-for-negative-wholesale-electricity-prices-in-selected-regions-2024
- International Energy Agency. Electricity 2026, Flexibility. https://www.iea.org/reports/electricity-2026/flexibility
- European Commission. Electricity market design. https://energy.ec.europa.eu/topics/markets-and-consumers/electricity-market-design_en
- European Commission. Quarterly Report on European Electricity Markets, Q4 2024. https://energy.ec.europa.eu/document/download/139371bf-b50b-4fd4-afd1-761b782a0703_en
- European Commission. Florence Forum 2024 Conclusions. https://energy.ec.europa.eu/document/download/3c4bafc7-df1b-4b2b-b27c-a3659e2d446d_en
- European Parliament and Council. Regulation EU 2024/1747 improving the Union's electricity market design. https://eur-lex.europa.eu/eli/reg/2024/1747/oj
- European Parliament and Council. Directive EU 2024/1711 improving the Union's electricity market design. https://eur-lex.europa.eu/eli/dir/2024/1711/oj
- US Energy Information Administration. US wholesale electricity prices were lower and less volatile in 2024. https://www.eia.gov/todayinenergy/detail.php?id=64284
- US Energy Information Administration. Utilities report batteries are most commonly used for arbitrage and grid stability, 2024. https://www.eia.gov/todayinenergy/detail.php?id=62405
- US Energy Information Administration. Battery storage in the Annual Energy Outlook. https://www.eia.gov/outlooks/aeo/IIF_battery/
- US Energy Information Administration. Wholesale Electricity and Natural Gas Market Data. https://www.eia.gov/electricity/wholesale/
- Australian Energy Market Operator. Quarterly Energy Dynamics Q4 2024. https://www.aemo.com.au/-/media/files/major-publications/qed/2024/qed-q4-2024.pdf
- Australian Energy Market Operator. National Electricity Market hits new demand and renewable energy records in December quarter, 2025. https://www.aemo.com.au/newsroom/media-release/national-electricity-market-hits-new-demand-and-renewable-energy-records-in-december-quarter
- National Energy System Operator. Balancing Costs Report November 2025. https://www.neso.energy/document/372681/download
- World Bank Group. Power Purchase Agreements and Energy Purchase Agreements. https://ppp.worldbank.org/sector/energy/energy-power-agreements/power-purchase-agreements
- World Bank Group. Project Finance Key Concepts. https://ppp.worldbank.org/financing/project-finance-concepts
- World Bank Group. Understanding Power Purchase Agreements. https://ppp.worldbank.org/library/understanding-power-purchase-agreements
- World Bank Group. Enabling the Private Sector in Infrastructure. https://documents1.worldbank.org/curated/en/099706002052518764/pdf/IDU-636e615c-d81d-4d56-8fa8-0bbcb49b872b.pdf
- National Renewable Energy Laboratory. Utility Scale Battery Storage. https://www.nrel.gov/docs/fy19osti/74426.pdf
- Federal Energy Regulatory Commission. Electric Power Markets. https://www.ferc.gov/electric-power-markets
- California Independent System Operator. Today's Outlook and Market Prices. https://www.caiso.com/todays-outlook/prices
- Electric Reliability Council of Texas. Market Information. https://www.ercot.com/mp/data-products
About the Author
Chennakeshav (CK) is a corporate finance and investment banking executive with 25+ years of global experience in deal origination, structuring and execution across M&A, growth capital and corporate strategy. He has led value-creation mandates for founders, corporates and funds — bridging the boardroom view to hands-on execution and close.
His career spans Morgan Stanley, HSBC, Lloyds Banking Group, EWEC, ADQ portfolio companies and Emirates Growth Fund, across TMT, real estate, fintech, deeptech, cleantech, infrastructure and energy. He has partnered with C-suite leaders, private equity and venture funds, sovereign wealth funds and family offices to finance complex fund raises and scale-up ventures, and has led M&A due diligence, post-merger integration and business-transformation initiatives to create value.
At Matchpoint Partners he is Managing Partner, leading the firm's corporate finance, M&A and capital-raising practice. He holds an MBA from London Business School, an engineering degree from VTU and a Master of Laws (LLM, in progress) from UCL London.
An active start-up mentor, CK mentors at Techstars, DIFC FinTech Hive, Startup Grind, Founder Institute and IN5, serves as Entrepreneur Mentor in Residence (EMiR) at London Business School, and judges the Entrepreneurship World Cup.
