

1. Define the roll-up decision
The acquisition decision is how much value can be created by combining machine-vision businesses without weakening inspection performance, customer acceptance or production continuity. The buyer needs to determine which models, datasets, hardware components, deployment tools and operating procedures are genuinely reusable. It also needs to identify the cost and time required to validate each transferred capability in its receiving plant. The answer affects purchase price, synergy underwriting, integration sequencing and contractual protection.
Industrial inspection systems make consequential operating decisions. They may reject a part, stop a line, route material to rework, release product for shipment or create a regulated quality record. A false accept can allow a defective part to pass. A false reject can destroy yield, consume labour and constrain throughput. Model performance therefore has economic meaning only inside the specific inspection task, process state and authority structure in which the output is used.
The framework tests six propositions. The inspected population is defined. Source and receiving domains are comparable. Performance is validated on representative receiving-plant evidence. The inspection result is integrated into a controlled disposition workflow. Economic effects include false rejects, false accepts, validation effort and line disruption. Customer rights and quality approvals allow the transferred solution to operate after closing.
Table 1. Evidence required before a common vision platform receives transaction value
| Evidence layer | Core question | Minimum record | Valuation consequence |
|---|---|---|---|
| Inspection identity | Which product, feature, defect and decision are inspected? | Controlled inspection plan and defect ontology | Defines the economically relevant population |
| Domain comparability | Are optics, geometry, process and acceptance conditions comparable? | Source-to-target domain map | Determines transferability |
| Model validity | Does the transferred model perform on representative target evidence? | Versioned target validation pack | Supports technical efficacy |
| Workflow acceptance | Can authorised staff act on the output? | Disposition workflow and approval record | Establishes operational adoption |
| Quality economics | What changes in escapes, rejects, yield and throughput? | Quality-cost ledger | Supports customer and synergy value |
| Operating continuity | Can the combined group maintain, secure and recover the system? | Rights, skills and recovery evidence | Supports durable cash flow |
Each layer can fail independently and requires a named technical or operating owner.
2. Identify the acquired product stack
A machine-vision target can contain cameras, lenses, lighting, controllers, edge computers, cloud services, image stores, model-development tools, rules engines, dashboards and implementation services. Revenue may combine equipment sales, licences, subscriptions, maintenance, engineering projects and outcome-linked fees. Each component has a different margin, replacement cycle, dependency and transfer right.
The buyer should reconcile product names to contract obligations and delivery work. A software subscription that includes on-site lighting design, fixture engineering and continuous model tuning has different economics from a portable software licence. Hardware margin can subsidise engineering. Support revenue can include unrecorded retraining effort. Cohort contribution therefore needs the full cost of commissioning, validation, change control, support and warranty response.
Public machine-vision disclosures show broad exposure across automotive, logistics, consumer electronics, medical, semiconductor and food applications, as well as the importance of application engineering and customer integration [1][2]. A roll-up valuation should follow the actual revenue and delivery architecture instead of applying one software multiple across equipment, projects and recurring services.
3. Define the inspection population
The denominator begins with plants, lines, inspection cells, product families, variants, features, defect classes and operating states. Management may describe hundreds of deployed systems while only a subset share the same physical inspection problem. The buyer should reconcile contracted systems to commissioned cells, actively used cells, cells with retained evidence, cells under current model governance and cells with measured quality outcomes.
Coverage should be weighted by economic importance. Inspecting many cosmetic features does not compensate for missing a safety-critical or customer-critical characteristic. The diligence team should map criticality, production volume, historical defect cost, regulatory relevance, customer-specific requirements and the authority attached to each inspection result.
Changes in product design, supplier material, tooling, line speed, ambient light, camera position and inspection recipe create new operating states. The population register should therefore be versioned. A cell may remain physically installed while its validated domain has expired. Portfolio metrics based on installed-cell count can overstate both product adoption and transferable value.
4. Standardise the defect ontology
Acquired businesses often use different names for equivalent conditions and the same name for materially different defects. Scratch, mark, inclusion, porosity, contamination, misalignment and dimensional non-conformance can have plant-specific meanings. A combined platform cannot learn reliably across plants until the parties map defect definitions, severity, location, disposition and evidence standards.
The ontology should preserve local authority. A global category can support comparison, while plant and customer definitions remain linked to the original specification. Forced harmonisation can erase distinctions that matter for warranty, safety or customer acceptance. Every label should retain the source, annotator, inspection method, revision and uncertainty.
Label quality requires review of rejected, accepted and disputed examples. Operator overrides, laboratory results, downstream failures and customer complaints can reveal label error. The buyer should measure inter-rater agreement and identify classes with sparse or inconsistent evidence. Model transfer should stop where the target defect definition cannot be mapped with adequate confidence.
5. Build the source-to-target domain map
Domain transfer depends on more than visual similarity. The map should cover product geometry, surface texture, colour, reflectivity, tolerances, defect prevalence, camera type, resolution, lens, exposure, lighting, fixture, line speed, trigger logic, preprocessing, environmental conditions and downstream decision. It should also record process capability and the cost of each error type.
Industrial anomaly-detection research documents the effect of domain shift and the difficulty of generalising from one controlled dataset to another production environment [3][4]. Transfer-learning research can improve performance when source and target domains are related, while its usefulness depends on the target evidence and discrepancy [5]. These findings support a diligence process that measures transfer rather than assuming it.
The buyer should score comparability at the cell and defect-class level. A common camera and model architecture can still face different backgrounds, tolerances or defect rates. The resulting matrix distinguishes direct reuse, calibrated reuse, partial retraining and local redevelopment. Only the first two categories support near-term platform synergy.
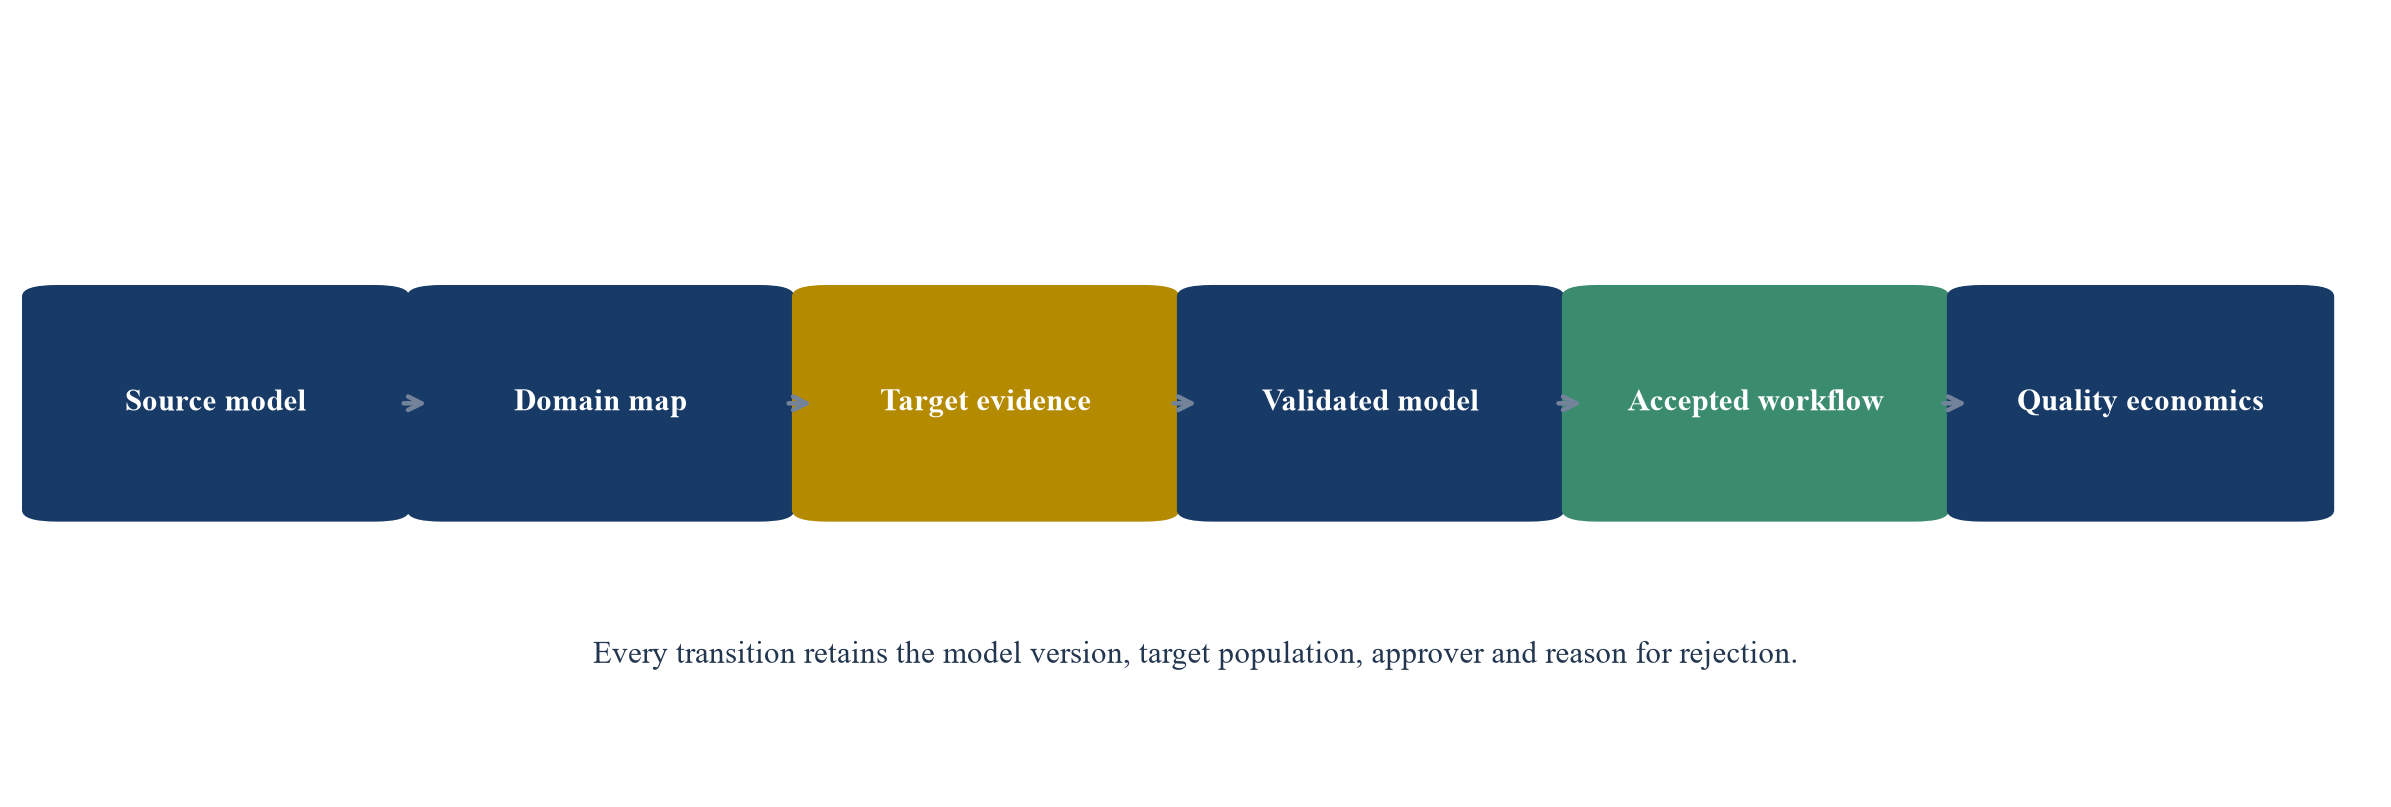
Portfolio value appears only after a source model passes target-domain validation and operating acceptance.
6. Validate target-domain performance
The target validation pack should define the receiving population, sampling method, label authority, model version, decision threshold and observation period. Random image splits can leak near-duplicate production frames across training and test sets. A stronger design separates by time, batch, tool, product variant or plant so the test reflects the intended transfer.
Performance should be reported by defect class and operating cohort. Precision and recall are useful, while a confusion matrix alone does not capture the cost of stopping a line or shipping an escape. The buyer should test the decision rule, including abstention, human review and threshold changes. Rare critical defects require separate evidence and conservative governance.
NIST's industrial-AI work states that performance has meaning within the system and user context in which the AI operates [6]. Its augmented-intelligence programme combines metrology, physics and AI to improve manufacturing quality and yield [7]. A target validation process should therefore connect image performance to traceable measurements, process knowledge and authorised decisions.
7. Measure false accepts
A false accept occurs when the system passes a unit that should have been rejected or reviewed. The economic effect can include downstream scrap, field failure, warranty, recall, customer chargeback, loss of qualification and safety exposure. The relevant denominator is the inspected population within the validated domain, not every image processed by the platform.
False accepts are difficult to observe because some escapes remain undetected. The buyer should join inspection records to downstream tests, customer complaints, returns and failure analysis. Sampling audits and destructive tests may provide additional evidence. Reported escape rates should state detection latency and the proportion of units for which downstream evidence exists.
The transaction model should distinguish expected cost from tail risk. Frequent low-cost escapes can be modelled through observed cohorts. Rare severe events require scenario analysis, insurance review and contractual allocation. A low average error rate does not justify a low risk adjustment when the severe class lacks representative evidence.
8. Measure false rejects
A false reject sends a conforming unit to scrap, rework or manual review. Its cost includes material, labour, testing, line handling, delayed shipment and lost throughput. The system can meet a high detection target while destroying value through excessive rejects, especially when defects are rare.
The buyer should reconcile machine rejects to final disposition. A rejected unit may later be confirmed defective, accepted on review, reworked, scrapped for another reason or left unresolved. Plants often record these outcomes in separate systems. The data model should preserve the original model decision, human review and final authority.
False-reject economics depend on process constraints. A review queue may absorb extra volume during normal production and become a bottleneck at peak utilisation. The valuation case should model reject burden by shift, product and capacity state. Synergy claims from common thresholds should include the cost of local tuning and the risk of reduced yield.
9. Preserve the quality decision workflow
The inspection output needs a defined route to disposition. The workflow should identify who can accept, reject, quarantine, rework, release or override. It should record the evidence used, the applicable specification and any escalation. Model confidence should not replace the plant's quality authority.
Integration can fail when a central platform changes the interface, reason codes or latency on which operators rely. The buyer should observe work at the line and trace decisions through manufacturing execution, quality and enterprise systems. Login statistics do not prove that the model governs product disposition.
ISO 9001:2026 requires a managed quality system with controlled processes, competent people, evidence and continual improvement [8]. A roll-up should place model lifecycle and inspection changes inside that system. The integration plan should preserve customer-specific approvals and audit trails while standardising the technical components that can be shared safely.
10. Separate platform reuse from local engineering
Reusable platform value can include model-development tools, deployment automation, device management, observability, security, data lineage and common user interfaces. Local engineering includes lighting design, fixtures, image acquisition, label development, threshold setting, process integration and acceptance testing. A buyer should measure both rather than treating every deployment as software replication.
Time sheets, tickets and project records can show how much effort each cell requires. Engineering cost should be allocated to implementation, recurring support, model maintenance and new product introduction. Work performed by founders or senior specialists often remains hidden in product development or general overhead.
The synergy model should forecast effort by transfer category. Direct reuse may require confirmation and controlled release. Calibrated reuse requires target data and threshold work. Partial retraining needs labels, validation and approval. Local redevelopment needs full engineering. Portfolio margin expands only when the mix moves toward lower-effort categories without increasing quality risk.
Table 2. Model-transfer categories for a combined inspection portfolio
| Category | Evidence condition | Required work | Synergy treatment |
|---|---|---|---|
| Direct reuse | Comparable domain and passed target confirmation | Configuration and release | Near-term platform benefit |
| Calibrated reuse | Limited measurable shift | Threshold calibration and validation | Benefit after local cost |
| Partial retraining | Related domain with material shift | Target labels, retraining and validation | Deferred and probability-weighted |
| Local redevelopment | Different task or weak evidence | New acquisition, model and acceptance | No common-model synergy |
| Unsupported | Missing rights, data or authority | Remediation or retirement | Liability and transition cost |
The classification is made by receiving cell and defect class, not by product name alone.
11. Govern model versions
A combined group may inherit hundreds of model binaries, scripts, thresholds and local patches. The buyer should create a model register linking each version to code, training data, target cells, validation evidence, dependencies, release approval and rollback path. An unregistered model on a production edge device is an operating risk even when it performs well.
Versioning should separate platform changes from model and configuration changes. A camera firmware update can alter image characteristics. A preprocessing change can invalidate an otherwise unchanged classifier. A threshold adjustment can change false-reject cost without changing model weights. The register should capture all components that affect the production decision.
Release governance should include reproducible builds, signed artefacts, staged rollout and monitoring. Plants need a defined response to performance drift and failed updates. Roll-up value improves when the combined group can release safely across many cells while retaining local approval and rapid rollback.
12. Test data rights and provenance
Images can contain customer products, process know-how, serial numbers, employees and third-party intellectual property. Contracts may restrict retention, cross-customer training, offshore processing, derivative models and use after termination. The buyer should map ownership and permitted use for raw images, labels, features, synthetic data, model weights and performance records.
The diligence team should trace material datasets to contracts and collection records. Consent from one plant may not permit training for another customer. Anonymisation may be ineffective when product geometry or production context identifies the source. Acquired rights should survive change of control and support the intended integration architecture.
Data provenance also affects technical reliability. The record should identify plant, line, product, time, equipment state, camera configuration, annotation authority and transformations. A large image count without these attributes has limited transfer value. The buyer should value governed evidence rather than raw volume.
13. Evaluate synthetic data
Synthetic defects can support rare-class training and new-product introduction. Current research demonstrates potential gains from few-shot defect synthesis and cross-domain adaptation, while results remain specific to datasets and methods [9]. A buyer should treat synthetic data as an engineering tool whose contribution requires target validation.
The target should disclose generation methods, source images, prompts or conditioning, filtering, human review and the proportion of synthetic examples in each training set. Synthetic artefacts can create shortcuts that perform well in validation and fail in production. Generated examples should not enter the test set used to establish real-world performance.
The economic case should include generation, review and validation cost. Synthetic data can reduce the wait for real defects, yet it does not remove the need for target-domain evidence and operating acceptance. Any synergy from a shared generator should be released after representative plant results are observed.
14. Measure drift after deployment
Drift can arise from product change, tooling wear, supplier variation, contamination, lighting degradation, camera movement, maintenance, seasonal conditions or operator practice. The monitoring system should separate data drift, model-performance drift and process drift. Each has a different response.
Alerts should be tied to a defined baseline and operating impact. A statistical change may be harmless, while a subtle shift in a critical class can matter. Plants need thresholds, owners and escalation procedures. Performance monitoring should include reviewed samples and downstream outcomes because label-free drift measures cannot prove decision quality.
The buyer should inspect drift events and response times by plant. Persistent manual retuning can indicate weak platform transferability. A strong operating capability combines automated detection with local process knowledge, controlled release and evidence that performance recovered.
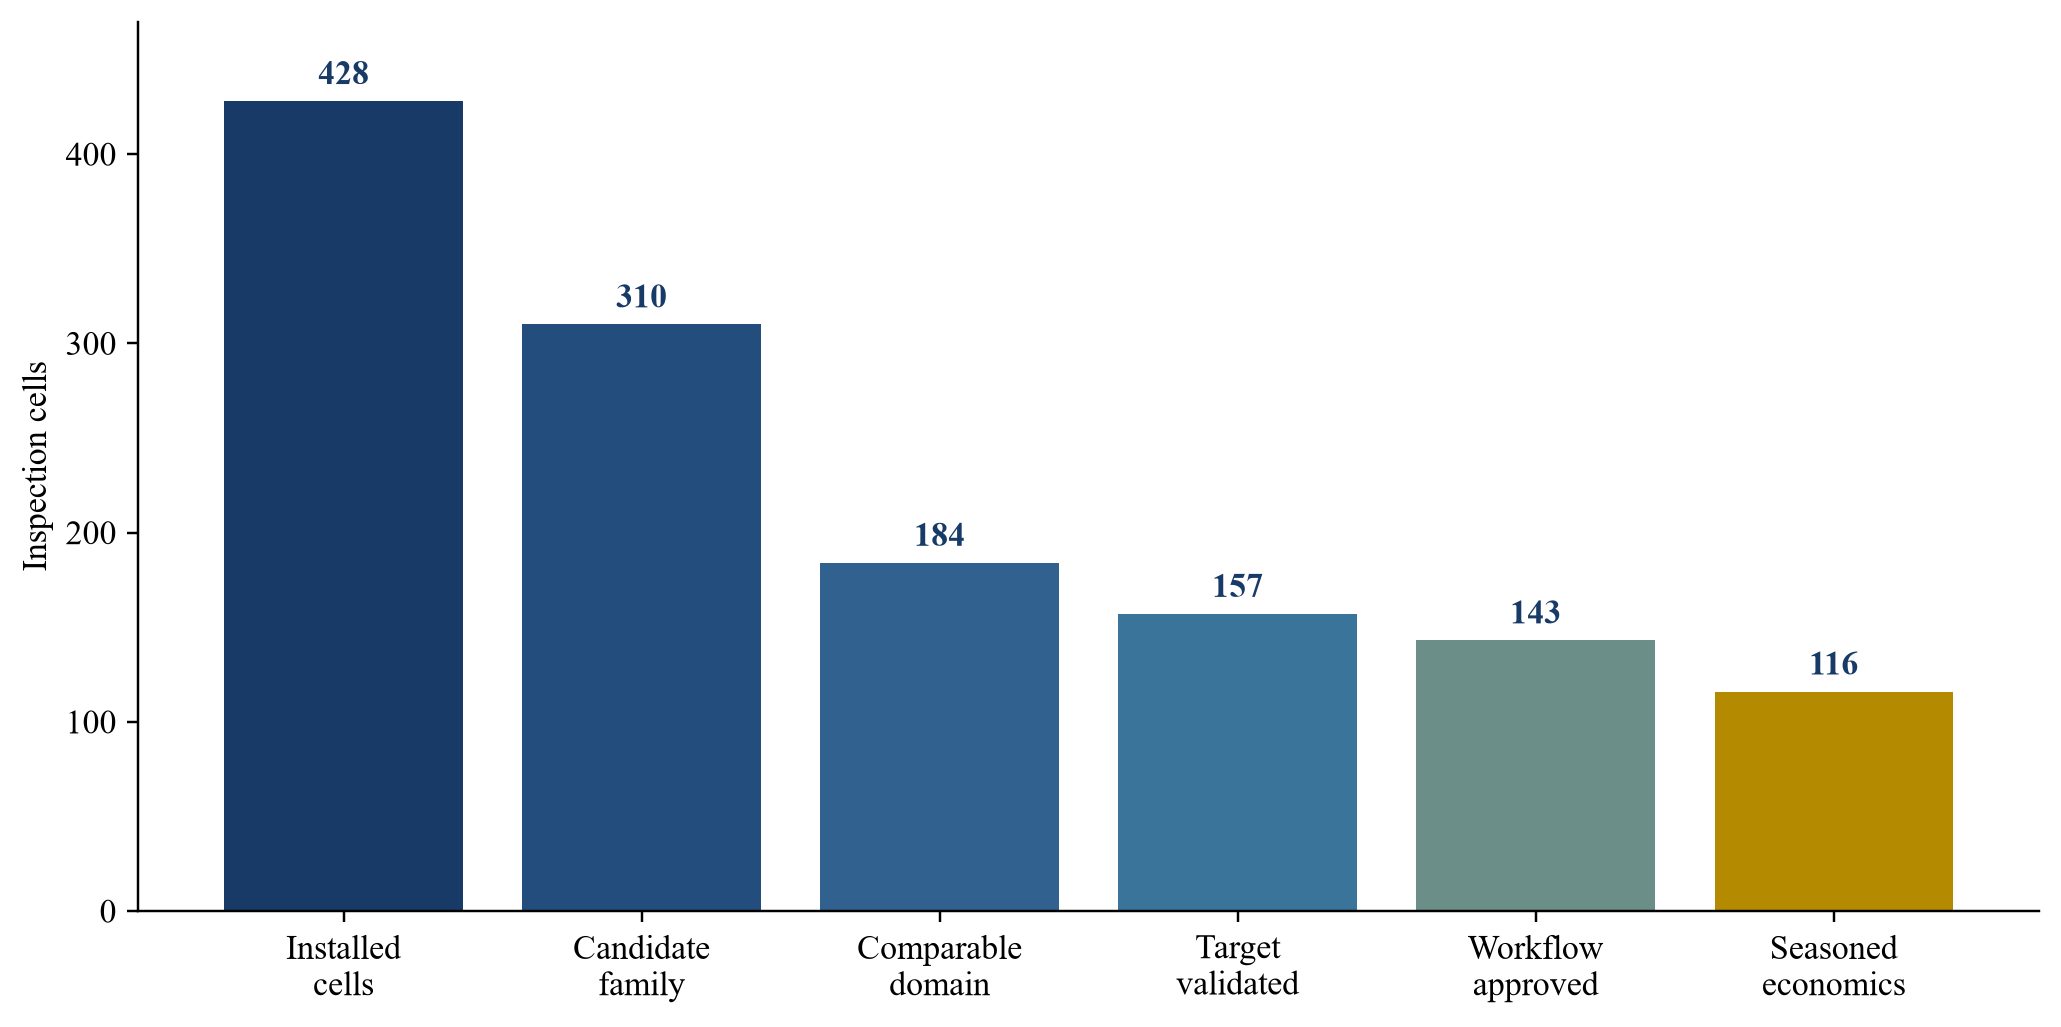
Counts are management assumptions created solely to demonstrate the diligence method.
15. Integrate edge hardware deliberately
Acquired platforms may use different cameras, lenses, lighting controllers, GPUs, industrial computers and communication protocols. A single approved hardware stack can reduce procurement and support cost. Forced replacement can also trigger downtime, revalidation and stranded inventory.
The hardware register should map compatibility, lifecycle, supplier support, cybersecurity, environmental rating and performance headroom. The team should identify components that are end of life or dependent on one supplier. Replacement economics need installation, fixture modification, image re-baselining, validation and customer approval.
Architecture decisions should follow cell economics. Stable systems with adequate security and support can remain in place behind a common management layer. High-cost or unsupported variants can migrate when maintenance events or product changes create an efficient window. The integration plan should avoid creating a portfolio-wide single point of failure.
16. Protect operational technology
Machine-vision systems often connect production networks, cameras, controllers, edge devices and cloud services. Integration can expand remote access, credentials and data flows. NIST SP 800-82 Rev. 3 provides guidance for operational-technology security, including architectures, vulnerabilities and controls [10]. CISA guidance emphasises accurate OT asset inventories [11].
The buyer should inventory devices, software, accounts, ports, protocols, certificates, remote-support routes and third-party access. It should test update, backup, recovery and incident-response procedures. Unsupported operating systems and shared credentials can turn a local weakness into a group-wide path.
Security changes can affect validation. A patch may alter drivers, latency or image processing. The quality and cybersecurity functions need a coordinated change process that preserves evidence and rollback. Portfolio standardisation should improve visibility without exposing every plant to a common uncontrolled update.
17. Test regulated and customer-specific requirements
Inspection records may support product release in automotive, aerospace, medical, food, semiconductor and other controlled sectors. Customer specifications can require approved gauges, methods, records, retention and change notification. The buyer should map these obligations to each cell and contract.
A central model update may qualify as a process change requiring customer approval or revalidation. The integration schedule should include notice periods, evidence packages and production windows. Synergies that assume immediate deployment across regulated plants should be deferred until approvals are obtained.
The combined quality system should maintain traceability from specification to inspection plan, model version, result, override and final disposition. Records must remain accessible for the required period. Migration should be tested with representative historical and current cases before the old system is retired.
18. Reconcile revenue quality
Revenue should be separated into equipment, implementation, licences, subscriptions, maintenance, engineering and outcome-linked consideration. IFRS 15 requires revenue recognition based on performance obligations and the transfer of promised goods or services [12]. The diligence model should follow the contract and delivery evidence.
Reported recurring revenue may include maintenance tied to installed hardware, bundled engineering or annual fees that depend on ongoing manual support. The buyer should reconcile contracts, invoices, collections, service effort, renewal and active cells. Revenue from inactive or unsupported deployments requires specific review.
Cohort reporting should connect revenue to technical transfer category, customer concentration and contribution margin. A common platform can improve margin when it reduces implementation and support effort. It can also increase cost during migration. The forecast should show the timing and cash effect of both.
19. Build the quality economics ledger
The ledger connects model decisions to financial outcomes. It should record inspected volume, confirmed defects, escapes, false rejects, manual reviews, scrap, rework, downtime, throughput and customer chargebacks. Each value needs a defined baseline, period, owner and approval.
Benefits should be incremental. Lower scrap can be offset by higher manual review or slower line speed. A central model may reduce engineering cost while increasing false rejects during ramp-up. Avoided warranty is partly counterfactual and should retain uncertainty. The ledger should prevent double counting across quality, yield and capacity categories.
Finance should approve the valuation method, operations should approve the physical effect, and quality should approve defect and disposition evidence. Vendor estimates remain separate. The combined group can use the same ledger for synergy tracking, pricing, renewal and model prioritisation.
20. Construct the hypothetical case
The illustrative group includes three acquired platforms, 96 plants and 428 inspection cells. Management initially identifies 310 cells for a common model family based on product and application names. The domain map retains 184 comparable cells. Target validation succeeds on 157, workflow approval is obtained on 143 and 116 have twelve months of seasoned economic evidence.
The case assumes USD 18.6 million of recurring software and support revenue, USD 7.4 million of integration and hardware revenue, and USD 5.8 million of annual engineering cost. Management estimates USD 4.6 million of annual gross benefit from common models, tools, procurement and support. These figures are hypothetical management assumptions for illustration only.
Evidence adjustments remove cells without comparable domains, incomplete target validation, unapproved workflow changes and insufficient seasoning. The model also includes retraining, validation, hardware replacement, customer approval and false-reject remediation. The retained annual benefit is USD 1.7 million before tax, financing and transaction-specific effects.
Table 3. Hypothetical evidence-adjusted integration economics
| Item | Management case | Evidence adjustment | Retained annual value |
|---|---|---|---|
| Common model engineering | 1.6 | Retraining and target validation | 0.6 |
| Hardware and procurement | 0.9 | Replacement and requalification | 0.4 |
| Shared support operations | 1.1 | Local expertise and response coverage | 0.5 |
| Quality and yield improvement | 1.0 | False rejects, approval and seasoning | 0.2 |
| Total annual gross benefit | 4.6 | Combined evidence and execution deductions | 1.7 |
All amounts are management assumptions in USD millions and do not represent an observed transaction.
21. Translate evidence into valuation
IFRS 13 defines fair value as a market-based measurement using assumptions that market participants would use [13]. The transaction case should separately model stand-alone cash flow, integration cost and buyer-specific synergy. A theoretical shared-model opportunity does not become stand-alone value merely because the buyer has the capability to pursue it.
The valuation bridge can begin with recurring and project cash flows by cohort. It then includes customer retention, contribution margin, hardware lifecycle, engineering intensity and reinvestment. Evidence adjustments reflect domain comparability, target validation, rights, concentration, cybersecurity and operating dependence. Buyer synergy is probability-weighted by cell and released according to milestones.
IFRS 3 and IAS 38 govern business combinations and identifiable intangible assets [14][15]. Accounting allocation and commercial valuation answer related but different questions. The diligence record should support both without allowing accounting categories to replace the operating evidence needed for price.
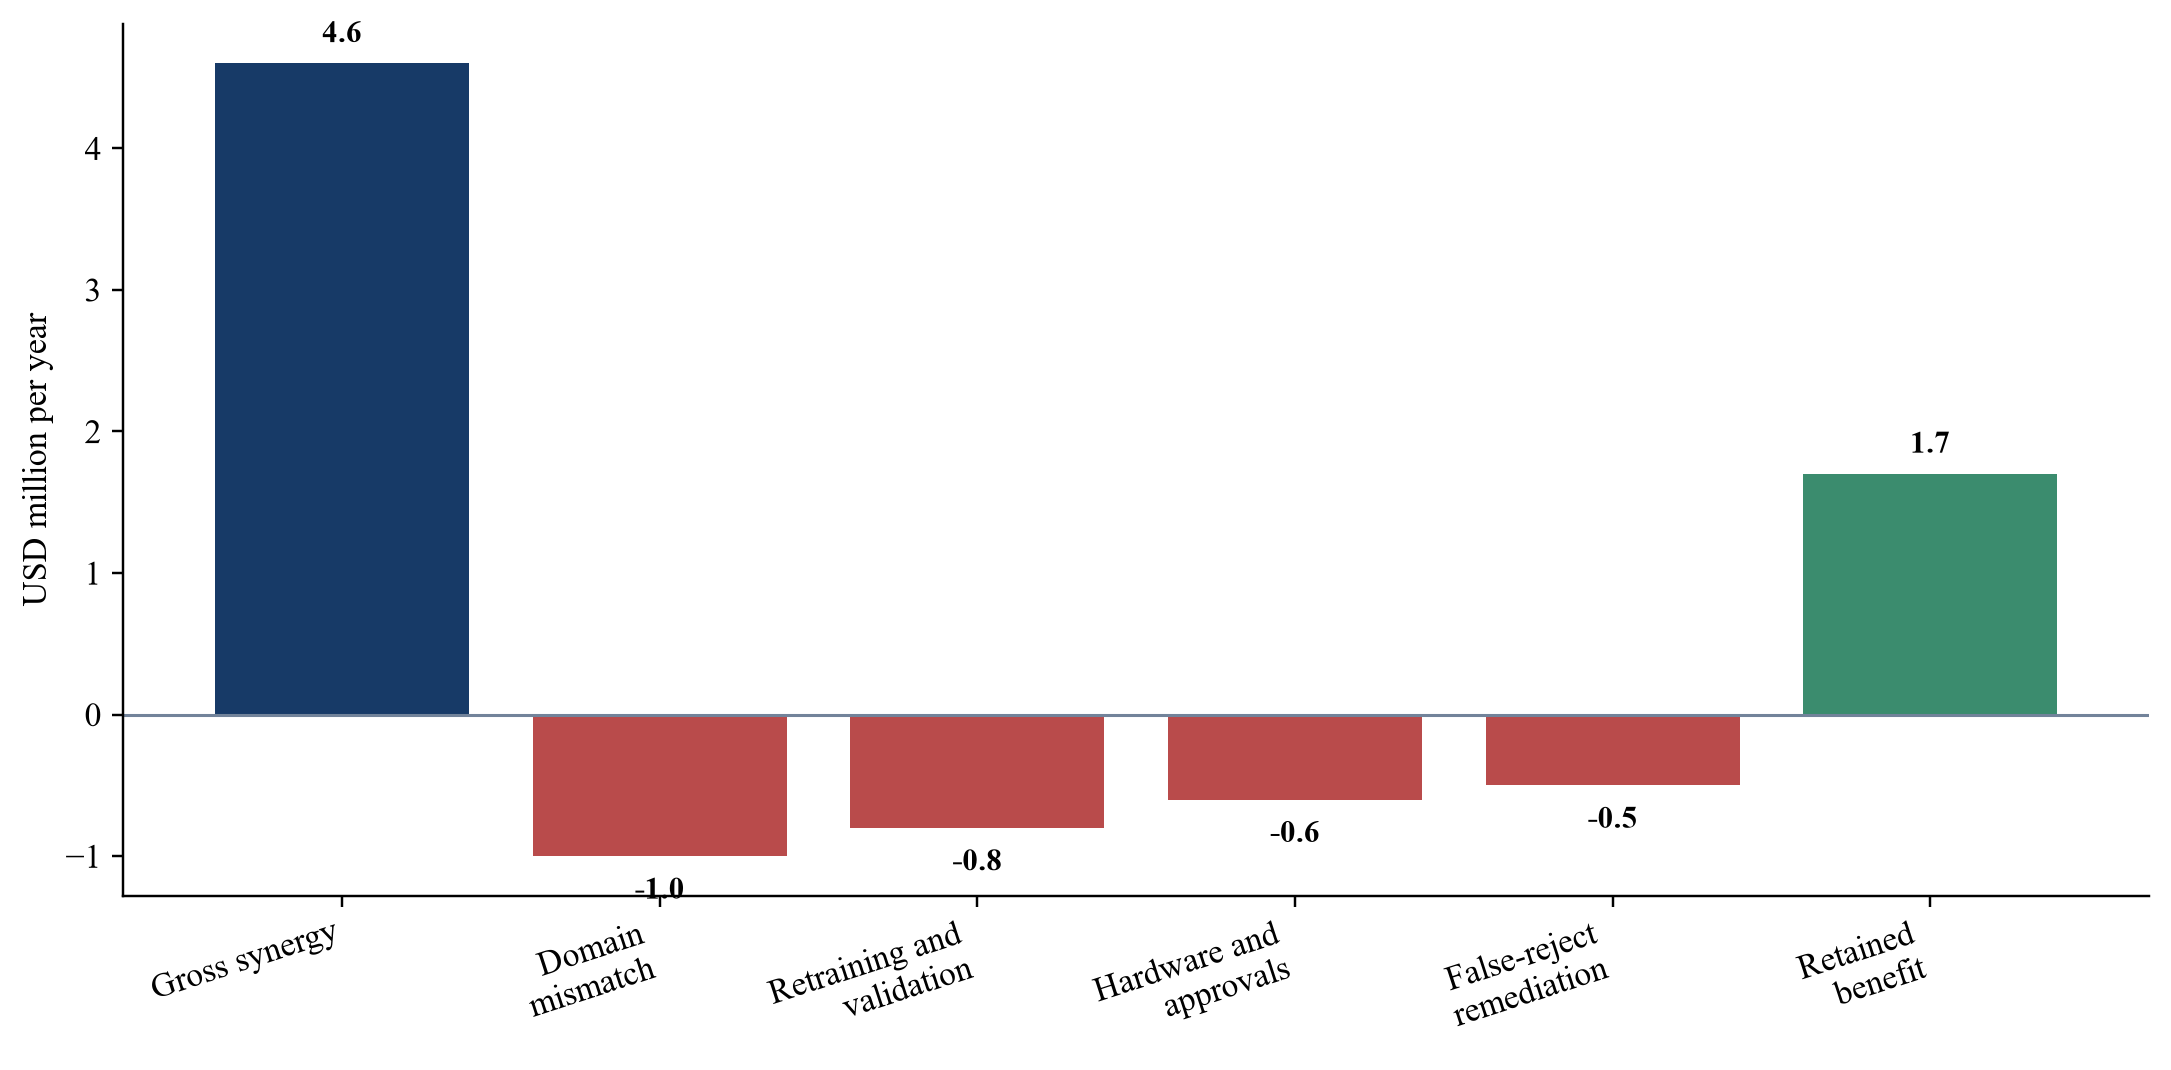
All amounts are management assumptions in USD millions per year.
22. Structure purchase-price protection
Known evidence gaps should be allocated through specific transaction terms. A holdback can address incomplete customer acceptance. An earn-out can depend on retained recurring revenue and validated contribution margin. A special indemnity can address disclosed data-rights or product-liability issues. Broad warranties should not replace quantified diligence.
Milestones should be observable and resistant to manipulation. Model accuracy alone can be improved by changing thresholds or test populations. Better milestones combine target-domain validation, false-reject limits, approved workflow deployment, customer retention and cost-to-serve. The agreement should define populations, periods, data access and dispute procedures.
The buyer should preserve access to evidence after closing. Sellers and management may need to support customer confirmations, model provenance and rights remediation. Transition services should define systems, people, security and service levels. Integration actions that would make a milestone impossible to measure need explicit treatment.
23. Plan integration sequencing
The first integration wave should use cells with high domain comparability, strong evidence, manageable customer approvals and reversible deployment. The objective is to validate the operating system for transfer before scaling it. Critical regulated cells and weakly documented deployments should remain outside the first wave.
Each wave should include source-model review, target evidence, offline testing, shadow operation, controlled release and post-release monitoring. Rollback criteria should be agreed before production. The plant retains disposition authority throughout the transition.
Portfolio sequencing should consider engineering capacity. Parallel migrations can overload the same experts and hide defects in rushed validation. A capacity-constrained plan may create value faster by completing fewer transfers with reliable evidence. The integration office should track cells, decisions, dependencies, cost and outcomes.
24. Retain critical talent
Value may depend on application engineers who understand optics, process conditions and customer relationships. Data scientists can rebuild a model, while a local expert may know why a camera was positioned differently or why an apparently conforming defect class was excluded. The diligence team should map dependency by cell and workflow.
Retention plans should cover technical, quality and customer roles. Knowledge transfer needs controlled documents, configuration records, witnessed tasks and shadow support. Training attendance does not establish competence. A receiving team should demonstrate deployment, validation, incident response and rollback.
The operating model should clarify central and local responsibilities. A central platform team can own tooling, security and common methods. Plant or regional teams can own process context, acceptance and response. Decision rights should follow accountability for product quality and customer obligations.
25. Govern AI risk
The NIST AI Risk Management Framework organises work around govern, map, measure and manage [16]. Its principles can be applied to model inventory, context, evaluation, monitoring and accountability. Current European guidance on high-risk AI systems may be relevant depending on use, jurisdiction and machinery context [17]. Transaction-specific legal review remains necessary.
The combined group should document intended use, prohibited use, affected parties, human oversight, limitations and evidence. A model cleared for advisory review should not automatically be connected to autonomous rejection. Changes in authority require separate safety and quality approval.
Risk governance should also cover third-party models, open-source components and cloud services. The buyer needs licences, security review, version control and replacement options. Concentration in one external provider can reduce integration flexibility and create continuity risk.
26. Design the integration scorecard
The board scorecard should combine technical, operating, commercial and risk evidence. Technical measures include target-domain performance, drift and rollback readiness. Operating measures include approved cells, overrides, review burden and incident response. Commercial measures include retention, contribution margin and integration cash flow.
The scorecard should show distributions rather than portfolio averages. A strong group-wide accuracy number can conceal a plant with unacceptable false rejects. Metrics should be segmented by cell, product, defect class, customer and model version. Exceptions need owners and ageing.
Synergy should be reported only after the applicable gate. Forecast opportunity, validated capability, deployed capability and seasoned financial outcome are separate states. This discipline makes the integration case auditable and reduces the incentive to declare savings before costs and operating consequences are known.
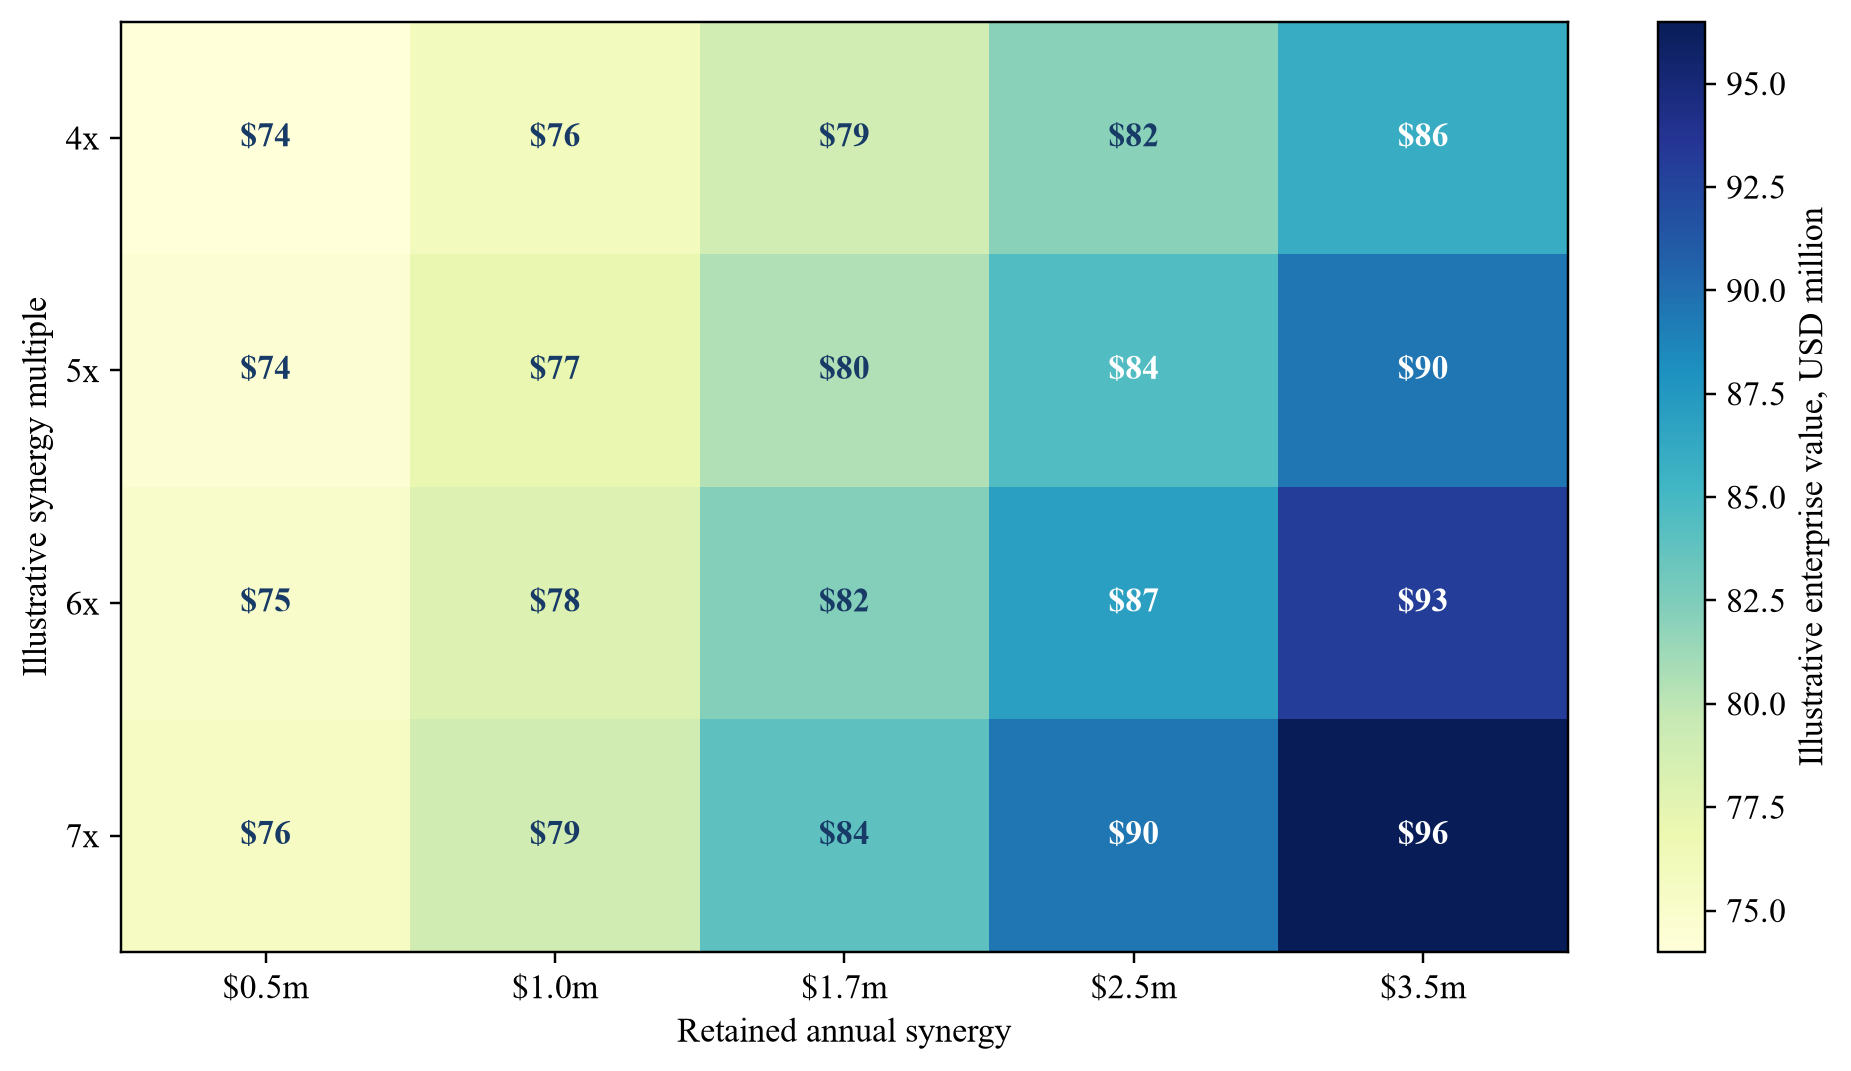
Values are management assumptions in USD millions and exclude net debt and transaction adjustments.
27. Build the diligence request list
The request list should begin with source records. Core items include plant and cell registers, inspection plans, defect ontologies, model inventories, training-data provenance, validation packs, camera and lighting configurations, release histories, override logs, quality outcomes, customer approvals, contracts, revenue detail, engineering time, support tickets and security inventories.
Sampling should be risk based. The buyer should select plants across sectors, geographies, age, hardware, product families, renewal outcomes and support intensity. Model samples should include high-volume, rare-critical, recently transferred, disputed and poorly performing classes. Management should explain exclusions and allow traceability to raw evidence.
Customer interviews should include quality, operations and finance where permission exists. Internal interviews should cover engineering, data science, implementation, support, sales, finance, security and legal. Differences in definitions or reported performance are findings that need resolution before value is assigned.
28. Execute the first one hundred days
Days zero to thirty should preserve production continuity and evidence. The buyer freezes undocumented model changes, confirms credentials and backups, reconciles plants, cells, models and contracts, and identifies critical people and customer approvals. It establishes incident and escalation paths across the combined group.
Days thirty-one to sixty should standardise the domain map, defect ontology, model register and quality-economics ledger. The team selects a limited transfer wave and completes offline and shadow validation. Security and rights gaps are prioritised according to production consequence.
Days sixty-one to one hundred should release approved transfers with rollback and monitoring. The board receives cell-level evidence on performance, false rejects, escapes, engineering cost, customer response and retained synergy. Further waves proceed only when the integration method has produced accepted and reproducible results.
Table 4. One-hundred-day plan for an AI quality-control roll-up
| Period | Operating priority | Evidence deliverable | Investment decision |
|---|---|---|---|
| Days 0 to 30 | Preserve cells, records, credentials and customer commitments | Reconciled plant, cell, model and contract registers | Freeze unsupported migrations |
| Days 31 to 60 | Standardise ontology, domain mapping and release control | Target validation and first-wave acceptance pack | Approve limited transfer wave |
| Days 61 to 100 | Deploy with shadow operation, rollback and monitoring | Cell-level quality and cost evidence | Release evidence-backed synergy |
| Quarter 2 onward | Scale reusable components and retire unsupported variants | Seasoned portfolio scorecard | Reprice cohorts and migration plan |
The sequence protects production while establishing evidence for scalable integration.
29. Recognise limitations and research priorities
Industrial inspection performance is context dependent. A validation result covers the defined population, model and period. It does not establish performance after a product, process, hardware or acceptance change. Sparse critical defects can make uncertainty large even when common-class performance appears stable.
The hypothetical case omits tax, financing, working capital, transaction fees, insurance, legal claims and many plant-specific effects. Customer approvals and actual integration demand remain unknown until verified in a transaction. The framework supports diligence and governance; it does not produce a valuation opinion.
Further research should examine whether domain-comparability scores predict retraining cost, whether finance-approved quality outcomes predict renewal better than image metrics, and how synthetic data affects performance across plants. Comparable studies require governed datasets, consistent definitions and publication of unsuccessful transfers as well as successful ones.
30. Conclusion
An AI quality-control roll-up creates value when the buyer can reuse governed components across plants while preserving local quality authority. The relevant unit of analysis is the inspection cell and defect class. Product labels, image counts and portfolio-wide accuracy do not establish transferability.
The evidence chain begins with inspection identity and domain comparability. It continues through target validation, workflow acceptance, quality economics and operating continuity. False accepts, false rejects, retraining, hardware change and customer approval belong in the same investment model as engineering savings and platform reuse.
A disciplined integration programme releases synergy after evidence. It protects production, makes model transfer auditable and gives the buyer a defensible basis for valuation, transaction terms and post-close capital allocation.
References
- Cognex Corporation (2025). Annual Report for the year ended 31 December 2024. US Securities and Exchange Commission. https://www.sec.gov/Archives/edgar/data/851205/000119312525054457/d927251dars.pdf
- Cognex Corporation (2026). First Quarter 2026 Results and AI Vision Product Update. US Securities and Exchange Commission. https://www.sec.gov/Archives/edgar/data/851205/000085120526000037/a04052026-xex991xq12026ear.htm
- Bergmann, P. et al. (2023). Industrial Anomaly Detection with Domain Shift: A Real-world Dataset and Masked Multi-scale Reconstruction. https://arxiv.org/abs/2304.02216
- Bergmann, P. et al. (2019). MVTec AD: A Comprehensive Real-World Dataset for Unsupervised Anomaly Detection. https://arxiv.org/abs/1904.02260
- Model-based Transfer Learning for Automatic Optical Inspection based on Domain Discrepancy (2023). https://arxiv.org/abs/2301.05897
- National Institute of Standards and Technology (2022). Industrial Artificial Intelligence Management and Metrology. https://www.nist.gov/programs-projects/industrial-artificial-intelligence-management-and-metrology-iaimm
- National Institute of Standards and Technology (2023). Augmented Intelligence for Manufacturing Systems. https://www.nist.gov/programs-projects/augmented-intelligence-manufacturing-systems-aims
- International Organization for Standardization (2026). ISO 9001:2026 Quality management systems; Requirements. https://www.iso.org/standard/9001
- Güğül, S.H., Levi, K. and Acar, B. (2026). Accelerating New Product Introduction for Visual Quality Inspection via Few-Shot Diffusion-Based Defect Synthesis. https://arxiv.org/abs/2604.22850
- National Institute of Standards and Technology (2023). Guide to Operational Technology Security, NIST SP 800-82 Revision 3. https://csrc.nist.gov/pubs/sp/800/82/r3/final
- Cybersecurity and Infrastructure Security Agency (2025). Foundations for Operational Technology Cybersecurity: Asset Inventory Guidance. https://www.cisa.gov/resources-tools/resources/foundations-ot-cybersecurity-asset-inventory-guidance
- IFRS Foundation (2026). IFRS 15 Revenue from Contracts with Customers. https://www.ifrs.org/issued-standards/list-of-standards/ifrs-15-revenue-from-contracts-with-customers/
- IFRS Foundation (2026). IFRS 13 Fair Value Measurement. https://www.ifrs.org/issued-standards/list-of-standards/ifrs-13-fair-value-measurement/
- IFRS Foundation (2026). IFRS 3 Business Combinations. https://www.ifrs.org/issued-standards/list-of-standards/ifrs-3-business-combinations/
- IFRS Foundation (2026). IAS 38 Intangible Assets. https://www.ifrs.org/issued-standards/list-of-standards/ias-38-intangible-assets/
- National Institute of Standards and Technology (2023). Artificial Intelligence Risk Management Framework 1.0. https://www.nist.gov/itl/ai-risk-management-framework
- European Commission (2026). Guidelines for providers and deployers of AI high-risk systems. https://digital-strategy.ec.europa.eu/en/policies/guidelines-ai-high-risk-systems
- International Organization for Standardization (2021). ISO 23247-1 Digital twin framework for manufacturing; Overview and general principles. https://www.iso.org/standard/75066.html
- International Organization for Standardization (2019). ISO 17359 Condition monitoring and diagnostics of machines; General guidelines. https://www.iso.org/standard/71194.html
- European Machine Vision Association (2021). EMVA Standard 1288 for Characterization and Presentation of Specification Data for Image Sensors and Cameras. https://www.emva.org/standards-technology/emva-1288/
- National Institute of Standards and Technology (2024). Research Opportunities for Advancing Measurement Science for Manufacturing Robotics. https://nvlpubs.nist.gov/nistpubs/gcr/2024/NIST.GCR.24-054.pdf
- International Electrotechnical Commission (2021). IEC 62443 Industrial automation and control systems security. https://www.iec.ch/cyber-security
- International Organization for Standardization (2022). ISO/IEC 27001 Information security management systems. https://www.iso.org/standard/27001
- National Institute of Standards and Technology (2024). Cybersecurity Framework 2.0. https://www.nist.gov/cyberframework
- Cognex Corporation (2024). Annual Report for the year ended 31 December 2023. US Securities and Exchange Commission. https://www.sec.gov/Archives/edgar/data/851205/000119312524068654/d649852dars.pdf
About the Author
Chennakeshav (CK) is a corporate finance and investment banking executive with 25+ years of global experience in deal origination, structuring and execution across M&A, growth capital and corporate strategy. He has led value-creation mandates for founders, corporates and funds — bridging the boardroom view to hands-on execution and close.
His career spans Morgan Stanley, HSBC, Lloyds Banking Group, EWEC, ADQ portfolio companies and Emirates Growth Fund, across TMT, real estate, fintech, deeptech, cleantech, infrastructure and energy. He has partnered with C-suite leaders, private equity and venture funds, sovereign wealth funds and family offices to finance complex fund raises and scale-up ventures, and has led M&A due diligence, post-merger integration and business-transformation initiatives to create value.
At Matchpoint Partners he is Managing Partner, leading the firm's corporate finance, M&A and capital-raising practice. He holds an MBA from London Business School, an engineering degree from VTU and a Master of Laws (LLM, in progress) from UCL London.
An active start-up mentor, CK mentors at Techstars, DIFC FinTech Hive, Startup Grind, Founder Institute and IN5, serves as Entrepreneur Mentor in Residence (EMiR) at London Business School, and judges the Entrepreneurship World Cup.
https://www.linkedin.com/in/ckadya/
https://www.matchpoint-partners.com/team/ck-adya.html
This paper is part of a continuing series on the structure of private and alternative markets. The views expressed are the author's own. The paper is for information only, describes market structure in general terms, and does not constitute investment, legal, tax or regulatory advice or a recommendation in respect of any security, vehicle or counterparty.
