

1. The corporate decision
The board should approve the operating service that its electricity strategy can support. For an AI-intensive business, that means identifying the customer work to be completed, the locations where it can be performed, the date it must be available and the consequences of interruption. A power proposal should connect each of those requirements to an evidenced supply arrangement and a cash obligation. The decision can then address whether to commit, retain an alternative or defer expenditure until a specific uncertainty is resolved.
The framework in this paper concerns a business buying and using computing capacity, including an enterprise operating its own installation or procuring hosted service. It examines the effect of power on corporate location and execution. A property investor's valuation of powered land, a lender's security package and a generator's project-finance model require different supporting analyses. Those perspectives may inform the corporate decision, but the operating company remains responsible for defining what it needs to deliver and what commitments it can absorb.
The proposed starting document is a workload schedule linked to a cash schedule. The workload schedule identifies critical live services, work that can be delayed within an agreed deadline and work that can move to another permitted location. The cash schedule records deposits, enabling works, reserved capacity, energy purchases, substitute computing service and exit obligations. Both should use the same start dates and operating assumptions. Approving an early equipment payment against an unconfirmed power date creates an exposure that should be visible before the commitment is made.
This paper uses selected evidence reviewed on 10 September 2026. Dubai, Abu Dhabi and Qatar examples illustrate jurisdiction-specific questions; British trial and connection evidence supply separate comparisons. The analysis establishes no common GCC tariff, renewable procurement right or grid-access timetable. A project in Saudi Arabia, Kuwait, Bahrain, Oman or another market requires its own current utility, legal and technical evidence. No actual site offer, customer service agreement, engineering design or board-approved budget was supplied. The numerical cases therefore use wholly hypothetical inputs.
2. Read the evidence at the correct scale
The IEA's 2026 Key Questions on Energy and AI places global data-centre electricity consumption at 485 TWh in 2025 and projects approximately 950 TWh in 2030. These figures concern the global data-centre estate, with the future figure explicitly a projection. They establish context for growing electricity requirements. They do not establish demand for a particular company's service, the timing of a specific grid connection or the profitable utilisation of equipment purchased today. [1]
The IEA's Electricity 2026 flexibility chapter describes demand response through arrangements that encourage electricity users to shift or reduce consumption. Its discussion connects participation to programme design, contracts and power-system conditions. For a corporate buyer, that supports a practical diligence question: which actual arrangement would pay for the proposed response, and under what measurement and performance rules? The paper assigns no incentive income to an installation merely because its workload can technically change. [2]
National Grid reported a London trial in March 2026 using a cluster of 96 GPUs. Over five days in December 2025, the participants sent more than 200 simulated grid-event requests and reported load reductions of up to 40%, with critical workloads continuing. This is a useful reported demonstration from participating organisations. Its equipment, workload mix, test duration and simulated requests define the evidence boundary. A corporate customer should test its own service before adopting any corresponding reduction percentage or contractual obligation. [3]
Connection processes also change. National Grid's Connections Reform update dated 25 August 2026 describes work with NESO and other participants to assess applications and produce connection offers. That process-level information helps identify questions for a British location assessment. An applicant still needs its own offer, milestones, conditions and responsible counterparties. The existence of a reform programme supplies no confirmed commissioning date for an individual project. [4]
The recommended evidence register should state the author, date, geography, status and exact claim supported by each source. A forecast, published tariff schedule, participating-company trial and executed connection agreement answer different questions. Where several sources use the same word, such as capacity, record the unit and definition before combining them. A site with an advertised megawatt figure may still lack evidence concerning the relevant delivery point, time period or operating restriction. The register should leave those matters unresolved until the responsible party supplies an answer.
3. Define the workload and the electrical boundary
Begin with the business service. A live customer interaction may have a response-time requirement, whereas an internal model-training job may have a completion deadline measured over a longer interval. Those are proposed classifications for analysis, not universal descriptions of all inference or training. The service owner should document actual contractual commitments, acceptable delays and the cost of missed delivery. A workload receives flexibility only to the extent supported by those requirements and subsequent testing.
Specify the measurement boundary for power. The examples below distinguish the electricity used by computing equipment from the electricity entering the facility, which also serves supporting systems. Power usage effectiveness, or PUE, expresses total facility energy divided by IT equipment energy over a stated period. The model assumes a ratio of 1.30; it is an illustration and does not represent a measured local installation. A real assessment should establish metering boundaries and operating conditions before comparing ratios supplied by different providers.
Annual energy and maximum demand should have separate records. The hypothetical mean IT load of 6 MW at PUE 1.30 produces average facility demand of 7.8 MW. Multiplying by 8,760 hours gives 68,328 MWh for the model year. These averages do not prove that instantaneous demand stays below a proposed 10 MW connection limit. The engineering review should examine starts, ramps, cooling demand and other coincident loads using appropriate time resolution and the conditions in the actual connection agreement.
The service comparison also needs a separate productivity assumption. Equal electricity consumption does not demonstrate equal completed work across different processors, software, operating temperatures or scheduling policies. For the numerical comparison, the two sites and temporary provider are assumed to deliver the same assessed useful service. That assumption must be replaced by workload-specific performance evidence in an actual transaction. Record completed jobs, their quality and their deadlines alongside electrical measurements so an apparent saving cannot be created by silently delivering less service.
Build the load forecast from named operating decisions. Identify which equipment has been ordered, what capacity is reserved, how customer demand is supported and when each stage can be commissioned. Management estimates should be identified explicitly within approval material. The forecast should include a lower-utilisation case and the associated minimum payments. A business should know the cash cost of a slower ramp before it signs obligations based on its intended full load.
Test supporting resources at the same time. Cooling, communications, permitted data handling, water where relevant and the availability of qualified maintenance support can determine whether electrical capacity produces useful service. These are diligence requirements rather than claims about any particular city. The operations team should identify each dependency, its supplier and its failure consequence. A proposed location remains conditional when a dependency essential to customer delivery has only an indicative offer or an untested operational plan.
4. Compare locations using evidence and decision rules
The location scorecard should first identify requirements that a candidate must satisfy. Examples include the actual right to occupy and operate, an acceptable route for the relevant data, demonstrated service latency and electricity delivery by the required date. Management should define those requirements before viewing commercial offers. An inexpensive option that lacks evidence for a necessary condition should remain conditional. Giving it a low score and averaging that score with attractive prices can conceal the unresolved approval issue.
Use comparative scoring only after documenting those conditions. The proposed scorecard records each site's status, the evidence supporting it and the commercial consequence of uncertainty. A signed offer may still be conditional on works, deposits or another party's performance. An operational site may still require a customer-specific capacity reservation. The reviewer should capture those distinctions in words alongside the score. This permits the board to see which comparison rests on delivered capability and which rests on an assumption.
| Decision dimension | Evidence required | Consequence of a gap |
|---|---|---|
| Start date and usable capacity | Executed offer, delivery boundary and milestones | Price substitute service or defer commitment |
| Workload suitability | Measured completion, quality and latency results | Retain affected work at an approved alternative |
| Data and operating permissions | Applicable approvals and contract assessment | Keep the location conditional |
| Comparable cash costs | Full price schedule, deposits and enabling works | Rebuild the common-horizon comparison |
| Flexibility | Tested reduction, duration and recovery | Exclude unsupported dispatch obligations |
| Continuity | Integrated recovery tests and dependency records | Cost the residual service exposure |
| Exit and expansion | Notice, renewal, assignment and capacity terms | Model the cost of changing the operating plan |
Decision framework only. No country or actual site is ranked; evidence and acceptance thresholds must be established for the proposed service.
The location file should show the evidence date and the person accountable for refreshing it. A landlord's brochure, a utility's general development announcement and a project-specific connection offer have different purposes. Obtain clarification directly from the relevant contracting party where the distinction affects the investment. This proposed workflow does not prescribe a universal documentary standard. It gives the corporate team a way to trace a material assumption to the evidence that the decision maker is being asked to accept.
For GCC comparisons, tariff eligibility deserves explicit attention. DEWA's published schedule distinguishes residential/commercial and industrial consumption bands, lists meter charges and identifies a separate fuel surcharge. Its page reviewed for September 2026 shows AED 0.060 per kWh for the electricity fuel surcharge and states that 5% VAT applies. The commercial rate for consumption above 6,000 kWh per month is AED 0.380 per kWh before that surcharge and tax. These are dated schedule components, not a confirmed all-in price or eligibility decision for a proposed project. [5]
KAHRAMAA's tariff page separately describes commercial customers and an industrial subsidised category. The latter description requires the relevant industrial activity, licences and approvals. The corporate comparison should therefore obtain confirmation of the account's category before applying a schedule. This paper assigns no Qatar tariff to AI operations and makes no numerical cross-country ranking. The same evidence discipline should be applied to every candidate market and to special-zone, landlord or hosted-service arrangements. [6]
Currency and timing should be consistent across bids. If one offer is denominated in a different currency, show the assumed conversion basis and any proposed hedging cost separately. If an enabling payment occurs before operations begin, discount it from its actual payment date. Record refundable deposits as tied-up cash with the conditions for recovery, rather than automatically treating them as permanent operating expense. The model below simplifies these issues deliberately; the project-specific comparison should restore them where they could change the decision.
5. Map the power contracts and their responsibilities
The corporate team should prepare a contract map showing who promises each required service. The map should identify the connection, electricity supply, site or hosting service, flexibility arrangement, backup capability and environmental attributes. These functions can sit in one agreement or several. Their presence in a single commercial package does not remove the need to read the underlying obligations. Each material promise should have a delivery boundary, performance measure, payment rule and response to non-performance.
Start with connection rights and restrictions. Ask which party owns the relevant application, which milestones remain, when deposits become payable and whether capacity can be transferred or expanded. Counsel and the engineer should examine interruption rights, operating limits and any conditions for energisation. Where the business is a tenant or hosted-service customer, identify how the provider's upstream rights support the downstream promise. A customer contract should be assessed against the actual upstream capability available for that customer.
The electricity schedule should separate energy, capacity, network and service charges wherever the agreement distinguishes them. Record any minimum purchase, indexation, pass-through, imbalance settlement, credit support or early-exit amount. These are proposed review categories; the paper does not assume they occur in every market or contract. A fixed headline rate should be tested against the events that allow another part of the bill to change. The finance model should reproduce the executed payment mechanics before adding speculative savings.
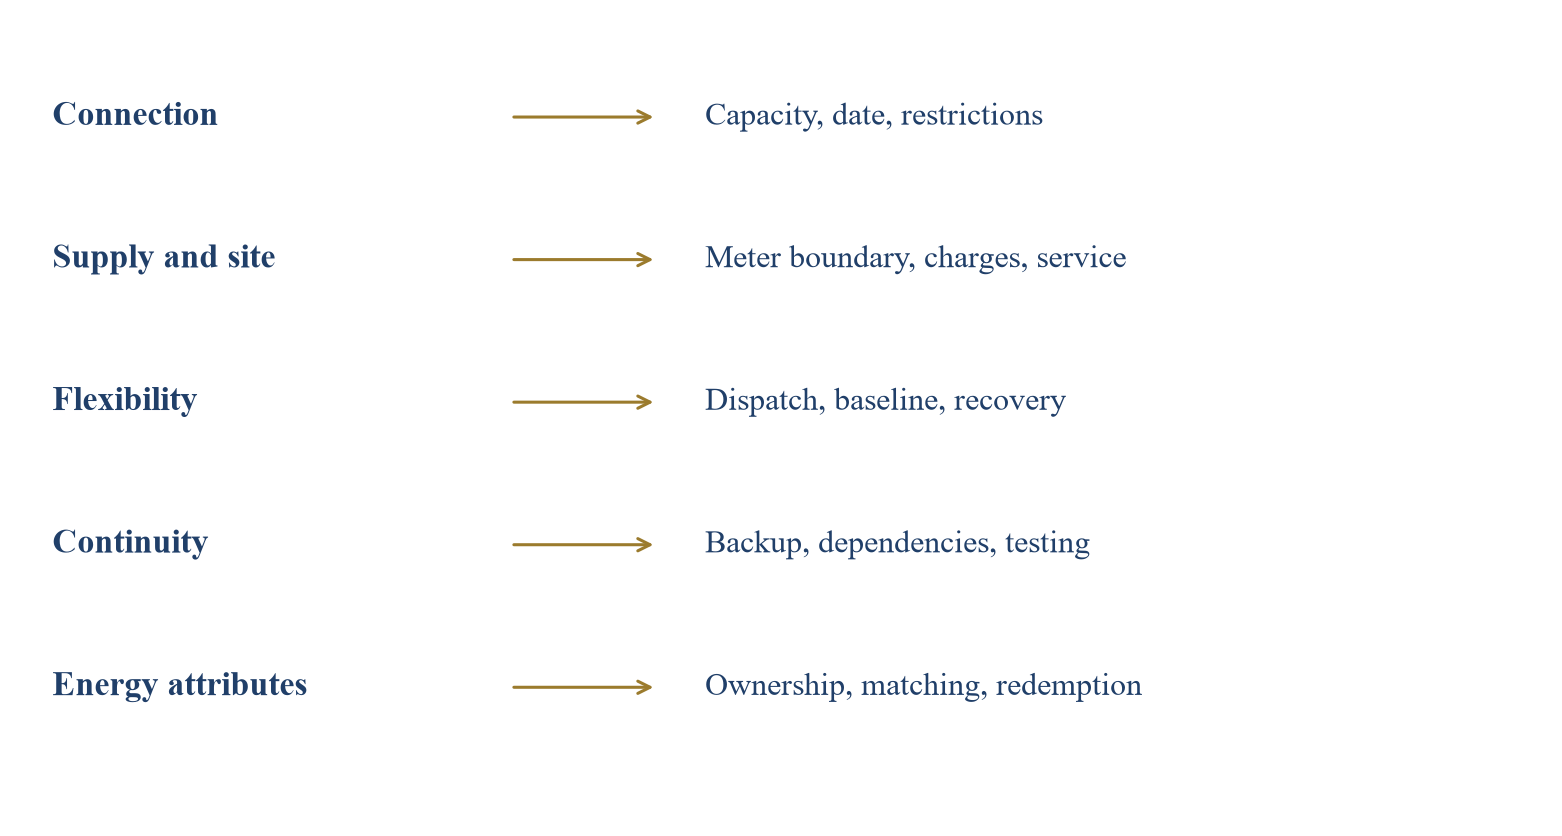
Each row is a distinct diligence question. Actual agreements may combine several functions; the map creates no legal entitlement.
A renewable power purchase agreement should be read for the product actually delivered. Determine whether it supplies physical energy, financial settlement, environmental attributes or a combination, and establish the relevant legal structure. If output varies over time, the business should price the remaining supply requirement and any settlement exposure under the actual arrangement. This is a proposed contract-review method. No universal procurement route, right to wheel electricity or ability to sell surplus power is assumed for the jurisdictions discussed.
Dubai's Shams Dubai credit-transfer material illustrates why account-level conditions matter. DEWA describes offsetting across eligible accounts on the same plot under the relevant account-holder arrangement. Its FAQ also states that accumulated credit cannot transfer to a new owner's or tenant's account. A location model using such credits should examine the named accounts, eligibility and exit treatment. The programme should not be extended analytically into a general right to offset unrelated facilities or sell power to another customer. [7]
Contract alignment should include distress and exit. Ask what happens if the site provider loses its upstream supply arrangement, if the corporate customer reduces its load or if a planned expansion is delayed. Identify any rights to information, cure, replacement service or termination in the actual agreements. A proposed negotiation position is not an existing remedy. The approval document should distinguish the protection requested from the protection accepted, and show the cash exposure that remains after the negotiated terms are applied.
6. Keep energy claims and physical continuity distinct
Environmental claims need their own evidence record. Abu Dhabi's Department of Energy describes clean energy certificates as a mechanism for claiming specified clean-energy attributes, with production and consumption within the emirate and redemption by the beneficiary. The certificate scheme concerns the allocation of those attributes. A purchaser should separately verify its physical electricity service, interruption provisions and backup arrangements. A certificate holding does not supply evidence that a particular critical workload can continue during a power interruption. [8]
GHG Protocol's Scope 2 Guidance addresses accounting for purchased energy and specifies quality criteria for contractual instruments used in the market-based method. The reporting team should establish the applicable method, inventory boundary and instrument evidence. The power-procurement decision should also retain the actual consumption profile and the physical operating arrangement. This permits financial, operating and reporting teams to discuss the same transaction without treating their different measures as interchangeable. [9]
The standards timetable needs a dated review. GHG Protocol's announcement of 29 July 2026 describes planned consolidation with ISO, a public consultation in the second quarter of 2027 and intended publication in the fourth quarter of 2028. Its FAQ describes further development following the scope 2 consultation. The paper therefore does not present previously proposed hourly-matching provisions as adopted universal requirements. A company should confirm the rules applicable to its own reporting programme and jurisdiction at the relevant reporting date. [10]
For a proposed power contract, record who owns the environmental attributes, whether they have already been allocated, how they are transferred and how the intended claim will be supported. This is an evidence request for the specific transaction. If the purchaser requires a particular matching period or geographic boundary, it should appear in the procurement specification and contract review. An analyst should not add a price premium to the model for a claim that the proposed instruments cannot substantiate.
The board can then review separate outputs: the electricity service available to operations, the cash obligations accepted by finance and the reporting claim supported by the attributes. Any relationship between those outputs should be explained. For example, a contract may combine physical supply and certificates, but the continuity test still needs evidence about interruption and recovery. Keeping the records linked helps identify an inconsistency without implying that a favourable result on one measure answers the others.
7. Compare a ready location with delayed lower-cost power
Consider a wholly hypothetical business requiring the same assessed computing service over five operating years from a common decision date. The assumed mean IT load is 6 MW and the facility-energy multiplier is 1.30. Annual facility energy is therefore 68,328 MWh. No growth, inflation, tax, currency movement or degradation is included. The cases do not identify actual locations. Their purpose is to show how an apparently cheaper electricity price interacts with the cash cost of waiting for usable capacity.
Site A is assumed available at the start of year one. Its enabling cost is USD 8 million paid at the decision date. Electricity costs USD 100 per MWh and a separate fixed annual power-related charge is USD 0.6 million. Its annual cost is USD 7.4328 million. Site B requires USD 6 million of enabling expenditure at the same decision date and starts at the beginning of year two. Its electricity assumption is USD 70 per MWh with the same USD 0.6 million fixed annual charge, giving USD 5.38296 million for each operating year.
Site B uses a temporary provider during year one. The assumed substitute-service bill is USD 12 million, covering the comparable service for that year. The model does not also charge Site B's local operating electricity during that bridge year. Common computing costs are excluded from both alternatives, and the substitute-service figure is defined as the incremental cost within this comparison after any genuinely common costs. This definition is essential. An actual proposal should reconcile hardware rental, owned equipment, hosting and energy line by line to avoid double counting or omitting an option-specific cost.
All recurring amounts are assumed paid at year end and discounted at 10% annually. Both enabling payments occur at time zero. The five-year present cost of Site A is approximately USD 36.176 million. Site B, with one bridge year followed by four local operating years, has present cost of approximately USD 32.421 million. Under these assumptions, Site B costs approximately USD 3.755 million less in present-value terms. That is a conditional arithmetic result, with no conclusion about an actual site's suitability or investment attractiveness.
| Cost item | Site A ready at start | Site B delayed one year |
|---|---|---|
| Initial enabling payment | 8.000 | 6.000 |
| Annual local energy use in MWh | 68,328 | 68,328 |
| Assumed local electricity price in USD per MWh | 100 | 70 |
| Local annual cost including fixed charge | 7.433 | 5.383 |
| Year one substitute-service payment | 0.000 | 12.000 |
| Number of local operating years in comparison | 5 | 4 |
| Five-year discounted cost | 36.176 | 32.421 |
USD million unless stated. Identical assessed service, 10% discount rate, year-end recurring payments and no terminal value. Figures rounded for display.
The decisive uncertainty is visible through a threshold. Holding every other assumption fixed, Site B's bridge-year payment can rise to approximately USD 16.131 million before the two present costs are equal. At USD 16 million, Site B's present cost is approximately USD 36.058 million. At USD 20 million, it is approximately USD 39.694 million and exceeds Site A's cost. The board can ask the commercial team whether an enforceable substitute-service arrangement exists below the threshold and what qualifications apply to the offered service.
The model deliberately excludes terminal asset values, financing structure and common computing expenditure. Different enabling assets may retain different value at the end of year five, and a delay may affect equipment warranties or other costs. Those differences belong in a fuller corporate investment assessment. The simple result should be reported as a bounded power and enabling-cost comparison. A conclusion about project value requires the complete revenues, costs, taxes, capital expenditure and residual values appropriate to the actual alternatives.
Timing within the year also matters. Year-end payment is a simplifying convention. Monthly bridge payments would be discounted differently, and deposits could create a larger early liquidity need. A two-year delay would require another year of substitute service and remove another local operating year from this fixed horizon. The team should build that case from its actual monthly plan. It should also test whether the alternative supplier has sufficient reserved capacity during a delay affecting several customers at once.
8. Measure flexibility through completed work and recovery
The proposed flexibility test begins with a defined request: reduce facility demand by a specified amount, within a specified time, for a specified duration. Record the workload and supporting systems operating before the event. Measure response at the contractual meter, then track the recovery period. The test should include completed work, quality, deadlines and any extra energy or purchased capacity needed to recover. A reduction in measured demand during the event is only one part of the economic result.
Consider a separate hypothetical daily schedule for Site A's 7.8 MW facility demand. Six hours are priced at USD 160 per MWh and eighteen hours at USD 80 per MWh. This invented time-of-use schedule averages USD 100 per MWh for a flat load and is not DEWA's published tariff. It reproduces the earlier USD 6.8328 million annual energy cost before the USD 0.6 million fixed charge. The purpose is to isolate the economics of moving work between differently priced hours.
Assume the business can reduce facility demand by 2 MW throughout all six expensive hours while completing the same assessed work later. It moves 12 MWh per day from the expensive interval. Recovery requires 5% additional energy, so the lower-priced interval receives 12.6 MWh of extra demand. Spread evenly across eighteen hours, this adds 0.7 MW and takes average off-peak facility demand to 8.5 MW. This remains below the assumed 10 MW connection cap on an average-interval basis; an actual engineering test must still examine instantaneous peaks.
The daily energy-cost reduction is USD 912: USD 1,920 avoided during the expensive interval less USD 1,008 for recovery energy. Repeated on all 365 model days, the gross annual saving is USD 0.33288 million. Assume USD 0.15 million of annual software, operating and testing cost associated with enabling the flexibility. The net annual saving becomes USD 0.18288 million. No demand-response payment, reduced fixed network charge or carbon value is included. Each would need its own verified contractual basis and additional cost analysis.
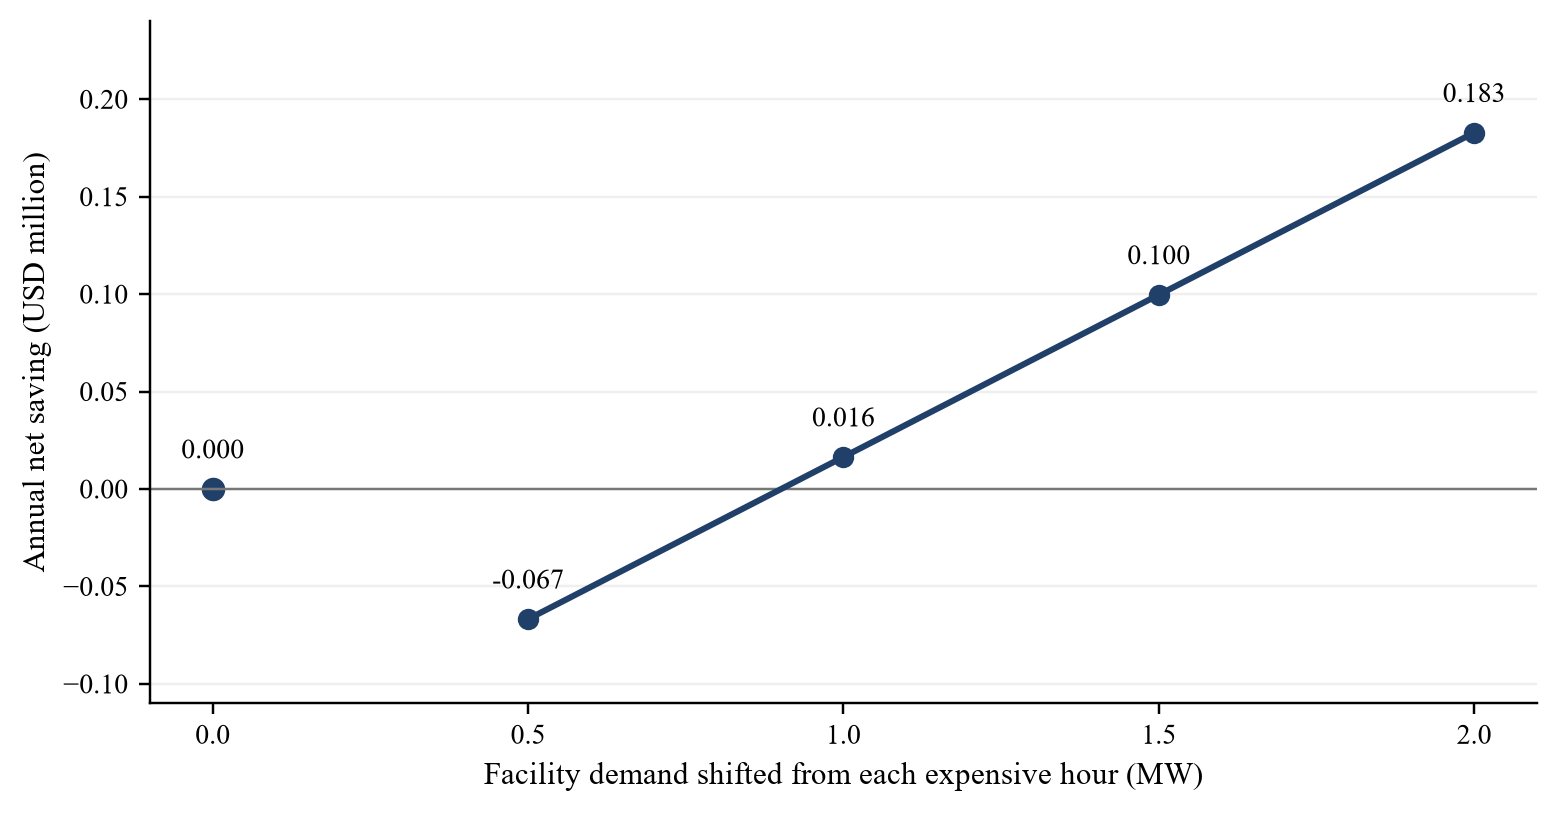
Six high-price hours, eighteen low-price hours, 5% rebound energy and USD 0.15 million annual enabling cost. Zero reduction means the programme is not enabled and has zero cost. All inputs are assumptions.
Scale affects the result because the assumed enabling cost is fixed. At a 0.5 MW reduction, gross annual savings are USD 0.08322 million and the programme loses USD 0.06678 million after that cost. At 1 MW, the net saving is only USD 0.01644 million. The mathematical break-even is approximately 0.901 MW under this schedule. A company should compare this threshold with tested repeatable performance across its actual workload mix and with the cost of retaining the required operational capability.
The energy ledger increases despite the lower bill. Recovery adds 0.6 MWh per day, or 219 MWh per year, to the baseline. Total annual energy becomes 68,547 MWh. This example establishes a cost effect under assumed prices; it supplies no emissions reduction because no time-specific emissions factors have been applied. The reporting team should assess any environmental claim separately. The flexibility case is also excluded from the location NPVs above, so its potential saving has not been counted twice.
An actual pilot should cover restrictive conditions as well as convenient ones. Test deadline-heavy periods, unavailable alternative capacity and recovery after repeated requests. Record how the scheduler deals with work that cannot move. If the provider pays against a baseline, establish that baseline's contractual definition and evidence requirements before entering expected receipts. The proposed acceptance decision should explain which requests are supported by testing, which are conditional and which remain outside the operating team's approved response envelope.
9. Test continuity across the complete service
Continuity should be measured at the service the business promises. Restoring electrical supply may leave computing equipment, data, network connections or applications still recovering. NIST's SP 800-34 Rev. 1 distinguishes maximum tolerable downtime, recovery time objective and recovery point objective. The publication is US federal guidance from 2010, used here as a conceptual reference for commercial planning rather than a claim of GCC regulatory compliance. Its distinction helps the business state both the acceptable interruption and the data state required after recovery. [11]
The operating team should identify critical workloads and the supporting load required to sustain them. A battery runtime calculation needs both deliverable energy and required power. An equipment label alone is insufficient for the proposed test. The engineer should assess available state of charge, usable operating range, delivery losses, power capability, environmental conditions and the connected supporting systems. The finance team should use the engineer's tested service case and preserve the assumptions relevant to each scenario.
Consider a hypothetical battery with 4 MWh nominal energy. Assume 80% is available within the chosen operating range and a further 90% delivery factor applies. Deliverable energy is 2.88 MWh. If the critical facility load is 3 MW, simple runtime is 0.96 hours, or 57.6 minutes. The case assumes the battery begins in the specified state and can supply the required power. It excludes degradation, temperature constraints and additional reserve policies. It therefore provides an arithmetic illustration rather than an engineering design.
Now assume an eight-hour interruption to upstream power, with the battery sustaining critical service for the first 0.96 hours. After supply returns, the service requires another 1.5 hours to recover. The resulting period of unavailable critical service is 8.54 hours: 7.04 hours after battery depletion plus 1.5 hours of recovery. The battery case includes no successful generator or alternative-site response. Those capabilities need their own tested scenario, including the resources and permissions required to operate them.
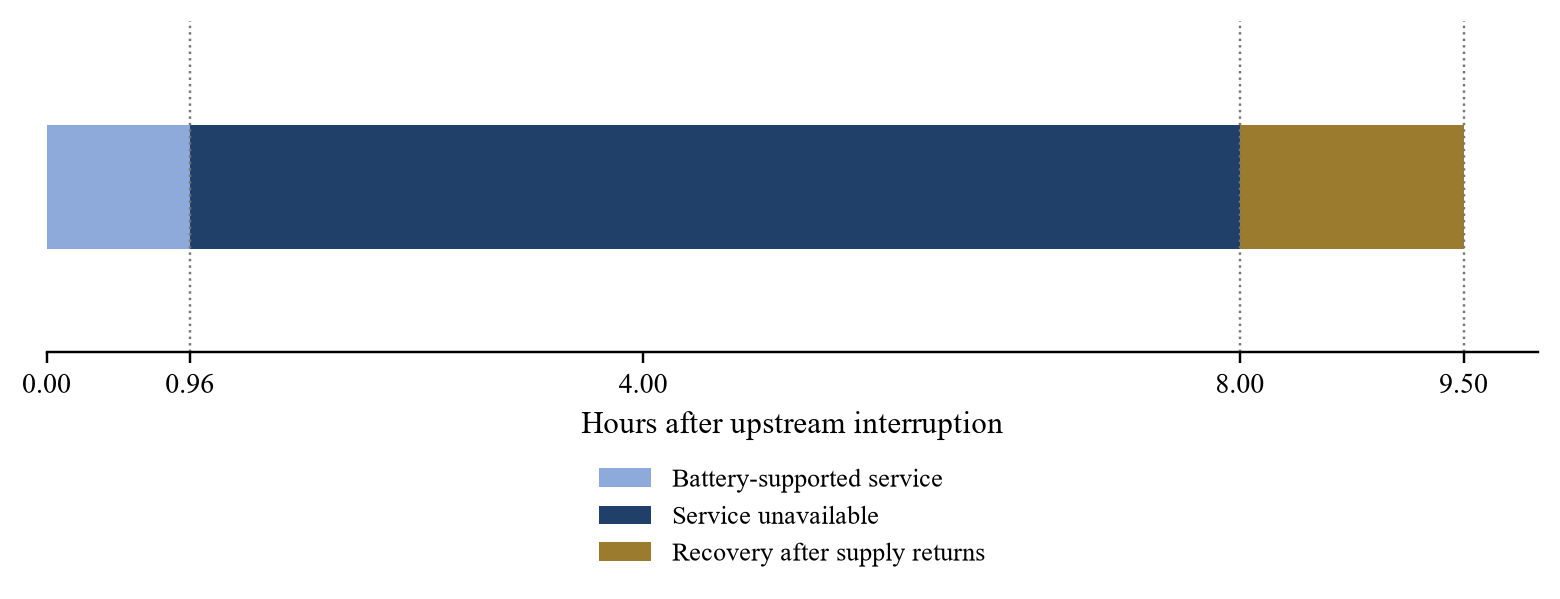
The battery sustains the assumed critical service for 0.96 hours. Upstream supply returns at hour 8 and application recovery finishes at hour 9.5. No event probability or engineering assurance is implied.
Suppose the permanently lost contribution is USD 0.025 million per unavailable hour, after allowing for avoided variable costs. Add an assumed USD 0.06 million of incremental incident expense. The single-event loss is USD 0.2735 million. The contribution assumption must not include work merely delayed and later recovered at the same economics. An actual business-impact assessment should separate deferred billing, genuinely lost contribution, contractual payments and additional remediation expense, using evidence appropriate to the affected customer service.
An alternative recovery service is assumed to reduce unavailability to 0.25 hours and incremental incident expense to USD 0.015 million. Its corresponding single-event loss is USD 0.02125 million. Relative to the battery-only case, it avoids USD 0.25225 million per comparable event. If the alternative carries an additional annual fixed fee of USD 0.25 million, the simple economic threshold is approximately 0.991 comparable events per year. No such event frequency is asserted. The calculation tells management which missing evidence matters; it does not establish an expected annual return.
The alternative's performance remains an assumption until tested across shared dependencies. Two locations may rely on the same network path, supplier, control system or personnel. The technical review should identify and test the dependencies relevant to the actual arrangement. Insurance and service credits should be analysed under their terms, including exclusions and recovery timing. The paper credits neither in the example. Contractual recourse and service restoration should have distinct records because their cash and operational consequences occur through different mechanisms.
10. Align capital commitments with operating evidence
Capital approval should be staged around the uncertainties that could change the operating choice. The proposed process begins with a limited diligence mandate covering workload measurement, location evidence and comparative supplier terms. A later commitment to enabling works should depend on the evidence required for those works and the remaining exposure if the operating plan changes. The exact thresholds belong to management's governance process. This paper prescribes no universal investment amount, fee level or approval timetable.
The capital schedule should identify the party holding each deposit and the conditions for repayment or forfeiture. Show committed but unpaid expenditure alongside amounts already spent. Include the contractual consequences of slower load growth, cancellation and migration. A board deciding whether to continue a project needs the incremental cash consequences from today as well as the original investment case. Previously spent amounts can explain accountability and liquidity, while the current decision should identify the future costs and benefits still avoidable.
An acquirer considering an AI-intensive business should examine whether its operating forecast relies on rights that survive the transaction. Counsel should review the actual assignment and change-of-control provisions for site, power, hosting and customer agreements. The operating team should then test whether planned integration changes the load or service requirement. These are proposed transaction questions, with no assertion that every agreement contains a consent requirement. The buyer's model should reflect the rights actually confirmed through diligence.
Lenders and other capital providers can use the same operating evidence to understand exposure. A financing forecast should show minimum cash obligations and the effect of a delayed start, lower utilisation or unplanned substitute service. It should distinguish a proposed refinancing from an evidenced contractual source of repayment. The discussion here provides no financing offer or debt capacity estimate. A transaction-specific financing assessment would add the borrower's financial position, security, legal structure and approved terms.
The advisory engagement can be scoped around decisions the client is prepared to make. Deliverables might include an evidence-based location comparison, contract responsibility map, independently reviewed model and a pilot acceptance report. Technical design, legal opinions, regulated activities and authority approvals require appropriately qualified parties and any applicable permissions. The proposed commercial role is to coordinate and analyse the agreed evidence. No client mandate, fee conversion or prospective retainer revenue is assumed in this research.
11. Establish a controlled operating review
Once a location is operating, compare actual consumption, completed work and cash payments with the approved case. Use consistent meter boundaries and dates. Investigate whether an apparent change arises from utilisation, workload mix, price, cooling demand or another identifiable cause. A single aggregate bill cannot explain all of those effects. The operating review should identify what changed, the evidence for the explanation and the decision required from the responsible owner.
Create a contract calendar tied to the operating forecast. It should show renewal and notice dates, price resets, capacity milestones and testing obligations found in the actual agreements. Management should review the forecast before an option expires or a new minimum payment becomes unavoidable. If a revised workload requires a different location or load profile, record the contractual and technical changes needed. The calendar is a proposed control; it does not assume a particular notice period or amendment right.
Flexibility performance should be monitored over the complete event and recovery window. Record requested and delivered reduction, deadlines met, rebound energy, penalties and receipts. Include unsuccessful or declined events, with the reason. This supports a decision about whether to retain, resize or withdraw a proposed commitment under the contract's available mechanisms. Savings should be reconciled to the bill and programme settlement, without adding a second estimate for the same reduced expenditure.
Continuity reviews should similarly use integrated tests. Record the interruption assumed, systems affected, battery condition, alternative capacity, recovery sequence and observed return of customer service. The board should receive the remaining exposure and the actions proposed to address it. A successful test under one set of conditions should be described with those conditions. Material changes in software, equipment or dependencies should trigger consideration of whether the earlier evidence still supports the approved operating arrangement.
| Review item | Accountable function | Evidence for the decision |
|---|---|---|
| Useful service and deadlines | Business service owner | Completed work and customer obligations |
| Power boundary and capacity | Engineering and operations | Metering, peak-load and equipment tests |
| Payments and cost variance | Finance and procurement | Bills, executed schedules and cash reconciliation |
| Contract changes and permissions | Legal with relevant specialists | Applicable terms, approvals and advice |
| Flexibility acceptance | Operations and service owner | Event response and recovery performance |
| Continuity exposure | Business owner with technical reviewers | Integrated restoration tests and incident records |
| Environmental claims | Reporting team | Applicable method and instrument evidence |
Illustrative governance structure. Assign named accountable owners within the actual business and retain the evidence supporting each conclusion.
The review should preserve a clear distinction between observed performance and a proposed future improvement. If a software change is expected to improve utilisation, show the basis and the test required before committing the benefit to a customer or supplier. If a tariff changes, identify the effective date and affected consumption. This proposed discipline gives management a traceable record of decisions. It makes no claim that a monitoring process removes commercial, operational or regulatory risk.
12. Decision and limitations
The proposed decision sequence is to define the service, establish location eligibility, compare the full relevant cash obligations, test flexibility and examine recovery across the service. The board can then approve a specific operating arrangement with named conditions and a record of unresolved exposures. The numerical examples show why each stage matters. A delayed site's price advantage depends on substitute-service cost, demand shifting depends on recoverable work and pricing, and critical-load runtime depends on usable energy and restoration beyond the electrical system.
The analysis has several boundaries. Public sources describe particular programmes, forecasts or reported tests, with their dates and jurisdictions retained. The paper does not verify an actual connection, a customer's tariff classification or the eligibility of a proposed environmental claim. It provides no country ranking, vendor recommendation or engineering certification. The example locations are unnamed, the model prices are invented assumptions and the outage cases contain no asserted probabilities. These limitations should remain attached to any use of the calculations.
A transaction-ready assessment requires the actual customer workload, provider offers, operating permissions, engineering tests and complete financial model. Management should identify the assumptions capable of reversing the decision and commission evidence targeted to them. In the example, the bridge-cost threshold and repeatable flexibility threshold are useful questions for that work. The corporate objective is to commit capital and obligations against a service that can be evidenced at the required location and date, with the residual cash and continuity exposure explicitly understood.
Appendix A. Model definitions and reproducibility
The location calculation uses five year-end discount factors at 10%. Their sum is approximately 3.790787. Site A's present cost is its USD 8 million initial enabling payment plus USD 7.4328 million multiplied by that factor. Site B's present cost is USD 6 million initially, USD 12 million discounted for one year and USD 5.38296 million discounted for years two through five. The bridge-cost threshold solves for the year-one payment that makes those two present costs equal. Displayed values are rounded; calculations retain unrounded amounts.
The annual energy calculation multiplies 6 MW of assumed mean IT demand by 1.30 and by 8,760 hours. If the same IT demand instead required a multiplier of 1.45 throughout the year, facility energy would become 76,212 MWh, an increase of 7,884 MWh. At USD 100 per MWh, that adds USD 0.7884 million before any other effects. This sensitivity changes only the energy multiplier. It does not estimate a local climate effect or prove that the connection can accommodate the resulting instantaneous load.
For flexibility, let the hourly reduction during the six expensive hours be the tested facility reduction. Daily shifted energy is six times that reduction. Recovery energy is assumed to be 1.05 times shifted energy and is bought at USD 80 per MWh. Avoided purchases are valued at USD 160 per MWh. Annual gross saving multiplies the daily difference by 365. When the programme is enabled, the calculation subtracts USD 0.15 million annually. The zero-reduction reference means no programme is enabled and no enabling cost is incurred; it is a separate baseline point.
The flexibility calculation assumes every model day has the same price schedule and the business can perform the required shift on every day. It excludes fees tied to capacity, tax, incentives, wear, new capital expenditure and customer penalties beyond the stated enabling amount. Those omissions are analytical boundaries. They should be replaced by actual terms and evidence before an investment decision. An observed event count below 365, a smaller price spread or a larger recovery burden would require the model to be recalculated.
The battery example applies an 80% usable share and a 90% delivery factor to 4 MWh nominal energy, then divides 2.88 MWh by 3 MW critical demand. It assumes the required power is within the battery system's capability and that all necessary supporting loads are included. The outage-loss case counts only the period after battery-supported service ends and the additional application-recovery period. The separate alternative-service case replaces those assumptions; it is not added as another recovery benefit to the battery case.
No likelihood weights are used. The break-even event count divides the additional annual alternative-service fee by the assumed avoided loss per comparable event. It therefore identifies the frequency at which the simplified costs would balance, without estimating that frequency. A probability-weighted decision requires credible event and performance evidence, an appropriate treatment of shared failures and the business's risk constraints. Management may also have service obligations that require a capability irrespective of the simple expected-cost threshold.
Appendix B. Evidence required before a commitment
The initial request to a candidate provider should identify the proposed customer entity, intended service and demand profile. Ask for a dated offer with the usable capacity, delivery boundary, conditions and start date. Obtain the full charge schedule and a list of items excluded from the quoted price. Where the supplier relies on another party, request the evidence it is entitled to disclose concerning that dependency and the remedies available to the customer. The buyer should record any material information that remains unavailable.
The workload pilot should reproduce representative service requirements and document its limits. Define the acceptance measures before the trial, including completed work, quality, deadlines, meter readings and recovery. Record baseline conditions and changes made during the test. A test using a restricted workload should not be represented as proving the entire estate. Where data handling or customer approval constrains the trial, obtain the relevant permission and use an appropriately designed test without exposing confidential information.
The financial review should reconcile every option to a common service horizon. Confirm which computing costs genuinely cancel between alternatives and which differ because of location, delay or provider structure. Include incremental network, cooling, migration, staffing and capacity-reservation costs where relevant. Separate costs already committed from future avoidable amounts, and disclose any terminal-value assumption. Reconcile currency, tax treatment and payment dates through qualified review. The simplified model in this paper is a starting structure for these questions.
The proposed approval pack should end with the choice requested, evidence supporting it and conditions that remain open. Identify the owner and date for each material follow-up. State the maximum exposure management is being asked to accept if a condition fails, using the actual contractual consequences and the reviewed operating model. Preserve earlier approved assumptions when recording later changes so the team can explain why the decision evolved. Any resulting advisory or financing engagement requires its own agreed scope, terms and relevant professional responsibilities.
Sources
- International Energy Agency (2026). Key Questions on Energy and AI, executive summary, PDF page 10. Global observations and projections; accessed 10 September 2026. Read the primary source
- International Energy Agency (2026). Electricity 2026, Flexibility chapter. Programme and system-level context; accessed 10 September 2026. Read the primary source
- National Grid (2 March 2026). UK-first trial of AI grid technology. Participating-organisations' account of the December 2025 trial; accessed 10 September 2026. Read the primary source
- National Grid (25 August 2026). Connections Reform. Process update; accessed 10 September 2026. Read the primary source
- Dubai Electricity and Water Authority. Slab Tariff, including September 2026 fuel surcharge. Published schedule; accessed 10 September 2026. Read the primary source
- Qatar General Electricity and Water Corporation. Tariff, customer-category descriptions. Accessed 10 September 2026. Read the primary source
- Dubai Electricity and Water Authority. Shams Dubai Credit Transfer, eligibility and frequently asked questions. Accessed 10 September 2026. Read the primary source
- Abu Dhabi Department of Energy. About Clean Energy Certification. Scheme scope and attribute allocation; accessed 10 September 2026. Read the primary source
- GHG Protocol. Scope 2 Guidance. Published guidance and contractual-instrument criteria; accessed 10 September 2026. Read the primary source
- GHG Protocol (29 July 2026). Key Standard Development Updates, FAQ Resource. Revised development timetable; accessed 10 September 2026. Read the primary source
- Swanson, M. and others (2010). NIST SP 800-34 Rev. 1, Contingency Planning Guide for Federal Information Systems, printed page 17, PDF page 31. US federal guidance used as a conceptual reference. Read the primary source
