

Introduction
Direct carbon pricing has become a material feature of energy markets. The World Bank reports that direct carbon pricing covered nearly 30 per cent of global greenhouse-gas emissions across 87 implemented policies in 2026 and mobilised more than USD 107 billion for public budgets during 2025 [1]. Coverage does not create a uniform economic signal. Systems differ in cap design, sector coverage, allowance allocation, auctioning, banking, offsets, price floors, reserves and interaction with electricity regulation.
The power sector is especially sensitive because dispatch decisions occur continuously. An emissions cost raises the variable cost of a fossil unit in proportion to its emissions intensity. In a competitive wholesale market, that cost can change the merit order and the marginal generator. In a regulated or contractually constrained market, the same policy can create a compliance cost while leaving dispatch largely unchanged. The IEA identifies market structure, regulated prices, dispatch rules and allowance allocation as factors that can weaken or amplify the carbon signal [2].
The financial effect extends beyond fuel switching. A carbon price can increase working capital because allowances may be purchased before customer recovery. It can change power prices and therefore the revenue of low-carbon assets. It can reduce the operating hours of high-emitting plants, alter maintenance strategy and accelerate impairment or retirement. It can affect collateral, liquidity and covenant headroom when carbon and electricity hedges move against each other.
This paper provides a decision framework for utilities, generators, investors and lenders. It uses public evidence and illustrative author-modelled scenarios. Transaction-specific legal, tax, accounting and regulatory advice remains necessary.
1 Define the decision before choosing a carbon path
A carbon-path analysis should begin with the decision it must support. A dispatch team may need a day-ahead bid curve. A treasury team may need an allowance-purchase and collateral plan. A board may need to choose between life extension, conversion, carbon capture, storage, repowering or retirement. A lender may need to size debt under downside cash flow. Each decision needs a different level of temporal and asset detail.
The decision perimeter should identify the plants, markets, contracts, customers and compliance entities included in the analysis. A group-level average emissions intensity can conceal the economics of individual units. A utility with coal, gas, renewable generation and retail supply may benefit from higher wholesale prices in one business while incurring higher allowance and procurement costs in another. Legal ownership and regulatory ring-fencing determine whether those offsets are available to creditors.
The analysis should state a decision date and a policy-information date. Carbon policy changes through legislation, regulations, consultations and administrative decisions. The model should distinguish enacted rules from announced proposals and internal planning assumptions. The World Bank Carbon Pricing Dashboard and annual State and Trends reports provide instrument-level reference data, while jurisdictional authorities remain the source for applicable compliance rules [1][3].
2 Translate policy design into economic variables
A carbon tax generally creates a stated charge per unit of covered emissions. An emissions trading system creates a requirement to surrender allowances, with the allowance price determined by market supply and demand subject to programme rules. Both can influence marginal cost, yet their cash mechanics differ.
An allowance system requires the utility to model verified emissions, free allocation, auction purchases, secondary-market purchases, banking, borrowing restrictions, offsets, surrender dates and penalties. The European Union Market Stability Reserve adjusts auction supply using the total number of allowances in circulation [4]. California uses an auction reserve price, two reserve tiers and a price ceiling as cost-containment mechanisms [5]. These design features change the probability distribution of future allowance prices.
Output-based allocation can reduce the effective carbon cost of generation because allowances depend on production and a benchmark. The IEA's analysis of China's power-sector ETS explains that technology-specific benchmarks and output-based free allocation can encourage within-category efficiency while limiting fuel switching across technologies [6]. A model that multiplies gross emissions by the quoted allowance price can therefore overstate cash cost and misstate dispatch incentives.
3 Calculate carbon-adjusted marginal cost
The core operating calculation is the short-run marginal cost of each generating unit. A simplified formulation is fuel cost divided by net efficiency, plus variable operations and maintenance, start costs allocated to expected output, variable network or balancing charges and net carbon cost.
For a unit with emissions intensity e measured in tonnes of carbon dioxide per megawatt hour and an effective carbon price c, the gross carbon component is e multiplied by c. Net carbon cost can differ from gross cost when the plant receives output-linked free allowances, rebates or other policy support. The model should preserve gross emissions and policy adjustments separately.
The dispatch model should retain unit constraints. Minimum stable generation, start time, ramp rates, minimum up and down times, heat-rate curves, outages, fuel contracts and system-reserve obligations can prevent a simple merit-order switch. Carbon cost can change commitment decisions even when it does not change within-hour dispatch.
The IEA reports that carbon pricing increases the variable cost of high-emitting generation and can move less efficient fossil units down the merit order [2]. Its Thailand analysis illustrates how a sufficiently strong carbon signal can trigger coal-to-gas switching when system flexibility and contractual arrangements permit it [7].
4 Locate the fuel-switching threshold
The carbon price at which two units have equal marginal cost can be calculated from the difference in their non-carbon variable costs divided by the difference in their emissions intensities. If gas costs USD 54 per megawatt hour before carbon, coal costs USD 32 and their emissions intensities are 0.38 and 0.95 tonnes per megawatt hour, the illustrative crossover is approximately USD 38.60 per tonne. This value is an author-modelled assumption, not an observed market threshold.
The crossover moves with fuel prices, efficiency and operations. Lower gas prices reduce the carbon price required for switching. A high-efficiency coal unit can remain competitive against an inefficient gas unit for longer. Methane policy, gas transport charges, coal logistics, start costs and cycling damage can change the result.
Switching also requires available gas capacity and fuel. The IEA notes that coal and gas forward curves can diverge and that declining coal capacity can reduce short-term switching flexibility [8]. A portfolio model should therefore calculate both the theoretical crossover and the feasible dispatch response.
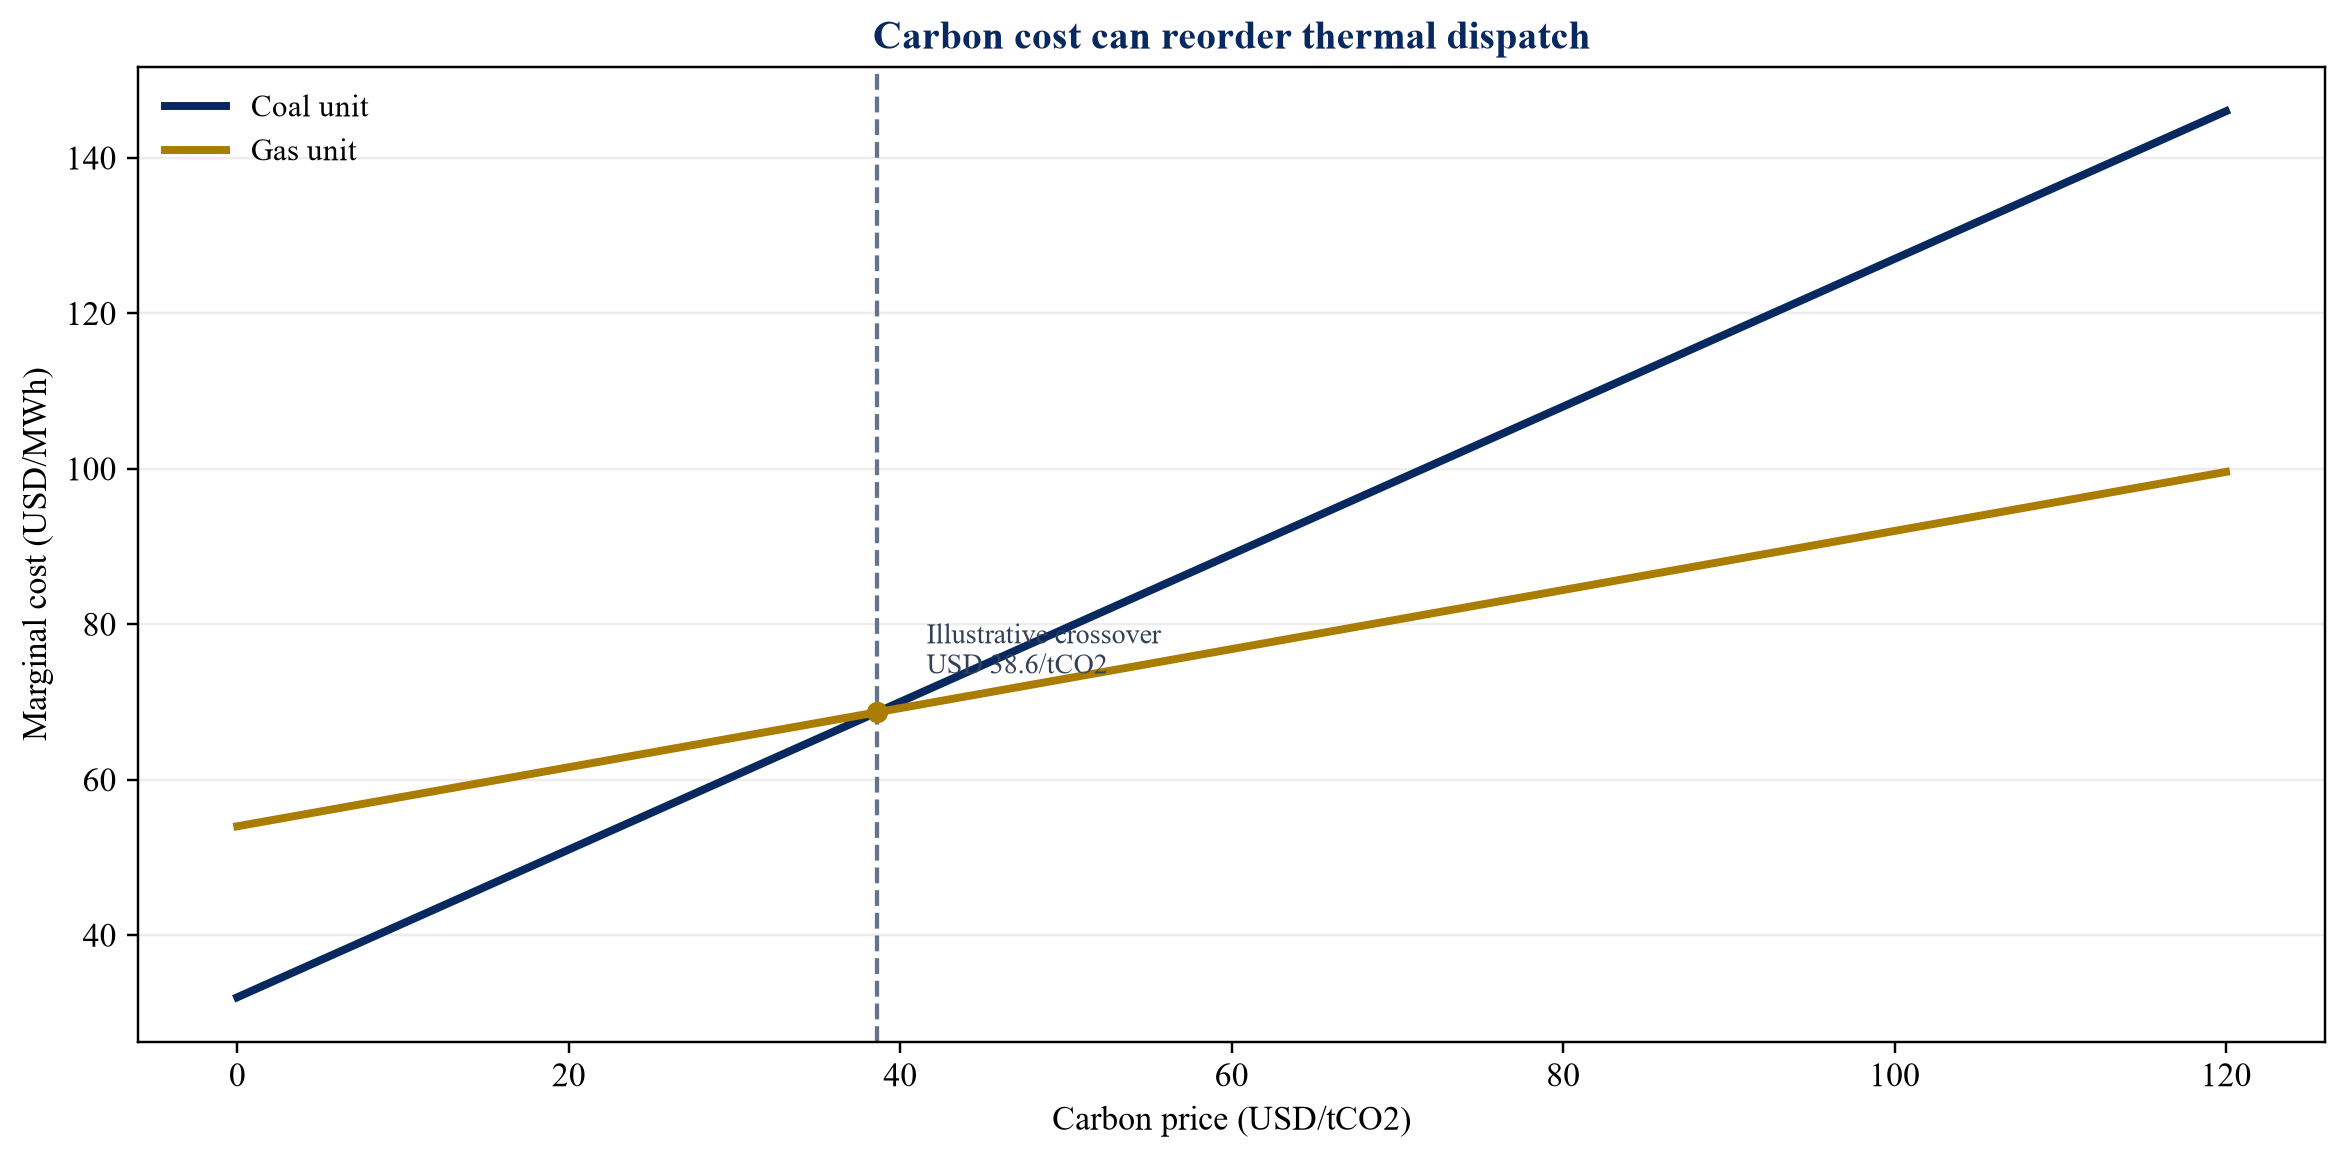
Author-modelled assumptions: coal non-carbon marginal cost USD 32/MWh and emissions intensity 0.95 tCO2/MWh; gas cost USD 54/MWh and intensity 0.38 tCO2/MWh. The figure is a method demonstration and not a market forecast.
5 Map the electricity-market transmission channel
In a uniform-price wholesale market, the marginal accepted offer can set the market price. A carbon cost included in thermal bids can therefore raise wholesale prices even for generators with no direct emissions. Low-carbon plants can receive an inframarginal revenue increase while fossil plants face higher costs. The net effect depends on which technology sets price and on contracts.
In a pay-as-bid market, single-buyer system or administratively dispatched market, price transmission can differ. The IEA explains that regulated wholesale prices and dispatch decisions can limit the effect of an ETS on merit order and consumer signals [2]. A utility should model the applicable market algorithm and contractual payment structure instead of applying a generic pass-through percentage.
Retail tariffs create another layer. A vertically integrated regulated utility may recover prudently incurred allowance costs with a lag. A competitive retailer may have fixed customer prices and limited near-term pass-through. Timing can turn an economically recoverable cost into a liquidity problem.
6 Separate economic cost from compliance cash cost
Dispatch should reflect opportunity cost when an allowance can be sold or banked. A freely allocated allowance still has economic value. Using it for generation forgoes a sale or future compliance use. Cash flow, however, records the actual purchase, sale or holding of allowances and any auction proceeds or regulatory return.
The model should therefore contain two linked ledgers. The dispatch ledger applies the relevant economic carbon signal to operating decisions. The compliance ledger begins with opening inventory, adds free allocation and purchases, subtracts surrenders and sales, and calculates closing inventory. The cash ledger records settlement dates, margin and fees.
This separation prevents two common errors. Treating free allowances as costless can over-dispatch emitting units. Treating all gross emissions as a current cash purchase can overstate working-capital demand. California allocates allowances directly to electrical distribution utilities and other entities under programme rules [9]. The European Union generally auctions allowances for power generation, subject to specified derogations [10]. Those arrangements produce different cash profiles.
7 Construct policy paths rather than a single forecast
A central carbon-price curve can conceal the risks that matter most. The model should use internally consistent policy paths. An orderly path can tighten gradually with credible market-stability rules. A delayed path can remain low before a sharp catch-up. A contained path can rise until a reserve or ceiling limits further increases. A reversal path can weaken after political or legal change.
Each path should specify more than price. It should include annual cap or tax rates, free-allocation rules, auction share, reserve triggers, offset eligibility, banking limits, sector expansion, border adjustments, compliance timing and customer recovery. The price should be an output where the organisation has a market model and a transparent assumption elsewhere.
The Network for Greening the Financial System publishes climate scenarios designed for risk assessment, including orderly, disorderly and hot-house-world pathways [11]. Those scenarios can provide macroeconomic and emissions context. Transaction decisions still require jurisdiction-specific policy and market assumptions.
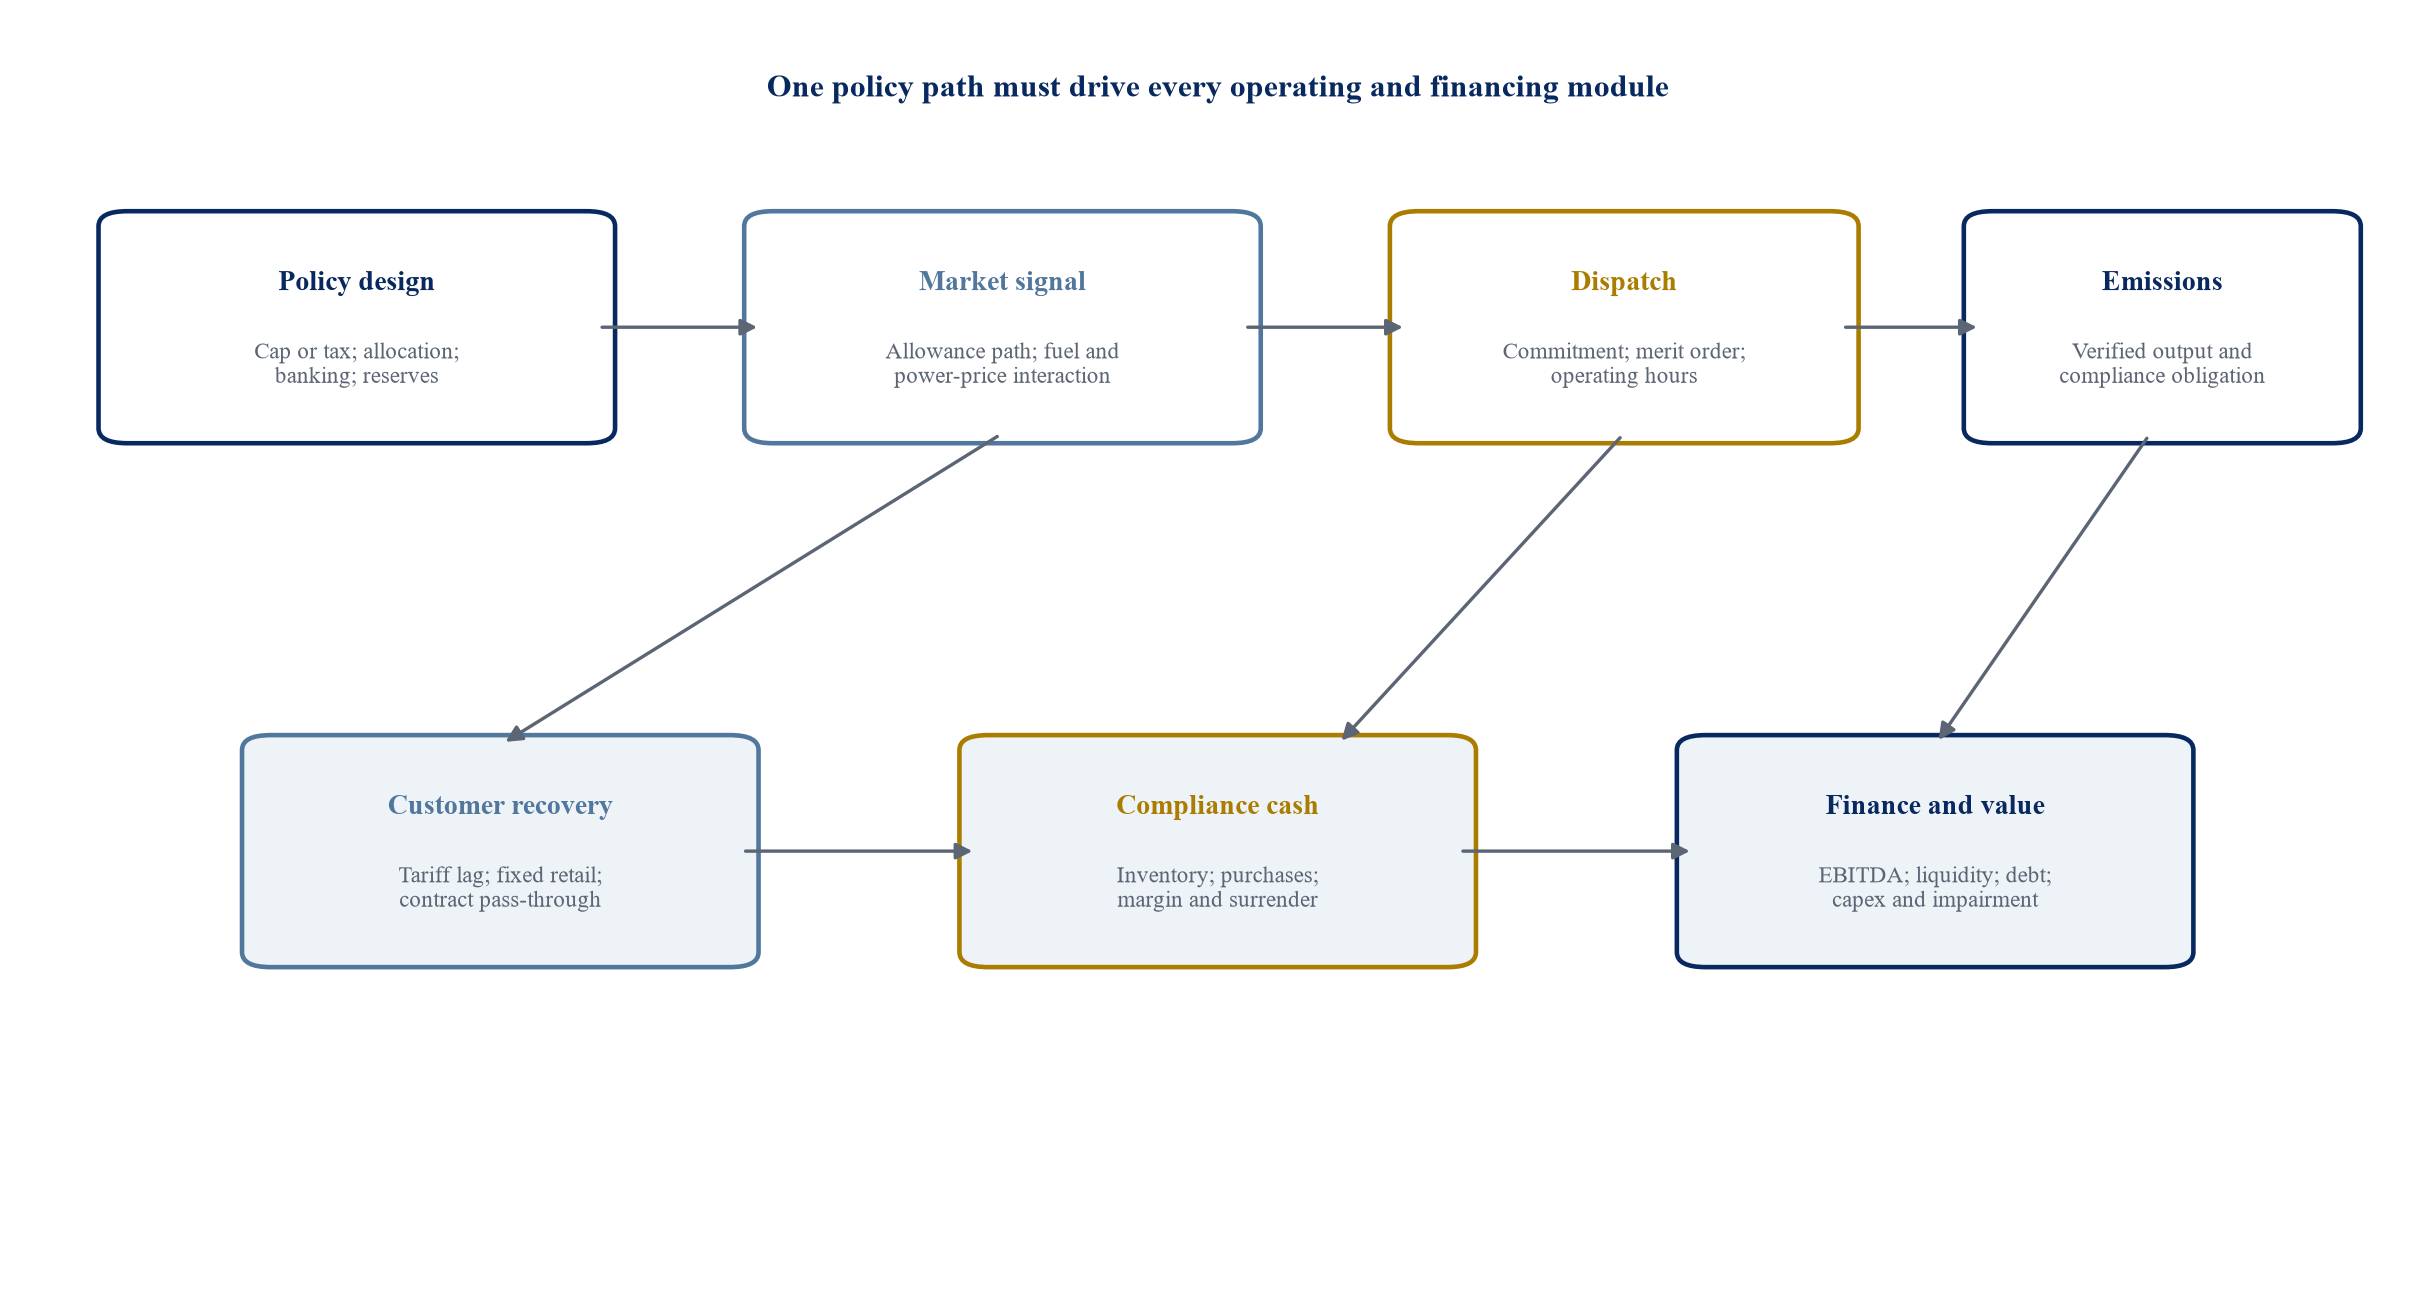
The system map separates legal policy design from dispatch, customer recovery, compliance cash, investment and creditor outcomes.
8 Read the design of leading systems
The European Union ETS combines a declining cap, auctioning, free allocation for eligible sectors and the Market Stability Reserve. The European Commission reported that power and industry emissions in 2024 were about 50 per cent below 2005 levels and remained on track for the 2030 reduction target [12]. The MSR adjusts auction volumes using rule-based circulation thresholds [4].
The UK ETS covers power, energy-intensive industry and aviation. Covered operators surrender one allowance for each tonne of covered emissions and obtain allowances through auctions, secondary markets or eligible free allocation [13]. The cap declines over time and the Authority continues to develop the scheme [14].
California's Cap-and-Invest Programme combines auctions, direct allocation, banking, offsets, reserve tiers and a price ceiling [5][9]. Programme amendments adopted in 2026 extend the long-term signal and adjust allowance budgets and cost-containment arrangements [15]. The Regional Greenhouse Gas Initiative applies a regional cap-and-invest model to power-sector carbon dioxide emissions in participating US states [16].
China's national ETS uses output-based allocation and generation benchmarks. The IEA's modelling shows that benchmark design, auctioning and dispatch reform can materially change its effect on coal, gas and non-fossil generation [6][17]. These systems demonstrate why a quoted allowance price cannot be compared across jurisdictions without the surrounding rules.
Table 1. Carbon-pricing design features that change utility cash flow
| Design feature | Dispatch implication | Cash-flow implication | Diligence question |
|---|---|---|---|
| Auctioned allowance | Full opportunity cost normally enters bids where dispatch is economic | Auction or market purchases create cash outflow and working-capital demand | When are allowances acquired, paid for and surrendered? |
| Free fixed allocation | Opportunity cost remains relevant | Near-term purchase need can fall; surplus may be saleable | Is allocation transferable, conditional or subject to clawback? |
| Output-based allocation | Effective marginal signal depends on benchmark and production | Net obligation depends on output and performance relative to benchmark | Which benchmark applies to each unit and how does it change? |
| Price floor | Reduces downside allowance-price uncertainty | Establishes a minimum expected compliance cost | How is the floor escalated and enforced? |
| Reserve or ceiling | Can limit or reshape price tails | Creates contingent access to additional supply at specified prices | What triggers release and who may participate? |
| Banking | Links current dispatch with future scarcity | Moves cash across compliance periods and creates inventory value | What holding limits, borrowing rules and expiry terms apply? |
The table summarises analytical distinctions from official programme materials. Applicable rules should be confirmed for the relevant compliance year.
9 Model dispatch hourly before annual aggregation
Annual average generation can misstate carbon exposure. Dispatch depends on hourly demand, renewable output, fuel availability, unit constraints and imports. A carbon-price increase can displace a coal unit during shoulder hours while leaving it essential during system peaks. The resulting emissions and cash response can be nonlinear.
The model should commit units in accordance with the market or system-operator rules, calculate generation and emissions, and aggregate only after hourly economics are established. It should preserve start costs and minimum-load constraints because carbon-induced cycling can raise maintenance cost and reduce efficiency.
Contractual dispatch should be represented explicitly. Take-or-pay fuel, minimum offtake, capacity payments, legacy PPAs and reliability obligations can keep an emitting unit online. The IEA's Thailand analysis notes that carbon pricing interacts with existing power purchase agreements and system reliability [7].
10 Estimate allowance demand and inventory
Allowance demand equals covered emissions adjusted for applicable allocation, offsets and programme rules. Forecasting begins with generation and unit emissions factors. It then applies monitoring boundaries, oxidation factors, treatment of biomass or captured carbon and verification adjustments.
The treasury model should select an acquisition policy. A utility can buy allowances progressively, hold a strategic buffer, use permitted derivatives or wait until close to surrender. Each choice changes price risk, liquidity and counterparty exposure. Banking can reduce future scarcity risk while tying up cash.
Inventory governance should define authorised instruments, counterparties, position limits, hedge-accounting analysis, collateral and reporting. The compliance team should reconcile modelled emissions, verified emissions and allowance holdings regularly. A policy change can alter eligibility or value, so legal title and registry controls matter.
11 Model free allocation without losing the price signal
Free allocation can support competitiveness or customer affordability. Its financial effect depends on whether it is fixed, output-based, benchmarked, conditional or allocated to a regulated utility for ratepayer benefit. California reports that electrical distribution utilities received a substantial share of vintage 2026 direct allocation [9]. UK industrial free allocation follows eligibility and benchmark rules, with applications and adjustments governed by published procedures [18].
The dispatch module should use the economically relevant signal. The compliance module should calculate the actual net obligation. The tariff module should determine whether allowance value accrues to customers, shareholders or a specified programme.
Free allocation can change through cap tightening, benchmark updates, activity-level adjustments or carbon-leakage policy. A forecast should therefore show the allowance volume and the carbon price separately. Multiplying one net emissions number by one price hides the source of the change.
12 Separate carbon pass-through from power-price uplift
A fossil generator can face a higher carbon cost and receive a higher wholesale electricity price. Its margin effect depends on emissions intensity relative to the marginal unit, dispatch hours and hedging. A low-carbon generator can benefit from the price uplift without incurring direct allowance cost, subject to contracts and market design.
Retail and regulated businesses require a recovery bridge. The bridge begins with compliance and wholesale procurement cost, applies hedges and contracts, calculates permitted customer recovery and then accounts for timing. Recovery disallowance, regulatory lag and affordability interventions should be scenario variables.
The European Commission's auctioning framework and carbon-market reports show how allowance supply and power-sector emissions interact within the EU ETS [10][12]. Utility analysis should connect those policy mechanics to the local electricity price formation rather than assume full or zero pass-through.
13 Convert dispatch into plant cash flow
Plant revenue should be calculated from dispatched volume, market prices, capacity payments, ancillary services and contracts. Variable cost includes fuel, carbon, operations, starts, balancing and other applicable charges. Fixed operations and maintenance, sustaining capital expenditure, taxes and lease payments then produce asset cash flow.
Allowance cash should be timed separately from the expense recognised for operations. Purchases can precede or follow generation. Free allocation and sales can create cash receipts. Derivative settlements and collateral can occur before surrender. The model should identify peak cumulative funding need.
For a portfolio, transfers between generation, retail and trading units should reflect legal agreements. Consolidated EBITDA can obscure ring-fenced liquidity. Credit analysis should focus on the cash available to each borrowing entity.
14 Test debt service and liquidity
Carbon risk affects debt through generation margin, working capital, capital expenditure and asset life. A high carbon path can reduce the dispatch and cash generation of an emitting plant. It can increase wholesale prices for low-carbon assets. A delayed-shock path can create the most acute liquidity need because allowances, collateral and fuel switching move before tariffs or refinancing.
Lenders should calculate debt-service coverage under combined fuel, carbon, power-price and volume scenarios. Carbon and fuel should not be stressed independently when their market relationship is material. A coal-to-gas switch can raise gas demand and price. Renewable buildout can reduce thermal operating hours and change capture prices.
Covenants should distinguish realised cash, accrued compliance cost and mark-to-market. Liquidity facilities should cover plausible allowance purchases, margin and tariff lag. Distribution tests can include forward allowance coverage and minimum liquidity where exposure is material.
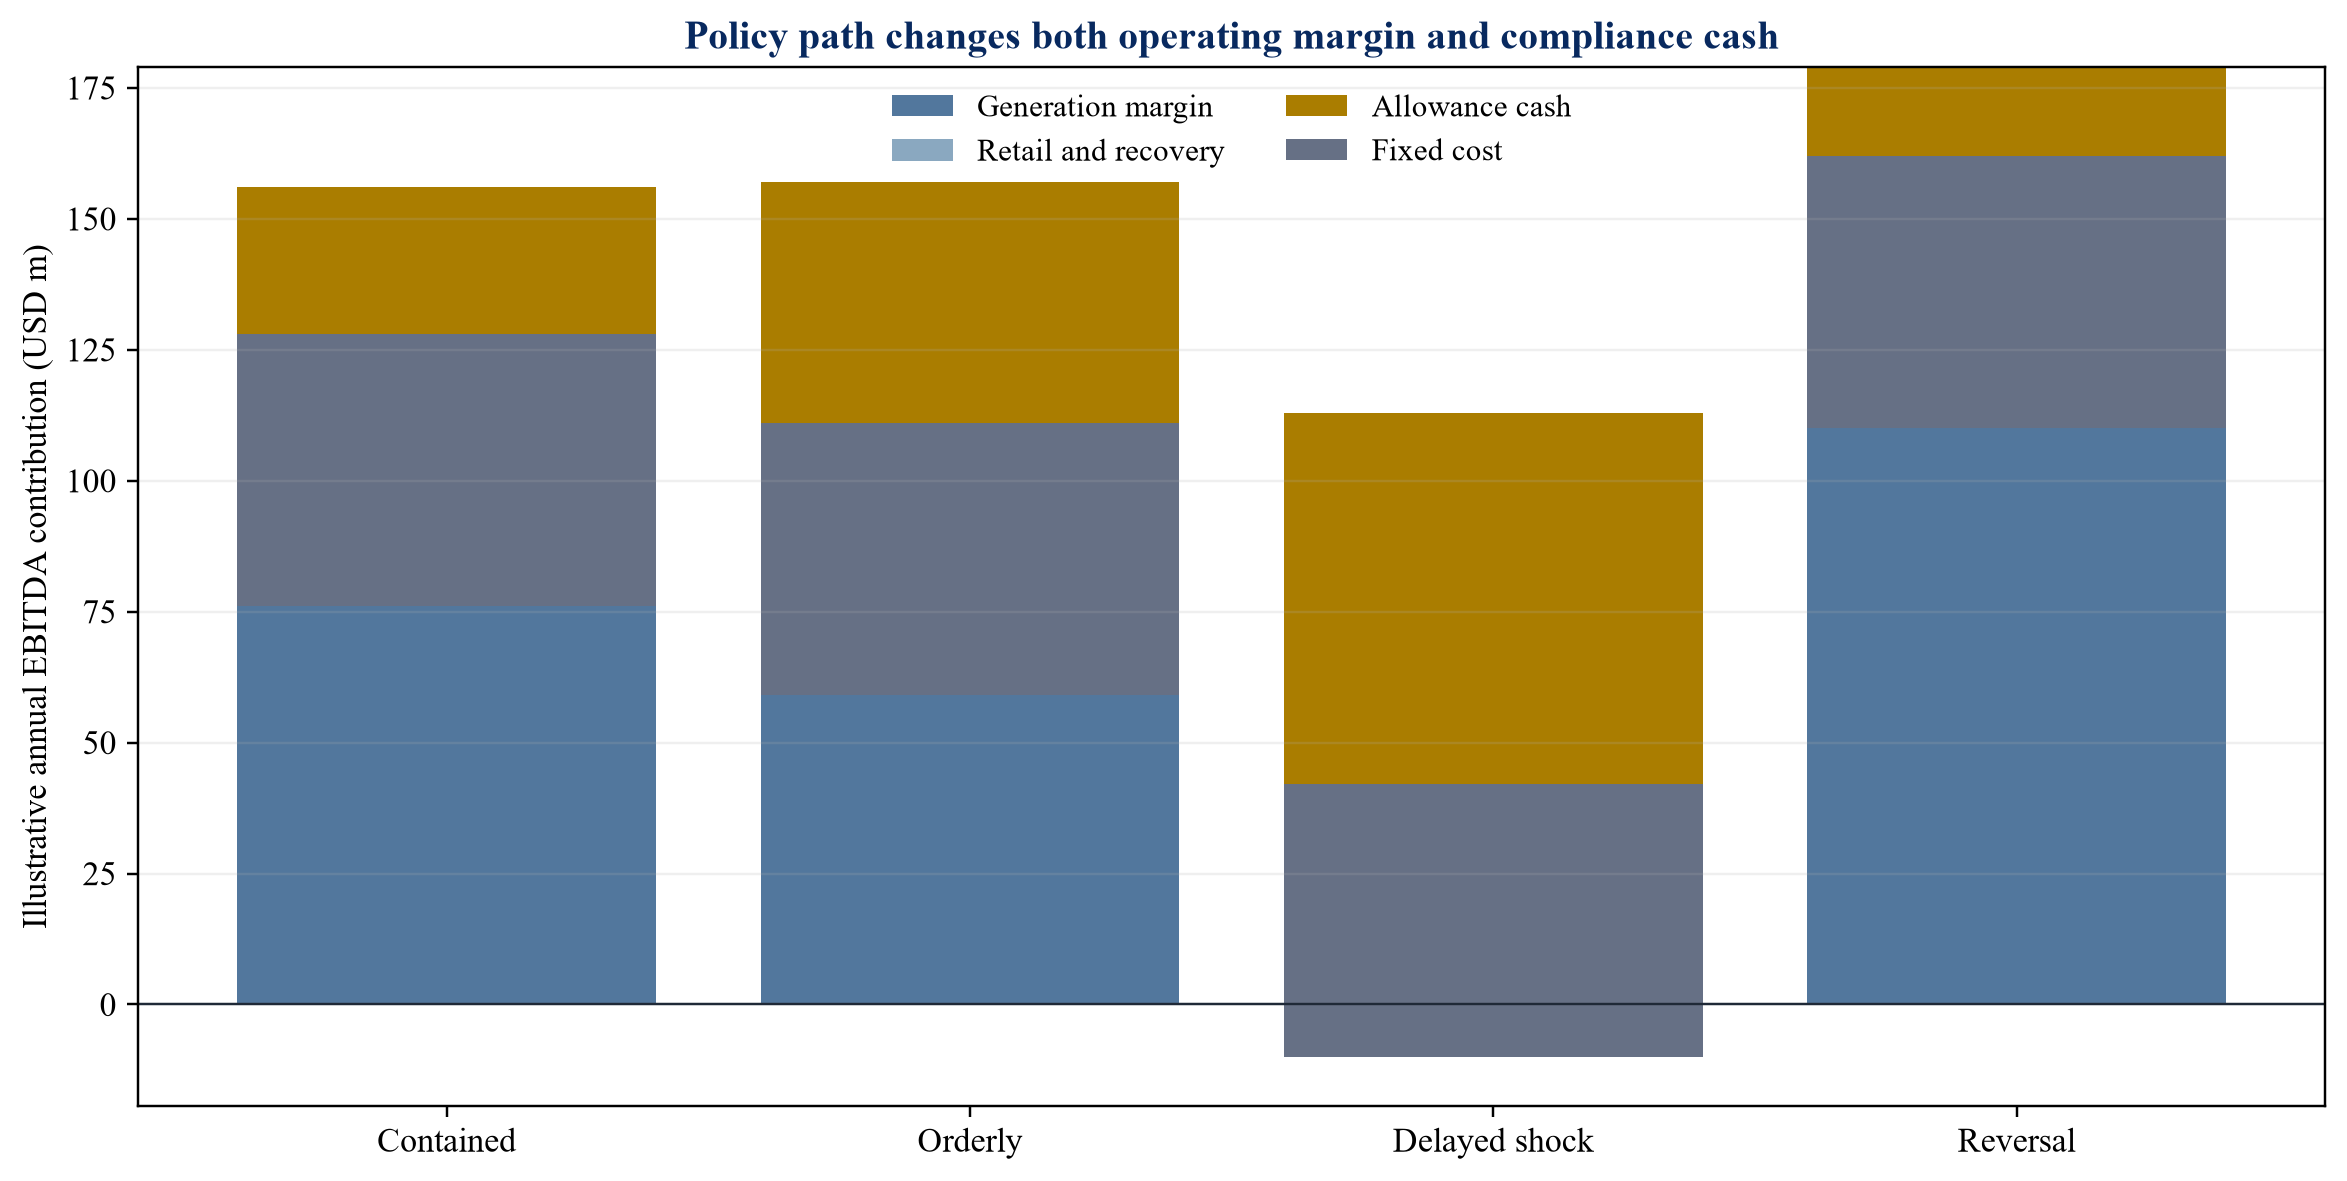
Author-modelled portfolio assumptions demonstrate how dispatch, power-price uplift, allowance cash and customer recovery can offset or reinforce each other. Values are illustrative USD millions and are not forecasts.
15 Use an integrated cash waterfall
The cash waterfall should begin with power and service revenue, subtract fuel and variable operating cost, include allowance purchases and sales, reflect customer-recovery timing, and then deduct fixed cost, tax, sustaining capital expenditure and debt service. Opening cash, revolver capacity and restricted accounts determine whether the business survives a transition period.
The allowance account can create seasonality. A generator may accumulate obligations through the year and purchase allowances around auctions or surrender. Risk policy can smooth purchases, yet margining can still create intraperiod peaks. The financing model should use monthly or finer timing when exposure is material.
Management should reconcile the statutory accounts, regulatory accounts and decision model. Accounting classification of allowances, grants, provisions and derivatives depends on facts and applicable standards. The model's purpose is cash and decision analysis; it should not substitute for the accounting assessment.
16 Compare capital options under the same policy paths
An emitting plant can continue, improve efficiency, convert fuel, install carbon capture, add storage, repower, move to reserve service or retire. Each option changes emissions, dispatch capability, capital expenditure, outage time and residual value.
The option model should use the same fuel, carbon, power-price and demand scenarios as the base case. A carbon-capture project needs capture rate, energy penalty, transport and storage availability, liability allocation and crediting rules. A gas conversion requires fuel and network capacity. Storage can change market participation without removing the underlying plant's fixed costs.
The decision should compare net present value, liquidity, debt capacity, emissions and strategic flexibility. A staged investment can retain an option while evidence improves. A large irreversible investment requires a stronger policy and infrastructure case.
17 Link carbon policy to asset valuation
Valuation should reflect expected dispatch, margins, capital expenditure and asset life under probability-weighted scenarios. A single terminal carbon price cannot capture path dependence. A delayed shock can destroy value even when the long-run price matches an orderly path because the asset has less time to adapt.
Discount rates can incorporate market and execution risk, yet operating scenarios should carry policy effects that can be modelled directly. Double counting arises when the same carbon risk reduces cash flow and increases the discount rate without a clear basis.
Market multiples require consistency. Two thermal portfolios with similar capacity can have different value because of efficiency, emissions intensity, contracts, location, retirement obligations, allowance inventory and regulatory recovery. Transaction diligence should rebuild the carbon bridge at asset level.
18 Identify stranded-cost and impairment triggers
Carbon policy can reduce operating hours, margins and useful life. It can also require environmental or conversion capital. Impairment analysis should use the applicable accounting standard and approved forecasts. Decision models can support the evidence by documenting scenarios, dispatch and cash flow.
Indicators include sustained negative clean margins, loss of cost recovery, accelerated closure policy, inability to renew permits, withdrawal of free allocation, fuel-infrastructure constraints and a lower value of alternative use. Decommissioning and remediation obligations should be updated when retirement timing changes.
The IEA's work on coal transitions emphasises the need to manage reliability, affordability, workers and communities alongside asset retirement [19]. A financially coherent plan therefore includes transition cost and stakeholder obligations rather than treating closure as a zero-cost switch.
19 Treat regulated utilities as a separate case
A regulated utility can recover prudent carbon and fuel costs through tariffs, trackers or periodic rate cases. Recovery can reduce long-run earnings exposure while creating timing, disallowance and affordability risk. The model should reproduce the regulatory mechanism.
Key variables include eligible cost, true-up frequency, allowed return on working capital, prudence standards, customer-class allocation and bill-impact limits. A policy intervention may cap tariffs, defer recovery or securitise balances. These actions change cash flow and leverage.
Allowance value may be directed to customers. California's programme allocates allowances to electrical distribution utilities under rules governing their use and proceeds [9]. The financing analysis should identify which entity receives the allowances and how value is returned.
20 Treat merchant generation as a spread business
Merchant thermal value depends on clean spark or dark spreads, dispatch hours and capacity or ancillary revenues. Carbon cost changes the spread directly and can change the market price indirectly. Hedging only power, fuel or carbon can leave a residual exposure.
The hedge book should be represented contract by contract, including volume, location, tenor, collateral and optionality. A plant can be economically hedged for expected output while remaining exposed to outages or dispatch changes. Policy shifts can alter correlations and reduce hedge effectiveness.
Low-carbon merchant assets can benefit from carbon-driven power prices. Renewable capture prices can still decline as similar output enters the market. Portfolio valuation should model both effects.
21 Reconcile PPAs with carbon exposure
A fixed-price PPA can transfer part of power-price risk while leaving carbon cost with the generator. A cost pass-through clause can transfer carbon cost subject to definitions, evidence and timing. A tolling agreement can allocate fuel and carbon to the toller. Contract language determines the economic result.
The contract review should address carbon-cost definition, covered emissions, free allocation, taxes, allowances, offsets, law changes, dispatch rights, audit, invoicing and termination. The definition should avoid double recovery where power prices already reflect carbon and a separate pass-through applies.
Long-term contracts should contain a process for policy change. A change can expand sector coverage, alter allocation or introduce a border mechanism. Relief can be formulaic, negotiated or subject to termination thresholds.
22 Optimise the portfolio under physical constraints
Portfolio optimisation should coordinate generation, retail load, contracts, fuels, allowances, storage and interconnection. Carbon policy can make an asset less competitive while increasing the value of another asset or customer position. The legal and regulatory ability to realise those offsets should be tested.
Optimisation begins with a common hourly data set and an asset register. It uses unit commitment, allowance inventory, hedges and customer recovery. It should produce dispatch, emissions, revenue, compliance cash, liquidity and covenant metrics for each scenario.
Model governance is essential. Independent review should test equations, data lineage, constraints and scenario consistency. Management overlays should remain visible and approved.
23 Model carbon-border interaction
Carbon border measures can affect power-intensive customers, imports and competitiveness. The European Union Carbon Border Adjustment Mechanism links specified imported goods to embedded emissions and the EU carbon price, with transitional reporting and phased financial obligations under applicable rules [20]. The United Kingdom plans its own mechanism from 2027 for specified imported goods [21].
A utility serving exposed industry should model load, credit and relocation risk. Border protection can support domestic production, yet administrative cost and product coverage matter. Indirect electricity emissions may receive different treatment across regimes.
Generators and investors should avoid assuming a border mechanism creates full equivalence. Methodology, default values, free-allocation adjustment, export treatment and recognition of foreign carbon prices determine the effect.
24 Plan for policy intervention and discontinuity
Carbon markets contain policy mechanisms. Caps, auction schedules, reserve rules, price floors, ceilings, offset limits and eligibility can change. Courts and elections can alter implementation. The model should identify legal steps and decision dates that can affect each scenario.
The EU Market Stability Reserve uses published thresholds and intake rules [4]. California publishes reserve tiers and a price ceiling that escalate under programme rules [5]. These mechanisms reduce some uncertainty while creating conditional supply responses.
Policy monitoring should assign an owner to legislation, regulations, consultations, regulator publications and litigation. A probability change should trigger model refresh and review of hedges, liquidity and capex. The board should receive the financial consequence, not only a policy summary.
25 Compare policy paths through one illustrative portfolio
The illustrative portfolio contains thermal generation, low-carbon generation and retail load. It uses hypothetical assumptions and demonstrates the method. It does not forecast a named market. The contained path assumes cost-containment measures limit the carbon-price tail. The orderly path tightens gradually. The delayed-shock path produces a rapid increase after limited early action. The reversal path weakens the carbon signal.
The delayed-shock case produces the lowest illustrative EBITDA because allowance purchases and dispatch loss arrive before customer recovery and capital adaptation. The reversal case produces higher near-term cash but leaves greater future policy and transition exposure. The comparison shows why near-term earnings alone cannot determine strategy.
Table 2. Illustrative dispatch and cash outcomes under four carbon-policy paths
| Metric | Contained | Orderly | Delayed shock | Reversal |
|---|---|---|---|---|
| 2030 carbon-price assumption | USD 50/tCO2 | USD 80/tCO2 | USD 120/tCO2 | USD 10/tCO2 |
| Thermal generation index | 88 | 76 | 58 | 101 |
| Portfolio emissions index | 86 | 72 | 54 | 103 |
| Peak allowance funding | USD 34m | USD 55m | USD 86m | USD 21m |
| Customer-recovery lag | 3 months | 4 months | 9 months | 2 months |
| Illustrative EBITDA | USD 76m | USD 59m | negative USD 10m | USD 110m |
All values are hypothetical author-modelled assumptions. EBITDA values are consistent with Figure 3 and exclude tax, growth capital expenditure and financing.
26 Use a 180-day implementation roadmap
The first thirty days should establish governance, decisions, asset perimeter and policy inventory. The team should map compliance entities, contracts, tariff mechanisms, allowance accounts, hedges, debt and data owners. It should document enacted rules and current proposals.
Days thirty-one to seventy-five should build the plant and market model. The work includes heat rates, emissions factors, unit constraints, fuel and power curves, contracts, customer load, allowance rules and recovery. The model should reproduce historical dispatch and cash sufficiently for decision use.
Days seventy-six to one hundred and twenty should develop policy paths and financial integration. The organisation should model dispatch, allowance inventory, working capital, capex options, debt service and valuation. Treasury and lenders should review liquidity cases.
Days one hundred and twenty-one to one hundred and eighty should approve strategy and operational controls. Outputs include dispatch guidance, allowance acquisition policy, hedge limits, capex decisions, covenant plan, regulatory submissions, contract positions and board reporting.
27 Establish decision rights and controls
Carbon exposure crosses operations, trading, treasury, finance, regulation, legal, sustainability and strategy. The governance model should assign decisions explicitly. Operations controls dispatch within approved constraints. Trading executes allowances and hedges within limits. Treasury manages liquidity and collateral. Finance owns forecasts and covenant reporting. Legal and compliance confirm obligations.
A monthly committee should review price, inventory, emissions, dispatch, customer recovery, collateral and policy events. A quarterly board report should show scenario EBITDA, liquidity, debt headroom, capex commitments and retirement decisions. Exceptions should identify owner and resolution date.
Model changes require version control, testing and approval. Key assumptions should have sources and dates. Author-modelled scenarios should remain separate from observed market data.
Table 3. Carbon-path decision and control matrix
| Decision | Primary owner | Required evidence | Approval trigger |
|---|---|---|---|
| Dispatch carbon adder | Commercial operations | Applicable carbon rule, unit emissions and market bidding rules | Change in price, allocation or dispatch regulation |
| Allowance acquisition | Trading and treasury | Forecast emissions, inventory, liquidity and counterparty limits | Position or cash limit reached |
| Customer recovery | Regulatory finance | Tariff rule, prudence evidence and billing timetable | Material lag or disallowance risk |
| Asset conversion or retirement | Board and investment committee | Scenario NPV, reliability, workforce and remediation plan | Value or covenant threshold breached |
| Debt and liquidity plan | CFO and lenders | Integrated cash flow, collateral and coverage sensitivities | Minimum liquidity or coverage headroom reached |
| Policy scenario refresh | Strategy and regulatory affairs | Enacted rule, formal proposal or documented market evidence | Material probability or financial-impact change |
The matrix provides a governance template. Legal and organisational responsibilities should be adapted to the relevant utility.
28 Apply the framework across geographies
Competitive markets with auctioned allowances can transmit carbon cost through bids and wholesale prices. Regulated markets may use administered dispatch, tariffs or shadow carbon prices. Output-based systems can reward efficiency without producing the same fuel-switching incentive as an absolute cap.
Canada uses federal and provincial carbon-pricing arrangements, including industrial pricing systems, within a national policy framework [22]. South Africa applies a carbon tax with allowances and phase rules [23]. Singapore applies a carbon tax to covered facilities under its legislation and published rate pathway [24]. These instruments require jurisdiction-specific modelling.
International transfers under Article 6 of the Paris Agreement are developing under UNFCCC rules [25]. Their relevance to utility compliance depends on domestic authorisation and scheme eligibility. Voluntary credits should not be treated as compliance instruments unless the applicable programme permits them.
29 Convert the carbon path into transaction diligence and valuation
An acquisition, refinancing or asset partnership requires a bridge from technical dispatch to enterprise value. The diligence team should begin with the legal compliance perimeter and the economic dispatch perimeter because they can differ. A holding company may own several compliance installations, while the market operator commits individual units. The model should map each unit to its compliance account, fuel and power contracts, tariff treatment, debt entity and decommissioning obligation.
Quality of earnings should separate recurring operating performance from carbon effects that may reverse or change with policy. The analysis should identify free allocation, allowance sales, inventory gains, grants, customer true-ups, one-off settlements and temporary cost-containment measures. A seller presentation based on current carbon cash can overstate sustainable earnings when allocation declines or recovery lags. A buyer model can understate value when a low-emitting unit earns higher dispatch, capacity value or contract optionality under a tighter path.
The valuation bridge should calculate asset cash flows under each policy path and show the contribution from dispatch, wholesale price, compliance purchases, customer recovery, collateral, capital expenditure, tax and terminal obligations. Discount rates should not carry all policy uncertainty. Material and decision-relevant cash-flow consequences should appear in the scenarios. Residual uncertainty can inform the risk premium, probability weighting and transaction structure.
Debt diligence should test the entity that actually pays for allowances and posts collateral. The operating company may bear the cash requirement even when a parent provides the hedge or guarantee. The review should reconcile allowance accounts, treasury records, emissions data, power sales, fuel purchases and financial statements. It should also test whether permitted debt, distribution and hedging covenants allow the planned response.
Transaction documents can allocate defined policy risks through price adjustment, earn-outs, indemnities, locked-box protections, working-capital definitions and conditions precedent. These mechanisms require precise definitions. A broad change-in-law clause may not address free-allocation changes, delayed customer recovery or a market-stability intervention. The commercial model should therefore inform the legal drafting and negotiation positions.
An investment committee should receive a concise valuation bridge for each path, the switching points that change dispatch or capital decisions, the peak allowance and collateral funding need, covenant headroom and the mitigations available before closing. Where information remains incomplete, the committee should see the missing data, financial range and proposed protection. This produces a transaction decision that is traceable to the policy mechanism rather than a single carbon-price assumption.
30 Recognise limitations
The scenarios in this paper are illustrative. They do not use a named utility's plant data, contracts, allowance inventory, customer tariffs, debt or tax position. The results change with market design, fuel prices, emissions intensity, reliability constraints, policy rules and management action.
Carbon and electricity models are uncertain. Weather, demand, transmission, renewable buildout, fuel supply and technology costs can dominate near-term outcomes. Policy prices can be volatile and administrative interventions can alter relationships observed in historical data.
Legal, accounting and tax treatment depends on facts and jurisdiction. The framework supports commercial analysis and diligence. Executed decisions require applicable professional advice, model assurance and authorised approvals.
Conclusion
Carbon policy reaches utility value through dispatch, market prices, compliance cash, customer recovery, capital expenditure and financing. A quoted carbon price describes only one input. The decision model must reproduce the policy design and the electricity market.
The practical method is to calculate unit-level carbon-adjusted marginal cost, commit the fleet under physical and contractual constraints, maintain a separate allowance inventory and cash ledger, model customer recovery and connect the result to liquidity, debt service and asset value. Several coherent policy paths reveal timing and discontinuity risks that a central forecast conceals.
Boards and lenders can use this framework to identify the carbon price or policy event that changes dispatch, funding, covenants or investment choice. The resulting decisions become traceable to evidence, scenarios and controls. That discipline supports timely capital allocation while preserving reliability and financial resilience.
References
- World Bank. State and Trends of Carbon Pricing 2026. 2026. https://www.worldbank.org/en/publication/state-and-trends-of-carbon-pricing
- International Energy Agency. Implementing Effective Emissions Trading Systems: ETS in the Power Sector. 2020. https://www.iea.org/reports/implementing-effective-emissions-trading-systems/ets-in-power-sector
- World Bank. Carbon Pricing Dashboard. 2026. https://carbonpricingdashboard.worldbank.org/
- European Commission. Market Stability Reserve. 2026. https://climate.ec.europa.eu/areas-action/carbon-markets/eu-emissions-trading-system-eu-ets/market-stability-reserve_en
- California Air Resources Board. Cost Containment Information. 2026. https://ww2.arb.ca.gov/our-work/programs/cap-and-trade-program/cost-containment-information
- International Energy Agency. The Role of China's ETS in Power Sector Decarbonisation. 2021. https://www.iea.org/reports/the-role-of-chinas-ets-in-power-sector-decarbonisation
- International Energy Agency. The Potential Role of Carbon Pricing in Thailand's Power Sector. 2021. https://www.iea.org/reports/the-potential-role-of-carbon-pricing-in-thailands-power-sector
- International Energy Agency. Coal 2025: Prices and Costs. 2025. https://www.iea.org/reports/coal-2025/prices-and-costs
- California Air Resources Board. Allowance Allocation. 2026. https://ww2.arb.ca.gov/our-work/programs/cap-and-trade-program/allowance-allocation
- European Commission. Auctioning of Allowances. 2026. https://climate.ec.europa.eu/areas-action/carbon-markets/eu-emissions-trading-system-eu-ets/auctioning-allowances_en
- Network for Greening the Financial System. NGFS Climate Scenarios for Central Banks and Supervisors. 2024. https://www.ngfs.net/ngfs-scenarios-portal/
- European Commission. 2025 Carbon Market Report. 2025. https://climate.ec.europa.eu/document/download/ddc1b1de-652b-49ed-8f15-d9fa8badd39f_en
- UK Emissions Trading Scheme Authority. Participating in the UK ETS. 2026. https://www.gov.uk/government/publications/participating-in-the-uk-ets/participating-in-the-uk-ets
- UK Emissions Trading Scheme Authority. UK ETS Policy Overview. 2026. https://www.gov.uk/government/publications/uk-emissions-trading-scheme-uk-ets-policy-overview/uk-emissions-trading-scheme-uk-ets-a-policy-overview
- California Air Resources Board. CARB Adopts Updates to California's Cap-and-Invest Program. 2026. https://ww2.arb.ca.gov/news/carb-adopts-updates-californias-cap-and-invest-program-affordability-and-align-climate
- Regional Greenhouse Gas Initiative. Elements of RGGI. 2026. https://www.rggi.org/program-overview-and-design/elements
- International Energy Agency. Enhancing China's ETS for Carbon Neutrality: Focus on Power Sector. 2021. https://www.iea.org/reports/enhancing-chinas-ets-for-carbon-neutrality-focus-on-power-sector
- UK Emissions Trading Scheme Authority. UK ETS for Installations: How to Comply. 2026. https://www.gov.uk/government/publications/uk-emissions-trading-scheme-for-installations-how-to-comply/uk-emissions-trading-scheme-for-installations-how-to-comply
- International Energy Agency. Accelerating Just Transitions for the Coal Sector. 2024. https://www.iea.org/reports/accelerating-just-transitions-for-the-coal-sector
- European Commission. Carbon Border Adjustment Mechanism. 2026. https://taxation-customs.ec.europa.eu/carbon-border-adjustment-mechanism_en
- HM Revenue and Customs. Carbon Border Adjustment Mechanism Factsheet. 2026. https://www.gov.uk/government/publications/factsheet-carbon-border-adjustment-mechanism-cbam
- Government of Canada. Carbon Pollution Pricing Systems across Canada. 2026. https://www.canada.ca/en/environment-climate-change/services/climate-change/pricing-pollution-how-it-will-work.html
- South African Revenue Service. Carbon Tax. 2026. https://www.sars.gov.za/customs-and-excise/excise/environmental-levy-products/carbon-tax/
- Singapore National Environment Agency. Carbon Tax. 2026. https://www.nea.gov.sg/our-services/climate-change-energy-efficiency/climate-change/carbon-tax
- United Nations Framework Convention on Climate Change. Article 6 of the Paris Agreement. 2026. https://unfccc.int/process-and-meetings/the-paris-agreement/article-6
- Intergovernmental Panel on Climate Change. Climate Change 2022: Mitigation of Climate Change. 2022. https://www.ipcc.ch/report/ar6/wg3/
- OECD. Effective Carbon Rates 2023. 2023. https://www.oecd.org/tax/tax-policy/effective-carbon-rates-2023-6b3d4c49-en.htm
- International Monetary Fund. Proposal for an International Carbon Price Floor among Large Emitters. 2021. https://www.imf.org/en/Publications/staff-climate-notes/Issues/2021/06/15/Proposal-for-an-International-Carbon-Price-Floor-Among-Large-Emitters-460468
- World Bank. State and Trends of Carbon Pricing 2025. 2025. https://openknowledge.worldbank.org/bitstreams/c65f581d-d94b-4f3f-91fc-c0f3250650df/download
- California Air Resources Board. Cap-and-Invest Program Data Dashboard. 2026. https://ww2.arb.ca.gov/our-work/programs/cap-and-trade-program/program-data/cap-and-trade-program-data-dashboard
About the Author
Authored by Chennakeshav Adya Independent Researcher
Chennakeshav (CK) is a corporate finance and investment banking executive with 25+ years of global experience in deal origination, structuring and execution across M&A, growth capital and corporate strategy. He has led value-creation mandates for founders, corporates and funds — bridging the boardroom view to hands-on execution and close.
His career spans Morgan Stanley, HSBC, Lloyds Banking Group, EWEC, ADQ portfolio companies and Emirates Growth Fund, across TMT, real estate, fintech, deeptech, cleantech, infrastructure and energy. He has partnered with C-suite leaders, private equity and venture funds, sovereign wealth funds and family offices to finance complex fund raises and scale-up ventures, and has led M&A due diligence, post-merger integration and business-transformation initiatives to create value.
At Matchpoint Partners he is Managing Partner, leading the firm's corporate finance, M&A and capital-raising practice. He holds an MBA from London Business School, an engineering degree from VTU and a Master of Laws (LLM, in progress) from UCL London.
An active start-up mentor, CK mentors at Techstars, DIFC FinTech Hive, Startup Grind, Founder Institute and IN5, serves as Entrepreneur Mentor in Residence (EMiR) at London Business School, and judges the Entrepreneurship World Cup.
LinkedIn: https://www.linkedin.com/in/ckadya/ Matchpoint Partners: https://www.matchpoint-partners.com/team/ck-adya.html
This paper is part of a continuing series on the structure of private and alternative markets. The views expressed are the author's own. The paper is for information only, describes market structure in general terms, and does not constitute investment, legal, tax or regulatory advice or a recommendation in respect of any security, vehicle or counterparty.
