

Introduction
Infrastructure security has become an investment issue. Extreme weather, cyberattacks, geopolitical tension, export controls, equipment concentration and interdependent networks can interrupt essential services. The European Union defines resilience as the ability to prevent, protect against, respond to, resist, mitigate, absorb, accommodate and recover from an incident [1]. This definition directs attention beyond physical protection to continuity and recovery.
An asset owner faces two valuation errors. The first omits resilience value because disruptions are treated as remote or insured. The second assumes every security expenditure creates value. A redundant line, local supplier, spare transformer or backup data centre has economic value only when it changes the probability, duration or consequence of an interruption at an acceptable cost.
This paper provides a decision framework for investors, governments, regulators, utilities, lenders and transaction teams. It applies to regulated and merchant infrastructure, public-private partnerships, corporate networks and strategic industrial assets. Jurisdiction-specific security restrictions, procurement rules, foreign-investment controls and regulatory treatment require current advice.
1 Define the essential service
Valuation should begin with the service that must continue. The asset may provide electricity, potable water, wastewater treatment, transport capacity, data processing, payments, communications, health logistics or fuel supply. The analysis should define minimum acceptable service, customers, geography, duration and recovery target.
The Critical Entities Resilience Directive covers sectors including energy, transport, banking, financial-market infrastructure, health, drinking water, wastewater, digital infrastructure, public administration, space and food [1]. Its cross-sector scope reflects cascading effects. A data centre depends on power, cooling water, fibre, equipment and staff. A water system depends on electricity, chemicals, pumps, controls and transport.
The valuation perimeter should include dependencies that can stop service. Asset ownership alone is too narrow. The investor should identify which dependencies are contracted, regulated, substitutable or outside control.
2 Separate private, system and public value
Private value is the cash flow available to the asset owner. System value is the avoided cost to connected networks and users. Public value includes wider economic continuity, safety, national capability and social welfare. These values can overlap and should not be added without reconciliation.
The owner can finance resilience where a payment mechanism captures the benefit. A regulated utility may recover prudent expenditure through its asset base or performance incentives. A concession may include availability payments. A corporate user may pay for higher reliability. Government may fund a capability whose benefits cannot be monetised through tariffs.
The valuation should state the channel for each benefit. An avoided economic loss to society is not automatically project revenue. Public value can support a subsidy, guarantee or procurement decision when the authority approves it.
3 Build the hazard and dependency map
The risk register should cover natural, technical, cyber, geopolitical, supplier, financial and human hazards. It should identify initiating events, vulnerable components, protective controls, service consequences, detection, response and recovery.
Dependencies should be mapped by tier. Direct dependencies include power, water, telecoms, transport, cloud services and critical equipment. Indirect dependencies include upstream materials, specialist maintenance, software updates and payment services. Geographic concentration can create common-mode failure even where several suppliers exist.
The map should show data quality. Asset-condition records may be verified; supplier-tier visibility may be incomplete; geopolitical scenarios may be author-modelled. Management estimates should remain labelled in the investment paper.
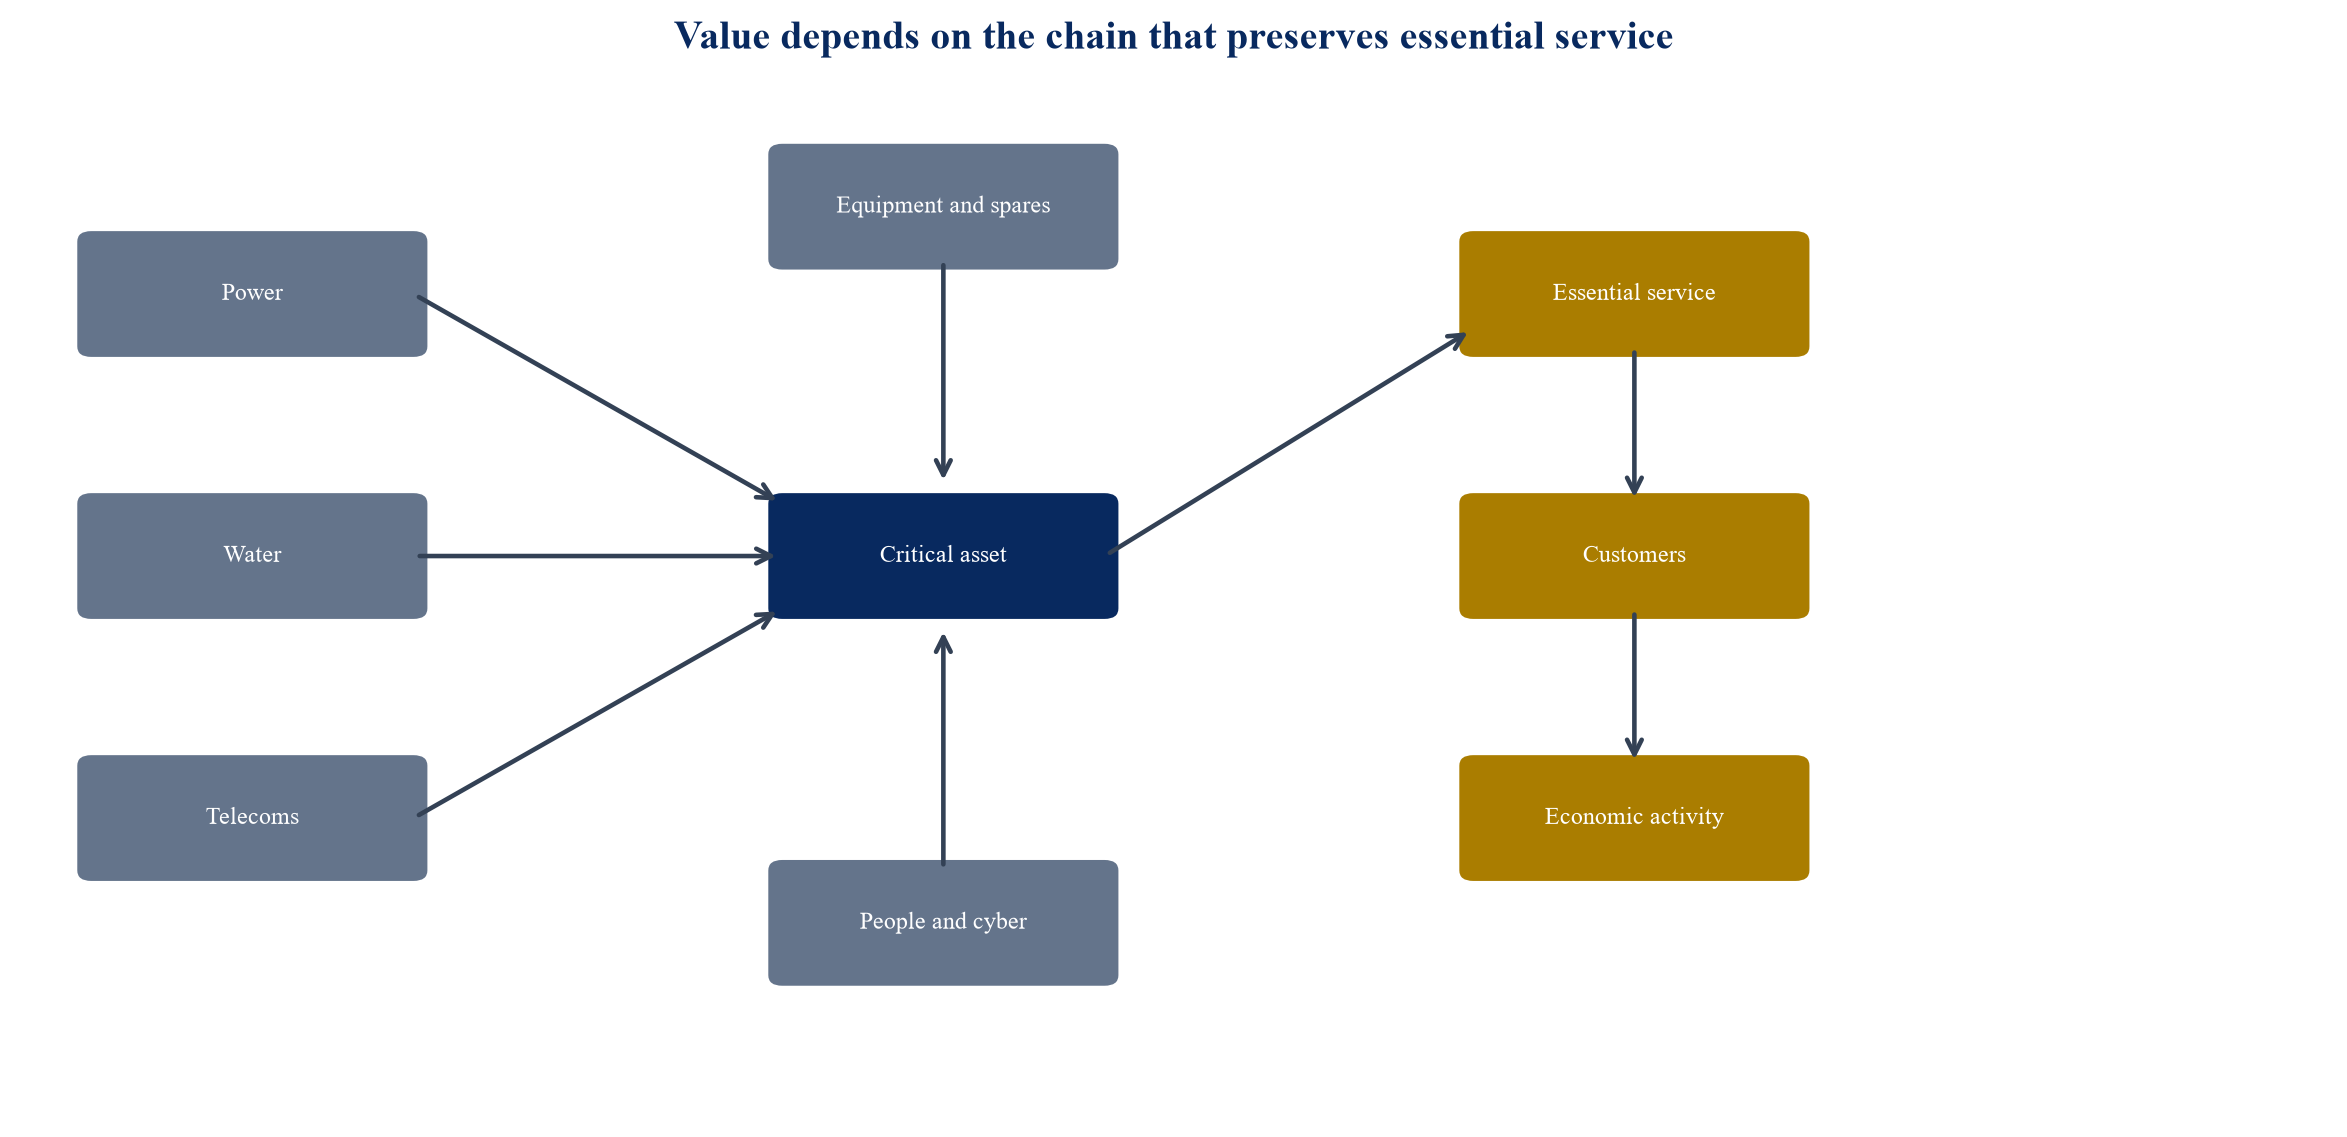
The diagram is an author-developed framework. It does not represent a specific asset or national system.
4 Define disruption scenarios
Scenarios should specify cause, affected components, probability range, service reduction, duration, recovery path and financial consequence. They should include frequent operational events and severe tail events. A single average outage assumption can conceal nonlinear damage.
Scenario design should avoid precision unsupported by evidence. Historical frequency may be relevant for weather or equipment failure. Cyber and geopolitical events may require ranges and stress cases. Climate change can alter hazard frequency during the asset life.
Interdependencies matter. A flood can damage power, roads and telecoms simultaneously. A supplier restriction can delay replacement across several assets. The scenario set should include common-mode and correlated failures.
5 Estimate expected disruption loss
Expected annual disruption loss combines scenario probability and consequence. Consequence can include lost revenue, repair, penalties, customer compensation, emergency procurement, working-capital stress and increased financing cost. System and public loss should be shown separately.
Tail exposure should supplement the expected value. Debt service can fail during a low-probability event even when average loss appears manageable. Liquidity needs, covenant headroom and insurance recoveries should be modelled by month.
The World Bank estimates that disruptions impose large costs and that resilience can generate material lifetime benefits [2]. Asset-level analysis still requires local hazard, condition, demand and contractual data.
6 Value recovery time
Resilience measures can reduce failure probability, service loss or recovery time. Recovery time has direct value where outage cost rises with duration. A spare part on site may not prevent failure, but can shorten restoration from months to days.
The model should define recovery-time objective, recovery-point objective for data, minimum service and sequencing. It should test access to sites, staff, fuel, replacement equipment and external approvals during the event.
Recovery capability should be tested through exercises and observed incidents. A written plan without people, spares, communications and authority should not receive full valuation credit.
7 Compare resilience measures on a common basis
Options can include hardening, redundancy, geographic diversity, alternative routing, stockpiles, modular equipment, backup generation, cyber segmentation, mutual assistance, insurance and demand prioritisation. Each option should be compared by cost, risk reduction, implementation time, useful life and residual risk.
Table 1. Resilience-option decision matrix
| Measure | Risk channel | Capital intensity | Time to deploy | Key limitation |
|---|---|---|---|---|
| Physical hardening | Reduces damage probability | High | Long | Hazard may move beyond design standard |
| Redundant route | Preserves service after failure | High | Medium to long | Common-mode failure can affect both routes |
| Strategic spare | Reduces recovery time | Medium | Short to medium | Obsolescence and storage requirements |
| Supplier diversification | Reduces concentration | Medium | Medium | Qualification and volume economics |
| Cyber segmentation | Limits propagation | Medium | Medium | Requires continuing control discipline |
| Mutual assistance | Adds emergency capacity | Low to medium | Short | Counterparties may face the same event |
The table is a generic decision framework. Performance depends on the asset and hazard.
8 Calculate resilience net present value
Resilience net present value equals avoided private losses and incremental revenue minus capital expenditure, operating cost, degradation and residual exposure. Benefits should be probability-weighted and discounted consistently with their risk. Public benefits should remain in a separate economic appraisal unless a payment mechanism transfers them to the owner.
The model should avoid counting insurance and avoided loss twice. Insurance transfers part of loss and creates premiums, deductibles, exclusions and payment delay. A resilience measure may reduce both retained loss and premium; each channel should be shown.
The analysis should include option expiry and technological change. A spare can become obsolete. A second route may become congested. A local manufacturing commitment may have a price premium that changes with scale.
9 Treat strategic autonomy as a portfolio decision
Strategic autonomy concerns control over capabilities needed to sustain essential service. It can include domestic production, diversified imports, stockpiles, technology rights, skilled labour, data control and allied supply arrangements. Complete self-sufficiency is rarely necessary or efficient.
The decision should identify intolerable dependencies, acceptable concentration and the time available to substitute. A product with a twelve-month lead time and one qualified source creates different exposure from a commodity with transparent global supply.
The European Commission's economic-security approach and critical-entity framework emphasise risk assessment, preparedness and coordinated resilience [1][3]. The asset valuation should reflect concrete controls rather than a general autonomy premium.
10 Value supply-chain concentration
Supplier concentration affects price, delivery and recovery. The analysis should identify manufacturing location, ownership, logistics route, qualification time, intellectual property, tooling and sub-tier materials. Several distributors can depend on one factory.
The IEA reports high concentration in critical mineral processing and energy-technology supply chains [4][5]. Similar concentration can exist for transformers, power electronics, semiconductors and specialist control systems.
Valuation adjustments can include higher inventory, longer lead time, alternative qualification cost and disruption scenarios. A diversified supplier should receive credit only after technical qualification and commercial access are verified.
11 Price redundancy
Redundancy creates capacity that may appear underutilised in normal operation. Its value lies in continuity during failure and maintenance. The valuation should identify independence, switchover time, capacity, testing and operating cost.
An N-1 standard may be insufficient where assets share a substation, route, software platform or floodplain. The model should test common-mode failure. Redundancy that cannot carry minimum service should be valued for its partial contribution.
Regulatory treatment is decisive. The owner needs clarity on whether redundancy enters the regulated asset base, earns availability revenue or remains an unrecovered cost.
12 Distinguish resilience capital expenditure from maintenance
Maintenance preserves intended performance. Resilience expenditure changes the asset's ability to withstand or recover from defined events. The categories can overlap, but the investment case should state the incremental outcome.
Deferred maintenance can masquerade as a resilience gap. Funding a replacement that was already required should not be credited entirely to security. The baseline should use asset condition, failure history and approved maintenance plans.
The financing plan should align the life of the measure with debt tenor and cost recovery. Short-lived cyber tooling or stockpiles require different treatment from a long-lived second transmission route.
13 Build a resilience-adjusted cash-flow model
The base case should show conventional operating cash flow. Separate scenario modules should calculate event timing, lost revenue, emergency cost, insurance, recovery capital and financing effects. The resilience case should change only the parameters supported by the measure.
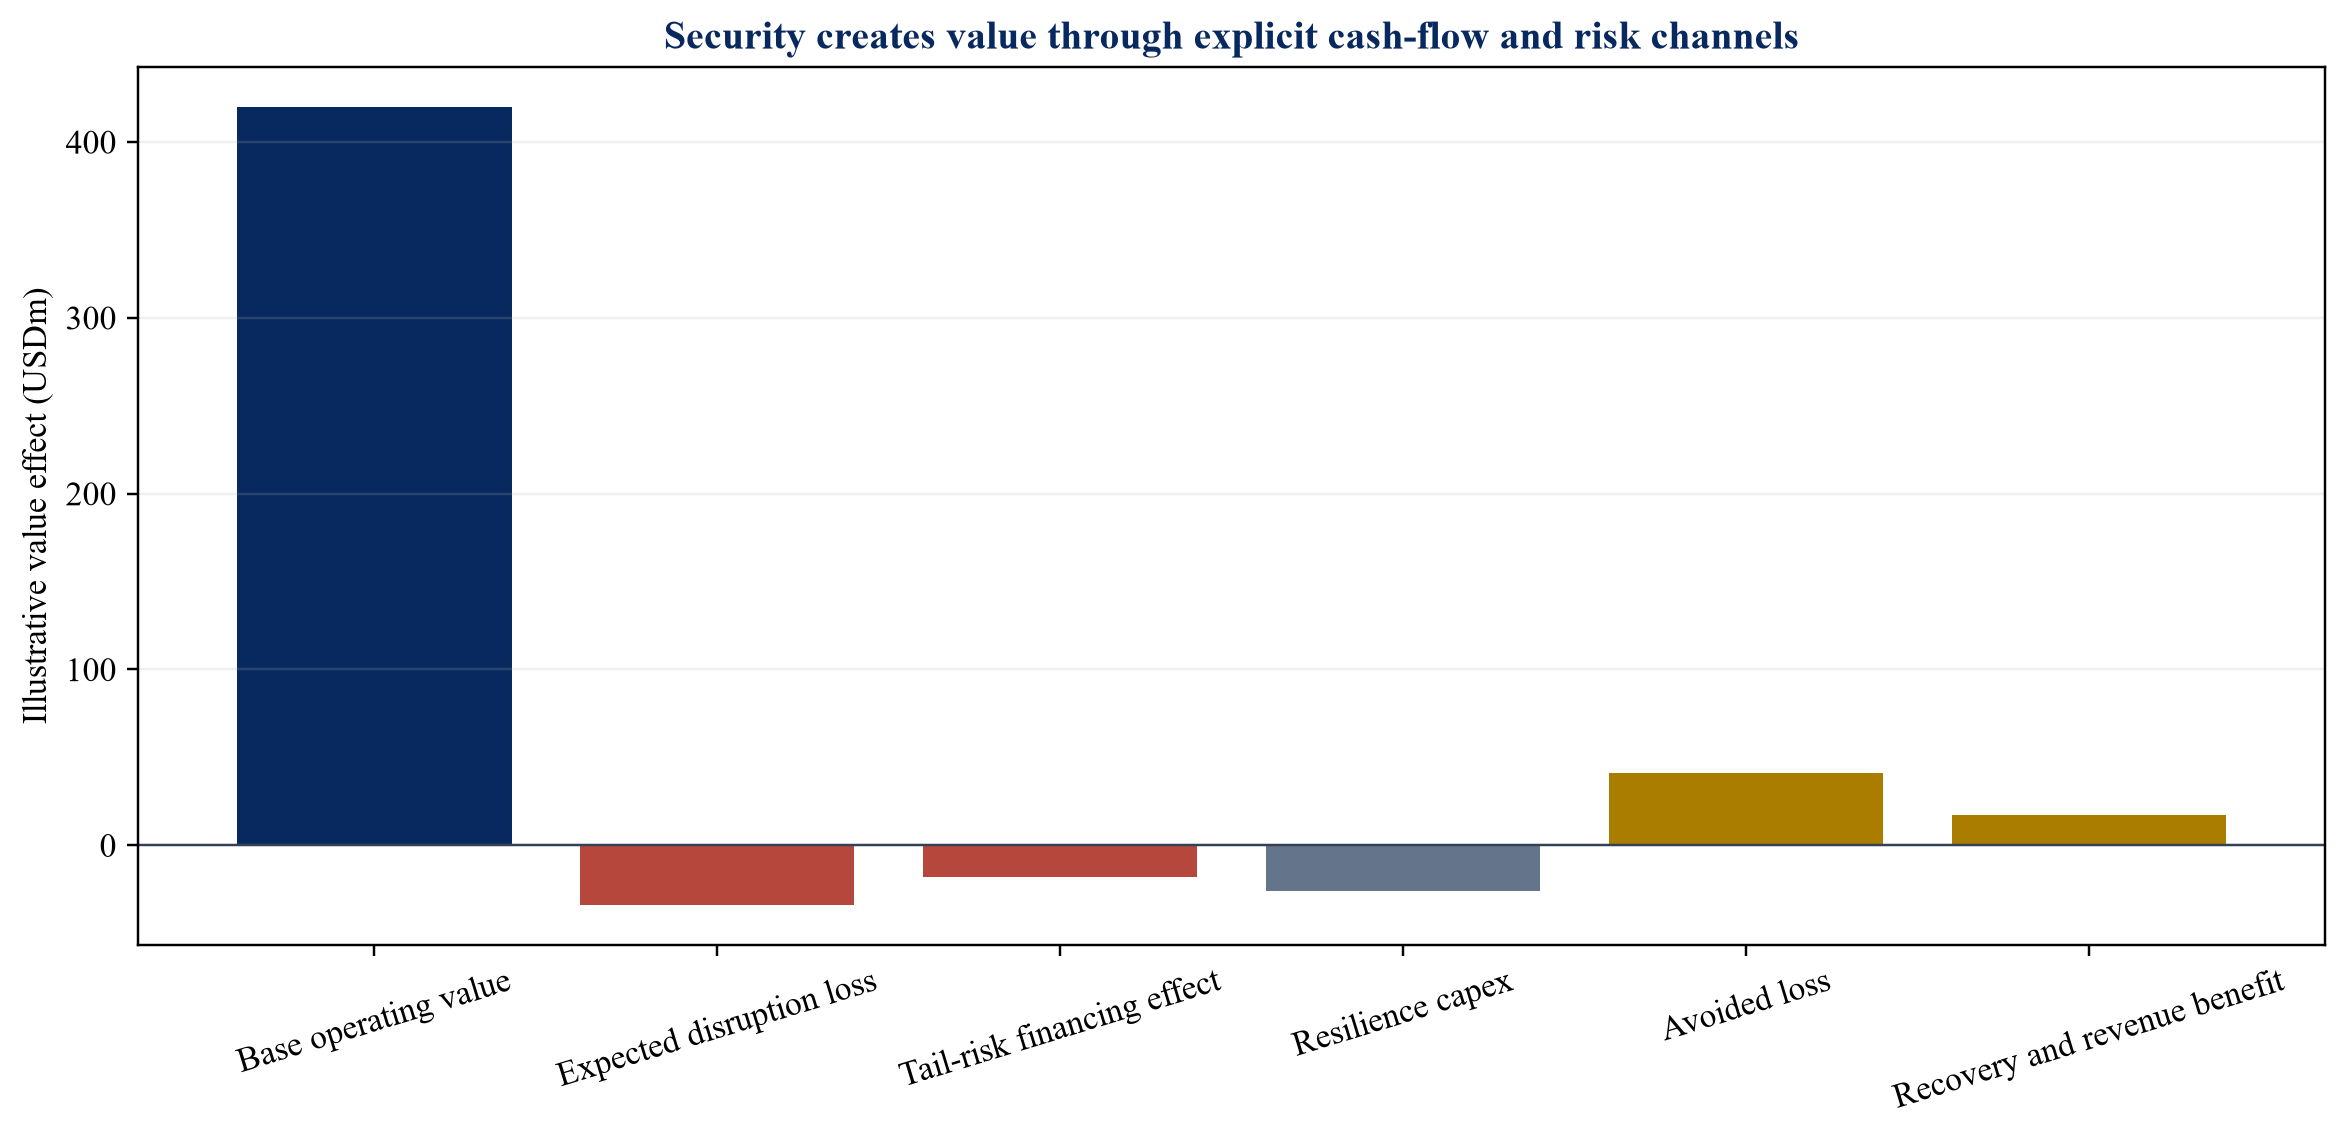
All values are hypothetical author-modelled assumptions in USD millions and do not constitute a valuation opinion.
14 Select the valuation method
A discounted cash-flow model can capture explicit disruption and resilience effects. Regulated assets may require a regulatory-asset-base or allowed-revenue analysis. Availability-based concessions require contract-level modelling. Market comparables can provide a reasonableness check when accounting and risk profiles are comparable.
A lower discount rate should not be used as the sole resilience adjustment. It obscures the source of value and can overstate long-dated cash flow. Explicit scenarios, liquidity and cost-of-debt effects provide clearer evidence.
Replacement-cost and economic-value methods can inform public decisions, but should not be mixed with enterprise value without identifying the payment mechanism.
15 Model insurance accurately
Insurance can transfer property damage, business interruption, cyber and liability risks. Coverage has limits, deductibles, waiting periods, exclusions, sublimits and counterparty risk. Claims timing can create liquidity needs.
The model should use policy terms and broker or insurer evidence. It should identify uninsured service loss, regulatory penalties and public consequences. Premium reductions linked to resilience should be supported by quotations or experience.
Insurance cannot replace operational continuity where essential services must remain available. The board should decide which risks to prevent, mitigate, transfer or retain.
16 Translate resilience into regulated revenue
A regulator may approve expenditure, allowances, performance incentives or resilience standards. The submission should define the risk, option appraisal, customer benefit, cost allocation and delivery milestones. It should show how the investment interacts with reliability and affordability.
The owner should not assume automatic recovery. Timing, efficiency review and disallowance risk affect value. A resilience programme can create cash strain where capital is spent before tariffs adjust.
The investment model should separate approved, proposed and management-estimated recovery. Covenant analysis should stress delay and partial allowance.
17 Structure availability and security contracts
Government or large users can procure continuity through availability payments, capacity reservations, minimum inventories, priority access and recovery commitments. The contract should define service level, testing, deductions, force majeure, change in law and termination.
Security obligations can conflict with commercial dispatch. The agreement should define when reserved capacity cannot be used elsewhere and how opportunity cost is paid. Step-in and information rights may be required for critical services.
Contract duration should support the necessary capital. A short contract can leave stranded resilience assets unless residual value or renewal is credible.
18 Finance resilience through the capital structure
Senior debt requires predictable cash flow and downside protection. Resilience can improve debt capacity by reducing interruption and liquidity risk, but capital spending can initially increase leverage. Lenders should assess construction, implementation and residual-risk cases.
Green, sustainability-linked or resilience-labelled finance can support eligible expenditure where definitions and reporting are credible. Label alone does not change repayment capacity.
Government guarantees, subordinated capital or viability support may be appropriate where public value exceeds private revenue. The structure should state the risk transferred and avoid open-ended contingent liability.
19 Value liquidity and emergency funding
An asset can survive physical disruption and still fail financially. The model should estimate cash needs during revenue loss, repair, emergency procurement and insurance delay. Committed facilities, reserve accounts and sponsor support should be tested for availability during the same event.
Liquidity should be sized to recovery scenarios rather than an average operating month. Restricted cash and trapped subsidiaries may not be available. Currency and import controls can affect emergency purchases.
The lender model should show minimum cash, debt-service coverage and covenant headroom through recovery.
20 Use real options for uncertain threats
Resilience investment can create options to expand, isolate, reroute, substitute or restore. Modular design may allow staged capital as risk becomes clearer. Land, permits, interfaces and engineering can preserve future choices.
Real-option value should be tied to decision rights and triggers. A theoretical option has limited value without control of the site, technology, approval or supplier. The model should state exercise cost, timing and expiry.
Scenario trees can compare immediate hardening with staged preparation. Management flexibility should not be treated as costless.
21 Measure cyber resilience as an operating capability
Cyber resilience includes asset inventory, identity, segmentation, monitoring, incident response, backup, recovery and supplier control. A one-time technology purchase has limited value without continuing operation and testing.
CISA and NIST frameworks provide structured approaches to critical-infrastructure cyber risk [6][7]. Asset-level diligence should verify implementation, exceptions, incidents and recovery tests.
Valuation channels include outage reduction, regulatory compliance, insurance, customer retention and avoided remediation. Cyber maturity scores should remain linked to evidence and action.
22 Incorporate climate adaptation
Climate hazards can change during a long asset life. Flood, heat, wildfire, drought, storm and sea-level scenarios should use asset-relevant time horizons. Adaptation options can include elevation, cooling, drainage, materials, vegetation management, water efficiency and route diversity.
The World Bank's resilient-infrastructure work recommends robust decision-making under uncertainty [2][8]. The valuation should test a range of hazard paths and avoid dependence on one forecast.
Adaptation can alter operating costs and capacity. Heat can reduce equipment output; drought can constrain generation or water treatment; storms can damage networks and access roads.
23 Address national-security and foreign-investment controls
Critical assets may face ownership, governance, data, procurement and technology restrictions. A transaction can require foreign-investment approval, security agreements, local directors, ring-fencing or excluded information.
These controls can affect buyer universe, financing, integration synergies and exit value. The transaction timetable should include approval and remedy scenarios. Sensitive data should be managed through controlled diligence.
Valuation should reflect enforceable restrictions and approved mitigations. General assumptions about political preference are insufficient.
24 Conduct M&A diligence on resilience
The buyer should inspect asset condition, hazard studies, dependencies, incidents, insurance, continuity plans, cyber controls, spares, suppliers, regulatory obligations and recovery exercises. It should reconcile resilience capital in the forecast to identified risks and approved recovery.
The diligence team should sample a disruption from detection through response, customer communication, restoration, settlement and lessons learned. Repeated failures can reveal governance weakness.
Transaction protections may include remediation covenants, price adjustment, escrow, warranty, indemnity or insurance. Known capital needs should remain distinct from contingent liabilities.
25 Avoid a generic resilience premium
A standard valuation uplift for strategic or resilient assets lacks a causal basis. Buyers may pay for scarce licences, contracted revenue, regulatory protection, replacement difficulty or strategic control. Each driver should be identified.
Comparable transactions can reflect national-security scarcity, but they may also include control, synergy or policy support. The analyst should decompose observable terms and avoid transferring a headline multiple across sectors.
The valuation report should show the bridge from conventional value to each resilience adjustment.
26 Compare four illustrative strategies
Table 2. Illustrative resilience strategies and valuation effects
| Strategy | Upfront cost | Annual operating cost | Expected annual loss reduction | Recovery-time reduction | Illustrative value effect |
|---|---|---|---|---|---|
| Harden existing asset | 28m | 0.8m | 5.1m | 20% | 12m |
| Add independent route | 44m | 1.5m | 7.8m | 55% | 19m |
| Strategic spares and mutual aid | 12m | 1.1m | 3.4m | 65% | 16m |
| Diversified suppliers and modular design | 20m | 1.4m | 4.6m | 40% | 14m |
Values are hypothetical author-modelled assumptions and do not represent an asset forecast.
The comparison should include implementation risk and residual exposure. The independent route can have high value where it avoids common-mode failure. Strategic spares can be attractive where lead time drives recovery. Supplier diversification can preserve future access while increasing unit cost.
The selected portfolio may combine measures. Interactions should be modelled to avoid adding overlapping benefits.
27 Build a resilience scorecard
The scorecard should cover service criticality, hazard exposure, asset condition, dependency concentration, protective controls, detection, response, recovery, finance and governance. Scores should link to evidence, owners and actions.
Table 3. Investment-committee resilience scorecard
| Dimension | Evidence | Investment question | Possible condition |
|---|---|---|---|
| Essential service | Contract, licence, demand data | What minimum service must continue? | Define service threshold |
| Dependencies | Supplier and network map | Which failure stops the asset? | Qualify alternative |
| Recovery | Exercise and incident records | Can the target recovery time be achieved? | Close test findings |
| Revenue recovery | Regulator or contract | Who pays for resilience? | Approval before funding |
| Liquidity | Facility and cash model | Can the asset fund the event? | Minimum reserve |
| Governance | Board and incident records | Who decides during disruption? | Decision-rights protocol |
The scorecard is an author-developed governance template.
28 Establish decision rights
The board should approve risk appetite, essential-service thresholds, material resilience capital and retained tail risk. Management should own implementation, testing and reporting. Operational commanders need authority during incidents.
Government, regulator, concession authority, system operator and lenders may hold separate rights. The governance map should identify approvals, information and emergency directions. Conflicting instructions should have a resolution path.
After an incident, the organisation should preserve evidence, assess performance and update the risk model. Findings should influence capital allocation.
29 Implement through a 180-day programme
Days 1 to 30 should define essential service, asset perimeter, hazards and dependencies. Days 31 to 60 should build disruption scenarios, loss estimates and the initial option set. Days 61 to 90 should complete engineering, regulatory and financing analysis.
Days 91 to 120 should select the investment portfolio, secure approvals and update contracts. Days 121 to 150 should implement priority controls, test recovery and close critical gaps. Days 151 to 180 should approve the valuation adjustment, funding and continuing dashboard.
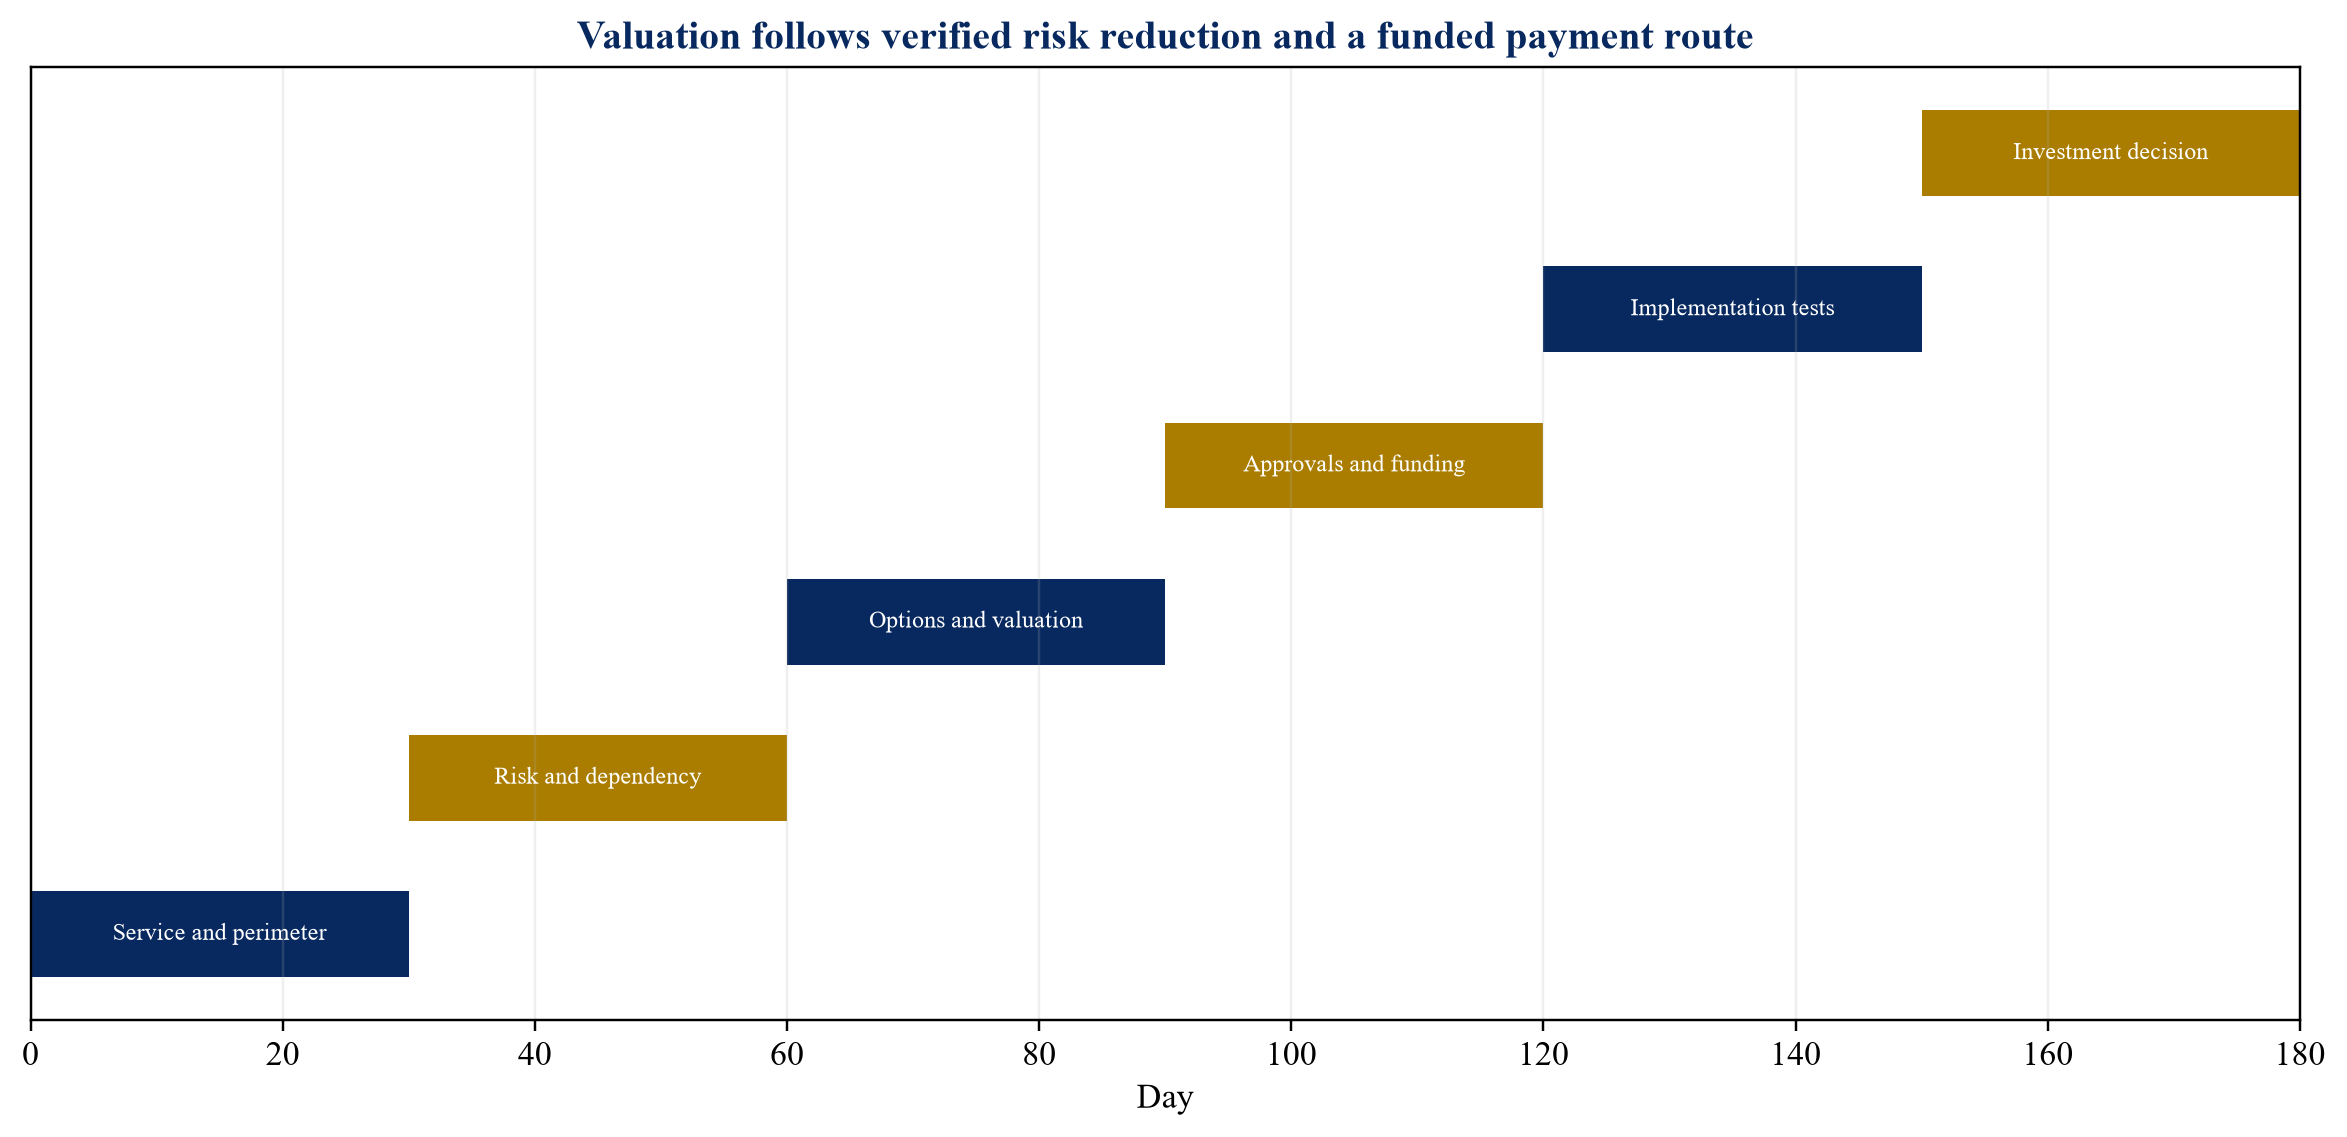
The roadmap is an author-developed implementation framework.
30 Monitor value after investment
The dashboard should track service availability, incidents, near misses, recovery time, supplier concentration, spare readiness, cyber tests, insurance, regulatory recovery, liquidity and resilience capital. Measures should connect to the assumptions used in valuation.
An investment can lose value if controls degrade, technology changes or dependencies shift. The board should review the scenario set at least annually and after material events.
Benefits should be reconciled carefully. An avoided outage cannot always be observed. Leading indicators, exercises and external events can support evidence, but management estimates should remain identified.
31 Value cyber-physical interdependency
Critical infrastructure increasingly combines physical equipment with operational technology, communications, cloud services and enterprise systems. A cyber event can interrupt physical service without damaging the asset. A physical event can disable communications and control. The scenario model should therefore connect cyber and engineering failure rather than treat them as separate risk registers.
The diligence team should identify the control architecture, remote access, identity controls, network segmentation, safety systems, manual operation and recovery dependencies. It should test whether an enterprise-system outage affects dispatch, billing or customer communication while the physical asset continues to operate. It should also test whether a loss of telemetry prevents safe operation.
Value can arise from independent safety layers, manual fallback, tested backups and alternate communications. The value channel may include shorter outage, lower remediation cost, continued billing or reduced regulatory exposure. The investment case should state which consequence changes and how it was tested.
Technology obsolescence requires continuing expenditure. A valuation should include refresh, licensing, specialist staff and supplier support. Capitalising a one-time cyber programme while omitting continuing operation overstates value.
32 Price sovereignty constraints in technology and data
Strategic autonomy can concern software, data, cryptographic keys, equipment firmware and technical support. An asset may be physically domestic while depending on remote administration or proprietary components controlled elsewhere. The dependency map should identify operational control, legal jurisdiction, data location, update authority and termination rights.
The commercial response can include source-code escrow, local key control, data-residency arrangements, multi-cloud architecture, open standards, replacement rights and a transition plan. Each measure has cost and limitations. Escrow has limited value when the owner lacks people and documentation to operate the code. Multi-cloud design can increase complexity without creating real portability.
Transaction diligence should verify contractual access and technical feasibility. A management statement that a platform can be migrated is an estimate until an architecture assessment or exercise supports it. The model should include transition cost, service interruption and dual-running expenditure.
Sovereignty restrictions can narrow suppliers and increase procurement cost. The valuation should compare that premium with evidenced continuity, regulatory and control benefits.
33 Integrate resilience into procurement
Procurement can create or reduce dependency over the full asset life. Evaluation should consider lifecycle support, financial capacity, manufacturing concentration, sub-tier suppliers, lead time, interoperability, cyber obligations, spare availability and exit. Lowest initial price can carry high recovery and lock-in cost.
The contract should require notification of material supply-chain changes, vulnerabilities and end-of-life decisions. It should define access to spares, technical information, testing, audit and transition assistance. Long-term framework agreements or priority-access arrangements can improve security when capacity is scarce.
Local-content or diversification requirements should be specific. They can support capability and reduce dependency, while also increasing cost or limiting competition. The investment paper should quantify the requirement, price premium, ramp-up risk and residual imports. It should distinguish enacted obligations from proposed policy.
Procurement governance should prevent security claims from bypassing competition and value-for-money controls. Exceptions need documented authority, duration and review.
34 Apply the framework to digital and AI infrastructure
Data centres and AI infrastructure depend on firm power, grid connection, backup generation, cooling water or air systems, fibre, semiconductors, network equipment, software and skilled operation. Concentrated campuses can create large service and power-system consequences. Resilience analysis should model dependencies across utility, site and technology layers.
Redundant power feeds have value only when routes and upstream substations are sufficiently independent. Backup generation requires fuel, testing, permits and maintenance. Water constraints can affect cooling during heat or drought. Semiconductor and accelerator replacement can face long lead times, export controls and rapid obsolescence.
Valuation should connect resilience to service-level agreements, customer churn, credits, contracted capacity and financing. A facility serving critical government or financial workloads may have public value beyond rent. That value enters enterprise cash flow only through contracts, approved support or pricing.
M&A diligence should examine customer concentration, power rights, equipment ownership, cloud dependencies, cyber controls and the cost of maintaining redundancy during expansion.
35 Apply the framework to water infrastructure
Water and wastewater assets depend on electricity, chemicals, pumps, controls, laboratories, transport and skilled operators. Drought, flood, contamination, cyber events and equipment failure can affect public health and economic activity. Minimum service and water-quality obligations should anchor the scenario model.
Resilience measures can include dual power, storage, interconnection, alternative sources, spare pumps, chemical inventories, flood protection and manual control. Some measures reduce both operational loss and emergency public expenditure. Tariff recovery and affordability remain central.
The valuation should model demand, leakage, energy use, emergency procurement, penalties, repair and liquidity. A reservoir or storage asset can create option value across scenarios, but environmental and permitting constraints affect its usable capacity.
Transaction teams should verify asset condition, compliance, drought plans, chemical supply, power arrangements and capital-program approval. Public-health consequences require controlled information and specialist review.
36 Apply the framework to transport and logistics corridors
Ports, rail, roads, airports and logistics hubs operate as networks. A single bridge, channel, control system or intermodal connection can constrain the corridor. The dependency map should identify bottlenecks, alternate routes, customs, power, fuel, communications and equipment.
Resilience value can arise from route diversity, capacity buffers, elevated assets, spare handling equipment, digital recovery, mutual aid and pre-arranged alternate terminals. An alternate route can be slower or more expensive while still preserving essential flow.
The cash-flow model should include lost throughput, demurrage, penalties, customer diversion, repair and recovery of market share. Public economic loss can exceed operator revenue where trade and industrial supply chains depend on the corridor.
Concession terms should define force majeure, availability, restoration and capital recovery. An acquisition model should assess whether resilience obligations are funded and whether expansion creates new bottlenecks elsewhere in the network.
37 Model geopolitical and trade disruption
Geopolitical risk can affect commodity supply, equipment, shipping routes, sanctions, export controls, financing, insurance and technology access. The scenario should identify the legal and commercial mechanism rather than apply a general geopolitical premium.
Relevant variables include route closure, tariff, licence delay, supplier withdrawal, currency movement, insurance exclusion and replacement lead time. The model should test duration and substitution. A short disruption can be covered by inventory; a long restriction can require redesign or new capacity.
Diversification should be evaluated for effectiveness. Suppliers in different countries can share sub-tier inputs or shipping routes. Domestic production can rely on imported equipment. The analysis should trace the dependency far enough to identify common exposure.
Board decisions can include stockpiles, long-term contracts, equity investment, joint ventures, recycling, redesign or demand prioritisation. The cost should be compared with avoided loss and strategic public benefit.
38 Reconcile resilience value after an incident
An incident provides evidence that should update valuation. The organisation should compare scenario assumptions with actual detection, service loss, response, recovery, cost, insurance and customer effects. It should identify which controls worked, which dependencies emerged and which data were missing.
The post-incident model should distinguish permanent impairment from temporary cash loss. Damage, regulatory action, customer departure, higher insurance, capital acceleration and financing changes can affect value. Recovery investment can create future benefit if it addresses the evidenced failure pathway.
Management should update probability ranges carefully. One event does not necessarily establish a stable frequency. External evidence and engineering judgement remain relevant. The board should approve material changes to risk appetite, capital plan and liquidity.
Transaction documents may allocate incident costs through warranties, covenants or insurance. Events between signing and closing require clear notification and material-adverse-change analysis under the agreed terms.
39 Recognise limitations
The framework does not determine national-security classification, foreign-investment approval, regulatory recovery, insurance coverage or engineering adequacy in a specific jurisdiction. Those matters require current official decisions and specialist analysis.
Probability estimates for severe events can be uncertain. Scenario ranges and robust decisions are preferable to false precision. Public economic value should remain separate from investor cash flow until a payment mechanism is approved.
Security information can be sensitive. Reports should balance investment evidence with access control and legal obligations.
Conclusion
Infrastructure resilience and strategic autonomy have economic value when they preserve an essential service, reduce disruption loss, shorten recovery or protect access to critical inputs. That value should be traced through explicit scenarios, contracts, regulation, insurance, financing and public support.
The method begins with service and dependency, measures risk, compares interventions and identifies who pays. It supports capital allocation, regulated submissions, project finance and M&A diligence without relying on an unsupported resilience premium.
The decisive test is whether a proposed measure changes an evidenced failure pathway and whether the resulting benefit reaches the asset owner or approved public decision. This discipline converts security from a broad policy objective into a financeable investment case.
References
- European Union, Directive (EU) 2022/2557 on the resilience of critical entities. https://eur-lex.europa.eu/eli/dir/2022/2557/oj/eng
- World Bank, Lifelines: The Resilient Infrastructure Opportunity, 2019. https://www.worldbank.org/en/news/feature/2019/06/19/lifelines-the-resilient-infrastructure-opportunity
- European Commission, European Economic Security Strategy, 2023. https://commission.europa.eu/strategy-and-policy/priorities-2019-2024/stronger-europe-world/european-economic-security_en
- International Energy Agency, World Energy Outlook 2025. https://www.iea.org/reports/world-energy-outlook-2025
- International Energy Agency, Critical Minerals Security Programme. https://www.iea.org/programmes/critical-minerals-security-programme
- Cybersecurity and Infrastructure Security Agency, National Infrastructure Resilience Planning Framework. https://www.cisa.gov/resources-tools/resources/national-infrastructure-resilience-planning-framework
- National Institute of Standards and Technology, Cybersecurity Framework 2.0, 2024. https://www.nist.gov/cyberframework
- World Bank, Strengthening New Infrastructure Assets: A Cost-Benefit Analysis, 2019. https://documents.worldbank.org/en/publication/documents-reports/documentdetail/962751560793977276/strengthening-new-infrastructure-assets-a-cost-benefit-analysis
- OECD, Good Governance for Critical Infrastructure Resilience, 2019. https://www.oecd.org/en/publications/good-governance-for-critical-infrastructure-resilience_02f0e5a0-en.html
- OECD, Recommendation on the Governance of Critical Risks, 2014. https://legalinstruments.oecd.org/en/instruments/OECD-LEGAL-0405
- International Energy Agency, Energy System Resilience, 2025. https://www.iea.org/reports/energy-system-resilience
- International Energy Agency, Electricity Grids and Secure Energy Transitions, 2023. https://www.iea.org/reports/electricity-grids-and-secure-energy-transitions
- International Energy Agency, Building the Future Transmission Grid, 2025. https://www.iea.org/reports/building-the-future-transmission-grid
- International Energy Agency, World Energy Investment 2026. https://www.iea.org/reports/world-energy-investment-2026
- International Energy Agency, Global Critical Minerals Outlook 2026. https://www.iea.org/reports/global-critical-minerals-outlook-2026
- European Commission, Critical Infrastructure Resilience. https://home-affairs.ec.europa.eu/policies/internal-security/counter-terrorism-and-radicalisation/protection/critical-infrastructure-resilience_en
- European Commission, NIS2 Directive. https://digital-strategy.ec.europa.eu/en/policies/nis2-directive
- European Union, Regulation (EU) 2024/1252 establishing a framework for a secure and sustainable supply of critical raw materials. https://eur-lex.europa.eu/eli/reg/2024/1252/oj
- European Commission, Critical Raw Materials Act. https://single-market-economy.ec.europa.eu/sectors/raw-materials/areas-specific-interest/critical-raw-materials/critical-raw-materials-act_en
- European Investment Bank, Climate Resilience. https://www.eib.org/en/projects/sectors/climate-action/climate-resilience/index.htm
- World Bank, Resilient Infrastructure Public-Private Partnerships. https://ppp.worldbank.org/public-private-partnership/resilient-infrastructure-ppps
- World Bank, Climate and Disaster Resilient Transport. https://www.worldbank.org/en/topic/transport/brief/climate-resilient-transport
- United Nations Office for Disaster Risk Reduction, Principles for Resilient Infrastructure, 2022. https://www.undrr.org/publication/principles-resilient-infrastructure
- Coalition for Disaster Resilient Infrastructure, Global Infrastructure Resilience Report. https://www.cdri.world/gir
- US Department of Homeland Security, National Infrastructure Protection Plan. https://www.cisa.gov/topics/critical-infrastructure-security-and-resilience/national-infrastructure-protection-plan-and-resources
- UK Government, National Infrastructure Resilience. https://www.gov.uk/government/publications/national-infrastructure-resilience
- UK National Protective Security Authority, Critical National Infrastructure. https://www.npsa.gov.uk/critical-national-infrastructure-0
- Australian Government, Critical Infrastructure Resilience Strategy. https://www.cisc.gov.au/resources-subsite/Documents/critical-infrastructure-resilience-strategy-2023.pdf
- International Monetary Fund, Public Investment Management Assessment. https://infrastructuregovern.imf.org/content/PIMA/Home/PimaTool.html
- G20, Principles for Quality Infrastructure Investment, 2019. https://www.mof.go.jp/english/policy/international_policy/convention/g20/annex6_1.pdf
About the Author
Authored by Chennakeshav Adya Independent Researcher
Chennakeshav (CK) is a corporate finance and investment banking executive with 25+ years of global experience in deal origination, structuring and execution across M&A, growth capital and corporate strategy. He has led value-creation mandates for founders, corporates and funds — bridging the boardroom view to hands-on execution and close.
His career spans Morgan Stanley, HSBC, Lloyds Banking Group, EWEC, ADQ portfolio companies and Emirates Growth Fund, across TMT, real estate, fintech, deeptech, cleantech, infrastructure and energy. He has partnered with C-suite leaders, private equity and venture funds, sovereign wealth funds and family offices to finance complex fund raises and scale-up ventures, and has led M&A due diligence, post-merger integration and business-transformation initiatives to create value.
At Matchpoint Partners he is Managing Partner, leading the firm's corporate finance, M&A and capital-raising practice. He holds an MBA from London Business School, an engineering degree from VTU and a Master of Laws (LLM, in progress) from UCL London.
An active start-up mentor, CK mentors at Techstars, DIFC FinTech Hive, Startup Grind, Founder Institute and IN5, serves as Entrepreneur Mentor in Residence (EMiR) at London Business School, and judges the Entrepreneurship World Cup.
LinkedIn: https://www.linkedin.com/in/ckadya/ Matchpoint Partners: https://www.matchpoint-partners.com/team/ck-adya.html
This paper is part of a continuing series on the structure of private and alternative markets. The views expressed are the author's own. The paper is for information only, describes market structure in general terms, and does not constitute investment, legal, tax or regulatory advice or a recommendation in respect of any security, vehicle or counterparty.
