

1. Industrial storage begins with the protected process
An industrial microgrid exists to keep specified operations within an acceptable state when the wider grid fails or becomes constrained. The protected process may be a continuous production line, cold store, data hall, water treatment plant, mine, port, refinery, pharmaceutical facility or a cluster of essential utilities. Each process has a different interruption sequence and recovery cost.
Battery selection therefore begins with the load that must remain energised, the duration for which it must operate, the acceptable transfer time and the sequence in which loads can be shed or restored. A battery priced before that service is defined can be too short, too large or unable to deliver the required energy after normal commercial dispatch.
The procurement question is the cost of dependable service across the asset life. Nameplate energy, catalogue efficiency and headline capital cost are inputs to that question.
2. Hours convert power into a service
Power capacity determines how much instantaneous load a battery can serve. Energy capacity determines how long that service can continue. A 10 MW battery with 20 MWh of usable energy can nominally discharge for two hours at full power. A 10 MW battery with 100 MWh can nominally discharge for ten hours.
Actual duration depends on state of charge, auxiliary consumption, inverter limits, temperature, degradation, operating reserve and the discharge profile. An industrial microgrid may also require black start, motor starting, reactive power and short bursts above the steady critical load.
The buyer should specify usable energy at the agreed delivery point and under the operating conditions that govern the site. This avoids treating cell or electrolyte capacity as equivalent to energy available to the protected process.
3. Flow batteries separate power and energy equipment
In a redox flow battery, electroactive material is stored in external tanks and circulated through electrochemical stacks. The stacks and associated power electronics influence power capability. The electrolyte volume and concentration influence energy capacity. This physical separation allows additional duration to be added principally through tanks and electrolyte, subject to site and hydraulic constraints.
Lithium-ion systems add energy by adding integrated cell modules that carry both power and energy capability. That architecture has strong manufacturing scale and compactness. It can also make a long-duration configuration pay repeatedly for power capability that the service does not need.
The economic crossover depends on project-specific prices and performance. A buyer should request separate quotations for power block, energy block, balance of plant, civil works, controls, connection, commissioning and lifecycle support.
4. Chemistry names do not establish project performance
Flow batteries include vanadium, iron, zinc-bromine, organic and other chemistries. They differ in electrolyte cost, corrosivity, toxicity, temperature range, membrane requirements, plating behaviour, energy density, stack design, supply chain and commercial maturity.
Published category-level statements should not replace product evidence. A project requires test data for the offered system, operating references at relevant scale, degradation methodology, maintenance history, warranty conditions and the vendor's capacity to support the asset.
The buyer should identify which hazards arise from the electrolyte, which arise from electrical equipment and which arise from mechanical systems. Spill containment, ventilation, materials compatibility, pump redundancy and end-of-life management can remain material even when an electrolyte is not flammable.
5. Cost per kilowatt-hour can conceal the service delivered
Installed cost per kilowatt-hour divides project cost by nominal energy capacity. It does not show how much energy is usable, how often the system can cycle, how much energy returns after losses, when replacement occurs or whether the system is available during an outage.
A more useful denominator is discounted dependable energy delivered to the protected load. Another is annual cost per reserved service-hour. Both measures require assumptions about cycling, efficiency, availability, degradation and life.
An eight-hour system used only for rare outages can have a high observed cost per delivered kilowatt-hour because throughput is low. Its value may still be justified by avoided production loss or safety consequences. The valuation should show resilience value separately from ordinary energy-market savings.
6. The industrial outage curve is non-linear
An interruption can create little loss in its first minutes when uninterruptible power supplies bridge the event. Loss rises when production stops, materials spoil, furnaces cool, pumps fail, safety systems transfer or a controlled shutdown becomes impossible. Recovery can cost more than the lost energy.
Outage value should therefore be modelled as a sequence. The model should identify protected loads, time to safe shutdown, minimum restart energy, lost gross margin, scrap, labour, contractual penalties and recovery time. It should exclude unsupported estimates from debt sizing or investment approval.
The battery's marginal value can rise sharply at the duration that avoids a destructive process transition. Extra hours beyond the safe-shutdown and restart requirement may then have lower incremental value unless they support other services.
7. Duration should follow an outage distribution
The buyer should analyse the frequency and duration of grid interruptions, planned curtailments, local network constraints and fuel-supply risk. Historical events provide evidence, though climate, load growth and network configuration can change the future distribution.
A design based only on the single longest event can be inefficient. A design based on the average event can fail during consequential tails. The decision should compare percentiles and event sequences, including repeated outages before full recharge.
The operating strategy should reserve energy when risk is elevated. Weather, network notices or site conditions can trigger a higher minimum state of charge. The cost of preserving that reserve belongs in the economic model because it reduces energy-trading freedom.
8. Long duration changes the economic comparison
Flow batteries can become more competitive as duration rises because energy capacity can be expanded without proportionally expanding stacks and inverters. The crossover is neither fixed nor universal. Lithium-ion equipment cost, flow-battery electrolyte cost, civil works, land, efficiency and financing all affect it.
DOE's 2023 flow-battery technology assessment used a reference 100 MW, ten-hour vanadium system and published projected cost, life and efficiency parameters. The report also identified significant cost-reduction needs and development priorities. These are programme inputs, not vendor quotations.
A buyer should compare two, four, eight, ten, twelve and longer-hour configurations using the same usable-energy boundary and availability requirement. The preferred duration is the point at which incremental protected-service value exceeds incremental whole-life cost.
9. Cycle life has value only when the site uses it
DOE's technology assessment referenced 10,000 electrolyte cycles for its modelled flow-battery case. IRENA has also described flow batteries as capable of deep discharge and long cycle life. Real project performance depends on chemistry, stack, operating conditions and maintenance.
High cycle life creates value when a microgrid cycles frequently for energy management, renewable firming or grid services. A system reserved mainly for rare outages may not consume enough cycles for that advantage to dominate.
The economic model should convert warranty terms into expected annual throughput and replacement exposure. A cycle warranty that excludes key operating modes, temperature bands or state-of-charge behaviour can provide less protection than its headline number suggests.
10. Efficiency and charging price remain material
Flow batteries often have lower round-trip efficiency than current lithium-ion systems. DOE's 2023 assessment used a 65 percent reference round-trip efficiency for a ten-hour vanadium system. Actual products and operating points vary.
Lower efficiency increases charging energy and can reduce arbitrage savings. Its financial effect depends on the charging price, renewable curtailment, demand charges, grid fees and carbon treatment. Charging from otherwise curtailed on-site renewable generation can reduce the cash cost of losses, though the energy still has opportunity value.
The model should apply hourly charging prices, auxiliary load and partial-load performance. A single annual average can miss costly charging during stressed grid periods or overstate access to surplus renewable energy.
11. Energy density is a site constraint
Flow-battery tanks and hydraulic equipment require space. Industrial sites can face high land values, restricted setbacks, existing underground services, hazardous-area classifications and limited construction access. A compact lithium-ion system may retain a material siting advantage.
The layout study should include tanks, stacks, pumps, pipework, secondary containment, ventilation, power conversion, transformers, fire access, maintenance clearance and future expansion. It should identify whether the energy block can occupy lower-value land or a remote part of the site.
Land cost should enter the comparison as an actual opportunity cost. The model should also capture the value of avoiding production disruption during construction and maintenance.
12. Safety comparison requires chemistry-specific evidence
Sandia has reported that flow-battery electrolytes are generally not flammable and that flow systems do not present the same fire or explosion profile as lithium-ion systems. The same analysis identifies chemical, spill, corrosion, electrical and environmental hazards that require control.
UL 9540, UL 9540A, NFPA 855 and local codes can affect system certification, fire testing, layout and installation in North America. Other jurisdictions apply their own standards. The authority having jurisdiction determines the applicable path.
A buyer should request the certification basis, test reports, hazard analysis, material safety data, emergency-response plan and installation assumptions. A lower propensity for thermal runaway does not remove the need for electrical protection, containment, ventilation, detection and trained response.
13. Pumps and balance of plant influence availability
Flow batteries rely on pumps, valves, sensors, seals, controls and piping. These components can create maintenance requirements and parasitic load. Redundancy can improve availability while increasing cost and complexity.
The vendor should provide a failure-modes analysis, pump duty, expected replacement intervals, spare-parts strategy and access arrangements. The operating model should distinguish planned stack maintenance from failures that reduce the full system's power or energy capability.
Availability guarantees should identify excluded events and measurement boundaries. A guarantee measured only at stack level can miss balance-of-plant losses that matter to the industrial process.
14. Stack life and electrolyte life should be priced separately
The electrolyte can retain material value beyond the life of a stack, depending on chemistry, contamination, ownership and recovery arrangements. Stacks, membranes, electrodes and pumps can require refurbishment or replacement on different schedules.
Separating these components clarifies residual value and lifecycle expenditure. The buyer should confirm title to electrolyte, liens, return obligations, repurchase terms, transport requirements and end-of-life responsibilities.
A service contract can smooth replacement cost, though it transfers vendor credit risk into later years. A funded lifecycle reserve provides another control. The model should avoid treating a repurchase promise as cash unless its legal terms and counterparty capacity are supportable.
15. Critical-load segmentation avoids oversizing
Industrial sites often classify all connected load as critical even when some equipment can stop, shed, ramp or transfer to another source. A process-level load map can reduce battery size and improve resilience.
The map should distinguish life safety, control systems, rotating equipment, process heat, cooling, communications, environmental controls, restart loads and discretionary production. It should state maximum interruption, minimum run time and restoration sequence for each group.
A smaller protected island with staged restart may provide more dependable service than a battery sized to the full site. The microgrid controller must execute the segmentation under abnormal conditions and retain a tested manual fallback.
16. Diesel and gas generation remain comparison cases
Many industrial sites use diesel or gas generation for extended backup. Fuel-based generation can offer long duration when fuel supply is secure, though it introduces emissions, noise, maintenance, start reliability and fuel-logistics risk.
Storage can bridge generator start, reduce fuel consumption, support black start and carry sensitive loads. A hybrid may therefore outperform a battery-only design when multi-day autonomy is required.
The comparison should include fuel inventory, delivery disruption, minimum loading, start failure, maintenance, emissions cost and local restrictions. It should also test whether renewable generation can recharge the battery during an extended grid outage.
17. Hybrid storage can assign services by response time
A lithium-ion battery can provide compact high-power response while a flow battery supplies longer-duration energy. A generator or thermal store can cover another part of the outage. The controller assigns each service to the asset suited to it.
Hybridisation creates interfaces and dispatch complexity. It can also reduce replacement cost by protecting one technology from a duty cycle that accelerates wear.
The buyer should compare the integrated system with a single-technology solution on the same service basis. Controls, communication, protection coordination and common-mode failure require explicit testing.
18. Microgrid controls create the service
The battery cannot protect an industrial process without sensing, protection, communications and dispatch logic. The controller must separate from the grid, balance generation and load, preserve state of charge, shed non-critical load and resynchronise safely.
Control performance should be tested against normal and abnormal scenarios. Cybersecurity, time synchronisation, communication loss and manual operation matter because a grid event can coincide with network or control-system disruption.
The commercial contract should allocate responsibility for controller integration. A battery supplier, microgrid integrator and site automation contractor can each meet its own specification while the combined system fails an end-to-end test.
19. The service specification should be technology neutral
A good request for proposals defines power, usable energy, response, islanding, black start, efficiency, availability, cycling, environmental conditions, safety evidence, test protocol and service life. It allows vendors to explain how their technology meets those requirements.
Technology-neutral procurement improves comparison, though it should not ignore maturity or site constraints. The buyer can set minimum operational evidence, credit support and warranty requirements.
Bid evaluation should normalise boundaries. Vendor prices may include different scopes for civil works, transformers, controls, interconnection, augmentation, replacement, taxes and decommissioning.
Table 1. Technology-selection questions for an industrial microgrid
| Decision factor | Flow-battery question | Lithium-ion or alternative question | Evidence required |
|---|---|---|---|
| Required duration | Can tanks and electrolyte deliver usable energy at the agreed point after auxiliary load? | How many integrated modules and augmentations are required? | Guaranteed discharge curve and acceptance test |
| Annual cycling | Do stack, membrane and pump warranties cover the proposed throughput? | Do cell degradation and replacement assumptions cover the duty cycle? | Duty-cycle model and warranty schedule |
| Site and layout | Are tanks, containment, pipework and access compatible with the site? | Are separation, enclosure and fire-protection requirements compatible? | Issued layout and code review |
| Efficiency | How do pumping and conversion losses vary with load? | How do inverter and cell losses vary with state of charge and temperature? | Tested efficiency map |
| Safety | What chemical, spill, corrosion, electrical and fire controls apply? | What thermal-runaway, vent-gas, fire and electrical controls apply? | Certification, hazard analysis and emergency plan |
| Lifecycle | Which stacks, pumps or membranes require replacement, and who owns electrolyte value? | What augmentation and module replacement are required? | Lifecycle schedule, reserve and residual-value terms |
| Bankability | Does the vendor have operating references, warranty support and service capacity? | Does the vendor have operating references, warranty support and service capacity? | Reference data, financial review and security package |
The table describes general decision criteria. Product and project evidence determine the actual result.
20. Lifecycle cost needs consistent boundaries
Lifecycle cost should include development, equipment, civil works, interconnection, controls, financing, charging energy, operations, maintenance, insurance, replacement, augmentation, taxes and decommissioning. Residual value should be included only when supported.
The calculation should discount costs and delivered service on the same basis. Inflation and currency assumptions should align with the contracts that create them.
Comparing one bid with lifecycle support against another bid that excludes replacement produces a false ranking. The procurement model should provide a common template and reconcile every vendor deviation.
21. Levelized cost of storage has limits behind the meter
DOE's storage-cost assessments use levelized cost of storage to compare technologies across capital, operating, charging, replacement and financing assumptions. The metric is useful when services and throughput are comparable.
An industrial microgrid has a second value stream: avoided interruption. That value can dominate energy-market savings and is not captured by a generic LCOS. The project should therefore report LCOS, annualised resilience cost and total site value separately.
The investment committee should see which part of the case depends on market savings and which part depends on management estimates of outage loss. Unsupported outage estimates should remain labelled and sensitised.
22. Reliability evidence should include field operation
Laboratory tests establish important performance boundaries. Field operation reveals integration, maintenance, controls, supply-chain and human factors. DOE's Rapid Operational Validation Initiative seeks to shorten the path from emerging storage technology to commercial deployment through standardised testing and data.
A buyer should request operating hours, energy throughput, availability, forced outages, efficiency, maintenance and corrective actions from comparable systems. Data should cover climate and duty conditions relevant to the proposed site.
Where evidence remains limited, deployment can be staged. A pilot, modular first phase, performance holdback or vendor-backed capacity reserve can reduce exposure while preserving an expansion path.
23. Warranty architecture should follow the service
A product warranty can cover equipment defects while leaving the buyer exposed to insufficient usable energy or availability. A service warranty should connect power, energy, efficiency and availability to the protected-load requirement.
The agreement should define measurement, ambient conditions, planned maintenance, response time, excluded events and remedies. Liquidated damages should reflect a reasonable estimate of loss and remain within enforceable limits.
Warranty value depends on the warrantor's ability to perform years later. Parent support, escrow, insurance, letters of credit or funded reserves can strengthen the remedy.
24. Availability should be measured during risk windows
Annual availability can look high even when the system is unavailable during a seasonal production peak or grid-stress period. The service specification should identify critical windows and apply stronger measurement or penalties there.
The battery may also reserve energy during high-risk periods, reducing ordinary savings. That opportunity cost should be visible in dispatch and valuation.
A planned maintenance allowance should reflect industrial shutdown schedules. Maintenance coordinated with site outages can reduce lost service, though the contract should preserve emergency capability where required.
25. The hypothetical industrial microgrid
This paper uses a hypothetical industrial site with a 20 MW critical-load island, 12 MW of on-site solar generation and an existing 8 MW generator. The case does not describe an actual facility, proposal, market forecast or investment opportunity. All costs, values, prices and operating assumptions are illustrative.
The analysis compares a 20 MW, 40 MWh lithium-ion system, a 10 MW, 100 MWh flow-battery system and a hybrid with 10 MW, 20 MWh of lithium-ion plus 10 MW, 80 MWh of flow storage. The generator supports longer events after the battery establishes the island and manages load transitions.
The service target is ten hours for priority loads after planned shedding, with energy reserved during elevated outage risk.
Table 2. Hypothetical industrial-microgrid comparison
| Item | Lithium-ion case | Flow-battery case | Hybrid case |
|---|---|---|---|
| Power and usable energy | 20 MW and 40 MWh | 10 MW and 100 MWh | 10 MW and 20 MWh plus 10 MW and 80 MWh |
| Initial installed cost | USD 24 million | USD 42 million | USD 43 million |
| Modelled round-trip efficiency | 88 percent | 68 percent | 78 percent blended |
| Major lifecycle work | USD 10 million augmentation and replacement | USD 7 million stack, pump and membrane work | USD 8 million across both systems |
| Modelled service life | 15 years | 25 years | 25 years |
| Reserved outage service | Two hours at 20 MW before generator dependence | Ten hours at 10 MW before generator dependence | Two hours at 20 MW then six additional hours at 10 MW |
| Annual energy and demand savings | USD 3.6 million | USD 2.8 million | USD 3.4 million |
| Annualised expected interruption benefit | USD 2.0 million | USD 4.8 million | USD 5.2 million |
| Principal weakness in this case | Duration and replacement exposure | Initial cost, efficiency and site footprint | Integration complexity and two technology interfaces |
Every value is a modelling assumption. The table is not a vendor quote, forecast or investment recommendation.
26. The hypothetical case uses expected value carefully
Expected interruption benefit multiplies event probability by avoided loss in each event band. It should not be interpreted as cash received every year. The value may justify investment, yet it cannot service debt without a contracted payment or sufficient site cash flow.
Management estimates of lost production should be reconciled to operating records, insurance claims and finance data. Safety, environmental and customer impacts can be difficult to monetise and should be presented separately when evidence is incomplete.
The decision model should show expected value, severe-event value and ordinary annual cash savings. Combining them into one revenue line can obscure uncertainty.
27. Duration can produce a value step
In the hypothetical case, two hours bridge short interruptions and generator start. Additional hours reduce exposure to generator failure, fuel constraints and repeated events. Value rises sharply around the duration needed to complete a controlled production shutdown and preserve restart energy.
Beyond that step, each extra hour serves a smaller set of events. Its value can still be material where grid outages are long, renewable output is available or fuel delivery is unreliable.
The duration decision should therefore use marginal analysis. The model adds one hour at a time and compares incremental cost with incremental protected-service value.
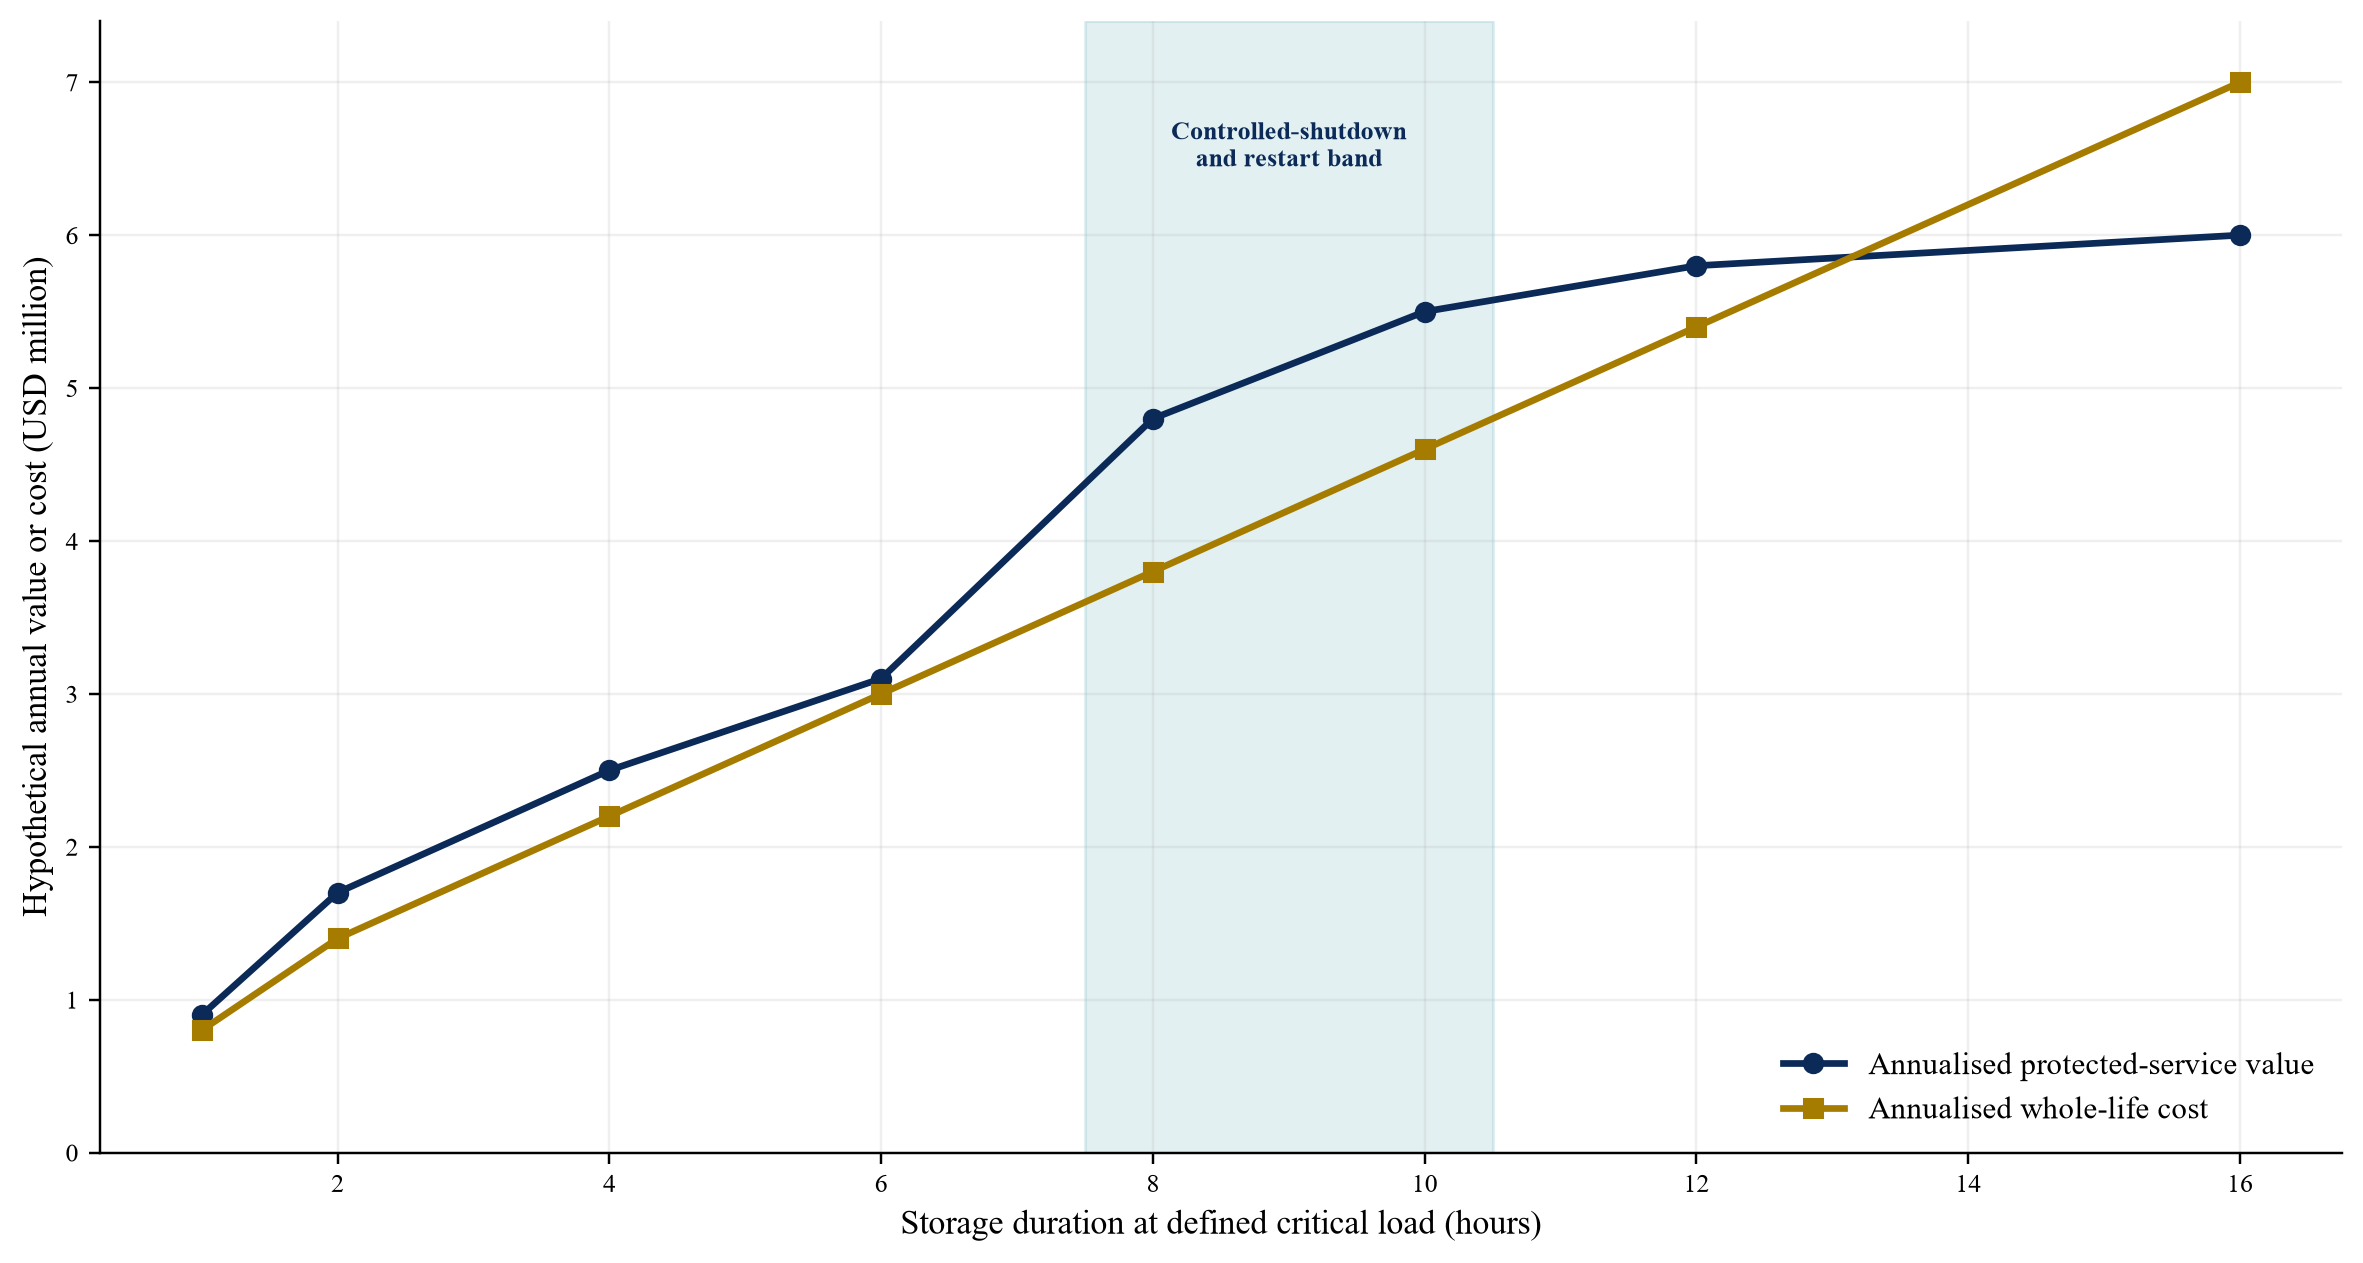
Values are illustrative and show a service-value step around the site's controlled-shutdown requirement.
28. Dispatch must preserve the outage service
Daily energy management can reduce demand charges and buy power at lower-cost times. It can also leave the battery depleted when an outage begins. The controller needs a state-of-charge policy that reflects event probability and recharge time.
A static reserve can be simple and conservative. A forecast-based reserve can release more commercial value but relies on weather, grid and load forecasts. The buyer should test forecast error and communication failure.
Contracted grid services should not consume the same energy reserved for site resilience unless the dispatch hierarchy permits it. The rights and priority map belongs in the operating agreement.
29. Tariff savings require interval data
Demand-charge reduction depends on the tariff window, site peak shape, coincident system peak and battery availability. Energy arbitrage depends on interval prices, losses and charging constraints. Renewable firming depends on generation and load coincidence.
At least one year of interval data should support the model, with adjustments for planned production changes. More years improve analysis of weather and outage variability.
The dispatch model should include controller limits and reserved energy. Perfect hindsight can overstate savings by assuming the battery always identifies the future peak.
30. Carbon value should follow an accounting rule
Storage shifts electricity through time and loses some energy in the process. Its emissions effect depends on the marginal generation used for charging and displaced during discharge. Charging from on-site renewable energy can have a different result from charging during a fossil-intensive grid period.
The project should state whether it uses location-based, market-based or marginal emissions accounting and how renewable attributes are treated. Carbon credits or internal carbon prices should remain separate from cash unless legally realisable.
Avoided generator fuel and emissions can support the case when the battery reduces routine testing or operation. Emergency use should remain consistent with permit and resilience requirements.
31. Financing should follow contracted cash and site credit
Behind-the-meter storage can be financed by the industrial owner, a project company, an energy-service provider or an equipment lessor. The financing route determines who takes technology, dispatch, tariff and site-credit risk.
Debt supported by site cash flow depends on the industrial company's credit and the enforceability of payment. Project finance requires contracted revenue, performance remedies, step-in rights and a separable asset or service.
Expected outage avoidance is economically relevant but generally does not create a receivable. Lenders may recognise it indirectly through the host's willingness and ability to pay under a long-term service contract.
32. An energy service agreement can align payment
An energy service agreement can charge a fixed availability fee, a measured savings share, a dispatch payment or a combination. The fixed fee can support capital recovery when the system meets power, energy and availability requirements.
A savings share requires a credible baseline and adjustment for production changes, tariffs and weather. A resilience payment should define reserved capability and testing. The agreement should state which party controls dispatch and bears charging cost.
Termination payment, site access, asset removal, change in law and host default determine financeability. The contract should also address what happens when the host changes its critical-load profile.
33. Procurement should retain competitive tension
The buyer can issue a technology-neutral request followed by a shortlisting stage that tests reference evidence and site fit. Detailed design effort is expensive, so the process should define data access, bidder assumptions and evaluation criteria.
Bid comparison should use a common lifecycle model. Sensitivities should test efficiency, availability, replacement, charging price, outage frequency and residual value.
A final offer should include a binding technical schedule, guaranteed performance, construction programme, lifecycle plan and commercial deviations. Marketing material should not control the contract.
34. Completion tests should replicate the service
Mechanical completion does not prove microgrid performance. Acceptance should demonstrate power, usable energy, efficiency, islanding, black start where required, load shedding, restart sequence, protection, controls and resynchronisation.
A long-duration discharge test should use the contractual measurement point and ambient conditions. Where a full test would disrupt production, the parties need an agreed alternative supported by commissioning data.
The test should identify cure, retest, damages and rejection rights. Independent witnessing can reduce disputes and support financing.
35. Operating data should support continuous valuation
The operating dashboard should report state of charge, power, energy, efficiency, auxiliary consumption, availability, forced outages, pump performance, stack condition, alarms and maintenance. It should also record avoided peaks and outage service.
Data ownership and access should survive vendor distress. The owner needs raw data, interfaces and documentation sufficient to operate or replace components.
Performance trends should update the lifecycle model. Earlier stack work, rising auxiliary load or falling efficiency can change reserve needs and dispatch economics.
36. Supply-chain diligence extends beyond active material
Vanadium, iron, bromine, membranes, pumps, power electronics and specialised components have different supply chains. A chemistry based on abundant material can still depend on a concentrated component or manufacturing process.
The buyer should review supplier locations, lead times, quality control, substitutes, inventory and logistics. Electrolyte leasing or repurchase arrangements create additional contractual dependencies.
Critical spares should reflect failure consequence and lead time. A pump that costs little relative to the project can still cause a long outage if no compatible replacement is available.
37. Vendor credit is a lifecycle risk
Long warranties and service commitments outlast many suppliers' current funding horizons. A technically sound product can leave the owner exposed if the vendor restructures or exits the market.
The diligence should review financial capacity, ownership, manufacturing partners, installed base, warranty reserves and service organisation. The result may support parent guarantees, letters of credit, escrowed documentation, step-in licences or third-party maintenance rights.
The project should be designed for component substitution where practical. Proprietary interfaces can increase switching cost and weaken residual value.
38. Risk allocation should follow control
The integrator can control design coordination and commissioning. The battery vendor can control warranted equipment performance. The operator controls maintenance and dispatch execution. The host controls load data, site access and production changes. The utility controls interconnection under its rules.
The contracts should allocate these risks consistently. A vendor should not guarantee savings when the host controls production and dispatch. The host should not bear an undisclosed equipment-performance gap.
Residual risks should appear in contingency, reserves, insurance, covenants or lower leverage.
Table 3. Commercial-risk allocation for an industrial flow-battery microgrid
| Risk | Primary evidence | Party positioned to control it | Commercial response | Ongoing monitor |
|---|---|---|---|---|
| Service definition | Critical-load study and outage sequence | Host and microgrid designer | Agreed load boundary and change process | Load profile and production plan |
| Technology performance | Tests, references and warranty | Battery vendor | Power, energy, efficiency and availability guarantees | Throughput and condition data |
| Integration | Protection study, control design and interface matrix | Microgrid integrator | Single-point completion responsibility | Interface register and test results |
| Site and permits | Layout, surveys and authority review | Host and developer | Conditions precedent and relief rules | Permit and access status |
| Charging and dispatch | Tariff, forecasts and operating protocol | Host or service provider | Priority waterfall and state-of-charge policy | Reserve breaches and capture rate |
| Lifecycle work | Maintenance plan and degradation model | Vendor and operator | Reserve, service agreement and security | Stack, pump and membrane condition |
| Vendor credit | Financial statements and service capacity | Vendor and sponsor | Parent support, letter of credit or escrow | Annual credit review |
| Host payment | Service agreement and host financials | Host | Security, termination payment and step-in rights | Receivables and covenant status |
Project contracts and applicable law determine the final allocation.
39. The hypothetical value comparison
The hypothetical model annualises capital and lifecycle cost over each service life and combines ordinary energy savings with expected interruption benefit. It applies no residual value to electrolyte or equipment. The purpose is to show method, not to establish market pricing.
The lithium-ion case has the lowest initial cost and strongest modelled efficiency. The flow-battery case provides longer reserved duration and a longer assumed life. The hybrid case captures high-power response and longer energy service at the cost of integration complexity.
Results change materially when outage probability, interruption cost, replacement and discount rate change. The decision should therefore use a range rather than a single ranking.
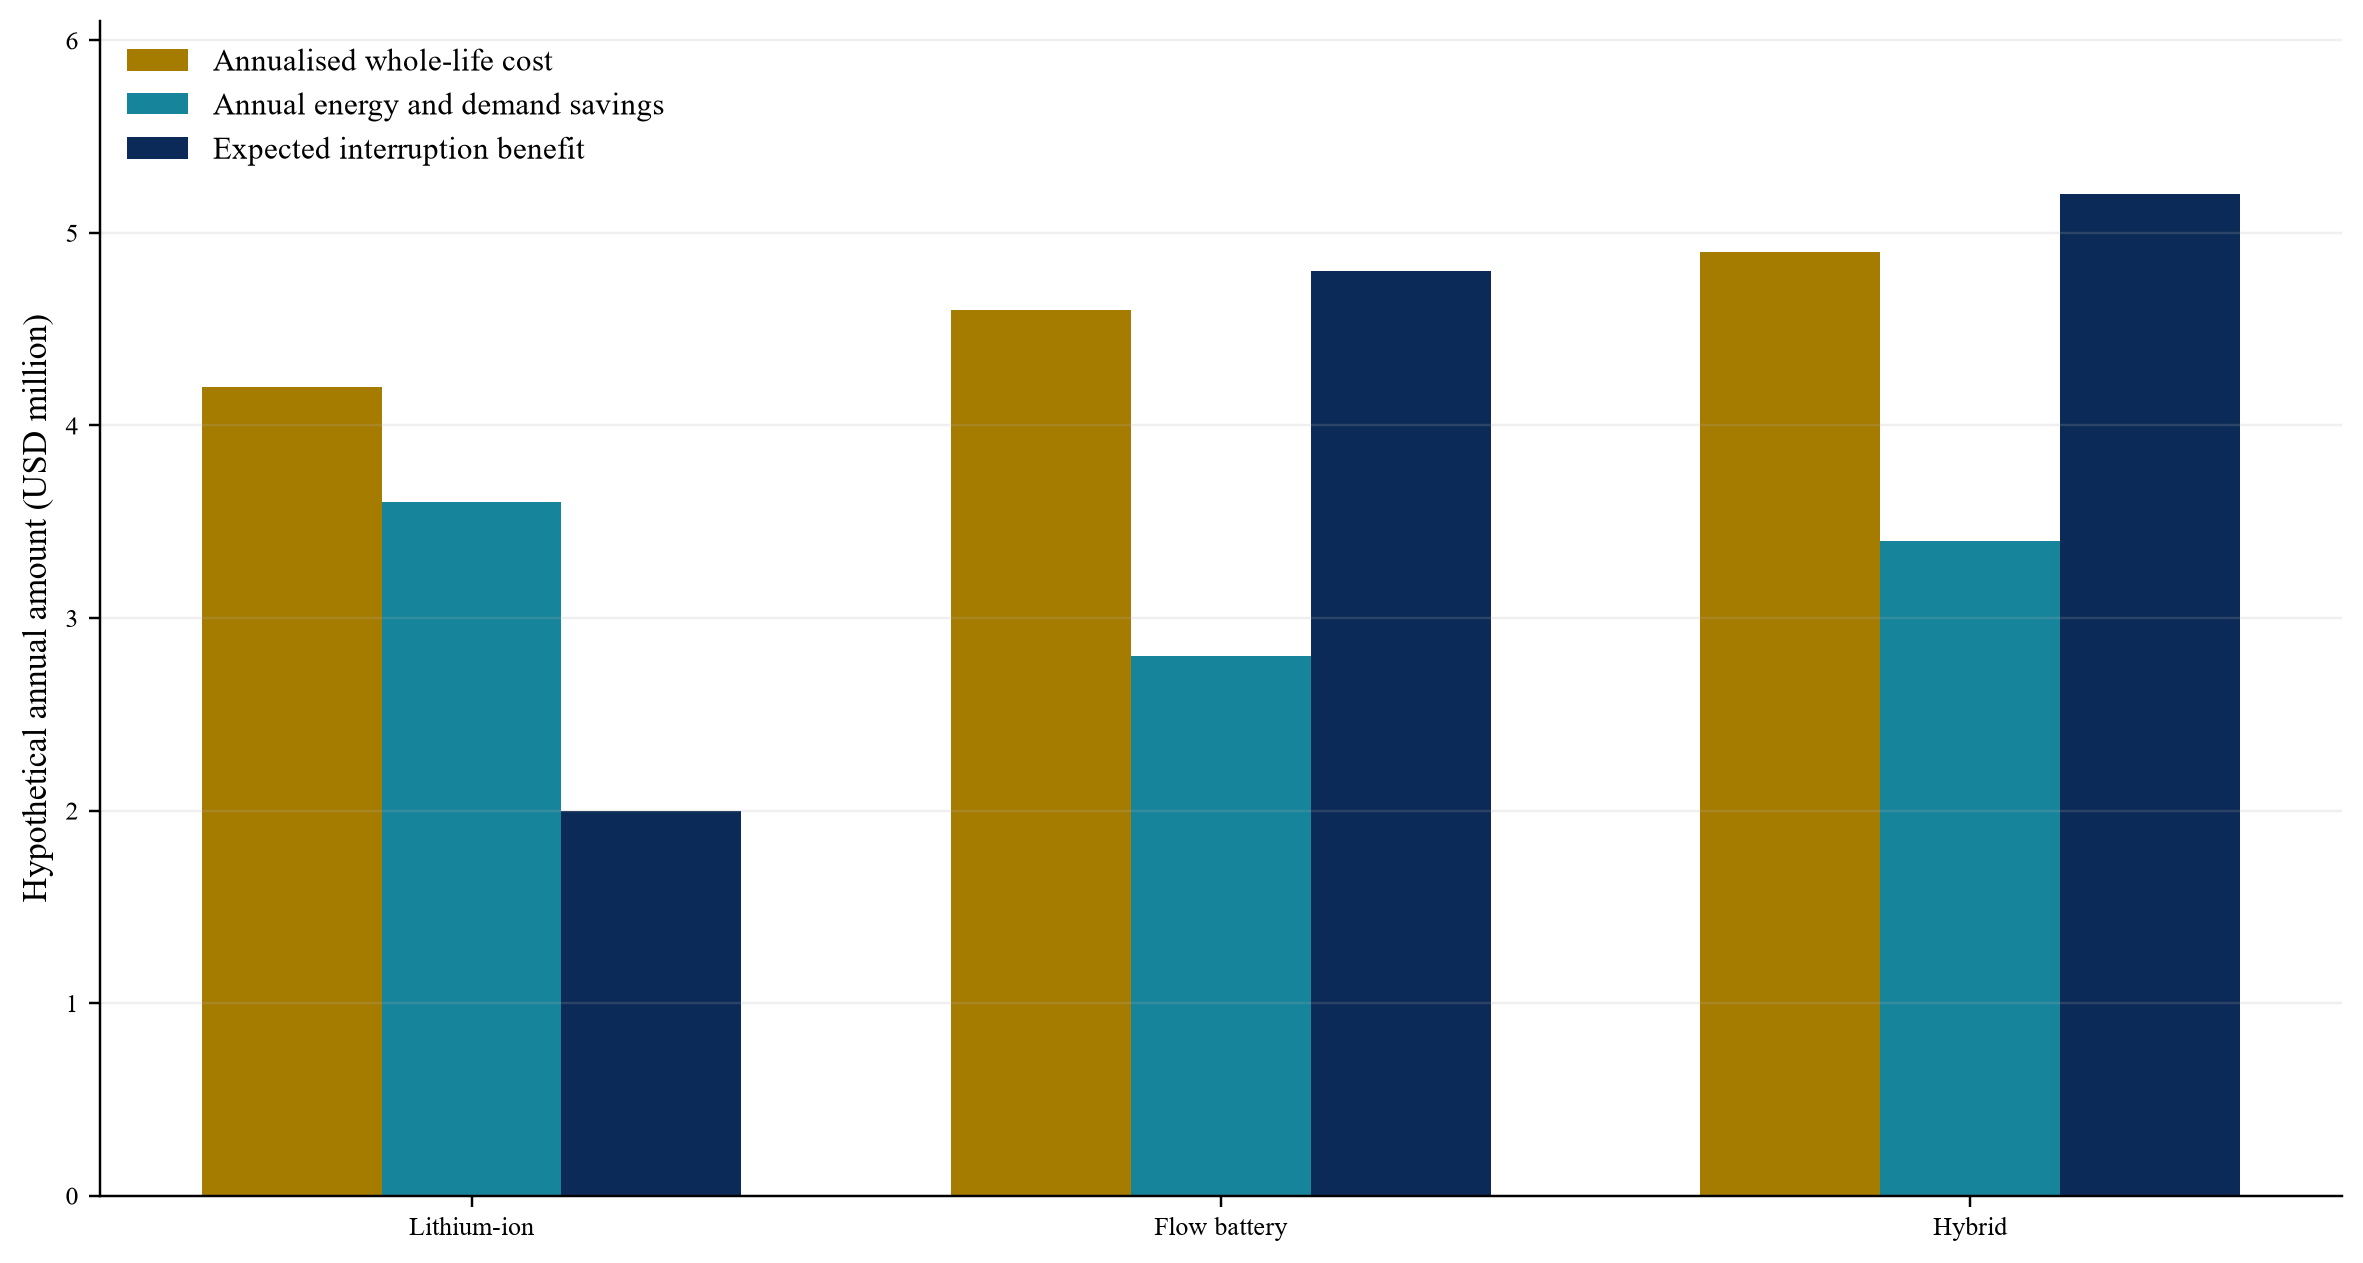
All values are illustrative. Protected-service value is an expected-value assumption and is not contracted cash.
40. Sensitivity identifies the binding assumptions
Flow-battery value weakens when the site needs only short duration, cycles rarely, has expensive land or faces cheap and reliable generator fuel. It improves when outages extend beyond the compact battery's duration, cycling is deep and frequent, replacement avoidance matters or site resilience has high value.
Efficiency can dominate ordinary arbitrage. Availability and stack life can dominate resilience and lifecycle cost. A model that varies only equipment price misses these drivers.
The investment committee should see single-variable sensitivities before combined cases. This reveals whether the recommendation depends on one management estimate or remains supportable across several conditions.
41. Decision gates can discipline implementation
The first gate confirms the critical-load service. The second confirms site, interconnection and permits. The third confirms technology evidence and vendor capacity. The fourth confirms lifecycle economics under consistent boundaries. The fifth confirms contracts and finance. The sixth confirms integrated testing. The seventh confirms operating data and long-term support.
Each conditional approval should identify missing evidence, responsible party, deadline and financial consequence. A technology preference should not bypass a failed service or evidence gate.
The gates can be revisited when the load, tariff, vendor, design or operating strategy changes.
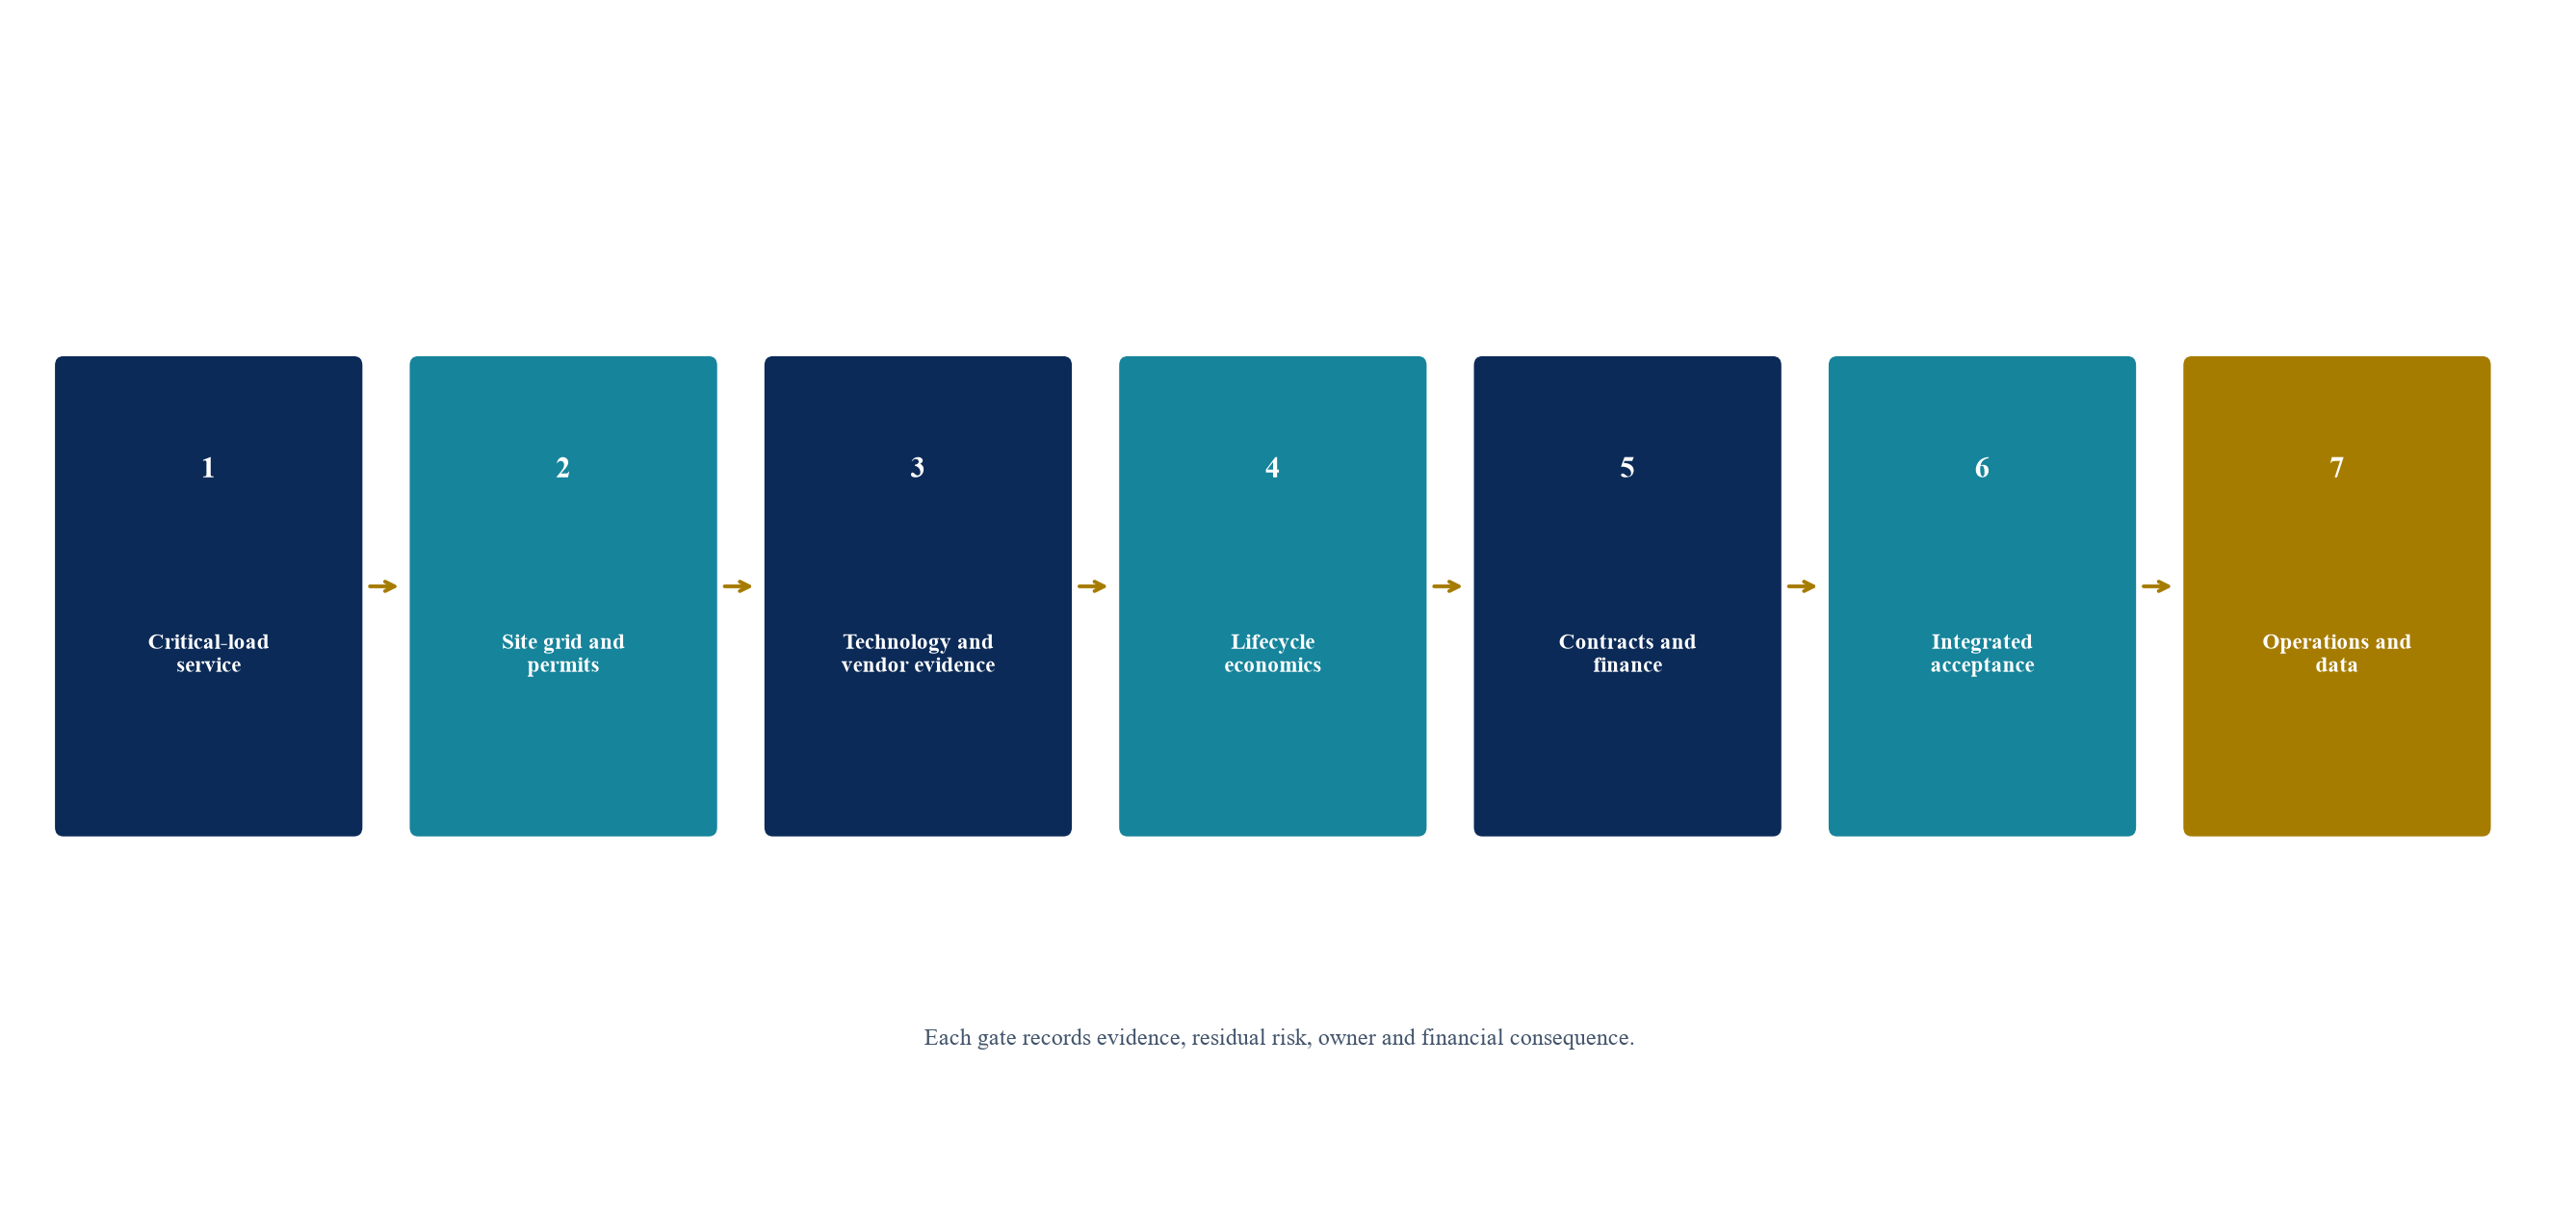
The project advances when the protected service, technology evidence, contracts and operating controls remain aligned.
42. The first hundred days should establish the evidence base
The project team should freeze the critical-load map, gather interval load and outage data, complete site and interconnection studies, and issue the technology-neutral service specification. It should then reconcile vendor bids through the common lifecycle model.
The team should identify code officials and insurers early, especially where an unfamiliar chemistry or installation has limited local precedent. It should also define data interfaces, cybersecurity requirements and acceptance tests before awarding supply contracts.
Commercial work should connect every claimed value line to data, a tariff, a contract or a clearly labelled management estimate.
43. Portfolio procurement can reduce evidence cost
An industrial group with several sites can standardise load studies, specifications, controls, warranties and data reporting. Portfolio procurement can improve vendor competition and spread engineering cost.
Sites still require local outage, tariff, layout and permitting analysis. A standard ten-hour system can be inefficient where one site needs two hours and another needs twelve.
A portfolio can stage deployment and use early operating data to improve later designs. It should preserve competitive options and avoid locking every site into an unproven interface.
44. Limits and further research
Public sources provide technology and market benchmarks, but they cannot establish the performance or economics of a specific product or industrial site. The hypothetical case illustrates decision mechanics only. Product quotations, operating data, load records, outage histories, tariffs, engineering and contracts are required for an investment decision.
Further research should compare realised flow-battery performance across chemistries, measure pump and balance-of-plant availability, track electrolyte residual value, and study industrial interruption costs by process. Standardised operational data could improve warranty design and financing.
Technical, safety, legal, tax, environmental and regulatory conclusions require qualified advisers in the relevant jurisdiction.
45. Conclusion
Flow batteries should be priced against the hours and quality of service required by an industrial process. Their ability to scale energy separately from power can improve long-duration economics, particularly where deep cycling, replacement avoidance and resilience value matter. Efficiency, footprint, balance-of-plant complexity and vendor maturity can offset that advantage.
The buyer should define critical loads and outage sequences, use interval data, compare technologies through a consistent lifecycle model, and require chemistry-specific safety and operating evidence. The commercial package should guarantee usable energy, availability and lifecycle support at the agreed delivery point.
A staged, evidence-led process allows the investment committee to distinguish a durable industrial service from a technology claim.
References
- United States Department of Energy, Storage Innovations 2030, accessed September 2026. https://www.energy.gov/oe/storage-innovations-2030
- United States Department of Energy, Flow Batteries Technology Strategy Assessment, July 2023. https://www.energy.gov/documents/flow-batteries-technology-strategy-assessment-508
- United States Department of Energy, Achieving the Promise of Low-Cost Long Duration Energy Storage, August 2024. https://www.energy.gov/sites/default/files/2024-08/Achieving%20the%20Promise%20of%20Low-Cost%20Long%20Duration%20Energy%20Storage_FINAL_08052024.pdf
- United States Department of Energy, 2022 Grid Energy Storage Technology Cost and Performance Assessment. https://www.energy.gov/cmei/2022-grid-energy-storage-technology-cost-and-performance-assessment
- United States Department of Energy, Rapid Operational Validation Initiative, accessed September 2026. https://www.energy.gov/oe/rapid-operational-validation-initiative-rovi
- United States Department of Energy, Fiscal Year 2024 Microgrid and Integrated Microgrid Systems Program Report to Congress, January 2025. https://www.energy.gov/documents/fy-2024-microgrid-report-congress
- United States Department of Energy, Kickstart Your Federal Microgrid Project: Financing Opportunities and Best Practices, August 2025. https://www.energy.gov/cmei/femp/articles/kickstart-your-federal-microgrid-project-financing-opportunities-and-best
- United States Department of Energy, Energy Storage Valuation: A Review of Use Cases and Modeling Tools, June 2022. https://www.energy.gov/sites/default/files/2022-06/MSP_Report_2022June_Final_508_v3.pdf
- United States Department of Energy, Financing Microgrids in the Federal Sector, August 2020. https://www.energy.gov/cmei/femp/articles/financing-microgrids-federal-sector
- Sandia National Laboratories, Grid-Scale Energy Storage Hazard Analysis and Design Objectives for System Safety, August 2020. https://www.sandia.gov/research/publications/details/grid-scale-energy-storage-hazard-analysis-design-objectives-for-system-safe-2020-08-01/
- Sandia National Laboratories, Hazard Analysis in Flow Battery Power Plants, 2020. https://www.sandia.gov/app/uploads/sites/163/2021/08/Rosewater-APS.pdf
- Sandia National Laboratories, Safety Guidelines for Flow Batteries, SAND2014-18583. https://www.sandia.gov/app/uploads/sites/163/2021/09/SAND2014-18583.pdf
- International Renewable Energy Agency, Electricity Storage and Renewables: Costs and Markets to 2030, October 2017. https://www.irena.org/-/media/Files/IRENA/Agency/Publication/2017/Oct/IRENA_Electricity_Storage_Costs_2017.pdf
- International Renewable Energy Agency, Renewable Power Generation Costs in 2024. https://www.irena.org/Digital-Report/Renewable-Power-Generation-Costs-in-2024
- International Energy Agency, Battery Storage Is Scaling Up and Taking on a Larger System Role, 2026. https://www.iea.org/commentaries/battery-storage-is-scaling-up-and-taking-on-a-larger-system-role
- International Energy Agency, Electricity 2026: Flexibility. https://www.iea.org/reports/electricity-2026/flexibility
- UL Solutions, Understanding UL 9540A, NFPA 855 and Large-Scale Fire Testing for Battery Energy Storage Systems, 2026. https://www.ul.com/thecodeauthority/knowledge/understanding-UL-9540A-NFPA-855
- UL Solutions, Installation Codes and Requirements for Energy Storage Systems: Frequently Asked Questions, 2026. https://www.ul.com/resources/installation-codes-and-requirements-energy-storage-systems-ess-faqs
- National Renewable Energy Laboratory, Microgrid Resources and Research, accessed September 2026. https://www.nrel.gov/grid/microgrids
About the Author
Chennakeshav (CK) is a corporate finance and investment banking executive with 25+ years of global experience in deal origination, structuring and execution across M&A, growth capital and corporate strategy. He has led value-creation mandates for founders, corporates and funds — bridging the boardroom view to hands-on execution and close.
His career spans Morgan Stanley, HSBC, Lloyds Banking Group, EWEC, ADQ portfolio companies and Emirates Growth Fund, across TMT, real estate, fintech, deeptech, cleantech, infrastructure and energy. He has partnered with C-suite leaders, private equity and venture funds, sovereign wealth funds and family offices to finance complex fund raises and scale-up ventures, and has led M&A due diligence, post-merger integration and business-transformation initiatives to create value.
At Matchpoint Partners he is Managing Partner, leading the firm's corporate finance, M&A and capital-raising practice. He holds an MBA from London Business School, an engineering degree from VTU and a Master of Laws (LLM, in progress) from UCL London.
An active start-up mentor, CK mentors at Techstars, DIFC FinTech Hive, Startup Grind, Founder Institute and IN5, serves as Entrepreneur Mentor in Residence (EMiR) at London Business School, and judges the Entrepreneurship World Cup.
LinkedIn: https://www.linkedin.com/in/ckadya/
Profile: https://www.matchpoint-partners.com/team/ck-adya.html
