

Introduction
Subsurface uncertainty affects everyday infrastructure decisions. Contractors need to know where utilities lie before excavation. Rail operators need to understand drainage, voids and ground conditions beneath live assets. Developers need evidence on sinkholes, mine workings and buried structures. Water, geothermal and carbon-storage operators need to observe changing mass below the surface. Defence and security users may need to identify tunnels or other concealed structures. In each case, the economic value comes from a better decision about where to dig, where to avoid, where to investigate further and how much contingency to hold.
The United Kingdom's National Underground Asset Register now brings together data from hundreds of asset owners and millions of kilometres of buried pipes and cables [1]. That shared record improves access to known information, but it does not make every record complete, current or physically verified. Health and Safety Executive guidance continues to require plans, locating devices and safe excavation practices [2,3]. Survey technologies therefore complement records and operating controls rather than replace them.
Quantum gravity sensing has moved beyond laboratory discussion. A 2022 peer-reviewed field demonstration detected a buried tunnel using a cold-atom gravity gradiometer and reported vibration rejection, 0.5-metre survey spacing and a quantified inference result [4]. Public programmes now seek mobile, networked and field-ready instruments for critical infrastructure and mapping [5,6]. European projects are developing field products, survey methods and gravimeter networks [7,8]. These developments support a serious commercial assessment.
This paper asks how a quantum-gravimetry company can become a repeatable infrastructure-detection business. It evaluates detection evidence, field productivity, service design, pricing, customer adoption, unit economics, financing and governance. It uses a hypothetical operating model to show which variables determine value and which milestones should control the release of capital.
1 Start with the customer's decision
The first diligence question is not how sensitive the instrument is. It is which customer decision changes because of the survey. A civil contractor may need to decide whether piling can proceed. A rail owner may need to prioritise drainage investigation. A utility may need to verify an uncertain route before directional drilling. A public authority may need to assess a suspected void beneath a road. Each decision has a different consequence, time window and tolerance for uncertainty.
The provider should define the target as a physical hypothesis. Relevant attributes include geometry, depth, density contrast, expected orientation, surrounding geology and competing anomalies. The provider should then define the operational setting: surface access, traffic, vibration, terrain, weather, nearby structures, available records and permitted survey time. Detection performance cannot be separated from that context.
The output should match the decision. A probability map, estimated centre and depth, exclusion zone, confidence class or recommendation for further investigation may be more useful than a raw gravity trace. The report should state what was measured, what was assumed, what remains ambiguous and which complementary method could reduce the remaining uncertainty.
Commercial discovery should identify the beneficiary, buyer, budget holder and risk owner. A strike avoided may benefit an asset owner, contractor, insurer and public authority, while the survey purchase may sit in a subcontractor's budget. Adoption improves when the value proposition fits the procurement route and allocates savings to the organisation that pays.
The sales case should quantify a bounded decision value. It can include avoided intrusive investigation, reduced contingency, fewer work stoppages, better route selection or a smaller area requiring excavation. The model should avoid claiming that every anomaly can be identified or that a survey guarantees safety. A technically credible provider specifies where the method adds evidence and where ordinary controls remain necessary.
2 Segment the market by use case and evidence burden
Infrastructure detection is not one market. Civil engineering and construction may require mapping of voids, foundations, buried structures and ground variability before design or excavation. Transport use cases include rail drainage, embankments, tunnels, road voids and port infrastructure. Utilities may seek pipes, ducts, legacy routes and disturbed ground. Energy applications can include geothermal reservoirs, carbon storage and resource monitoring. Defence and security requirements can include tunnels and protected-site assessment.
Each segment imposes a different evidence burden. A screening survey that narrows an investigation area can tolerate greater uncertainty than a safety-critical clearance decision. A recurring environmental-monitoring service values stability over time. A construction programme values mobilisation speed and compatibility with site access. Defence buyers may require security controls, export review and restricted data handling.
The addressable market should therefore be built from specific workflows. Management can estimate the number of relevant sites, average survey scope, procurement frequency, available alternatives and likely paid trial conversion. It should avoid multiplying a broad construction-spend number by an assumed share. That top-down method hides how rarely a given target, depth and site condition match the sensor's practical capability.
A useful segmentation matrix records the problem, decision owner, current method, unresolved limitation, evidence threshold, sales cycle, typical contract and repeat potential. It also records disqualifying conditions. A provider creates trust when it declines work that sits outside its validated envelope.
Early commercial focus should favour use cases with observable targets, cooperative customers, accessible sites and a clear cost of uncertainty. These projects generate the evidence needed for harder markets. A portfolio of disconnected demonstrations may create publicity but little reusable commercial learning.
3 Build an evidence ladder from metrology to accepted surveys
Commercial readiness requires more than a successful scientific result. The first evidence level is a defensible sensing principle and calibrated laboratory measurement. The second is repeatability at a controlled test site where target geometry and ground conditions are known. The third is representative field performance with ordinary site noise, imperfect access and independent references. The fourth is multi-site and multi-unit reproducibility.
The fifth level is integrated interpretation. The company must combine instrument data with positioning, topography, records, geological context and an inversion method. The sixth is a customer-accepted deliverable that changes a real decision. The seventh is repeated paid use across customers, crews, systems and seasons. Each level reduces a different commercial risk.
The 2022 outdoor tunnel demonstration is important because it connected atom interferometry, common-mode noise rejection, field survey design and Bayesian inference [4]. It also shows why evidence should be read precisely. One demonstrated target under documented conditions does not define a universal detection envelope. The test supports a capability claim and a route to further validation.
An evidence register should preserve protocols, raw data, calibration, environmental logs, site models, operator actions, anomalies, rejected readings and interpretation versions. Independent review matters because inversion can introduce judgement. A customer-observed repeat test under a pre-agreed protocol carries greater commercial weight than a retrospectively selected result.
Capital providers should connect funding to the ladder. Product capital can support ruggedisation and controlled validation. Service expansion should follow evidence that a trained crew can reproduce the result. Fleet capital should follow paid utilisation, reliability and repeat orders. This approach limits the risk of funding hardware capacity before the customer workflow is proven.
4 Define sensitivity through a target-detection envelope
Gravity responds to mass. A cavity, tunnel, dense foundation or changing water volume creates a gravity anomaly whose magnitude depends on density contrast, geometry, depth and distance from the sensor. The same instrument can therefore perform differently across targets. A commercial specification should express detection capability through a target envelope rather than a single sensitivity number.
The envelope should show target classes against depth, spatial extent, density contrast, survey spacing, integration time and expected confidence. It should include the effect of topography, nearby buildings, vehicles and geological variation. It should distinguish detection, localisation and characterisation. Detecting that an anomaly exists is easier than identifying its shape and material.
Instrument sensitivity needs a complete definition. Relevant measures can include short-term noise, stability, gradient sensitivity, systematic error, bandwidth, dead time and common-mode rejection. The field system also depends on positioning, levelling, timing, sensor height and environmental measurement. A strong sensitivity claim can be defeated by uncertain coordinates or an incomplete terrain correction.
Benchmarking should use representative alternatives. Classical gravimeters, ground-penetrating radar, electromagnetic locating, electrical resistivity, seismic methods and intrusive investigation solve different problems. The comparison should state the site and target conditions under which each method works. Quantum gravimetry may be most valuable as part of a layered survey where another method provides geometry or material information.
The board should review the validated envelope quarterly. New evidence can expand it, narrow it or alter confidence. Sales materials, proposals and pricing tools should use the same controlled version so that commercial commitments do not outrun technical evidence.
5 Make survey productivity a primary product metric
Customers buy timely decisions. Survey productivity therefore matters alongside sensitivity. The operating cycle includes mobilisation, site induction, positioning, instrument warm-up, calibration, measurement, moves between stations, quality control, remobilisation, processing, interpretation and reporting. A quoted measurement time that excludes the rest of the cycle can misstate delivered economics.
The provider should measure available field days, paid utilisation, stations per shift, repeat readings, rejected data, weather loss, access loss, setup hours, processing hours and report turnaround. These measures should be captured by system and crew. They reveal whether performance improvements translate into lower delivered cost.
Site design affects productivity. Wide survey spacing can increase speed but miss a small anomaly. Longer integration can improve statistical confidence but reduce coverage. A staged method may use a faster reconnaissance grid followed by dense measurements around candidate anomalies. The company should optimise for decision value rather than the maximum number of stations.
Common-mode rejection can reduce sensitivity to vibration, but field evidence should show the range of noise over which useful data is obtained. Sites with live traffic, heavy machinery or restricted access may require different protocols. Rework and inconclusive reports should remain visible in the productivity record.
Product development should target bottlenecks. A more reliable vacuum package, automated levelling, faster quality control, integrated positioning or improved inversion may create more value than a marginal improvement in laboratory noise. The roadmap should quantify how each change affects paid days, crew requirements, report time or customer confidence.
6 Design a complete deployment and site model
The sensing system begins before the instrument arrives. The team should collect utility records, plans, geological information, surface models and information about buildings, traffic and recent works. It should define the coordinate system, survey control and site restrictions. Known objects can provide checks, while uncertain records should not be treated as ground truth.
The deployment plan should map target hypotheses to survey lines, spacing and expected signal. It should record access constraints, safe working areas, traffic management and environmental monitoring. Instrument placement and sensor height need configuration control because small coordinate errors can affect interpretation.
Topography and surrounding mass can produce signals larger than the target. Buildings, embankments, retaining walls, vehicles and terrain should enter the forward model where material. The 2022 tunnel work used site geometry, plans, radar cross-checks and topographic information to support inference [4]. A commercial workflow should make those dependencies explicit.
Field quality control should decide whether data is usable before the crew leaves. Automated checks can flag unstable readings, position errors, instrument lock loss, excessive tilt or inconsistent repeats. A resurvey is cheaper while access and equipment remain available.
The final record should preserve the site model, raw and corrected observations, processing parameters, interpretation, confidence and limitations. It should support later comparison when excavation or another method reveals the actual condition. That feedback turns individual projects into a cumulative commercial evidence base.
7 Integrate quantum gravimetry with records and complementary methods
No single method fully resolves the underground. Asset registers and plans describe known records. Electromagnetic locating can trace conductive services. Ground-penetrating radar can provide high-resolution imagery under favourable soil conditions. Seismic and resistivity methods can characterise other contrasts. Trial pits and boreholes provide direct evidence at selected points. Gravity contributes a passive measurement of mass distribution.
The commercial service should define how these inputs combine. A record can inform a prior hypothesis without forcing the result. A radar anomaly can guide denser gravity measurements. A gravity anomaly can identify an area for intrusive verification. Data fusion should preserve the provenance and uncertainty of each input.
NUAR creates an important context for the United Kingdom. The platform provides secure access to integrated asset information from major networks [1]. A sensing company can position its service as physical verification, gap investigation and condition evidence around that digital record. The service should respect access, security and permitted-use rules.
Interpretation software should avoid producing a single visually persuasive answer without alternatives. Gravity inversion is non-unique; different density distributions can fit similar observations. Reports should show candidate models, confidence, sensitivity to assumptions and conditions that would change the conclusion.
Integration creates partnership options. Engineering consultancies, geophysics firms, survey contractors and asset-management platforms already own customer relationships and field capacity. A quantum company can sell equipment, license analysis, provide a specialist subcontract service or form a joint delivery team. The chosen model affects margin, adoption speed and control of evidence.
8 Engineer the instrument for field availability
Cold-atom systems combine vacuum, lasers, optics, electronics, magnetic control, computing and mechanical structures. NIST describes the translation challenge as making complex cold-atom technology robust and field deployable [9]. Commercial diligence should therefore assess the complete system rather than the sensor head alone.
Field availability measures whether a system can be deployed when a customer needs it. The company should record mean time between service-affecting failures, recovery time, preventive maintenance, calibration drift, spare consumption, transport damage and remote-support cases. A fleet with high nominal sensitivity and low availability cannot support dependable contracts.
Ruggedisation testing should cover transport, temperature, humidity, dust, power quality, vibration, shock and electromagnetic environment. Limits should reflect the actual deployment. A system carried by van and operated beside a railway faces different stresses from a laboratory instrument or ship-mounted system. The successful maritime trial reported in 2023 expands evidence for robust operation, while each commercial platform still requires its own validation [10].
Configuration control is essential. Hardware, firmware, analysis software and calibration data should have linked versions. A field result should identify the exact configuration. Changes intended to improve packaging or cost can alter performance and require regression testing.
Service design should include trained setup, remote diagnostics, field-replaceable modules and acceptance checks after transport. The company should decide which repairs belong with the crew, a regional service centre or the factory. Spares and support capacity should be included in the fleet model.
9 Treat inversion and reporting as part of the product
Raw gravity measurements do not identify a pipe, void or tunnel by themselves. The company must remove known effects, model the site and infer plausible subsurface structures. The interpretation process can be a major source of customer value and liability.
The data pipeline should preserve raw observations, corrections, coordinate transforms, terrain inputs, priors, model versions and analyst decisions. Automated processing can improve speed, yet every consequential result should remain reviewable. Model changes require validation against retained cases.
Machine learning may help classify data quality, propose survey refinement or compare patterns across sites. Training data can be limited and biased toward successful demonstrations. Management should distinguish exploratory models from validated production tools and maintain human accountability for the final report.
Report design should support action. It should include the customer's question, method, coverage, confidence, detected anomalies, alternative explanations, limitations and next steps. A map should use clear coordinates and a controlled legend. Marketing language should not appear in technical conclusions.
Truth data is commercially valuable. Excavation outcomes, boreholes, known test facilities and complementary surveys can validate or challenge interpretations. Contracts should define rights to use de-identified results for product improvement while protecting customer security and confidentiality.
10 Choose between equipment service and platform models
A manufacturer can sell systems, lease them, provide surveys, license software or combine these models. Equipment sales create early revenue and transfer field operations to the customer, but they require training, support, warranty and a product stable enough for independent use. Direct service preserves operational control and captures interpretation value, while growth requires crews and fleet utilisation.
Leasing can reduce customer capital commitment and create recurring revenue. It also leaves asset financing, maintenance and residual-value risk with the provider. A managed-service model can guarantee defined availability or turnaround when the company has enough evidence to price that obligation.
A platform model connects instruments, scheduling, data processing, interpretation and a customer evidence repository. It can support recurring monitoring and multi-site programmes. Its value depends on data rights, interoperability and sustained customer use rather than a software label.
The operating model should match maturity. Early deployments may need company scientists on site. The next stage uses trained field engineers and controlled procedures. Later growth may use certified partners. Partner delivery should begin only after the company can verify training, calibration, data quality and reporting.
Revenue quality differs across models. Grant income and development contracts can fund engineering but may not prove recurring demand. Paid trials prove willingness to engage but may be subsidised. Repeat commercial orders, framework awards, renewals and collected cash provide stronger adoption evidence. The board should report these categories separately.
11 Convert trials into customer adoption
Customer adoption follows a risk-reduction sequence. A prospect first needs a use case that current methods do not resolve well. A controlled demonstration can then show whether the sensor responds to a relevant target. A paid field trial tests mobilisation, productivity, interpretation and procurement. A repeat order tests whether the result created operational value.
The trial should have a written protocol, customer-supplied decision question, acceptance criteria and treatment of inconclusive outcomes. The provider should avoid a demonstration chosen mainly because it is easy to detect. Representative difficulty builds more useful evidence.
Procurement access can be a constraint. Infrastructure owners may buy through engineering frameworks, prime contractors or approved survey suppliers. The quantum company may need insurance, safety systems, security, quality assurance and financial capacity before it can contract directly. Partnerships can bridge that gap.
Adoption evidence should track opportunity source, segment, proposed use case, trial conversion, order value, time to contract, delivery margin, acceptance, repeat work and collected cash. Pipeline value should exclude unfunded expressions of interest. Customer concentration and public-programme dependence should be visible.
Reference customers require permission. Sensitive projects may never support public case studies. The company should build a controlled evidence pack that can be shared under confidentiality, including protocols, performance distributions and anonymised operating measures.
12 Model unit economics at survey system level
The economic unit is a deployable system and crew. Revenue depends on paid days, daily price, mobilisation, interpretation and any recurring monitoring. Capacity depends on available days after maintenance, training, travel and weather. Utilisation measures how much of that capacity is paid.
Direct cost should include field labour, travel, accommodation, vehicles, site consumables, equipment maintenance, calibration, data processing, interpretation and subcontract methods. Depreciation or lease cost should reflect the fleet capital tied to delivery. Warranty and rework should remain visible.
The hypothetical central case uses three systems, 138 available field days per system and 72 percent paid utilisation. Average field revenue is USD 18,500 per paid day. Interpretation and data products add 14 percent of field revenue. The model assumes direct field and processing cost of USD 10,900 per paid day, annual fixed fleet support of USD 610,000 and equipment depreciation of USD 470,000. These are wholly hypothetical management assumptions.
Under those assumptions, paid days equal 298, field revenue equals USD 5.51 million, interpretation revenue equals USD 0.77 million and mobilisation revenue equals USD 0.48 million. Total revenue is USD 6.76 million. Direct variable cost is USD 3.25 million and fixed fleet cost plus depreciation is USD 1.08 million, producing contribution of approximately USD 2.43 million before research, sales and corporate overhead.
The board should stress utilisation, price, downtime, crew cost, processing time and report acceptance. A delayed-adoption case can make a technically successful fleet cash negative. Scaling should therefore follow contracted demand and demonstrated availability.
13 Price the decision and manage contract risk
Daily rates are easy to compare but can misalign incentives. A fixed-price survey can reward productivity if scope and access are controlled. A staged contract can price reconnaissance, focused investigation and interpretation separately. A monitoring contract can use a recurring fee tied to scheduled measurements and data service.
Value-based pricing requires credible evidence about avoided cost and customer alternatives. The provider should not claim all potential project delay or strike cost as its value. A defensible price reflects the incremental information delivered, the share of risk reduced and the cost of alternatives.
Contracts should define site access, records, target assumptions, survey coverage, deliverables, acceptance, rescheduling, data rights, confidentiality and liability. They should state that results support a decision process and do not replace statutory safe-dig controls, engineering judgement or intrusive verification where required.
Performance commitments should use measured outputs. Guaranteed detection of an unknown target can create unbounded exposure. A better structure can commit to coverage, protocol, data quality, report timing and a validated detection envelope. An inconclusive result should have a defined treatment.
Revenue recognition, milestone billing and cash collection need discipline. Long acceptance periods or customer retention can distort reported growth. Management should report contracted backlog, delivered work, accepted revenue, invoices and collected cash separately.
14 Protect intellectual property data and supply continuity
Commercial advantage may sit across interferometer design, vibration rejection, optical control, field calibration, survey method, inversion software and accumulated data. Patent scope should be reviewed alongside know-how and freedom to operate. Public research origins, grant terms, university licences and employee assignments require precise diligence.
Data rights can become a strategic asset. The company may build a library linking site conditions, survey configurations, gravity observations and verified outcomes. Customer contracts should permit only the uses that have been agreed. Critical-infrastructure information may require restricted access and retention controls.
Supply-chain diligence should map lasers, vacuum components, photonics, electronics, computing and specialist fabrication. Lead times, sole sources, export restrictions, obsolescence and yield affect fleet growth. The UK project directory identifies laser packaging and system cost as commercialisation constraints for gravity gradiometry [11].
The bill of materials should connect to service availability. A low-cost component that causes long downtime can have a high economic cost. Spares policy should reflect failure history and supplier recovery time.
Intellectual-property protection should not prevent operational learning. Field teams need enough documentation to diagnose and recover systems. The company should reduce dependence on individual inventors through controlled designs, procedures, calibration records and successor coverage.
15 Address safety security and public procurement
Infrastructure surveys operate around live roads, railways, utilities and construction sites. The provider needs risk assessments, trained personnel, equipment handling, traffic or rail access procedures and clear interfaces with the principal contractor. Sensor capability does not reduce the obligation to follow ordinary safety controls.
Underground-asset information can be security-sensitive. NUAR uses secure access and a statutory framework for shared information [1,12]. Customer data should be classified, access controlled and retained only as permitted. Defence and critical-infrastructure work may add personnel, facility and cyber requirements.
Public procurement can fund development and become an early market. It can also concentrate revenue in a small number of programmes. Management should distinguish research grants, development contracts, paid evaluations, operational orders and frameworks. Rights, deliverables and termination terms differ.
Export and investment-screening regimes can apply to advanced sensors or sensitive applications. Legal review should identify controlled hardware, software, technical data, end use and destination. Cross-border partnerships and fundraising should be planned around these constraints rather than discovered during closing.
Quality management should match customer expectations. Calibration traceability, document control, supplier assurance, non-conformance handling and corrective action provide evidence that results remain reliable as volume grows.
16 Finance the transition through observable milestones
Quantum-gravimetry businesses can consume capital before recurring revenue. Funding supports instrument engineering, test facilities, field trials, fleet assets, spares, software, safety systems and working capital. The financing plan should separate non-recurring product development from service capacity.
Early equity is suited to technical uncertainty and long development. Grants and customer-funded programmes can reduce dilution while creating obligations and restricted rights. Asset finance or leasing becomes more credible when equipment has reliable utilisation, service history and residual value. Working-capital facilities require contracted receivables and predictable acceptance.
Milestones should be observable. Examples include a defined controlled-site result, repeated representative field performance, a validated detection envelope, system availability above a stated threshold, paid-day productivity, an accepted customer report, a repeat order, a certified partner deployment and collected cash.
Funding should not be released solely against hardware completion. A finished instrument without customer workflow evidence can add inventory and maintenance cost. Commercial milestones should connect equipment, people, data and acceptance.
The board should maintain a twelve-month cash and capacity model. It should show engineering spend, fleet additions, hiring, trial commitments, contracted delivery, payment timing and downside actions. Growth capital should expand the constraint supported by evidence rather than funding every roadmap item at once.
17 Use scenarios to value the commercial path
Valuation should reflect evidence states rather than a single forecast. A research-stage case values transferable science, intellectual property and team capability. A field-demonstrator case adds repeatable representative results. A commercial-service case adds paid utilisation, customer acceptance and contribution economics. A scaled-platform case adds repeat customers, partner delivery and a reliable fleet.
The hypothetical company has 46 employees, three deployable systems, two systems in engineering, USD 6.8 million of annual revenue and USD 8.9 million of annual cash use. It has four material customers, of which the largest provides 31 percent of revenue. These assumptions are wholly hypothetical and do not describe an identified company.
Four hypothetical enterprise-value scenarios are used: USD 45 million for transferable research assets, USD 105 million for a repeatable field demonstrator, USD 230 million for a proven commercial service and USD 430 million for a scaled platform. Probabilities of 20, 35, 30 and 15 percent produce a weighted value of USD 179.25 million. This is an illustration of method, not a market valuation.
The model should vary paid utilisation, revenue per day, system availability, repeat-order rate, gross contribution, customer concentration, fleet capital and funding need. A high sensitivity result with weak utilisation should not command the same value as a slightly lower-performing system embedded in a repeatable customer workflow.
Transaction or financing structure can protect against uncertainty. Capital can be tranched against field evidence, customer acceptance, repeat orders and fleet economics. Secondary value should remain separate from primary capital needed to complete the plan.
18 Implement a ninety-day commercial operating system
The first thirty days should freeze the evidence base. Management reconciles systems, configurations, field results, customer contracts, pipeline, revenue, cash, intellectual property, suppliers and people. It defines the controlled detection envelope and removes unsupported claims from sales material.
Days thirty-one to sixty should build the commercial system. The company creates a use-case qualification tool, standard field protocol, site model, quality checks, pricing calculator, contract schedule, delivery scorecard and evidence repository. Finance connects each project to paid days, direct cost, acceptance and cash.
Days sixty-one to ninety should run a complete dry run. A representative opportunity moves from qualification through proposal, site planning, mobilisation, measurement, interpretation, report, acceptance, invoice and evidence capture. The team records delays, rework, approvals and data gaps.
Governance should assign owners. Technical leadership controls the detection envelope. Operations owns availability and field quality. Commercial leadership owns qualified pipeline and pricing. Finance owns unit economics and cash. Legal and security own data, contracts and controlled access. The board approves expansion when evidence meets agreed thresholds.
The operating system should continue after the initial programme. Monthly reviews reconcile fleet capacity, paid utilisation, quality, customer acceptance and cash. Quarterly reviews update the validated envelope, roadmap and capital plan. Every field result should improve the next decision.
Conclusion
Quantum gravimetry has credible scientific and field evidence for infrastructure detection. The commercial market remains a system-building challenge. Customers require a reliable answer to a defined subsurface question, delivered within site, schedule, safety and procurement constraints.
A strong company connects physics to a controlled detection envelope, representative surveys, productive field operations, disciplined interpretation and customer acceptance. It integrates records and complementary methods, prices a decision-useful service, preserves evidence and expands fleet capacity only when utilisation supports it.
The investment case should follow that evidence. Sensitivity creates technical possibility. Repeatable survey productivity, system availability, accepted reports, repeat orders and collected cash create commercial value. A financing plan built around those milestones gives management and investors a practical route from research achievement to a durable infrastructure-sensing business.
Appendix A Field-survey protocol
Define the customer decision, target hypothesis, site conditions, reference information, coordinate system, detection threshold and acceptance criteria before mobilisation. Record system configuration, calibration, environmental conditions, station coordinates, integration time, repeats, rejected observations and operator actions. Complete field quality control before demobilisation.
Preserve raw data, corrections, site models, inversion settings, alternative interpretations and final report. Compare later excavation or complementary evidence with the result. Use the outcome to update the controlled detection envelope.
Appendix B Minimum commercial evidence schedule
Maintain a register of controlled-site results, representative field surveys, multi-unit repeatability, customer-observed trials, paid projects, accepted reports, repeat orders and collected cash. For each item record the system, crew, protocol, target, environment, result, confidence, customer decision and reuse rights.
Separate technical success from commercial conversion. A valid result can still reveal an unattractive delivery cost or sales cycle. An order can still be non-repeatable when it depends on grant support or exceptional customer effort.
Appendix C Unit-economics controls
Reconcile available days to paid days and project records. Reconcile revenue to contracts, acceptance, invoices and cash. Allocate field labour, travel, maintenance, processing, interpretation, depreciation, warranty and rework consistently. Review assumptions monthly and preserve changes with an owner and reason.
Stress utilisation, price, downtime, crew cost, processing time, fleet capital and customer concentration. Report downside liquidity and actions alongside the central case.
Appendix D Commercial evidence ledger
For each use case record the target, decision, current method, customer, evidence state, delivered result, economics, repeat potential and remaining limitation. The ledger should connect product development, sales qualification, field delivery and financing.
The board should distinguish observed results, calculated measures and hypothetical assumptions. It should remove claims that cannot be traced to controlled evidence.
Appendix E Decision figures and tables
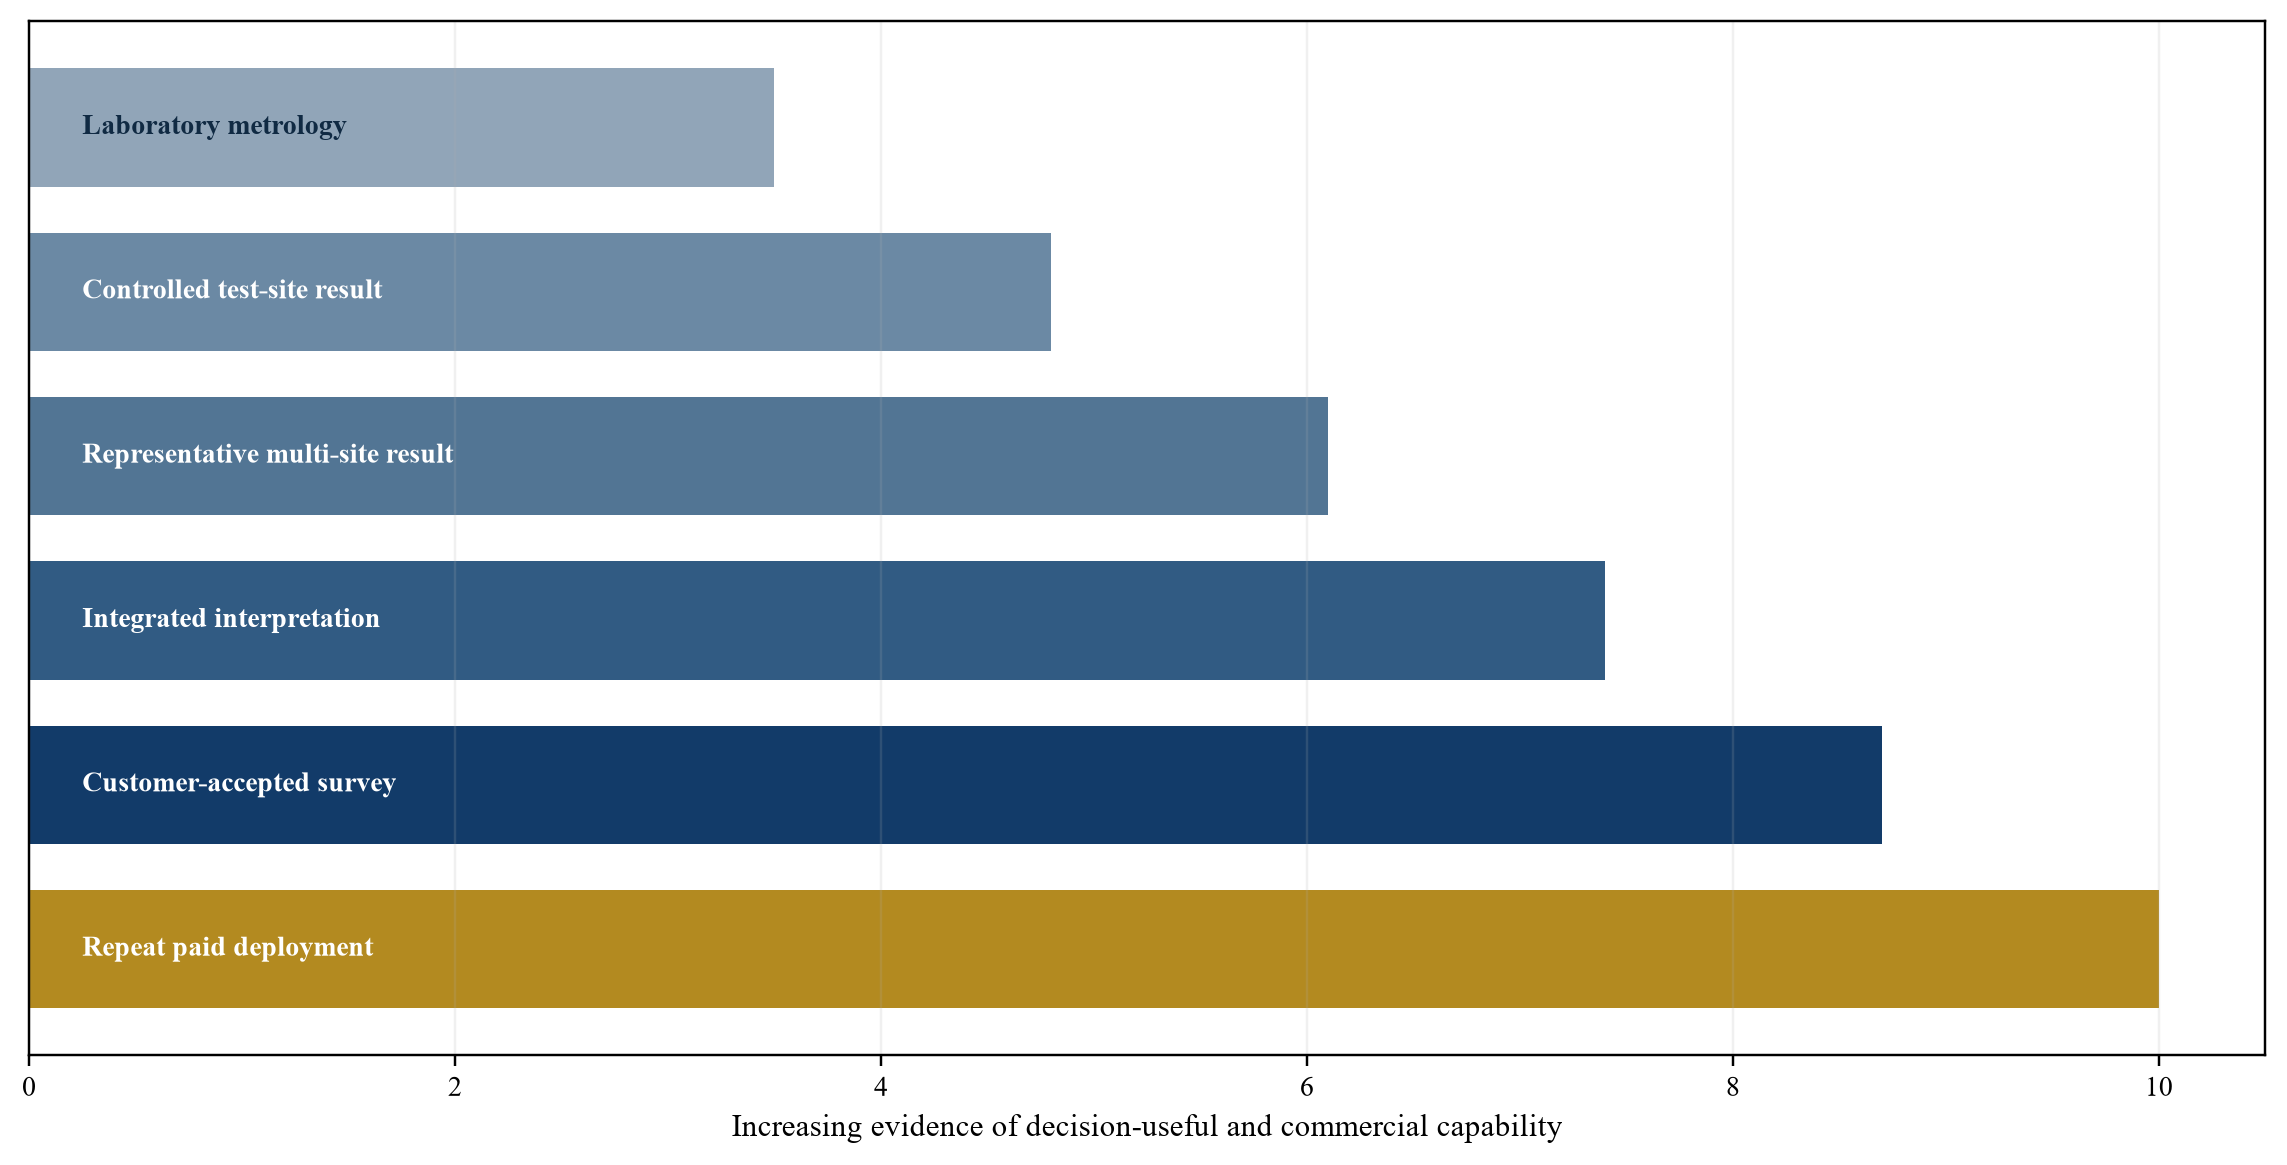
Proposed progression from controlled metrology to repeat paid deployment.
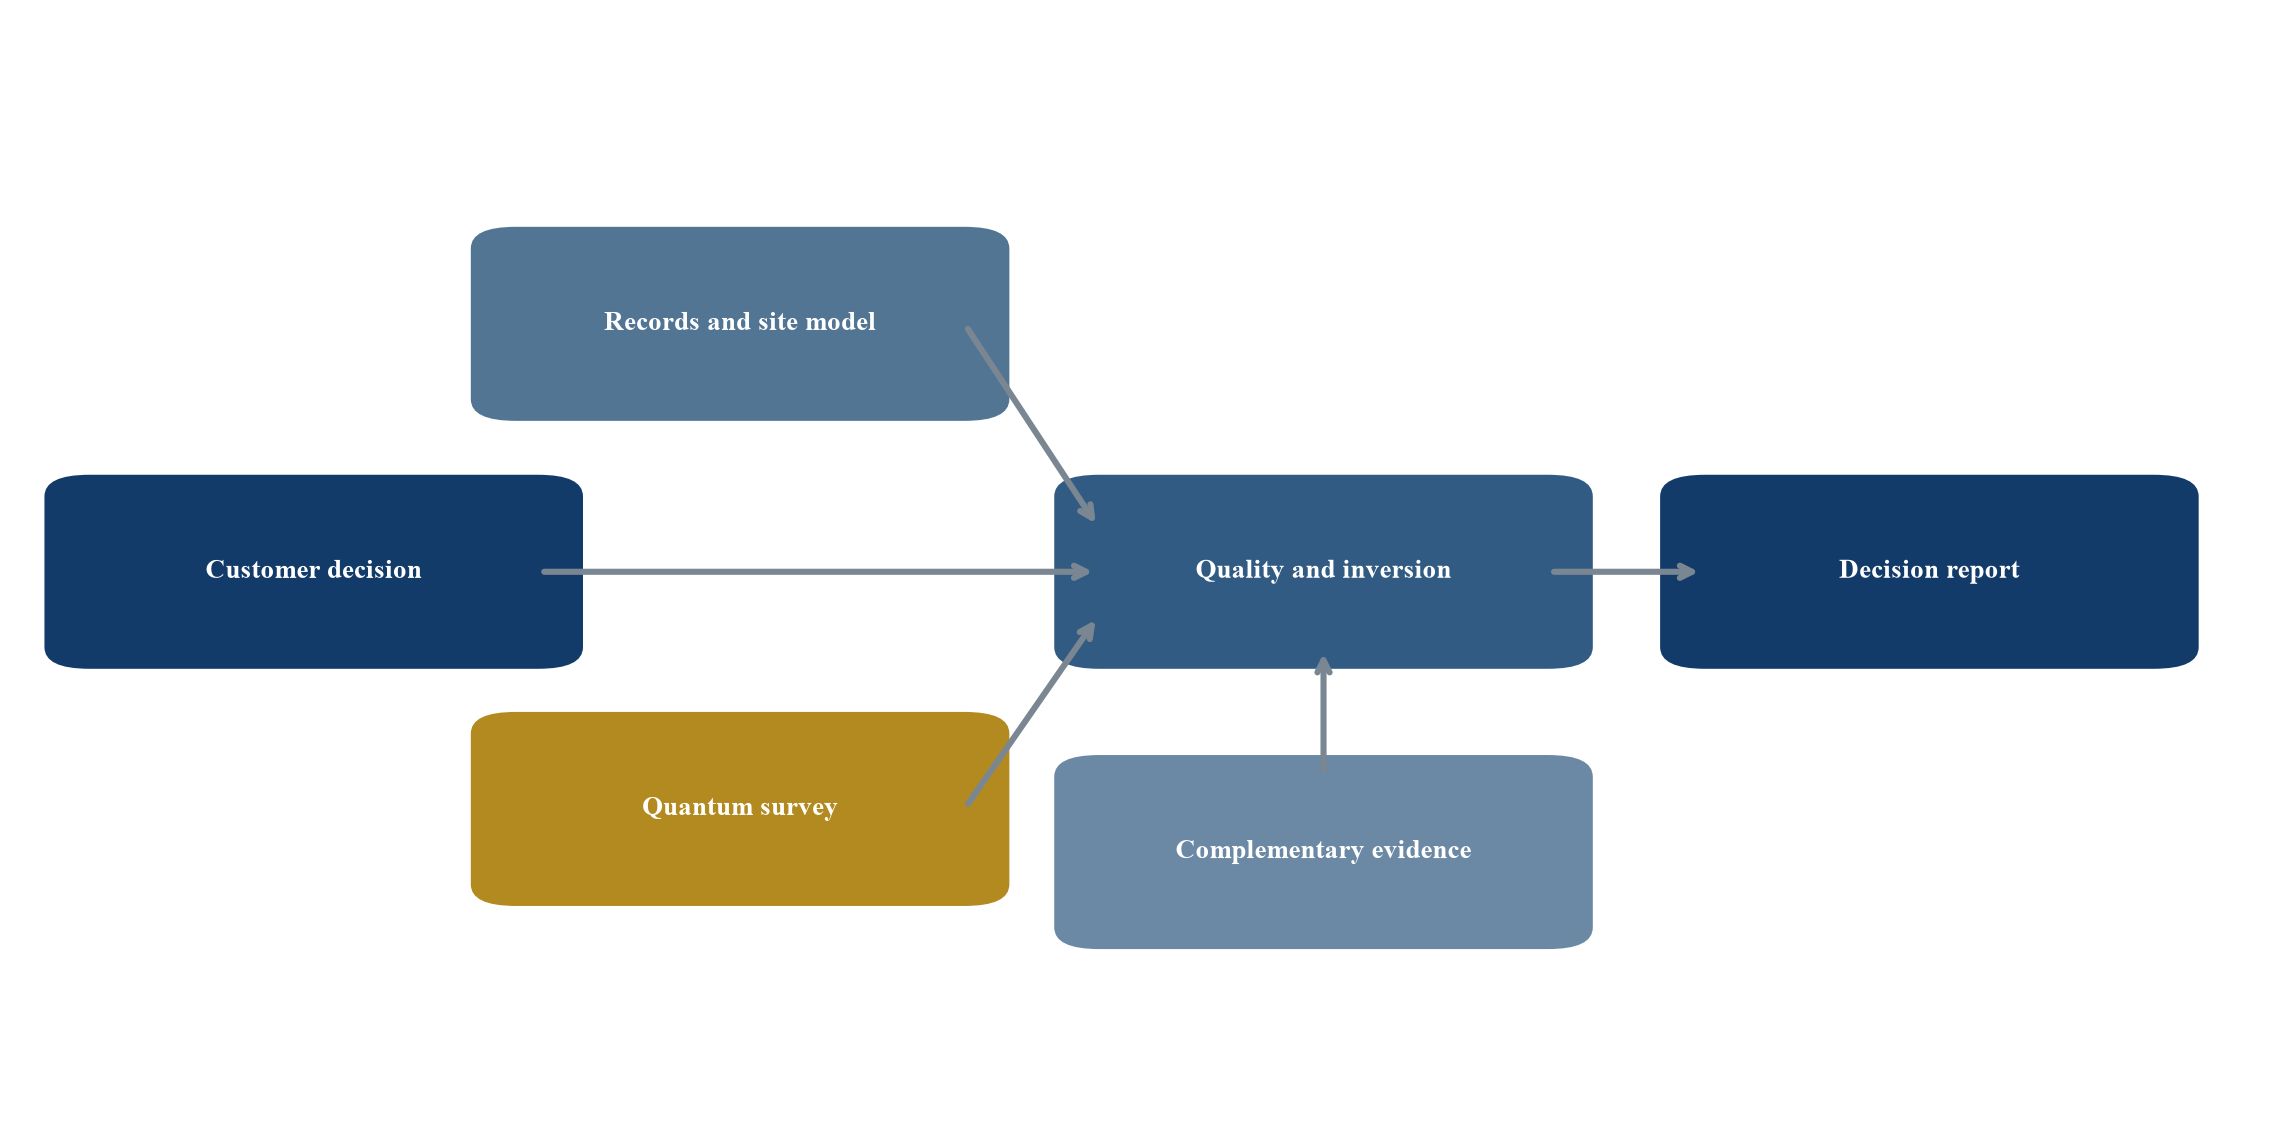
The commercial product combines records, sensing, interpretation and decision support.
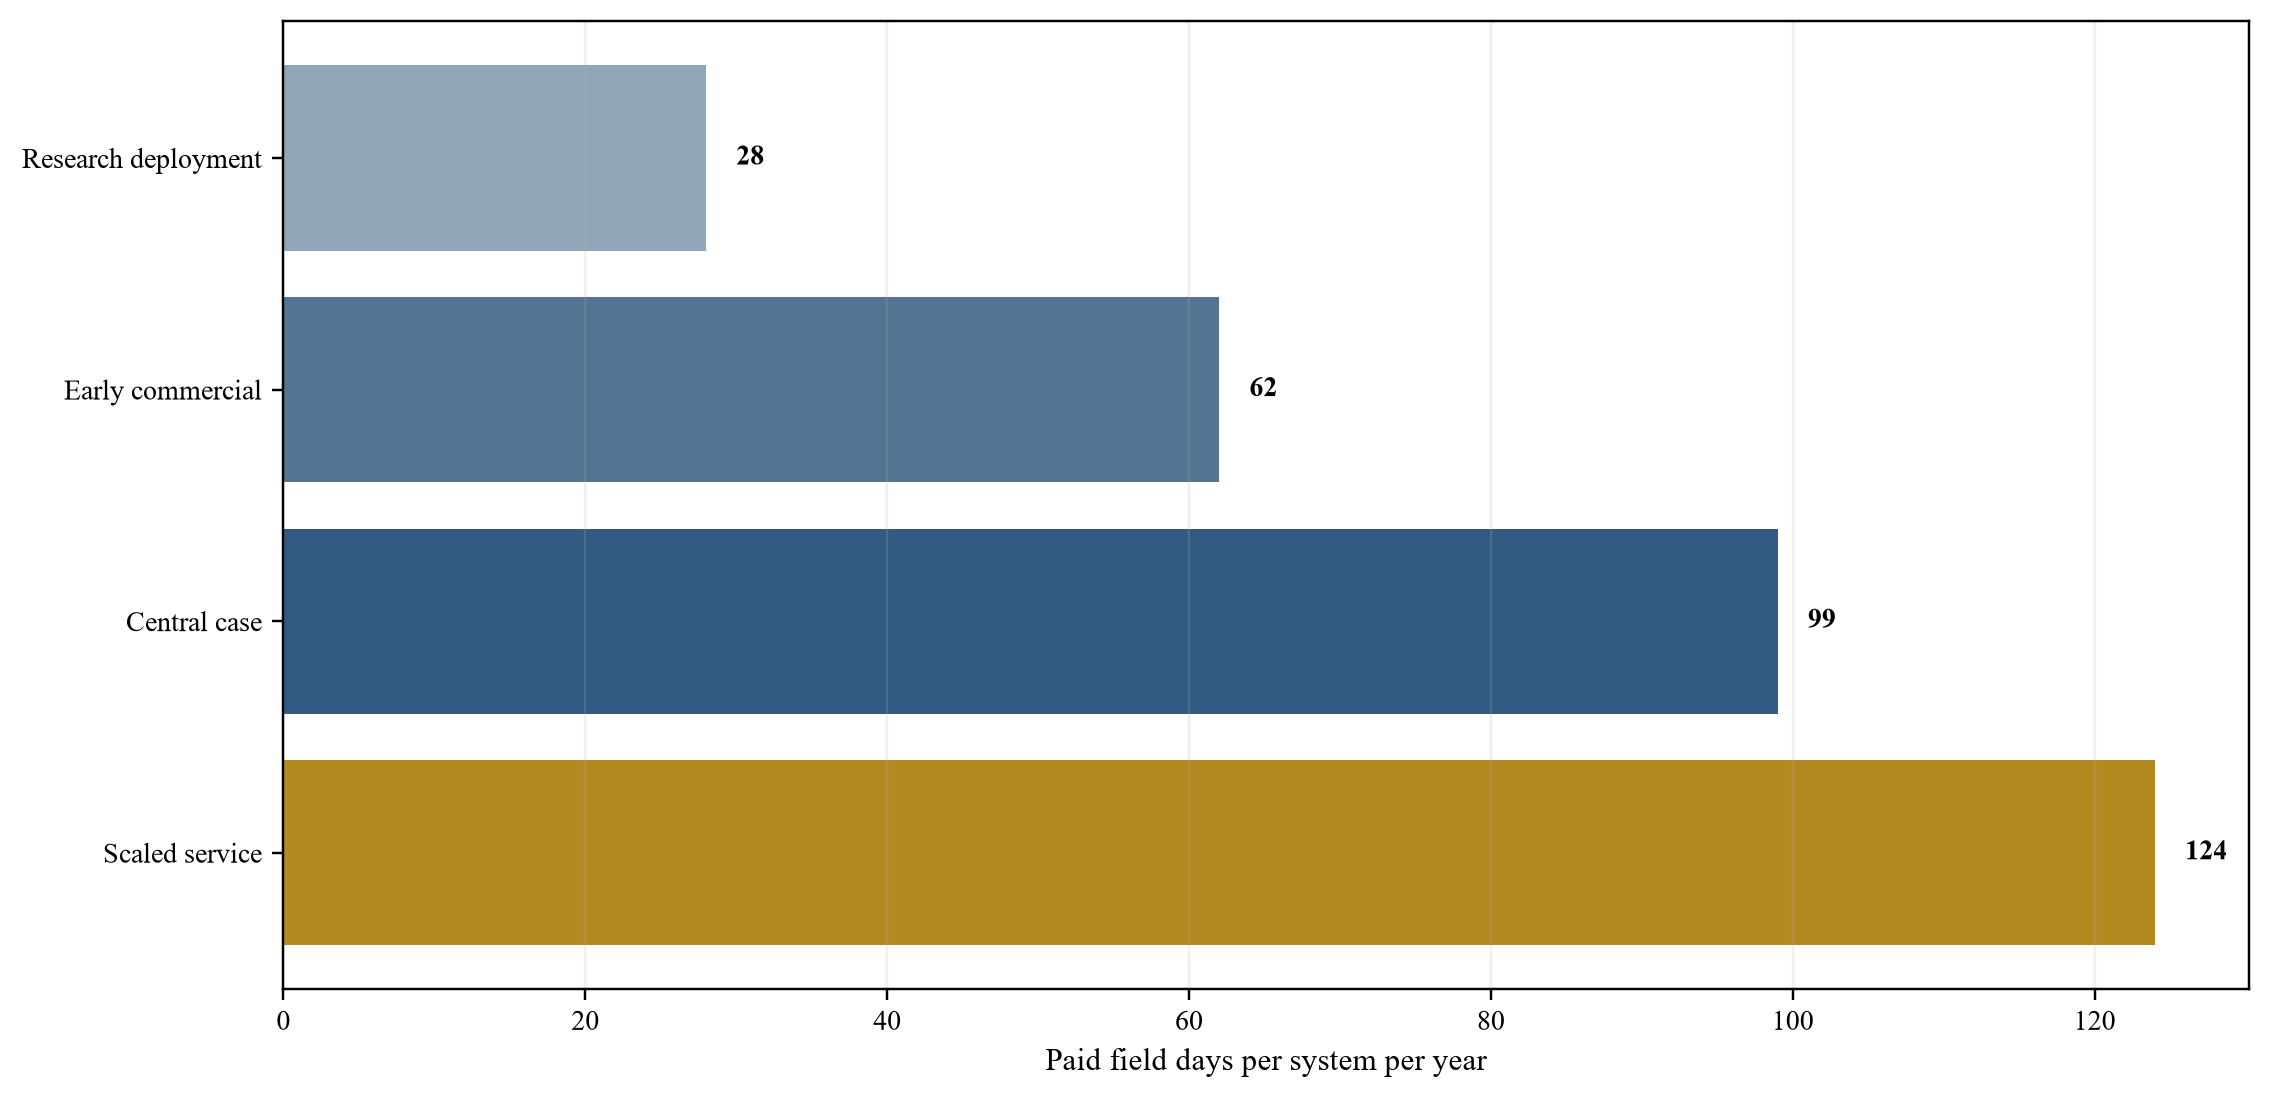
Wholly hypothetical assumptions; paid field days per system per year.
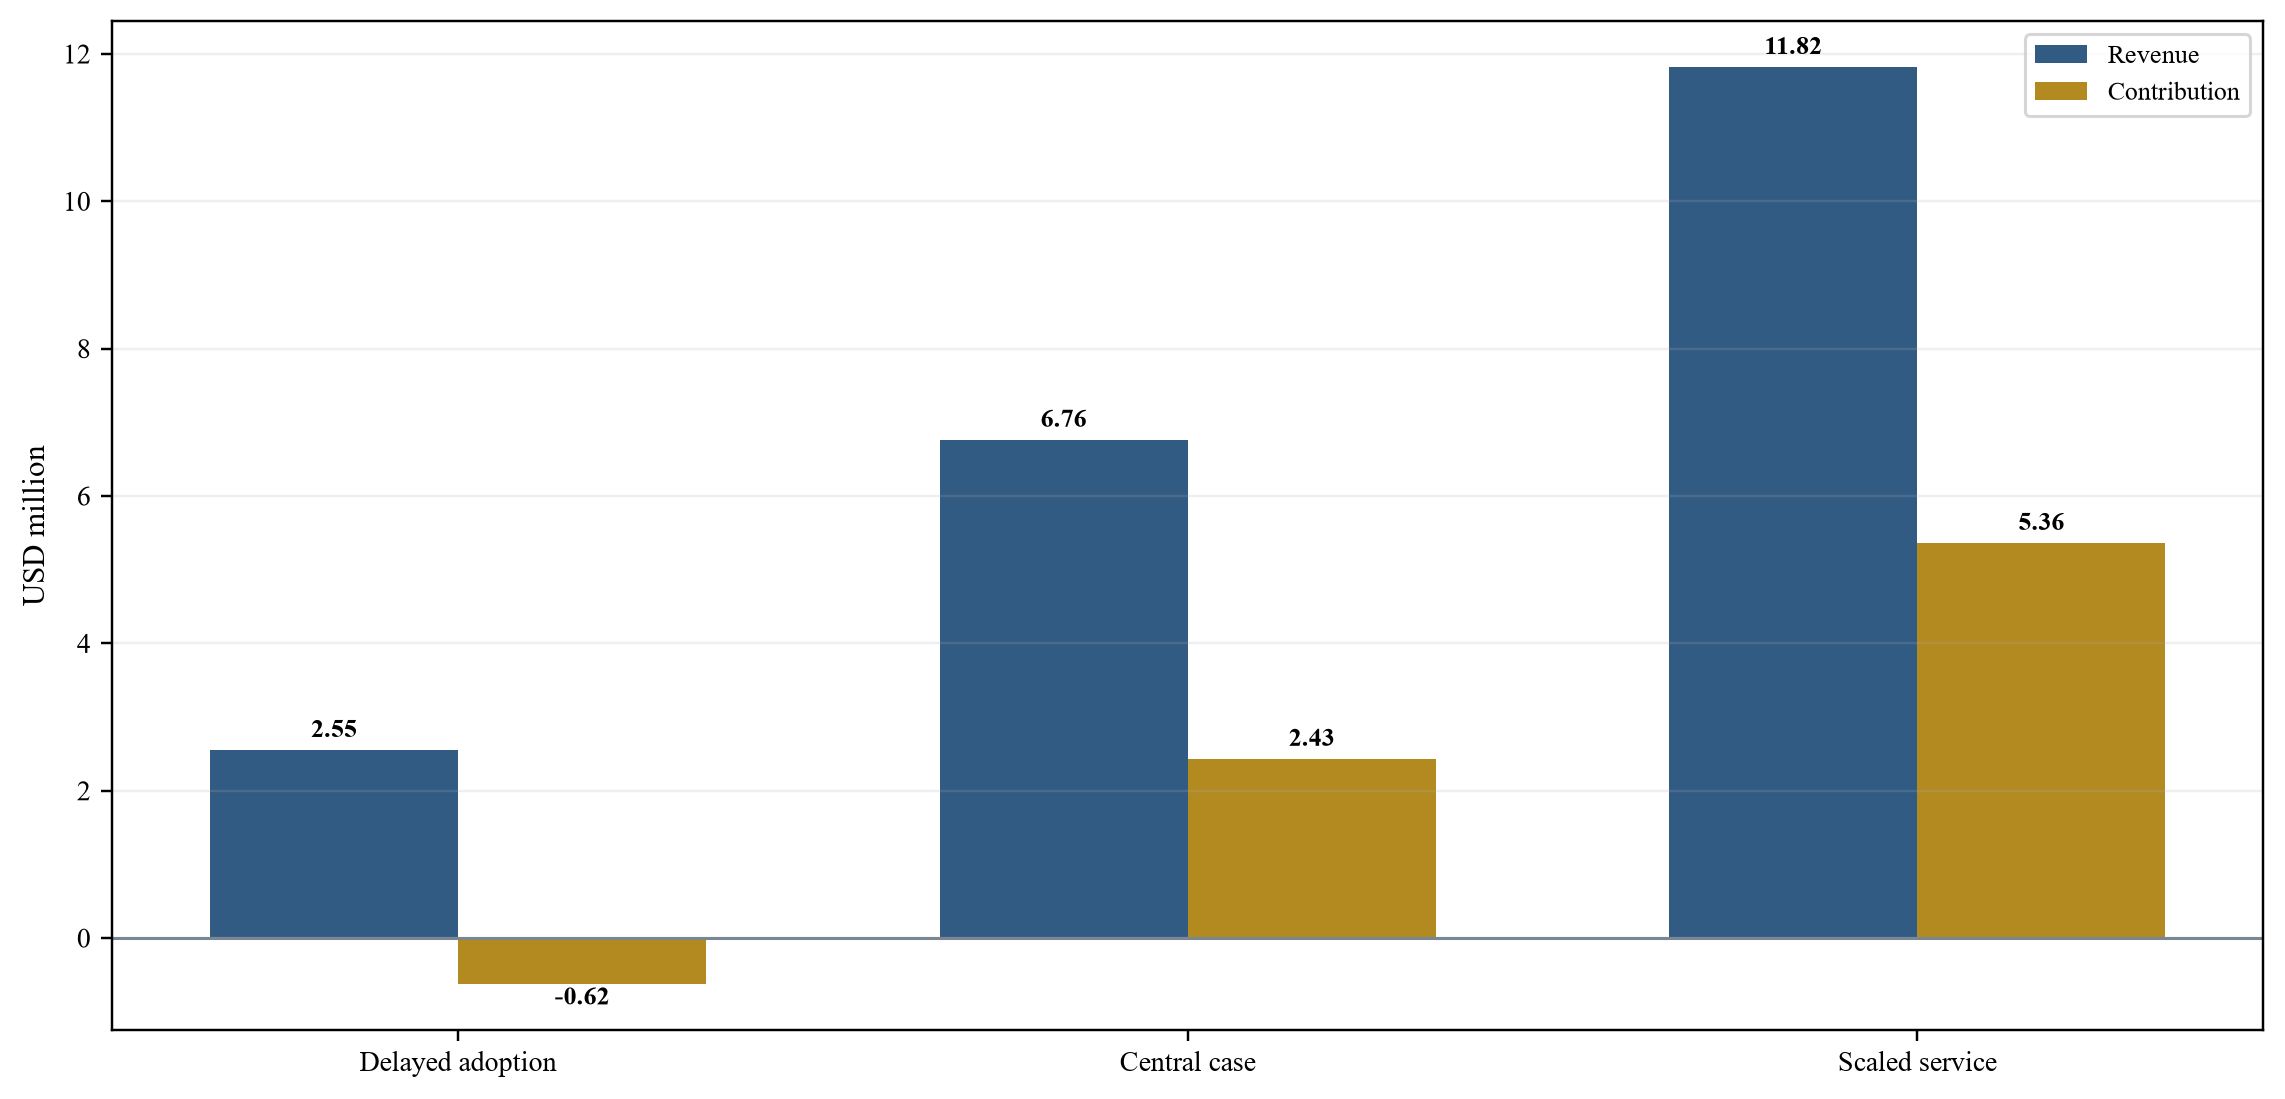
Wholly hypothetical assumptions; USD million.
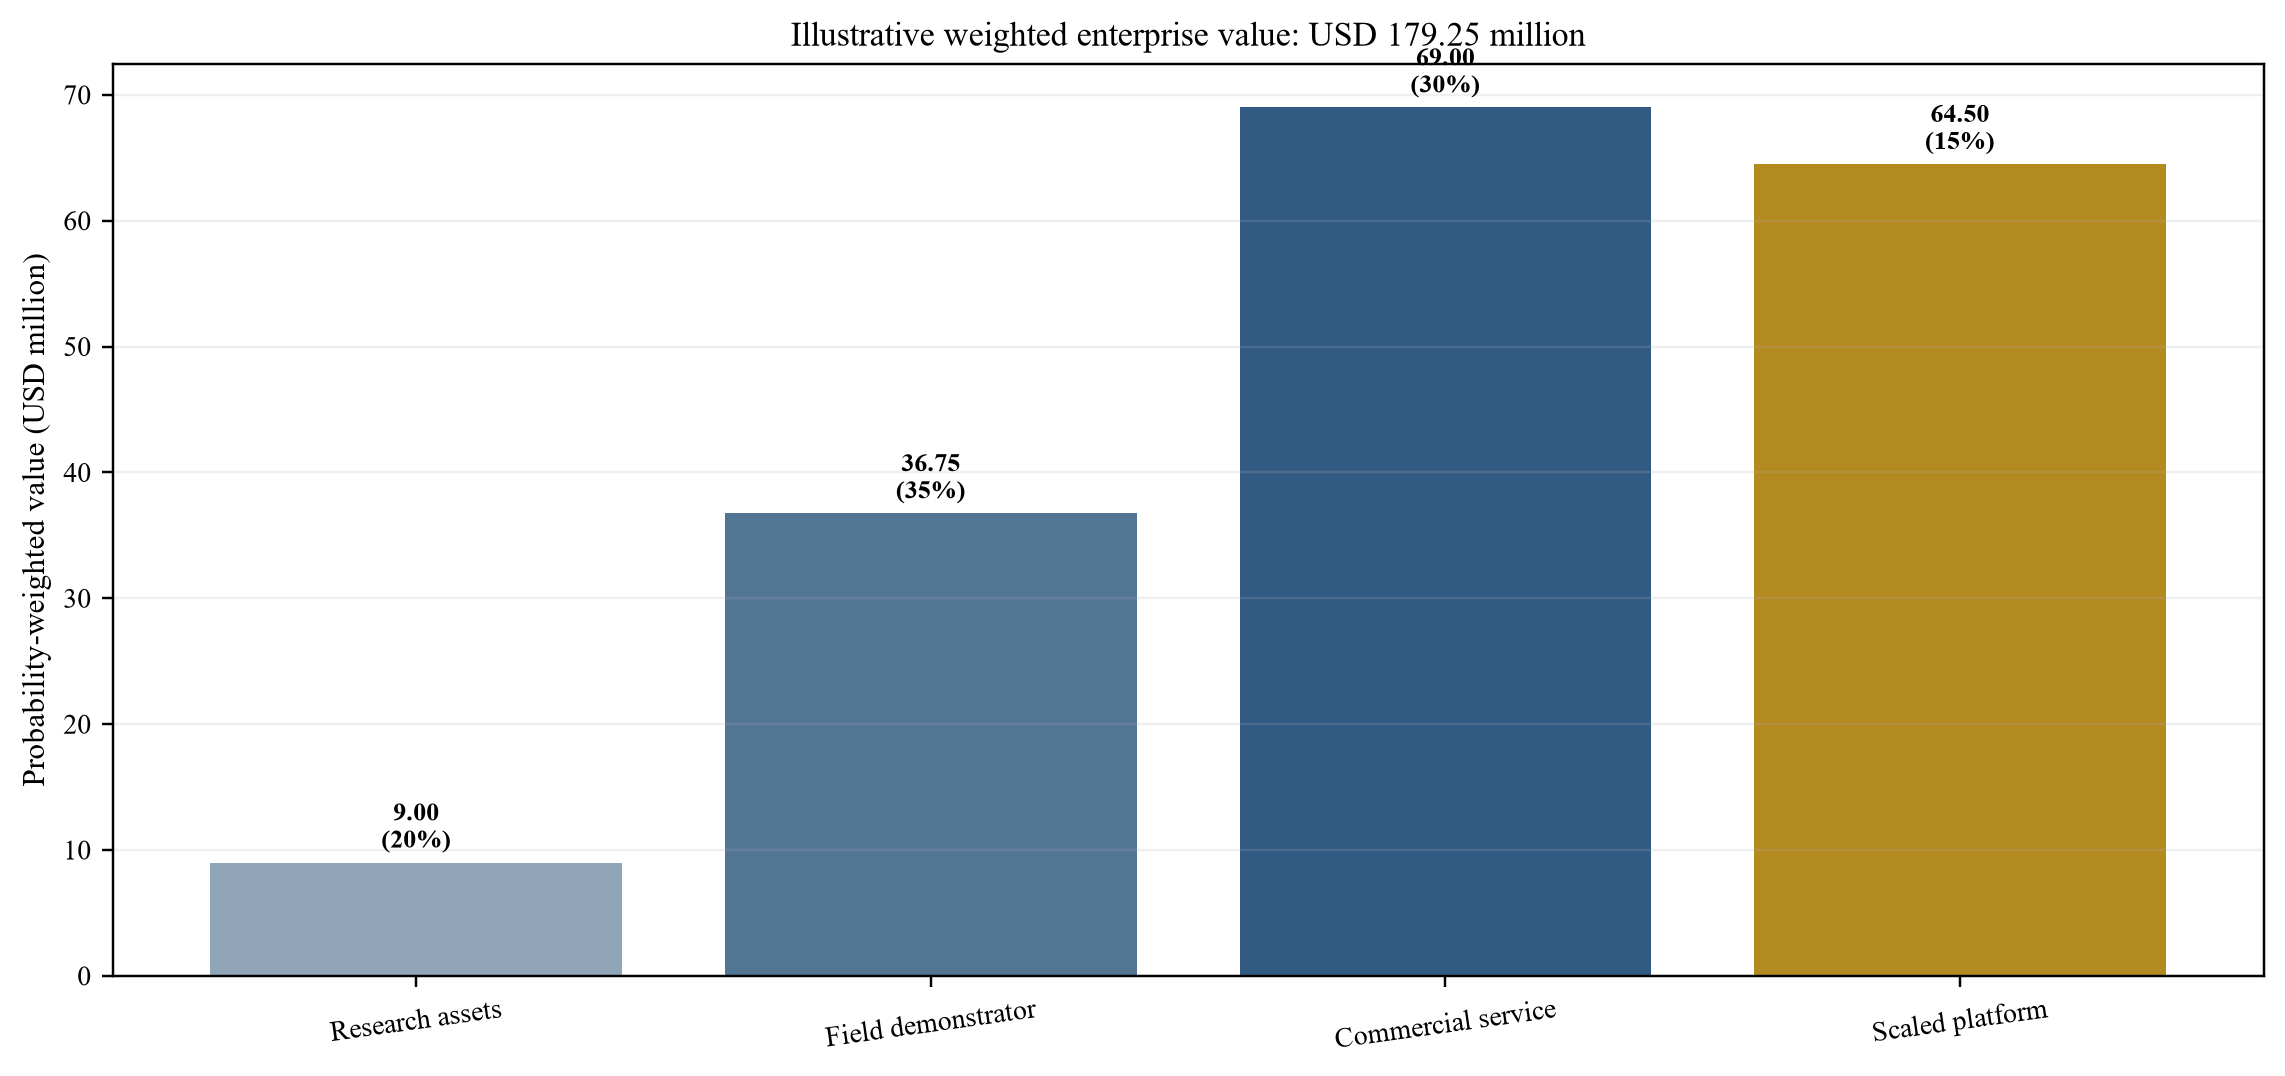
Wholly hypothetical assumptions; USD million.
| Level | Required evidence | Principal residual risk | Capital treatment |
|---|---|---|---|
| Laboratory metrology | Calibrated instrument and defensible physics | Field performance unproved | Research capital |
| Controlled test site | Known target and repeatable protocol | Representative conditions | Product-development capital |
| Representative field result | Customer-relevant target and ordinary site noise | Multi-site repeatability | Milestone capital |
| Integrated interpretation | Site model, inversion and decision-ready report | Acceptance and liability | Commercial validation capital |
| Customer-accepted survey | Paid work and documented acceptance | Repeat demand and margin | Working capital |
| Repeat paid deployment | Multiple customers, crews and systems | Concentration and scaling | Growth capital |
Proposed financing and operating classification.
| Dimension | Required evidence | Common weakness | Decision question |
|---|---|---|---|
| Target | Geometry, depth and density hypothesis | Undefined object of interest | Is the target physically detectable? |
| Site | Access, terrain, noise and records | Laboratory assumptions applied to field | Can the protocol operate here? |
| Decision | Named action and evidence threshold | Interesting data without owner | What changes after the survey? |
| Alternative | Current methods and unresolved gap | Quantum method treated as universal | Why is this method additive? |
| Economics | Survey cost, avoided work and timing | Broad market value attributed to one job | Who pays and why? |
| Validation | Truth data or complementary evidence | No route to verify outcome | How will learning be captured? |
Proposed commercial qualification; thresholds should match the validated detection envelope.
| Measure | Definition | Failure signal | Management response |
|---|---|---|---|
| Available days | Scheduled days after maintenance and training | Fleet unavailable when demanded | Reliability and spares plan |
| Paid utilisation | Paid field days divided by available days | Capacity added before demand | Gate fleet expansion |
| Stations per shift | Accepted measurement locations per shift | Slow moves or excessive repeats | Redesign workflow |
| First-pass data yield | Accepted observations without revisit | Site rework | Improve field quality control |
| Report turnaround | Time from demobilisation to accepted report | Interpretation bottleneck | Automate and train reviewers |
| Repeat order rate | Customers buying again within stated period | Trial dependency | Review decision value and pricing |
Proposed operating measures for each system and crew.
| Metric | Per system | Three-system fleet |
|---|---|---|
| Available field days | 138 | 414 |
| Paid utilisation | 72% | 72% |
| Paid field days | 99 | 298 |
| Average field revenue per paid day | 18,500 | 18,500 |
| Field revenue | 1,831,500 | 5,513,000 |
| Interpretation and data revenue | 256,000 | 772,000 |
| Mobilisation and other revenue | 160,000 | 475,000 |
| Total revenue | 2,247,500 | 6,760,000 |
Wholly hypothetical management assumptions; USD except days and percentages.
| Scenario | Paid utilisation | Revenue | Contribution before central overhead | Principal condition |
|---|---|---|---|---|
| Delayed adoption | 38% | 2.55 | -0.62 | Trials do not convert and fleet remains underused |
| Central case | 72% | 6.76 | 2.43 | Three systems deliver accepted repeat work |
| Scaled service | 81% | 11.82 | 5.36 | Five systems, partner channels and recurring programmes |
Wholly hypothetical management assumptions; USD million except utilisation.
| Scenario | Evidence state | Enterprise value | Probability | Weighted value |
|---|---|---|---|---|
| Research assets | Transferable science, IP and team | 45 | 20% | 9.00 |
| Field demonstrator | Repeatable representative surveys | 105 | 35% | 36.75 |
| Commercial service | Paid utilisation, acceptance and contribution | 230 | 30% | 69.00 |
| Scaled platform | Repeat customers, fleet reliability and partner delivery | 430 | 15% | 64.50 |
| Total | Probability-weighted enterprise value | 100% | 179.25 |
Wholly hypothetical management assumptions; USD million.
| Decision question | Minimum evidence | Owner | Gate |
|---|---|---|---|
| Is the customer decision defined? | Target, site, action and evidence threshold | Commercial and technical leads | Opportunity qualification |
| Does the sensor perform in the validated envelope? | Controlled protocol, raw data and reference evidence | Technical committee | Product claim |
| Can a crew deliver productively? | Availability, paid days, yield and turnaround | Operations leadership | Fleet expansion |
| Does the work create repeat demand? | Acceptance, repeat orders and collected cash | Commercial leadership | Growth hiring |
| Are data and contracts controlled? | Rights, security, safety and liability review | Legal and security leads | Contract approval |
| Can downside liquidity be funded? | Cash runway, committed work and staged actions | Board and finance | Capital release |
Proposed governance control.
Sources
- Government Digital Service, Department for Science, Innovation and Technology and Geospatial Commission. National Underground Asset Register. Updated 27 April 2026. Read the primary source
- Health and Safety Executive. Avoiding danger from underground services HSG47. 2014. Read the primary source
- Health and Safety Executive. Electrical safety on construction sites. 2022. Read the primary source
- Stray, B. et al. Quantum sensing for gravity cartography. Nature 602, 590-594. 2022. Read the primary source
- UK Research and Innovation. Winners of Contracts for Innovation quantum funding announced. 11 November 2025. Read the primary source
- Department for Science, Innovation and Technology. Government support to get quantum to work faster. 2025. Read the primary source
- European Commission CORDIS. Field Quantum Gravity Sensors project FIQUgS. 2026. Read the primary source
- European Commission CORDIS. EQUIP-G European Quantum Infrastructure Project for Gravimetry. 2026. Read the primary source
- National Institute of Standards and Technology. Cold Core Technology Platform. 2026. Read the primary source
- University of Birmingham. Quantum sensor for gravity gradiometry successfully validated at sea. 2023. Read the primary source
- UK Research and Innovation. UK Quantum Technologies Challenge Project Directory. 2025. Read the primary source
- Data Use and Access Act 2025. Explanatory Notes Part 3 National Underground Asset Register. 2025. Read the primary source
- University of Birmingham. Sensor breakthrough paves way for map of the world under the Earth's surface. 23 February 2022. Read the primary source
- Defence Science and Technology Laboratory. Sensing defence science and technology capability. 2022. Read the primary source
- Department for Science, Innovation and Technology. National Quantum Strategy. Updated 14 December 2023. Read the primary source
- Department for Science, Innovation and Technology. National Quantum Strategy Missions. Updated 14 December 2023. Read the primary source
- UK Research and Innovation. Quantum sensing for the real world. 2025. Read the primary source
- European Commission CORDIS. Developing and deploying a network of quantum gravimeters in Europe. 2024. Read the primary source
- European Commission. European Quantum Strategy. 2025. Read the primary source
- National Institute of Standards and Technology. Turning Atoms Into Waves to Measure Gravity and Acceleration. 2026. Read the primary source
- Geospatial Commission. Future of the subsurface. 2024. Read the primary source
- Geospatial Commission. Unlocking the Power of Location the UK's geospatial strategy 2020 to 2025. 2020. Read the primary source
- Geospatial Commission. Getting to the Point accelerating EV chargepoint rollout through geospatial data. 2022. Read the primary source
- Health and Safety Executive. Directional drilling avoids trenching. 2026. Read the primary source
- UK Research and Innovation. Exploring commercial applications of quantum technologies competition results. 2017. Read the primary source
- University of Birmingham. Quantum Gravity Gradiometers for Urban Underground Mapping. 2024. Read the primary source
- Antoni-Micollier, L. et al. Detecting Volcano-Related Underground Mass Changes With a Quantum Gravimeter. Geophysical Research Letters 49. 2022. Read the primary source
- UK Research and Innovation. Economic impacts from EPSRC investments in curiosity-driven research 2025 to 2026. 2025. Read the primary source
- International Financial Reporting Standards Foundation. IAS 38 Intangible Assets. 2026. Read the primary source
- International Financial Reporting Standards Foundation. IFRS 15 Revenue from Contracts with Customers. 2026. Read the primary source
- World Intellectual Property Organization. PATENTSCOPE patent search. 2026. Read the primary source
- United States Department of Commerce Bureau of Industry and Security. Export Administration Regulations. 2026. Read the primary source
