

Introduction
Electricity grids are carrying a larger economic burden. Demand is rising, generation is becoming more distributed and variable, and new loads can develop faster than network infrastructure. Data centres, industrial projects, electric vehicles and heating can appear within one to three years. Major grid projects often require five to fifteen years from planning to completion [2]. The mismatch creates connection queues, congestion, curtailment and pressure on reliability.
The International Energy Agency reports that more than 2,500 GW of renewable generation, storage and large loads remain stalled in connection queues worldwide. It estimates that annual grid investment needs to increase by roughly 50 percent by 2030 from about USD 400 billion [1]. The IEA's 2026 grid analysis also states that capacity must increase by at least 30 percent by 2035, equivalent to adding or replacing 25 million kilometres of lines [3]. These estimates describe the scale of the requirement. They do not determine which projects are efficient or how customers should pay.
Regulation must reconcile four duties. Networks need enough predictable revenue to finance timely investment. Customers need protection from inefficient expenditure and poor delivery. Operators need incentives to use existing assets well before building new ones. Governments need resilience against physical, cyber and supply-chain disruption. A conventional cost-of-service allowance can support financeability, but it can reward expenditure without proving outcomes. A narrow efficiency target can suppress necessary investment. A performance regime can distort behaviour when its metrics are weak or its penalties exceed controllable risk.
This paper addresses the design of a coherent incentive system. It covers transmission and distribution, regulated and publicly owned utilities, advanced and emerging markets, and digital as well as physical modernisation. It distinguishes public evidence from hypothetical author modelling. It does not recommend a price control or allowed return for a named jurisdiction.
1 Define resilience as a service outcome
Resilience describes the ability of a power system to anticipate, absorb, adapt to and recover from disruption. The term becomes useful for regulation only when it is translated into observable service outcomes. Asset hardening, automation and digital platforms are inputs. Restoration time, critical-load continuity, energy not supplied and recovery of secure operations are outcomes.
A resilience obligation should identify the hazards within scope. Weather, wildfire, flooding, heat, equipment failure, fuel interruption, cyberattack, telecommunications loss and supply-chain delay require different controls. A network cannot eliminate every interruption. The obligation should state the level of service expected under defined conditions and the evidence required to demonstrate preparedness.
Baseline obligations should remain enforceable without incentive payments. Compliance with safety standards, cyber controls, maintenance duties and minimum reliability should not depend on a bonus. Rewards should apply to performance above the baseline or to accelerated delivery of a clearly valued capability. Penalties should apply to controllable underperformance, subject to exclusions and audit.
2 Separate reliability, resilience and capacity
Reliability measures ordinary continuity of supply. Resilience addresses severe or unusual disturbances and the speed of recovery. Capacity measures the network's ability to accommodate generation and demand. The categories interact, but a single metric cannot represent all three.
System Average Interruption Duration Index and System Average Interruption Frequency Index can describe average customer experience. They may understate a low-frequency event with severe regional consequences. Energy not supplied can capture the volume effect, but it may not reflect the social value of hospitals, water systems, communications or emergency services. Available transfer capability can show network headroom, yet it does not establish whether that headroom is located where customers need it.
The scorecard should preserve separate measures. A utility might earn for reducing ordinary outage duration, maintaining critical-load restoration capability and releasing connection capacity through dynamic line ratings or advanced conductors. The regulator can then value each outcome, apply an exposure limit and prevent one strong result from masking failure elsewhere.
3 Map the investment need before setting incentives
An incentive cannot repair a weak network plan. The utility should begin with demand, generation, asset-health, hazard and connection scenarios. FERC Order No. 1920 requires long-term regional transmission planning with at least a twenty-year horizon, a minimum of three scenarios and reassessment at least every five years [5]. The European Commission's guidance on anticipatory investment similarly supports forward-looking network development where current connection requests do not capture future need [9].
The plan should identify the need date, location, uncertainty and consequence of delay. It should compare conventional reinforcement, non-wire alternatives, operating changes, storage, flexible connection, demand response and grid-enhancing technologies. An option should enter the regulated programme when its expected system value remains credible across a defined range of scenarios.
Scenario planning also supports financing. A lender or bond investor can see why expenditure is needed, when it enters the asset base, how cost recovery works and which completion risks remain. The analysis should distinguish committed projects from contingent options and should identify approval gates for each stage.
4 Build an incentive stack rather than one bonus
A complete framework uses several instruments because grid outcomes have different risk profiles. Base revenue funds efficient operation, maintenance and an agreed investment programme. Price-control deliverables release or retain revenue when specified assets or capabilities are delivered. Output incentives adjust revenue for measured service performance. Innovation allowances support trials whose benefits or costs are uncertain. Reopeners and uncertainty mechanisms address material changes that were not reasonably fixed at the start of the control.
Ofgem's RIIO-3 electricity-transmission framework includes licence obligations, price-control deliverables, use-it-or-lose-it allowances, output-delivery incentives, the Totex Incentive Mechanism and the Network Asset Risk Metric [12]. This layered structure recognises that a statutory obligation, a major substation, a reliability outcome and an innovation project require different treatment.
The incentive stack should state the hierarchy. Mandatory obligations come first. Deliverable funding follows approved scope and evidence. Performance adjustments use measured outcomes. Innovation funding remains ring-fenced and subject to learning requirements. Efficiency sharing applies after cost and output are tested. The combined exposure should be visible to customers, management and creditors.
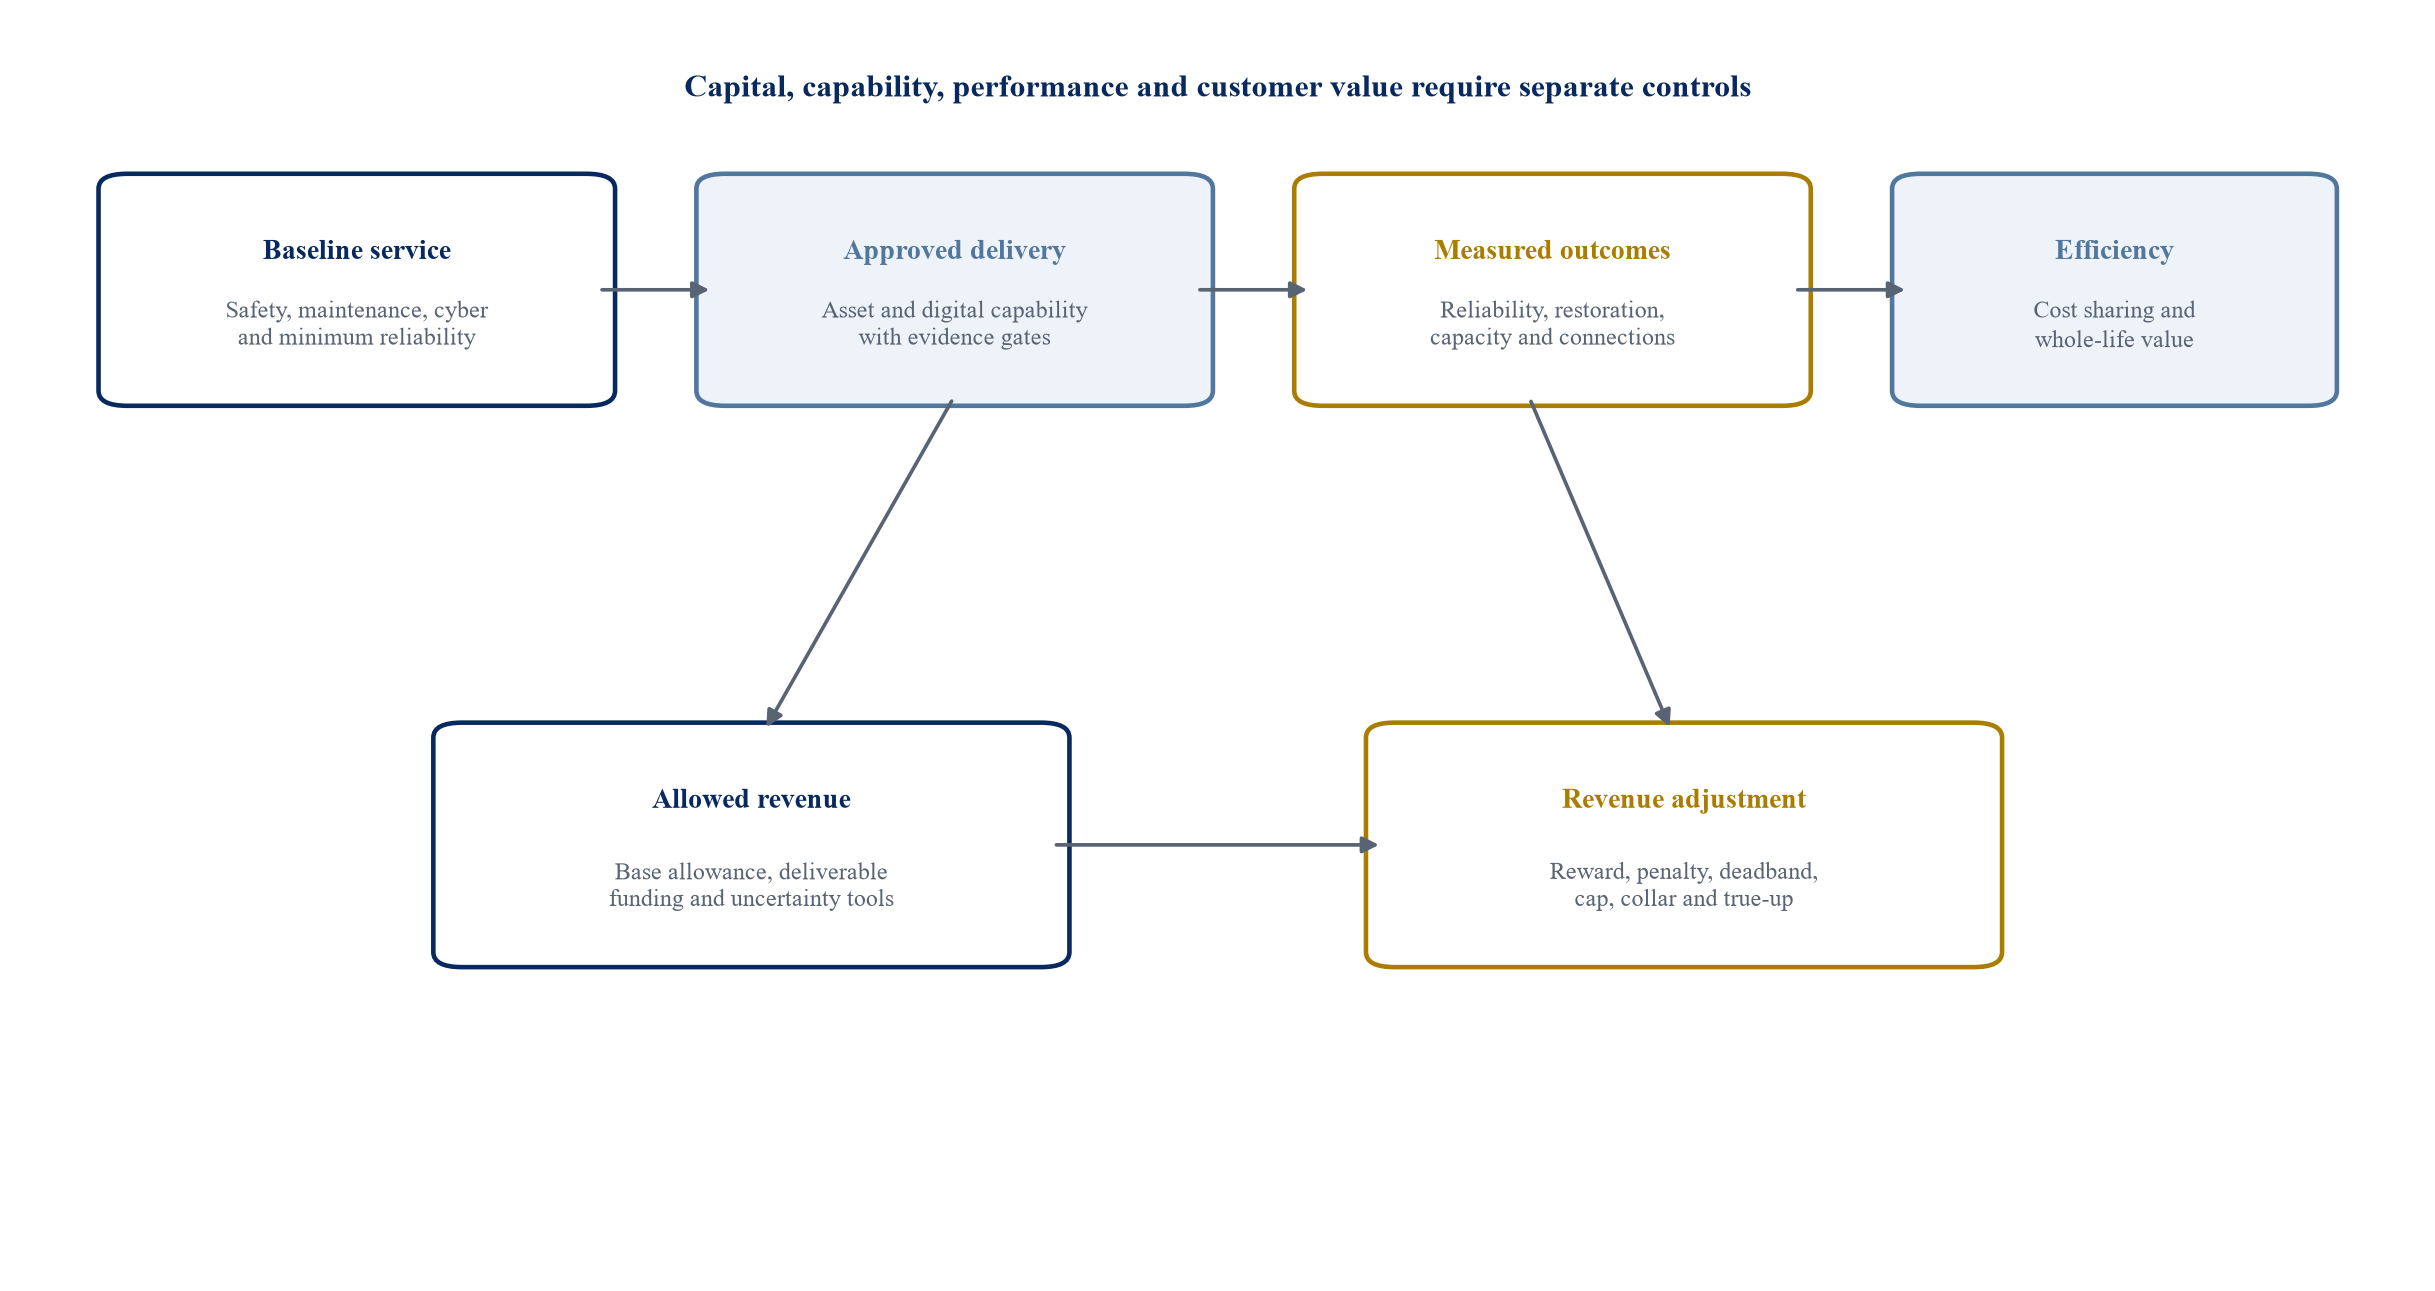
The framework separates mandatory service, approved delivery, measurable outcomes and efficiency sharing. The design is illustrative and should be adapted to local law and market structure.
5 Establish a measurable baseline
Performance incentives depend on the counterfactual. The regulator and utility must agree what performance would have occurred without the modernisation programme. Historic averages can be transparent, but they may reward recovery from poor performance or penalise a utility facing a genuine increase in hazard. Engineering models can reflect asset condition and weather, but they introduce modelling discretion.
The baseline should use several years of quality-controlled data, with defined treatment of major events, customer growth, network boundary changes and data gaps. Weather normalisation may be appropriate for ordinary outage metrics. Severe-event resilience should use event classes and scenario tests rather than a simple annual average. Asset-health measures should use consistent condition and failure-consequence definitions.
Independent assurance matters because small methodological choices can move revenue. The baseline document should publish data sources, exclusions, adjustments and restatement rules. Where data quality is immature, the first control period can use shadow calculations and a lower financial weight while the measurement system develops.
6 Choose metrics that the utility can influence
An incentive should reward actions within the utility's control. Wholesale-market prices, extreme hazard intensity and customer equipment failures may influence outcomes without reflecting network performance. A metric can adjust for these factors or use a defined exclusion. The adjustment should remain narrow enough to prevent every poor result from becoming exceptional.
Useful transmission metrics include circuit availability, loss-of-supply event frequency, energy not supplied, network capability released, constraint cost reduction and timely connection capacity. Distribution metrics can include interruption duration and frequency, restoration of critical load, voltage quality, technical and commercial losses, distributed-energy hosting capacity, smart-meter availability and customer connection time.
Cyber and digital metrics require care. Counting software installations says little about operational resilience. Better measures include recovery-time performance, tested restoration of critical systems, coverage of monitored assets, data completeness, model accuracy and closure of high-risk vulnerabilities within approved time limits. Sensitive security evidence can be independently assured without being published in operational detail.
Table 1. Illustrative grid-modernisation incentive matrix
| Outcome | Example measure | Baseline | Reward condition | Principal safeguard |
|---|---|---|---|---|
| Ordinary reliability | Interruption duration and frequency | Weather-normalised multi-year performance | Improvement beyond deadband | Major-event and boundary rules |
| Severe-event resilience | Critical load restored within defined hours | Tested restoration plan and event class | Faster verified restoration | Hazard intensity adjustment |
| Network capability | Additional secure transfer or hosting capacity | Approved power-flow case | Capacity available by need date | Independent system study |
| Connection service | Time from complete application to energisation | Cohort benchmark by complexity | Shorter verified cycle time | Customer-caused delay exclusion |
| Asset health | Monetised risk reduction from interventions | Common condition and consequence model | Delivered risk reduction | Audit of asset data and unit costs |
| Digital operations | Coverage, uptime and tested recovery | Approved digital baseline | Verified operational use and recovery | Cyber assurance and data-quality gate |
| Cost efficiency | Whole-life cost against efficient allowance | Approved totex and output package | Efficient underspend with outputs met | Ex-post review and sharing factor |
| Innovation | Replicable learning and demonstrated benefit | Published project plan | Evidence delivered and adopted | Ring-fencing and knowledge sharing |
Metric choice, weights and exposure depend on the jurisdiction, network function, customer value and data quality.
7 Value customer benefit before setting reward rates
The reward rate should reflect expected customer value. Reliability incentives often use estimates of the value of lost load or customer willingness to pay. A single system-wide value can misstate the effect on different customer classes and critical services. The regulator can use a published range and apply conservative values where evidence is limited.
Capacity incentives should value avoided or deferred reinforcement, reduced congestion, faster connection and improved access to lower-cost generation. The analysis should avoid counting the same benefit twice. A dynamic line rating may release capacity and reduce congestion. The resulting fuel saving and connection value may overlap with benefits already included in a network plan.
Reward sharing should leave customers with a material proportion of verified benefit. A utility can receive enough upside to influence decisions while customers retain most of the value. The regulator should test the aggregate exposure under plausible combinations of metrics because several small rewards can become material when earned together.
8 Use symmetric exposure where evidence supports it
Symmetric incentives pay for improvement and penalise deterioration around a target. They can protect customers when the utility controls performance and the baseline is reliable. Asymmetric rewards may be appropriate for a new capability whose downside is already covered by a licence obligation or deliverable adjustment. Asymmetric penalties may apply where the baseline is mandatory and superior performance has limited incremental value.
Caps and collars constrain annual revenue movement. A deadband avoids paying or penalising immaterial variation. A glide path can increase exposure as data mature. The adjustment formula should remain simple enough for boards, customers and creditors to reproduce.
The utility should not receive a service reward when it materially fails safety, compliance or delivery obligations. A gating rule can suspend rewards after a specified breach. The gate should be precise. A broad discretionary veto can weaken financeability and invite disputes.
9 Protect financeability while preserving discipline
Grid companies fund long-lived assets with debt and equity. Allowed revenue, regulatory-asset treatment and cash timing influence credit metrics. A framework that defers cost recovery, creates unlimited penalties or permits retrospective disallowance can increase financing cost even when the investment is efficient.
Financeability testing should examine funds from operations to debt, interest coverage, debt service coverage where project structures apply, and liquidity under plausible incentive outcomes. It should also test inflation, interest rates, construction delay, cost escalation and the timing difference between expenditure and revenue recovery. The analysis should distinguish accounting return from cash available for debt service.
Customer protection remains part of the same design. Efficient expenditure can enter the regulated asset base only after need, procurement, delivery and output evidence are established. Cost overruns should remain with investors when they arise from controllable inefficiency. Uncontrollable changes can use a defined reopener or ex-post review.
10 Approve anticipatory investment through staged evidence
Anticipatory investment builds ahead of signed connection demand because future need is credible and delay would be costly. The European Commission's 2025 guidance asks regulators and network operators to create conditions for forward-looking investment while protecting affordability [9]. FERC Order No. 1920 similarly requires long-term scenarios and evaluation of broad benefits [5].
A staged approval can release development funding first. The utility then completes routing, land, permitting, engineering, procurement and customer evidence. Construction funding follows when scenarios, need dates and benefit tests remain credible. A final allowance enters the asset base when assets are delivered and available.
Use-it-or-lose-it treatment can prevent unused allowances from becoming permanent revenue. Cancellation rules should allocate efficiently incurred development cost. The utility should not carry every policy or planning reversal, but it should bear costs caused by poor execution or unsupported scope growth.
11 Use price-control deliverables for discrete capabilities
Some modernisation outputs are easier to verify as deliverables than annual performance. A new control centre, substation automation programme, communications network, advanced metering platform or cyber-recovery environment can have defined scope, completion criteria and need dates.
The deliverable should describe the capability, not merely the equipment list. A control platform may need specified asset coverage, availability, interoperability, operator training and disaster recovery. An advanced-metering programme may need communications performance, settlement quality and customer-service integration. Funding should follow verified delivery of the usable capability.
The regulator can apply delayed-delivery adjustments, scope true-ups and output testing. The mechanism should avoid forcing inefficient completion when the underlying need changes. A material change process can replace or cancel the deliverable after transparent evidence and customer-impact analysis.
12 Reward grid-enhancing technologies on delivered capacity
Dynamic line ratings, advanced conductors, power-flow control, topology optimisation and transmission switching can increase the use of existing corridors. FERC Order No. 1920 requires transmission planners to consider grid-enhancing technologies in long-term planning [4]. These options can be faster than new lines, but their value depends on location, weather, operating rules and system integration.
An incentive should measure secure capacity made available and used, subject to reliability constraints. Paying for equipment installation alone can reward technology that never affects dispatch. The baseline power-flow case, operating conditions, outage assumptions and measurement interval should be approved before the project starts.
The revenue model can combine a deliverable payment for installation with an output payment for verified capacity or congestion reduction. A cap can keep total reward below a share of customer benefit. The utility should retain responsibility for cybersecurity, maintenance and operator integration.
13 Treat digital infrastructure as a regulated operational asset
Digital platforms now support forecasting, protection, asset management, outage response, flexible demand and customer connections. DEWA's Smart Grid Strategy to 2035 describes a shift from technology-led deployment toward value-driven implementation [25]. Abu Dhabi's AD.WE platform combines live and historical utility data for network planning, anomaly detection, demand forecasting and resource optimisation [27].
Regulatory treatment should distinguish durable operational capability from ordinary software expense. Capitalisation policy, cloud service contracts, licences, data migration and continuous updates create different cash and risk profiles from physical plant. The framework should prevent repeated capital recovery for short-lived software while allowing necessary investment in secure, interoperable systems.
Benefits should be traced to operational use. Forecast accuracy, faster outage location, reduced inspection cost, improved asset risk decisions and released network capacity can support the business case. Vendor dependence, data sovereignty, cyber exposure and exit cost should be included in procurement and allowance review.
14 Integrate cyber resilience into the price control
Cybersecurity is an operating requirement and a resilience capability. The price control should fund efficient baseline controls, recovery environments, monitoring, training and independent assurance. Sensitive implementation details should remain protected. The regulator still needs enough evidence to determine whether customers received the capability.
Metrics can include recovery-time testing for critical systems, segregation of operational technology, monitored-asset coverage, backup integrity, patch governance and closure of material findings. A raw count of detected events can create perverse incentives because stronger monitoring often identifies more activity.
Penalty exposure should focus on controllable failures to meet approved requirements. A successful external attack does not by itself prove regulatory failure. Weak controls, missed remediation, untested recovery or inaccurate reporting can support an adjustment after independent review. Insurance and government-security support should be mapped separately from allowed revenue.
15 Link asset-health funding to monetised risk reduction
Condition-based asset management directs expenditure toward failure probability and consequence. Ofgem's Network Asset Risk Metric links intervention delivery to changes in monetised network risk [12]. The approach can improve comparability across asset classes when condition, probability and consequence methods are stable.
The utility should provide baseline asset condition, intervention scope, unit cost, expected risk reduction and completion evidence. The regulator can true up allowances when delivered risk reduction differs materially from the approved plan. The method should recognise efficient substitutions where a different intervention achieves the same or better outcome at lower whole-life cost.
Model risk remains important. Condition scores can be inconsistent, and failure consequences can change with demand and network configuration. Independent sampling, model governance and periodic recalibration reduce the risk that asset data become a route to unsupported revenue.
16 Combine capex and opex through a total-expenditure lens
Separate capital and operating allowances can bias utilities toward assets that earn a return. A total-expenditure framework can reduce this bias by applying a common sharing mechanism to efficient expenditure. Ofgem uses a Totex Incentive Mechanism, while the Australian framework combines operating and capital efficiency-sharing schemes [12][16].
The sharing factor determines how much of an underspend or overspend remains with investors. Ex-post review should remove expenditure that is inefficient, unrelated to approved outputs or caused by controllable failure. Customers should share in efficient savings after the utility has a meaningful incentive to find them.
Digital services, flexibility contracts and non-wire alternatives make the distinction more important. A utility should compare a substation upgrade with contracted demand response, storage or operational technology on whole-life cost and output. Accounting form should not determine the preferred option.
17 Use innovation allowances for evidence creation
Innovation allowances support projects where the option value is credible but commercial evidence is incomplete. Ofgem's RIIO-3 Network Innovation Allowance funds innovation under defined governance [13]. The United States GRIP programme provides grant support for resilience, smart-grid and grid-innovation projects [7].
An innovation project should have a problem statement, counterfactual, test plan, data protocol, decision rule and route to adoption. The deliverable is evidence, including negative findings. A pilot that proves a technology unsuitable can protect customers from a larger failed deployment.
Funding should be ring-fenced and proportionate. Intellectual-property treatment should preserve incentives while enabling sector learning. The close-out report should state actual cost, measured performance, limitations and adoption decision. Benefits should not be claimed again in a later price-control proposal without explaining how the new allowance differs from the pilot.
18 Use public support to overcome first-mover barriers
Grants and concessional support can accelerate technologies with system-wide learning or resilience benefits that a single utility cannot capture. The United States Department of Energy administers the USD 10.5 billion GRIP programme across resilience, smart-grid and grid-innovation mechanisms [7]. India's RDSS combines infrastructure and smart-meter investment with performance-linked support [19].
Public funding should be additional. It should address a defined market or coordination failure rather than replace expenditure already recoverable from customers. The grant agreement should align milestones, cost sharing, data rights and clawback with the regulatory allowance.
Double recovery must be prevented. The regulated asset value should reflect grants and customer contributions. Performance rewards should value incremental outcomes after public support. Transparent accounting protects customers and sustains confidence in the programme.
19 Procure supply-chain capacity before it becomes critical
Grid expansion depends on transformers, switchgear, cables, conductors, protection systems and skilled labour. The IEA reports that prices for key grid components have nearly doubled over five years and that transmission supply chains require coordinated planning [2]. Short procurement horizons can delay projects and increase cost.
Regulators can allow framework contracts, advance procurement and supplier-capacity reservations when long-term need is credible. The approval should identify volumes, cancellation exposure, indexation, competitive process and allocation across projects. A utility should not earn on unused inventory without demonstrating efficient need.
Supply-chain incentives can reward standardisation, timely delivery and transparent risk management. They should avoid fixed local-content or technology choices that become obsolete. The utility should maintain options where forecast uncertainty remains material.
20 Allocate construction and delivery risk explicitly
Grid programmes carry permitting, land, engineering, interface, commodity, contractor and commissioning risk. A blanket cost pass-through weakens delivery discipline. A fixed allowance can become unfinanceable when risks sit outside utility control.
The price-control settlement should identify the risk owner. Efficient procurement and contractor management normally sit with the utility. Government policy change, mandated scope change and extraordinary permitting delay may support an uncertainty mechanism. Inflation can use a published index where the cost category is genuinely exposed.
Major programmes should report milestones, forecast cost at completion, schedule confidence and emerging risk. The regulator can apply staged funding, independent engineering review and cost thresholds. FERC Order No. 1920 requires reevaluation when selected long-term facilities experience significant delays or cost overruns [4].
21 Model revenue and credit sensitivity
Incentive design should be tested in the utility's financial model before implementation. The base case includes allowed revenue, operating expenditure, capital programme, depreciation, tax, inflation and financing. The incentive layer adds rewards, penalties, deliverable timing, efficiency sharing and uncertainty adjustments.
The lender case should apply conservative output performance and project delay. It should test whether a penalty coincides with higher storm-recovery cost or emergency capital expenditure. Liquidity may matter more than the average return when several adjustments settle in the same year.
Credit protection can include annual exposure caps, delayed reconciliation, appeal procedures and treatment of uncontrollable events. These protections should not neutralise the incentive. The goal is a bounded and transparent risk that management can influence and creditors can model.
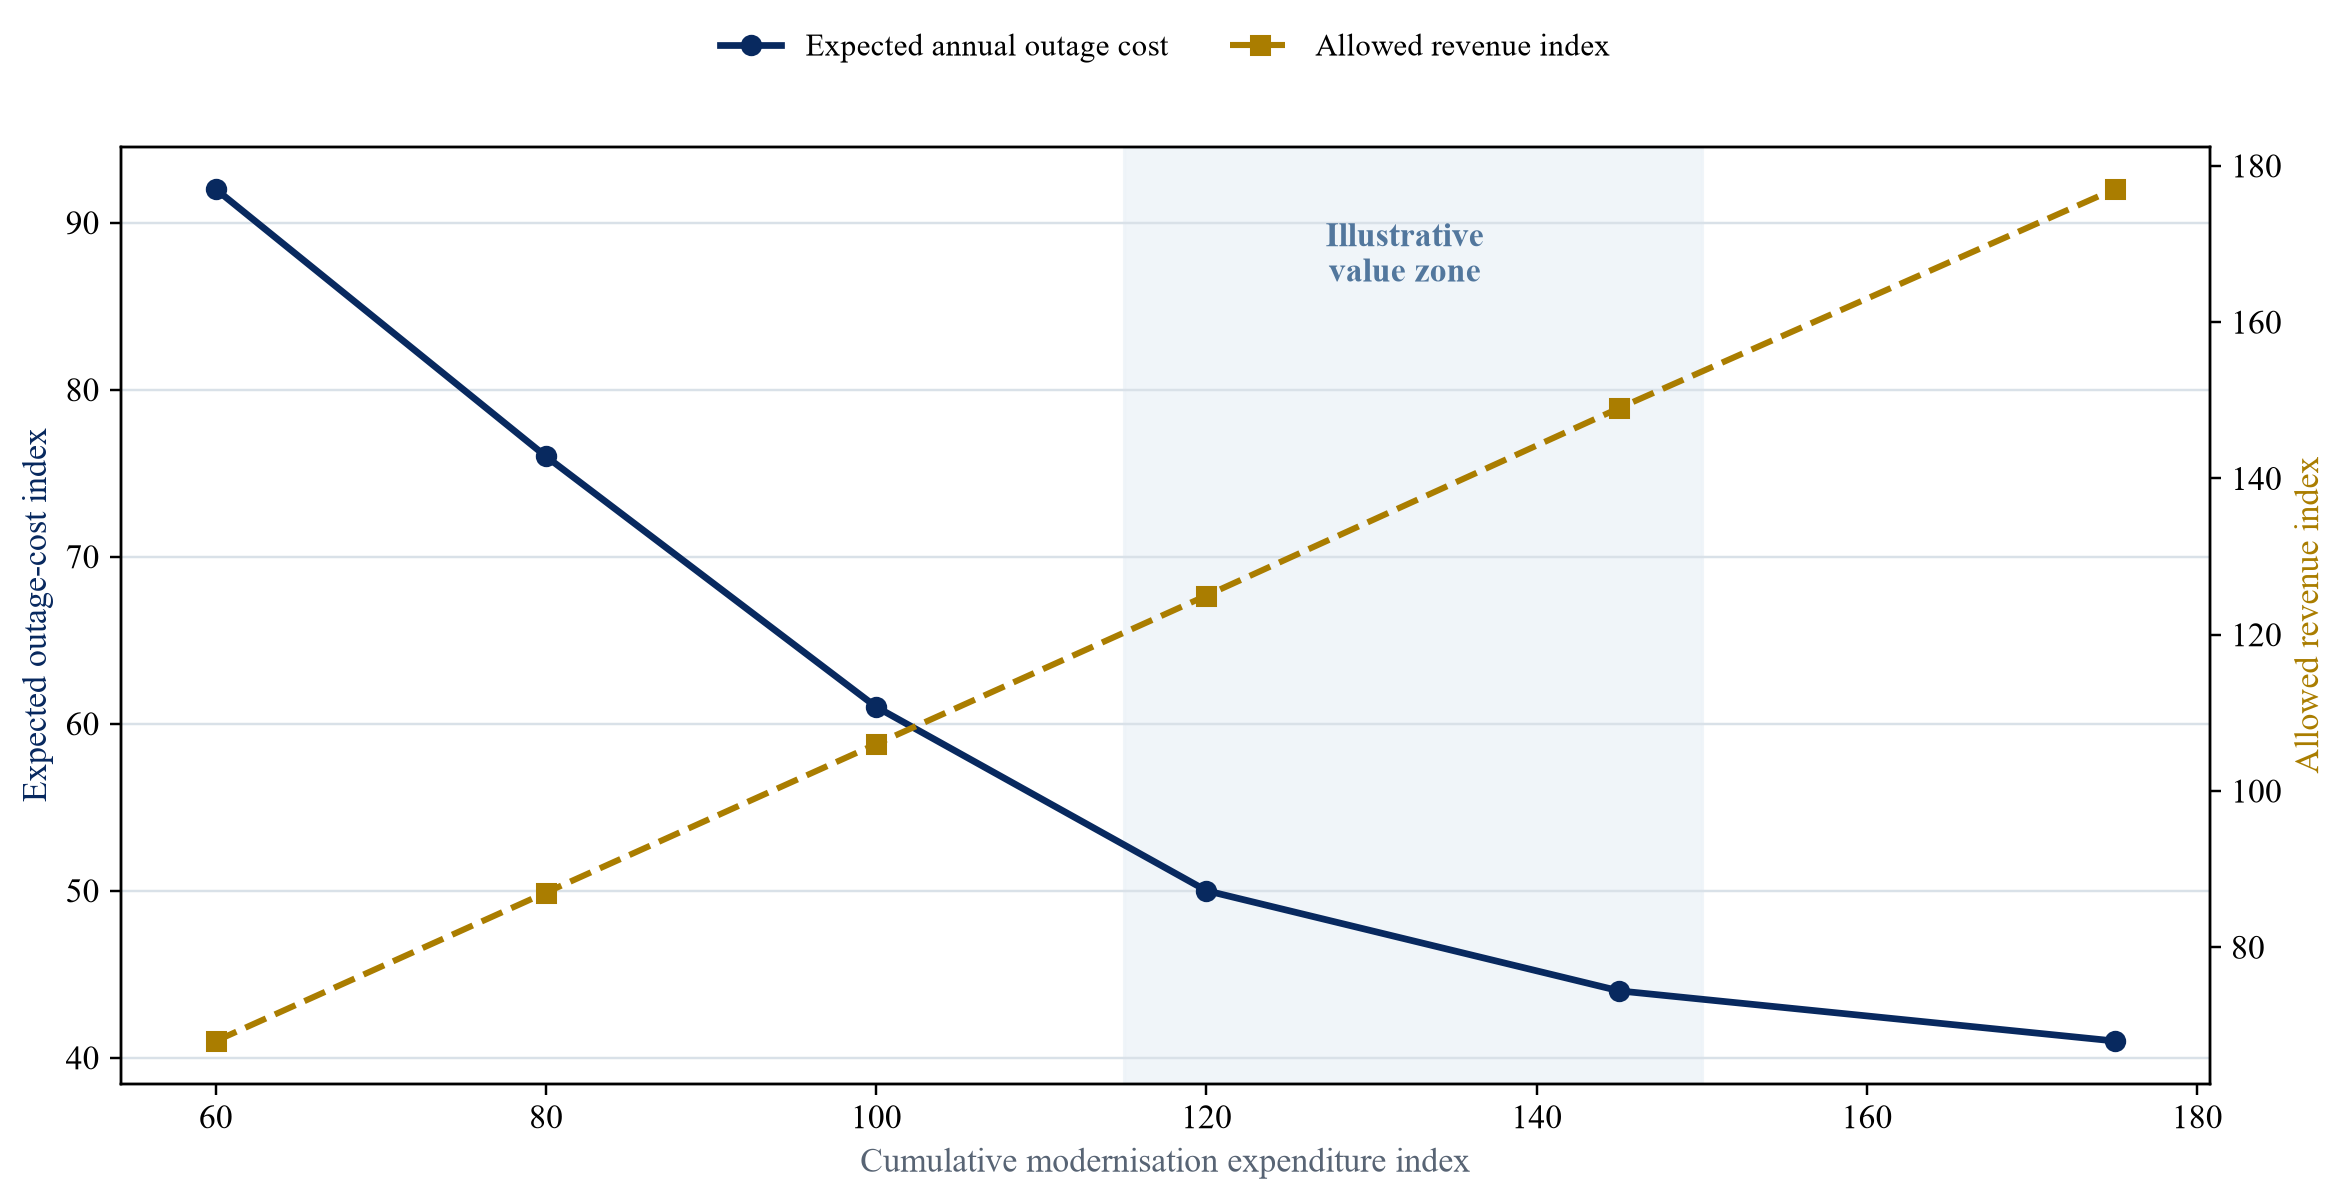
Values are author-modelled assumptions for method demonstration. They are not observed utility results, forecasts or recommended allowances.
22 Test incentive interactions through scenarios
Each incentive may be reasonable in isolation and excessive in combination. A utility could earn for delivering an asset, improving reliability, releasing capacity and underspending against allowance. These outcomes may arise from the same intervention. The model should identify overlapping benefit and revenue.
The scenario set should include strong performance, ordinary delivery, delayed delivery, cost overrun, severe event and data-quality failure. It should calculate customer bill effect, utility cash flow, credit metrics and cumulative reward or penalty. Management-estimated assumptions should be labelled and sensitivity ranges published.
The regulator can adjust weights, caps and gates after reviewing combined exposure. A portfolio cap can supplement metric-level caps. It should be high enough to preserve incentives and low enough to prevent an unintended revenue transfer.
Table 2. Hypothetical incentive and finance sensitivity
| Case | Delivery outcome | Annual revenue adjustment | Cash interest cover | Customer bill effect | Interpretation |
|---|---|---|---|---|---|
| Base | Deliverables on time; targets met | 0.0% | 3.1x | 0.0% | Allowed plan performs as approved |
| Strong outcome | Capacity and reliability exceed targets | +1.5% | 3.3x | +0.2% | Reward remains below modelled customer benefit |
| Efficient delivery | Outputs met with 8% totex saving | +0.8% | 3.4x | -0.6% | Investors and customers share verified saving |
| Delay | Major digital deliverable 12 months late | -1.2% | 2.8x | -0.1% | Funding adjustment and foregone reward apply |
| Severe event | Restoration target missed after defined hazard | -1.8% | 2.6x | 0.1% | Collar limits annual exposure while preserving penalty |
| Data failure | Evidence cannot support claimed outputs | -0.6% | 2.9x | -0.1% | Reward withheld and assurance remediation required |
Values are author-modelled assumptions for a representative network. They do not describe an actual utility or regulatory decision.
23 Govern data and model risk
Modernisation incentives rely on interval data, network models, asset records and event classification. Weak governance can make the calculation precise and wrong. The utility should maintain data ownership, quality controls, change logs, model validation and access for assurance.
Metric definitions should specify system boundaries, time intervals, missing-data treatment and restatement. A digital platform upgrade can change measurement. The regulator should distinguish a real performance movement from a new method or higher observation quality.
Independent assurance should focus on material judgement and revenue effect. Full duplication of operational systems is unnecessary. Sampling, model walkthroughs, source-to-report reconciliation and targeted engineering tests can establish confidence efficiently.
24 Use customer and critical-service evidence
Customer value differs across locations and services. Industrial users may prioritise connection date and voltage quality. Households may prioritise interruption duration and affordability. Hospitals, water systems and communications require restoration plans that recognise their critical role.
Engagement should inform metric weights and willingness-to-pay assumptions. It should not substitute for engineering and economic analysis. The regulator should publish how customer evidence influenced the decision and where other statutory duties prevailed.
Critical-service mapping needs periodic validation. A list can become stale as facilities, backup generation and network topology change. Data-sharing agreements should protect security and privacy while allowing restoration exercises and investment planning.
25 Adapt the framework to emerging markets
Some utilities face high technical and commercial losses, incomplete metering, weak collections and limited access to long-term finance. An advanced performance regime cannot assume data or institutional capacity that does not exist. The first priority may be reliable energy accounting, feeder metering, asset records and financial transparency.
India's RDSS links support to distribution infrastructure, smart metering, loss reduction and closure of the gap between average supply cost and realised revenue [19][20]. The model demonstrates how public funding, operational reform and measurable financial outcomes can be combined.
A staged regime can begin with verified milestones and a small set of high-confidence outcomes. Financial exposure can grow as data, governance and service quality improve. Development-finance support may fund metering, technical assistance and credit enhancement. The utility and regulator should publish limitations rather than assign financial weight to unreliable measures.
26 Apply the framework in Gulf utility systems
Gulf systems often combine rapid demand growth, major generation investment, water-electricity interdependence, state ownership and central planning. Smart-grid and artificial-intelligence programmes can improve forecasting, network visibility, flexibility and asset management. The commercial framework still needs measurable outputs and disciplined cost recovery.
Abu Dhabi's price controls seek security of supply, customer protection, efficient infrastructure investment and reasonable returns [29]. The AD.WE platform and demand-response pilot show the role of integrated data, AI, advanced energy management and performance monitoring [27][28]. DEWA's Smart Grid Strategy uses value-driven implementation and enabling mechanisms including policy, data, financing, research and innovation [25].
A Gulf resilience scorecard can include peak-load capability, critical water and power continuity, renewable integration, demand response, cyber recovery, technical losses and connection delivery. Public ownership does not remove the need for a transparent link between expenditure, capability and service outcome. It can allow whole-system benefits to be considered across generation, networks, water and district cooling.
27 Sequence implementation over 180 days
The first thirty days establish governance, service obligations, existing incentives, data sources, financing constraints and the current investment programme. The working group should include the regulator, network operator, system planner, finance function, customer representation and independent technical assurance.
Days thirty-one to seventy-five define metrics, baselines, event classes, exclusions, benefit valuation and data-quality requirements. The team should run shadow calculations using historic data. It should identify where evidence is too weak for financial exposure.
Days seventy-six to one hundred and twenty build the integrated regulatory and finance model. The model tests caps, collars, deadbands, sharing factors, delivery adjustments and incentive interaction. Draft licence, price-control or contractual provisions should use the same definitions.
Days one hundred and twenty-one to one hundred and eighty complete consultation, independent review, board approval, reporting design and implementation readiness. A controlled pilot can precede live revenue adjustment where data or operational processes remain immature.
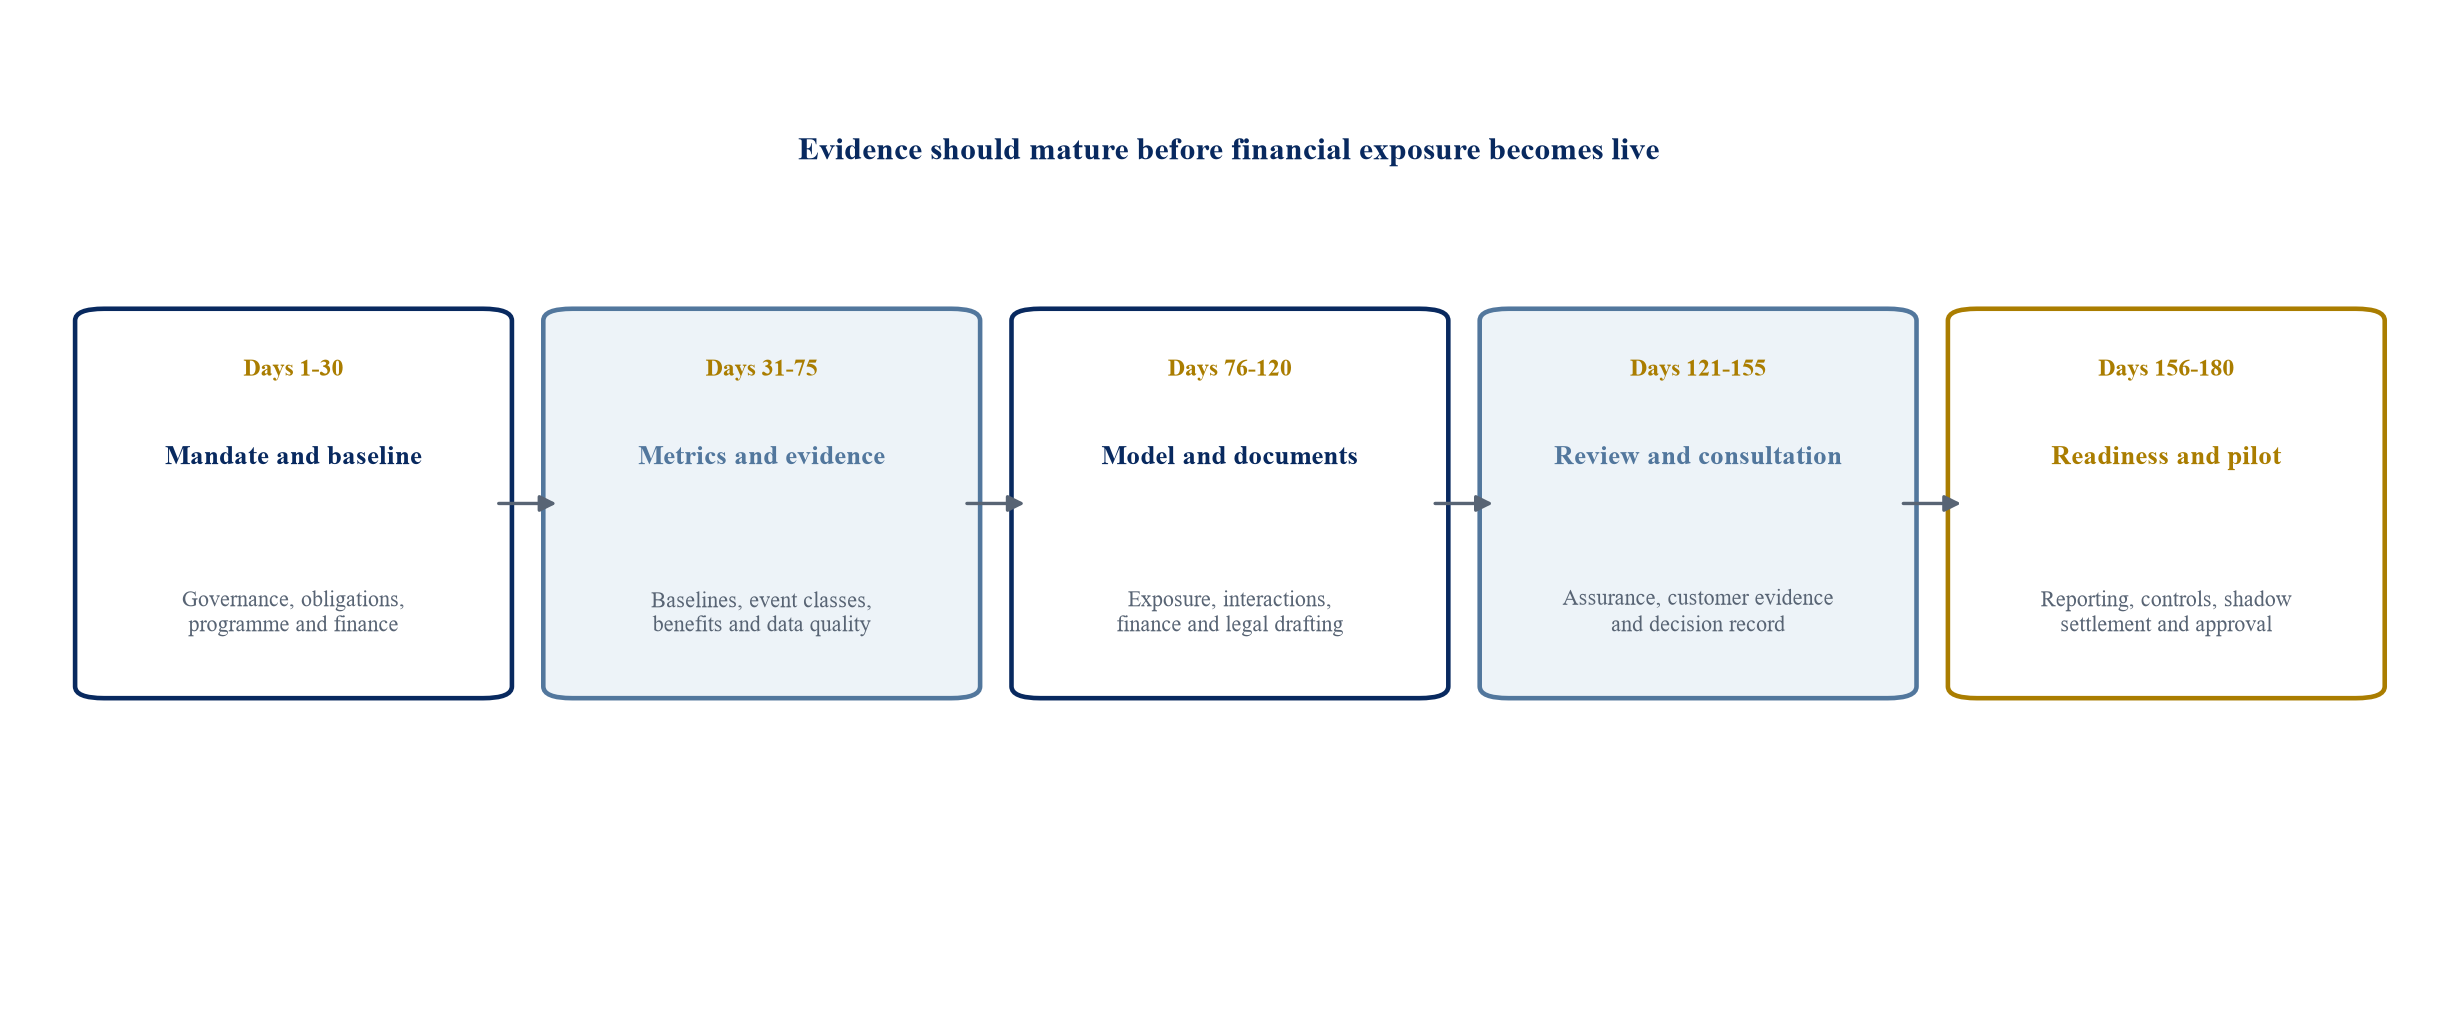
The roadmap is illustrative. Legal process, consultation duties and data readiness may require a longer timetable.
28 Use a decision checklist before approval
The regulator should confirm that the need, counterfactual and customer benefit are documented. Each metric should have a clear definition, controllable driver, baseline, data source, assurance process and revenue formula. The combined incentive exposure should be modelled under ordinary and stressed conditions.
The utility should confirm delivery accountability, operational readiness, cyber controls, supply-chain strategy and liquidity. The board should understand which outcomes management can influence and how performance affects revenue and credit metrics. The implementation plan should state who certifies results and how disputes are resolved.
Customers should see the expected bill effect, benefit-sharing method and protection against double recovery. Investors should see the recovery mechanism, adjustment timing and boundaries on retrospective change. Approval should proceed only when the same definitions operate in the engineering plan, regulatory instrument and financial model.
Table 3. Regulatory and financing treatment by modernisation instrument
| Instrument | Suitable use | Revenue treatment | Evidence gate | Financing consideration |
|---|---|---|---|---|
| Base allowance | Efficient recurring operation and maintenance | Ex-ante allowance with efficiency sharing | Cost benchmark and service baseline | Stable cash flow supports financeability |
| Price-control deliverable | Discrete asset or digital capability | Funding release, retention or true-up | Completion and usable-capability test | Delay and disallowance must be modelled |
| Output incentive | Measurable service improvement | Symmetric or asymmetric annual adjustment | Verified metric against baseline | Cap and collar bound cash volatility |
| Anticipatory investment | Forward-looking network capacity | Staged development and construction allowance | Scenario need, option value and need date | Cancellation and stranded-cost rules matter |
| Innovation allowance | Pilot and evidence creation | Ring-fenced cost support | Test plan, learning and close-out report | Usually excluded from core lender upside |
| Efficiency sharing | Whole-life cost improvement | Investors retain defined share of saving | Outputs met and expenditure efficient | Reward should not mask underinvestment |
| Uncertainty mechanism | Material uncontrollable change | Reopener, volume driver or indexation | Defined trigger and materiality threshold | Reduces unbounded policy and volume risk |
| Public grant | System learning or first-mover barrier | Net against regulated cost recovery | Additionality, milestones and audit | Prevent double recovery and align covenants |
The table summarises common treatments. The appropriate combination depends on evidence, controllability, legal authority and network need.
29 Recognise limitations
This framework does not determine an efficient allowed return, capital programme or reliability target for a named network. Those decisions require local demand forecasts, asset records, hazard analysis, customer research, legal authority and financing conditions. Public reporting is inconsistent across jurisdictions, and performance metrics can differ in definition.
The hypothetical exhibits simplify utility finance, regulatory accounting, outage economics and capital delivery. They demonstrate a decision method. They do not show an expected return, recommended penalty or universal credit threshold.
Further research should compare realised customer benefits from anticipatory investment, grid-enhancing technologies, digital platforms and performance-based regulation. Regulators should publish metric definitions, revenue effects and implementation learning where security and confidentiality permit.
Conclusion
Grid modernisation requires capital, operating reform and measurable customer outcomes. A regulatory framework should define the service obligation, map the investment need and use separate instruments for base funding, deliverables, performance, innovation, efficiency and uncertainty. This structure gives each risk a visible owner and each revenue adjustment a specific purpose.
Resilience should be measured through reliability, recovery, critical-load continuity, capacity, connections, asset health, cyber readiness and data quality. Metrics need credible baselines, controllable drivers and independent assurance. Caps, collars, deadbands and gates keep exposure proportionate. Integrated financeability testing shows whether the framework supports investment through stressed conditions.
The return on resilience should arise from verified capability and service value. Customers should retain a material share of benefit. Utilities should receive predictable recovery for efficient investment and a meaningful reward for superior delivery. Investors should see bounded risk and transparent adjustment. These conditions support faster grid modernisation without weakening expenditure discipline.
References
- International Energy Agency. Electricity 2026: Grids. 2026. https://www.iea.org/reports/electricity-2026/grids
- International Energy Agency. Building the Future Transmission Grid. 2025. https://www.iea.org/reports/building-the-future-transmission-grid
- International Energy Agency. Modernising Grids in the Age of Electricity. 2026. https://www.iea.org/reports/modernising-grids-in-the-age-of-electricity
- Federal Energy Regulatory Commission. Fact Sheet: Building for the Future Through Electric Regional Transmission Planning and Cost Allocation. 2024. https://www.ferc.gov/news-events/news/fact-sheet-building-future-through-electric-regional-transmission-planning-and
- Federal Energy Regulatory Commission. Explainer on the Transmission Planning and Cost Allocation Final Rule. 2025. https://www.ferc.gov/explainer-transmission-planning-and-cost-allocation-final-rule
- Federal Energy Regulatory Commission. What State Regulators Need to Know About Order No. 1920-B. 2025. https://www.ferc.gov/what-state-regulators-need-know-about-order-no-1920-b
- United States Department of Energy. Grid Resilience and Innovation Partnerships. 2026. https://www.energy.gov/oe/grid-resilience-and-innovation-partnerships-grip
- United States Department of Energy. GRIP Program Overview. 2023. https://www.energy.gov/sites/default/files/2023-10/101823_GRIP-Overview-Fact-Sheet.pdf
- European Commission. Guidance on Anticipatory Investments for Forward-Looking Electricity Networks. 2025. https://energy.ec.europa.eu/news/eu-guidance-ensuring-electricity-grids-are-fit-future-2025-06-02_en
- European Commission. European Grids Package. 2025. https://energy.ec.europa.eu/topics/infrastructure/european-grids_en
- European Commission. Guidance on Efficient and Timely Grid Connections. 2025. https://energy.ec.europa.eu/document/download/62c46b3d-0df9-42a1-a5fe-c3c71ed5f18c_en
- Ofgem. RIIO-3 Final Determinations: Electricity Transmission. 2025. https://www.ofgem.gov.uk/sites/default/files/2025-12/RIIO-3-Final-Determinations-ET.pdf
- Ofgem. RIIO-3 Network Innovation Allowance Governance. 2026. https://www.ofgem.gov.uk/guidance/riio-3-network-innovation-allowance-nia-governance
- Ofgem. RIIO-3 Final Determinations Overview. 2025. https://www.ofgem.gov.uk/sites/default/files/2025-12/RIIO-3-Final-Determinations-overview.pdf
- Australian Energy Regulator. Service Target Performance Incentive Scheme Version 6. 2025. https://www.aer.gov.au/industry/registers/resources/schemes/service-target-performance-incentive-scheme-v6
- Australian Energy Regulator. Expenditure Incentives Guideline. 2025. https://www.aer.gov.au/industry/registers/resources/guidelines/expenditure-incentives-guideline
- Australian Energy Regulator. Electricity and Gas Networks Performance Report 2025. 2025. https://www.aer.gov.au/system/files/2025-12/AER%20-%202025%20Electricity%20and%20gas%20networks%20performance%20report%20-%20December%202025.pdf
- Australian Energy Regulator. Distribution STPIS S-Factor Calculation Model. 2024. https://www.aer.gov.au/industry/registers/resources/models/distribution-stpis-s-factor-calculation-model
- Government of India Ministry of Power. Annual Report 2024-25. 2025. https://powermin.gov.in/sites/default/files/uploads/MOP_Annual_Report_Eng_2024_25.pdf
- Government of India Ministry of Power. Revamped Distribution Sector Scheme Parliamentary Answer. 2025. https://powermin.gov.in/sites/default/files/uploads/RS08122025_Eng.pdf
- Government of India Ministry of Power. Revamped Distribution Sector Scheme Portal. 2026. https://rdss.powermin.gov.in/rdss
- World Bank. Rethinking Power Sector Reform in the Developing World. 2020. https://ppp.worldbank.org/sites/default/files/2022-03/RPSR_Launch_Full_Report.pdf
- World Bank. Power System Resilience Frameworks and Metrics. 2026. https://documents1.worldbank.org/curated/en/099017509032520805/pdf/IDU-8b11492c-09a2-4152-9dea-35cbacaf719c.pdf
- World Bank. Electricity Reform for Sustainable Growth Development Policy Loan 2. 2023. https://documents1.worldbank.org/curated/en/099050523115028302/pdf/BOSIB07b54e0710760a2880fd936979f268.pdf
- Dubai Electricity and Water Authority. Smart Grid Report 2025. 2025. https://www.dewa.gov.ae/-/media/Files/smartgrid/Smart-Grid_Report_2025_EN_Final.ashx
- Dubai Electricity and Water Authority. Sustainability Report 2025. 2026. https://www.dewa.gov.ae/-/media/Files/Sustainability/Sustainability_Report_English_2025.ashx
- Abu Dhabi Department of Energy. AD.WE AI-Powered Energy and Water Management Platform. 2025. https://doe.gov.ae/Media-Centre/News/Abu-Dhabi-Department-of-Energy-unveils-the-visual-identity-of
- Abu Dhabi Department of Energy. Second Phase of Demand Response Pilot. 2025. https://www.doe.gov.ae/en/Media-Centre/News/DoE-launches-second-phase-of-demand-response-pilot-project-in-collaboration
- Abu Dhabi Department of Energy. Revenue Limits for Water, Wastewater and Electricity Sector Operators. 2023. https://www.doe.gov.ae/Media-Centre/News/Abu-Dhabi-Department-of-Energy-sets-revenue-limits-for-water
- Abu Dhabi Department of Energy. Integrated Energy Model. https://www.doe.gov.ae/Abu-Dhabi-Integrated-Energy-Model
About the Author
Authored by Chennakeshav Adya Independent Researcher
Chennakeshav (CK) is a corporate finance and investment banking executive with 25+ years of global experience in deal origination, structuring and execution across M&A, growth capital and corporate strategy. He has led value-creation mandates for founders, corporates and funds — bridging the boardroom view to hands-on execution and close.
His career spans Morgan Stanley, HSBC, Lloyds Banking Group, EWEC, ADQ portfolio companies and Emirates Growth Fund, across TMT, real estate, fintech, deeptech, cleantech, infrastructure and energy. He has partnered with C-suite leaders, private equity and venture funds, sovereign wealth funds and family offices to finance complex fund raises and scale-up ventures, and has led M&A due diligence, post-merger integration and business-transformation initiatives to create value.
At Matchpoint Partners he is Managing Partner, leading the firm's corporate finance, M&A and capital-raising practice. He holds an MBA from London Business School, an engineering degree from VTU and a Master of Laws (LLM, in progress) from UCL London.
An active start-up mentor, CK mentors at Techstars, DIFC FinTech Hive, Startup Grind, Founder Institute and IN5, serves as Entrepreneur Mentor in Residence (EMiR) at London Business School, and judges the Entrepreneurship World Cup.
https://www.linkedin.com/in/ckadya/ https://www.matchpoint-partners.com/team/ck-adya.html
This paper is part of a continuing series on the structure of private and alternative markets. The views expressed are the author's own. The paper is for information only, describes market structure in general terms, and does not constitute investment, legal, tax or regulatory advice or a recommendation in respect of any security, vehicle or counterparty.
