

1. Define revenue acceleration as an operating system
Revenue acceleration is the coordinated improvement of demand selection, account access, sales execution, pricing, delivery, retention and expansion. Each element affects the others. Strong demand cannot compensate indefinitely for weak qualification. High win rates can destroy value when discounts, implementation cost or payment terms are uncontrolled. Retention can appear healthy when a few large renewals conceal deterioration across the broader customer base.
Private-equity ownership adds a time horizon and a value-creation thesis. The company needs to improve performance while building evidence that a future buyer, lender or public-market investor can diligence. That evidence includes repeatability by segment, a reconciled pipeline, realised price, gross margin, revenue quality, customer concentration, renewal behaviour, cash conversion and the management processes supporting each measure.
The operating system should begin with a small set of linked questions. Which customer problems and segments offer attractive contribution economics? Which accounts are covered, by whom and with what next action? Which opportunities meet the evidence required for their stage? Which price and commercial terms will reach recognised revenue and cash? Which customers are adopting, renewing and expanding? Which commercial actions improve sustainable earnings and reduce risk?
The revised IFRS Practice Statement on Management Commentary focuses on connected information about factors fundamental to an entity's ability to create value and generate cash flows.[3] That principle is useful internally. Commercial measures should form a connected narrative from market choice to cash and value. A dashboard that cannot explain those connections becomes a reporting surface rather than a management system.
2. Freeze a reconciled baseline before setting targets
A credible programme starts with a baseline whose definitions, period and source systems are known. The baseline should reconcile signed contracts, bookings, backlog, recognised revenue, invoices, cash receipts, credit notes, gross margin and active customer records. Differences should be assigned to timing, scope, currency, cancellations, contract modifications, data quality or accounting treatment.
IFRS 15 requires an entity to identify the customer contract and performance obligations, determine and allocate the transaction price, and recognise revenue as obligations are satisfied.[1] Commercial teams can use bookings and annualised measures for management, while finance must preserve the difference between those measures and recognised revenue. A new multi-year contract, for example, can create bookings, backlog, implementation obligations, variable consideration and future cash flows on different timetables.
The baseline should use a controlled metric dictionary. Each measure needs a name, purpose, calculation, included and excluded items, currency, time basis, source, owner, refresh frequency and reconciliation. Annual recurring revenue, net revenue retention, sales-qualified pipeline and adjusted EBITDA can vary materially between companies. Consistent labels without consistent calculations create false comparability.
The FRC Lab's performance-metrics principles emphasise alignment to strategy, transparency, context, reliability and consistency.[19] The SEC's guidance on non-GAAP measures also stresses clear calculation and reconciliation where its rules apply.[8][9] A PE-owned private company should apply the same discipline to board metrics even when public-company disclosure rules do not apply.
Table 1. Revenue baseline and metric control architecture
| Measure layer | Core records | Reconciliation | Accountable owner | Control question |
|---|---|---|---|---|
| demand | campaigns, referrals, events, inbound and target-account activity | unique company and contact identifiers | marketing leader | can each response be tied to a source and account? |
| pipeline | opportunity, stage, amount, probability, close date and next action | opportunity to account, owner and product | revenue operations | does each stage have current supporting evidence? |
| contracts | executed agreement, scope, price, term, obligations and changes | approved quote to signed contract | sales operations and legal | do final terms match approved economics and authority? |
| revenue | performance obligations, transaction price and recognition | contract schedules to general ledger | finance | does management reporting reconcile to recognised revenue? |
| margin | direct delivery, support, commissions and implementation cost | customer and product profitability to ledger | finance and operations | are contribution economics measured on a consistent basis? |
| cash | invoice, due date, receipt, credit and dispute | receivables ledger to bank | finance | which commercial terms delay or place cash at risk? |
| retention | renewal base, churn, contraction, expansion and reactivation | customer cohort to contract and revenue records | customer success and finance | are cohort movements complete and mutually exclusive? |
Measures and review frequencies are operating-model examples. Accounting treatment follows the company's reporting framework, contracts and finance policies.
3. Make data quality an operating responsibility
Commercial data often passes through marketing automation, customer relationship management, configure-price-quote tools, contract repositories, billing, enterprise resource planning, support and product systems. A weekly review can display precise ratios while the underlying records remain incomplete, duplicated, stale or inconsistent.
The UK Government Data Quality Framework describes completeness, uniqueness, consistency, timeliness, validity and accuracy as core dimensions and treats quality as fitness for purpose.[11] These dimensions translate directly to revenue operations. Completeness asks whether every material opportunity and renewal exists. Uniqueness asks whether accounts or deals are duplicated. Consistency tests whether contract, CRM and billing values agree. Timeliness tests whether stage and next-action dates are current. Validity checks allowed formats and ranges. Accuracy compares the record with the real customer and transaction.
Data ownership should sit with operating roles. Revenue operations can govern fields, stage rules and exception reports. Sales leaders remain responsible for the accuracy of opportunities and forecasts. Finance owns accounting and cash reconciliation. Marketing owns source and campaign records. Customer success owns onboarding, adoption and renewal signals. Technology teams support integrations and access while business owners remain accountable for meaning.
Controls should focus on decision-critical fields. A company does not need perfect data everywhere before acting. It needs declared quality thresholds for the fields used to allocate capacity, forecast revenue, approve price, measure retention and value the business. Exceptions should be visible in the weekly pack, with owners and closure dates. Automated validation can reduce errors, while sampling and reconciliation test whether valid-looking records reflect reality.
4. Select segments through attainable profit pools
Segment attractiveness is the economic opportunity available to this company, given its proposition, access, delivery model and competitive position. A large market can remain unattractive when the company lacks credibility, channel access or delivery capacity. A smaller segment can create superior value when demand is urgent, differentiation is defensible, contribution margin is strong and renewal behaviour is durable.
The segment unit should match how customers buy and how economics differ. Industry, geography, company size, use case, operating model, regulation, technology environment and buying trigger can all matter. A useful segmentation remains granular enough to expose meaningful differences and stable enough to manage.
Market evidence should separate total demand from serviceable demand and near-term attainable demand. Management can combine official statistics, customer interviews, procurement data, search behaviour, competitor offerings, win-loss evidence and channel feedback. The CMA's merger guidance notes that competitive assessment can capture dynamics more fully than formal market definition in many cases.[10] Commercial planning should therefore examine actual constraints and substitutes rather than relying on one market-size number.
Attractiveness should include expected price, win probability, sales effort, implementation burden, ongoing service cost, payment terms, retention, expansion, concentration and risk. The resulting profit pool is a scenario, not a fact. Management should state sources and limitations, then update the view as observed conversion and margin evidence arrives.
Table 2. Segment attractiveness and right-to-win scorecard
| Dimension | Evidence | Hypothetical weight | Score question | Failure signal |
|---|---|---|---|---|
| demand and urgency | buyer interviews, tenders, search and industry data | 15% | is the problem funded and time sensitive? | interest without a budget or trigger |
| accessible account base | named accounts, relationships and channel reach | 15% | can the company reach the buying group efficiently? | broad market with weak account access |
| differentiation | win-loss evidence, product proof and references | 15% | why should the buyer choose this company? | wins depend mainly on discount |
| realised contribution | price, delivery cost, support and collection | 20% | does revenue convert into attractive contribution and cash? | high bookings with weak margin or slow cash |
| conversion speed | stage duration, procurement and implementation | 10% | can opportunity convert within a governable cycle? | repeated date movement and stalled approvals |
| retention and expansion | cohorts, adoption, renewal and cross-sell | 15% | does the relationship compound after initial sale? | renewal depends on repeated rescue discounts |
| strategic and risk fit | concentration, regulation, capability and reputation | 10% | does growth improve resilience and exit positioning? | growth increases dependence or execution risk |
Weights and scores are hypothetical modelling assumptions. Management should replace them with company evidence and test sensitivity before reallocating resources.
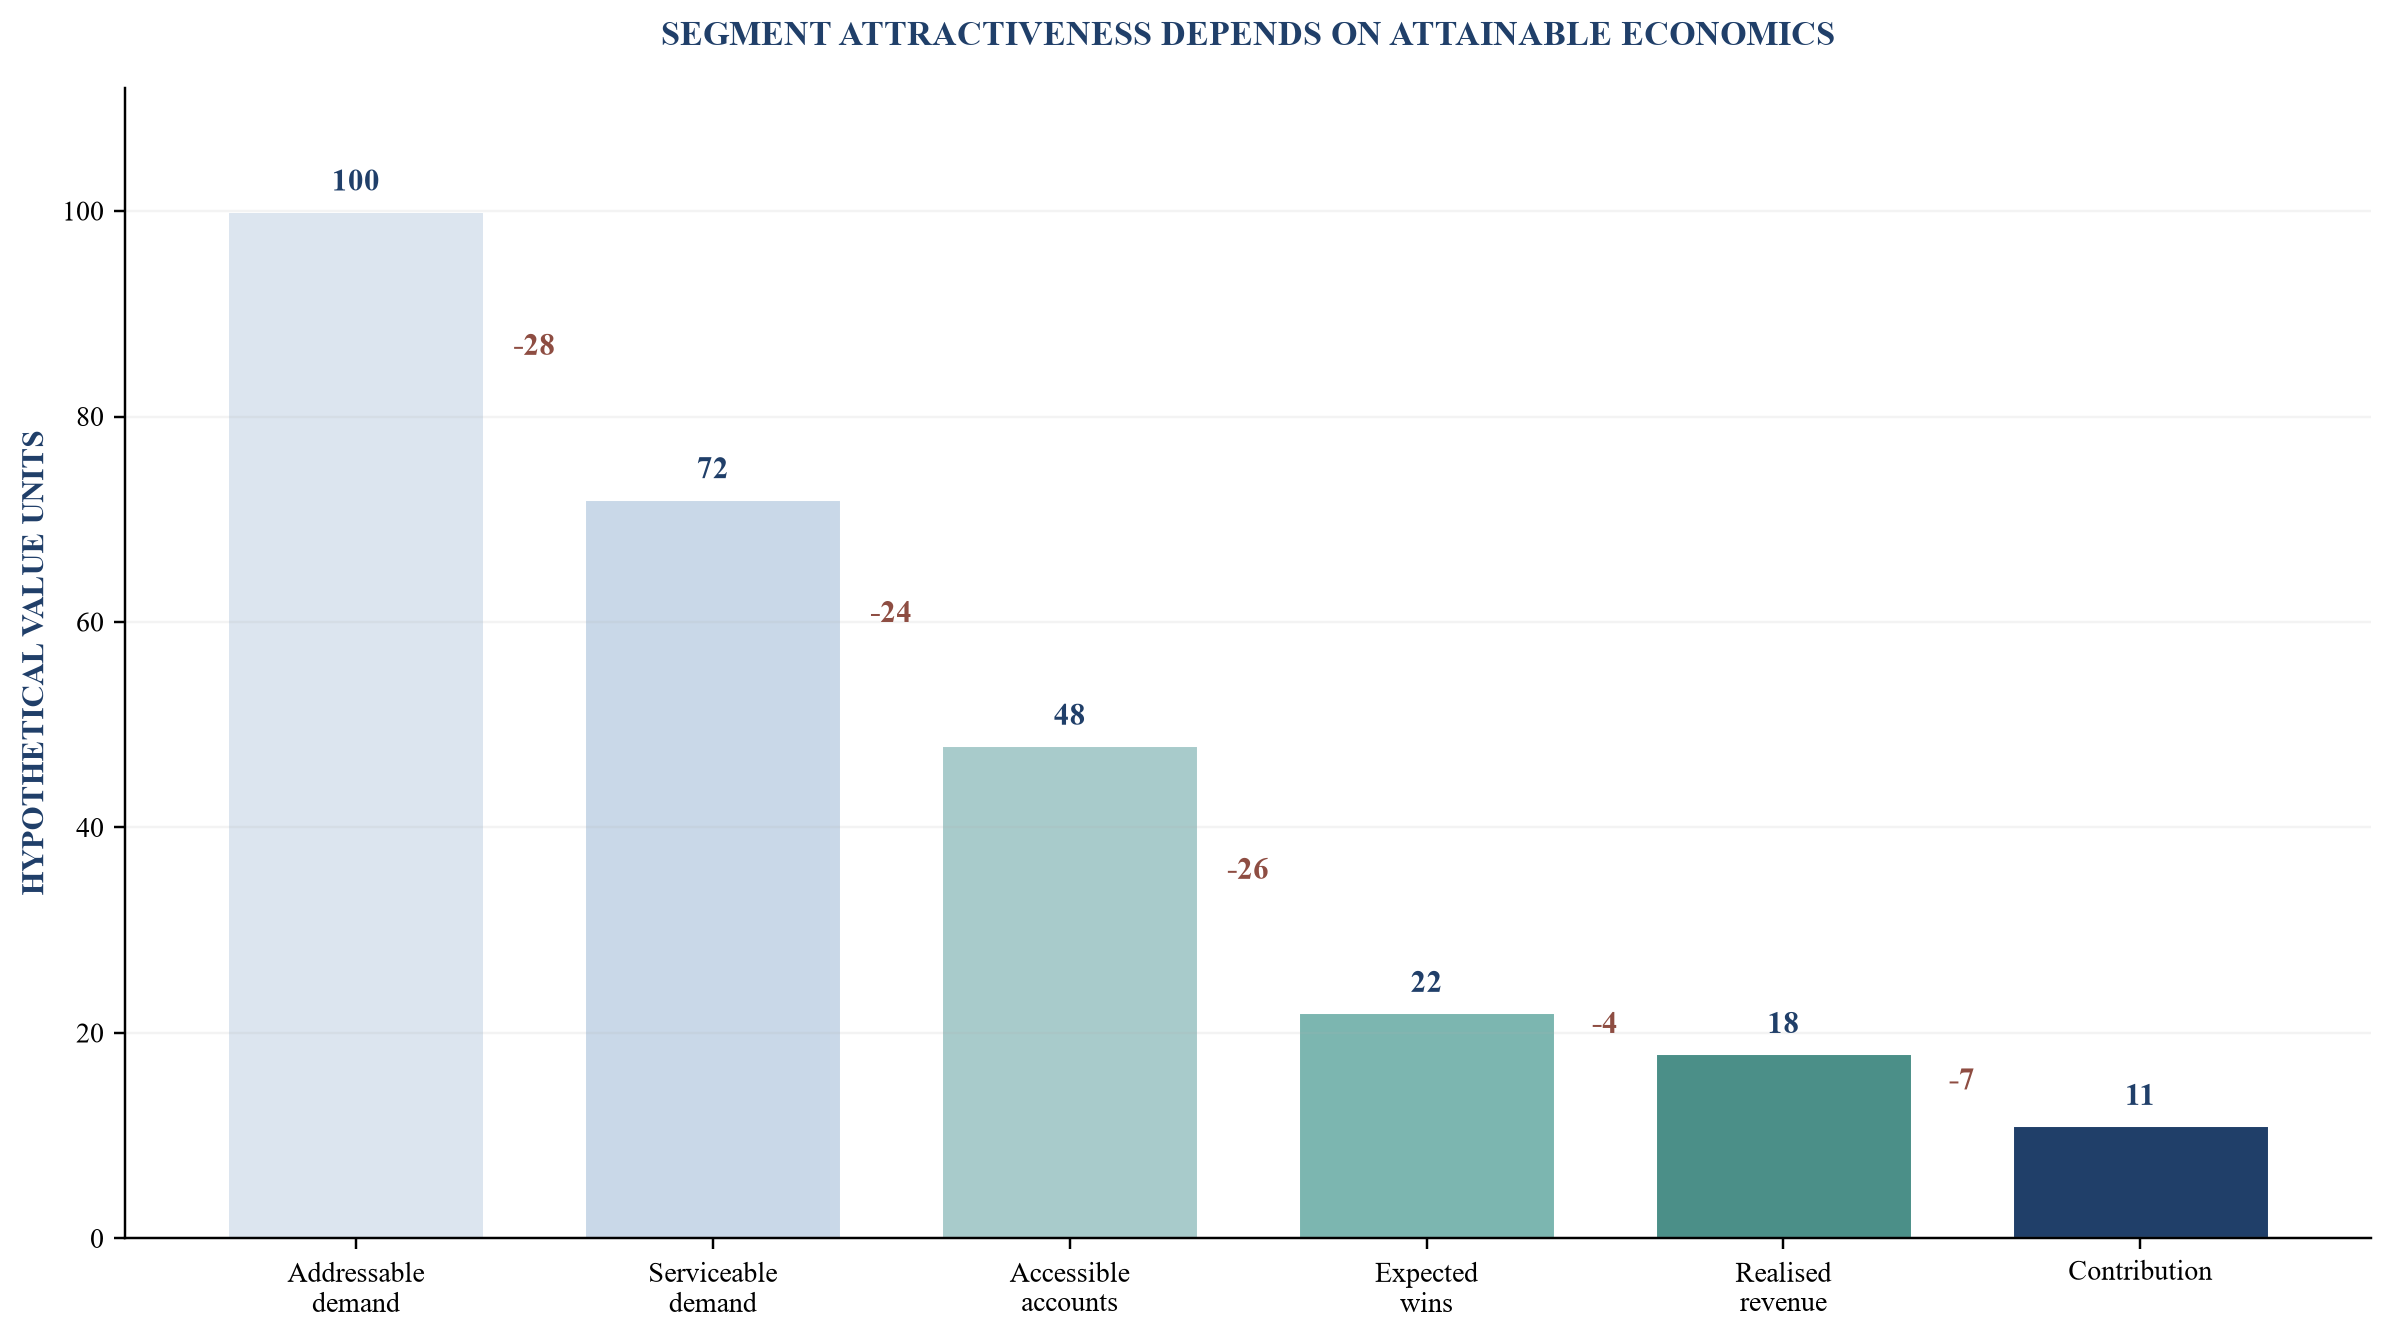
Values are hypothetical modelling assumptions in arbitrary monetary units. They demonstrate how access, conversion and delivery economics reduce a broad demand estimate.
5. Translate segment choices into named-account coverage
A segment strategy becomes operational when it identifies the accounts, buying situations and owners that matter. Named-account coverage should show current customers, expansion accounts, active prospects, relationship access, buying-group contacts, partner routes and relevant triggers. This prevents a segment label from becoming a broad invitation to pursue every available lead.
Accounts can be tiered by attainable value and required coverage rather than company size alone. A strategic account may justify executive sponsorship, multi-threaded relationships and a formal account plan. A scalable account may fit a standard proposition and inside-sales motion. A partner-led account may be reachable through a distributor, systems integrator or adviser. Each tier needs a service model and capacity assumption.
Coverage should measure both breadth and depth. Breadth is the proportion of target accounts with a verified owner, relevant contact and current action. Depth is the quality of access across economic buyer, user, technical evaluator, procurement, finance and executive sponsor. One friendly contact does not constitute full coverage when the buying decision is collective.
The account plan should identify the customer's business objective, current solution, trigger, value hypothesis, buying group, competitive alternatives, relationship map, proof required, next decision and risks. It should distinguish verified customer information from the seller's assumption. Management should close or downgrade stale accounts rather than preserve artificial coverage.
Capacity is a constraint. If each strategic account requires executive time, solution design and specialist proof, the number of accounts per seller should follow observed workload and conversion. Coverage targets that exceed capacity encourage superficial activity and stale records.
6. Use stage evidence to govern the revenue funnel
A funnel stage should describe buyer progress supported by evidence. Seller activity, optimism or elapsed time cannot substitute for that evidence. A discovery stage might require a verified problem, relevant stakeholder and agreed next step. A qualified stage might require budget route, decision process, solution fit, timing and access to the buying group. A proposal stage should require scoped terms and a confirmed evaluation path.
Every opportunity should have an account, owner, amount basis, product or service, source, stage, stage-entry date, expected close date, next action, next-action date and loss or pause reason. Amount should distinguish headline contract value, annualised value, implementation fees, expected recognised revenue and expected contribution where material.
Funnel leakage analysis follows cohorts entering a stage during a defined period. It records advancement, loss, pause, regression and no decision. This is stronger than a snapshot coverage ratio because opportunities can remain indefinitely in late stages and inflate apparent capacity. Stage ageing should be compared with the motion and segment, since a complex enterprise sale and a standard renewal have different clocks.
Conversion analysis should decompose volume, quality and speed. A lower win rate may reflect entry of weaker opportunities, competitive pressure, price, poor discovery, procurement delay or delivery capacity. Management needs reason codes and supporting review rather than one aggregate ratio.
Table 3. Funnel stages, minimum evidence and leakage controls
| Stage | Minimum buyer evidence | Exit test | Leakage indicator | Management action |
|---|---|---|---|---|
| identified | named account, plausible need and relationship route | verified contact accepts exploration | duplicate or no reachable stakeholder | merge, reassign or close |
| discovery | problem, impact, stakeholders and next step | buyer confirms problem and evaluation | meetings without agreed decision path | strengthen discovery or stop |
| qualified | fit, value, budget route, authority, timing and competition | opportunity meets controlled qualification | close date moves without new evidence | requalify, pause or close |
| solution | scope, proof, delivery and commercial basis | buyer accepts proposed solution path | solution work without sponsor access | require access or cap effort |
| commercial | proposal, price, terms and decision process | material commercial issues are resolved | discount increases while probability stalls | escalate price and value review |
| committed | preferred route, approvals and contracting plan | executable agreement and conditions exist | verbal commitment lacks approval path | assign legal and procurement actions |
| won or lost | signed terms or documented outcome | contract handed to delivery and finance | incomplete reason and competitor record | conduct win-loss review |
Stage names and time limits are illustrative. They should be calibrated by product, segment, motion and observed buyer behaviour.
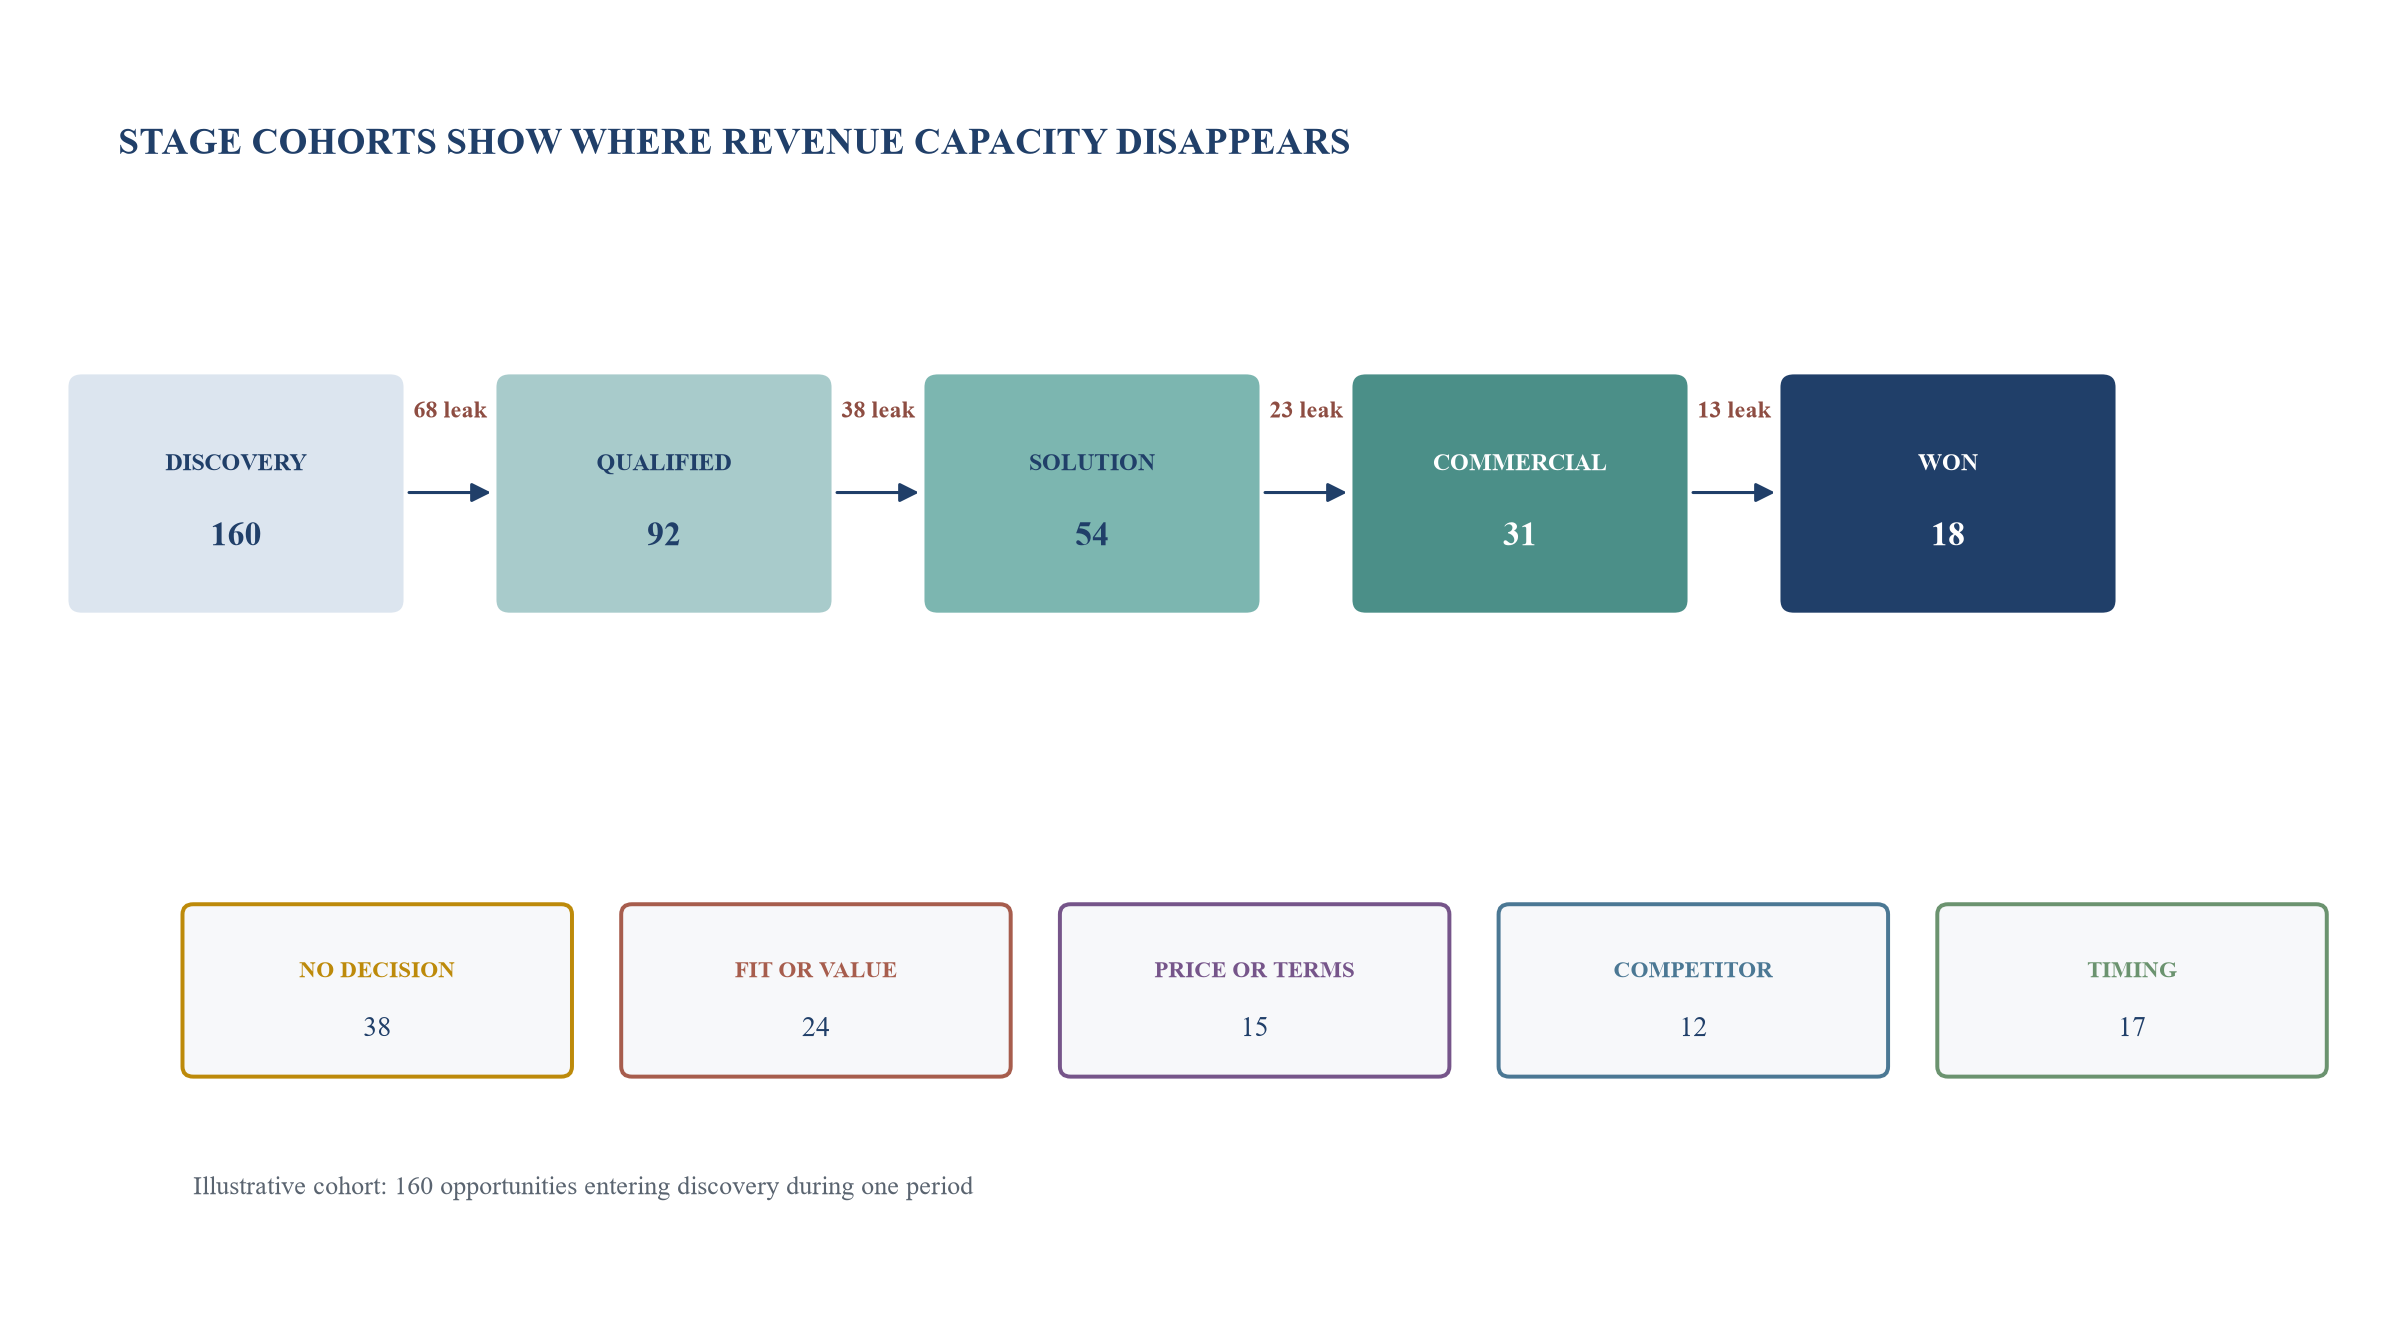
Volumes, rates and stage periods are hypothetical modelling assumptions. They are process examples rather than sales benchmarks.
7. Improve qualification before increasing activity
Qualification protects scarce selling, technical, legal and executive capacity. It asks whether the customer problem is real, material and funded; whether the company can solve it; whether the buying process is understood; whether the economics are acceptable; and whether a next decision is scheduled.
A qualification framework should combine mandatory gates with judgment. Mandatory gates may include a customer problem within scope, credible access, solution fit, legal ability to contract and a viable delivery route. Comparative factors may include urgency, value, sponsor strength, competition, procurement complexity, price tolerance and reference potential.
The weekly review should examine changes in evidence. A close date moved forward without a changed customer action is weak evidence. A higher probability entered by the seller does not create buyer commitment. Stronger evidence includes a confirmed evaluation plan, access to decision makers, completed technical proof, approved budget, negotiated terms or customer-owned next action.
Management should test whether qualification differs by channel, seller, segment and deal size. A high-volume channel may produce lower entry quality but efficient conversion. A seller may retain many opportunities while another closes weak cases early. The objective is not identical ratios. It is a transparent reason for differences and a capacity allocation consistent with expected economics.
Win-loss review should sample wins, losses and no decisions. Wins can reveal underpricing, excessive custom work or reliance on one relationship. Losses can reveal product gaps, weak discovery, price, competition or process failure. No decisions can show problems that buyers did not value enough to solve.
8. Govern realised price through a visible waterfall
List price is the starting point of an economic system. Realised price changes through standard discounts, negotiated concessions, free periods, implementation credits, volume bands, rebates, commissions, payment terms, scope additions and renewal caps. A pricing waterfall makes those movements visible and connects them to contribution.
Price architecture should reflect the value unit and delivery economics. Common structures include subscription, usage, seat, transaction, project, outcome, capacity and hybrid models. The company should define which unit aligns customer value with predictable economics and which contractual terms can create volatility, concentration or implementation risk.
Discount approval should depend on total economics and precedent. A small percentage discount on a multi-year strategic contract can be material. A larger discount can be rational when delivery cost, payment timing, reference value and expansion path support it. Approval records should show the reason, alternative considered, authority, scope, term, margin, precedent and expiry.
Pricing tests should use observed willingness to pay, win-loss evidence, controlled offers and renewal behaviour. A price increase can improve contribution or accelerate churn depending on segment, value, switching cost and service quality. Management should separate nominal uplift from realised uplift after concessions and mix.
Table 4. Pricing authority and economic evidence
| Decision | Required evidence | Approval owner | Economic measure | Post-decision check |
|---|---|---|---|---|
| standard price | approved package, scope and rate card | product and commercial leadership | expected contribution by offer | realised price and win rate |
| discretionary discount | customer value, competition and reason code | sales leader within delegation | net price and margin | frequency and precedent by seller |
| non-standard payment | cash timing, credit and financing effect | finance | cash conversion and credit exposure | overdue invoices and disputes |
| free implementation or service | effort, capacity and expansion case | operations and finance | total contract contribution | actual delivery hours and adoption |
| renewal cap or protection | term, index, service and retention case | commercial and legal | lifetime economics | realised renewal uplift and churn |
| scope or contract modification | changed obligations, price and delivery | sales operations, finance and legal | incremental contribution and accounting | signed change, revenue and cost reconciliation |
Thresholds are illustrative and do not prescribe price, competition-law treatment or contracting authority. Legal review is required for applicable competition and customer terms.
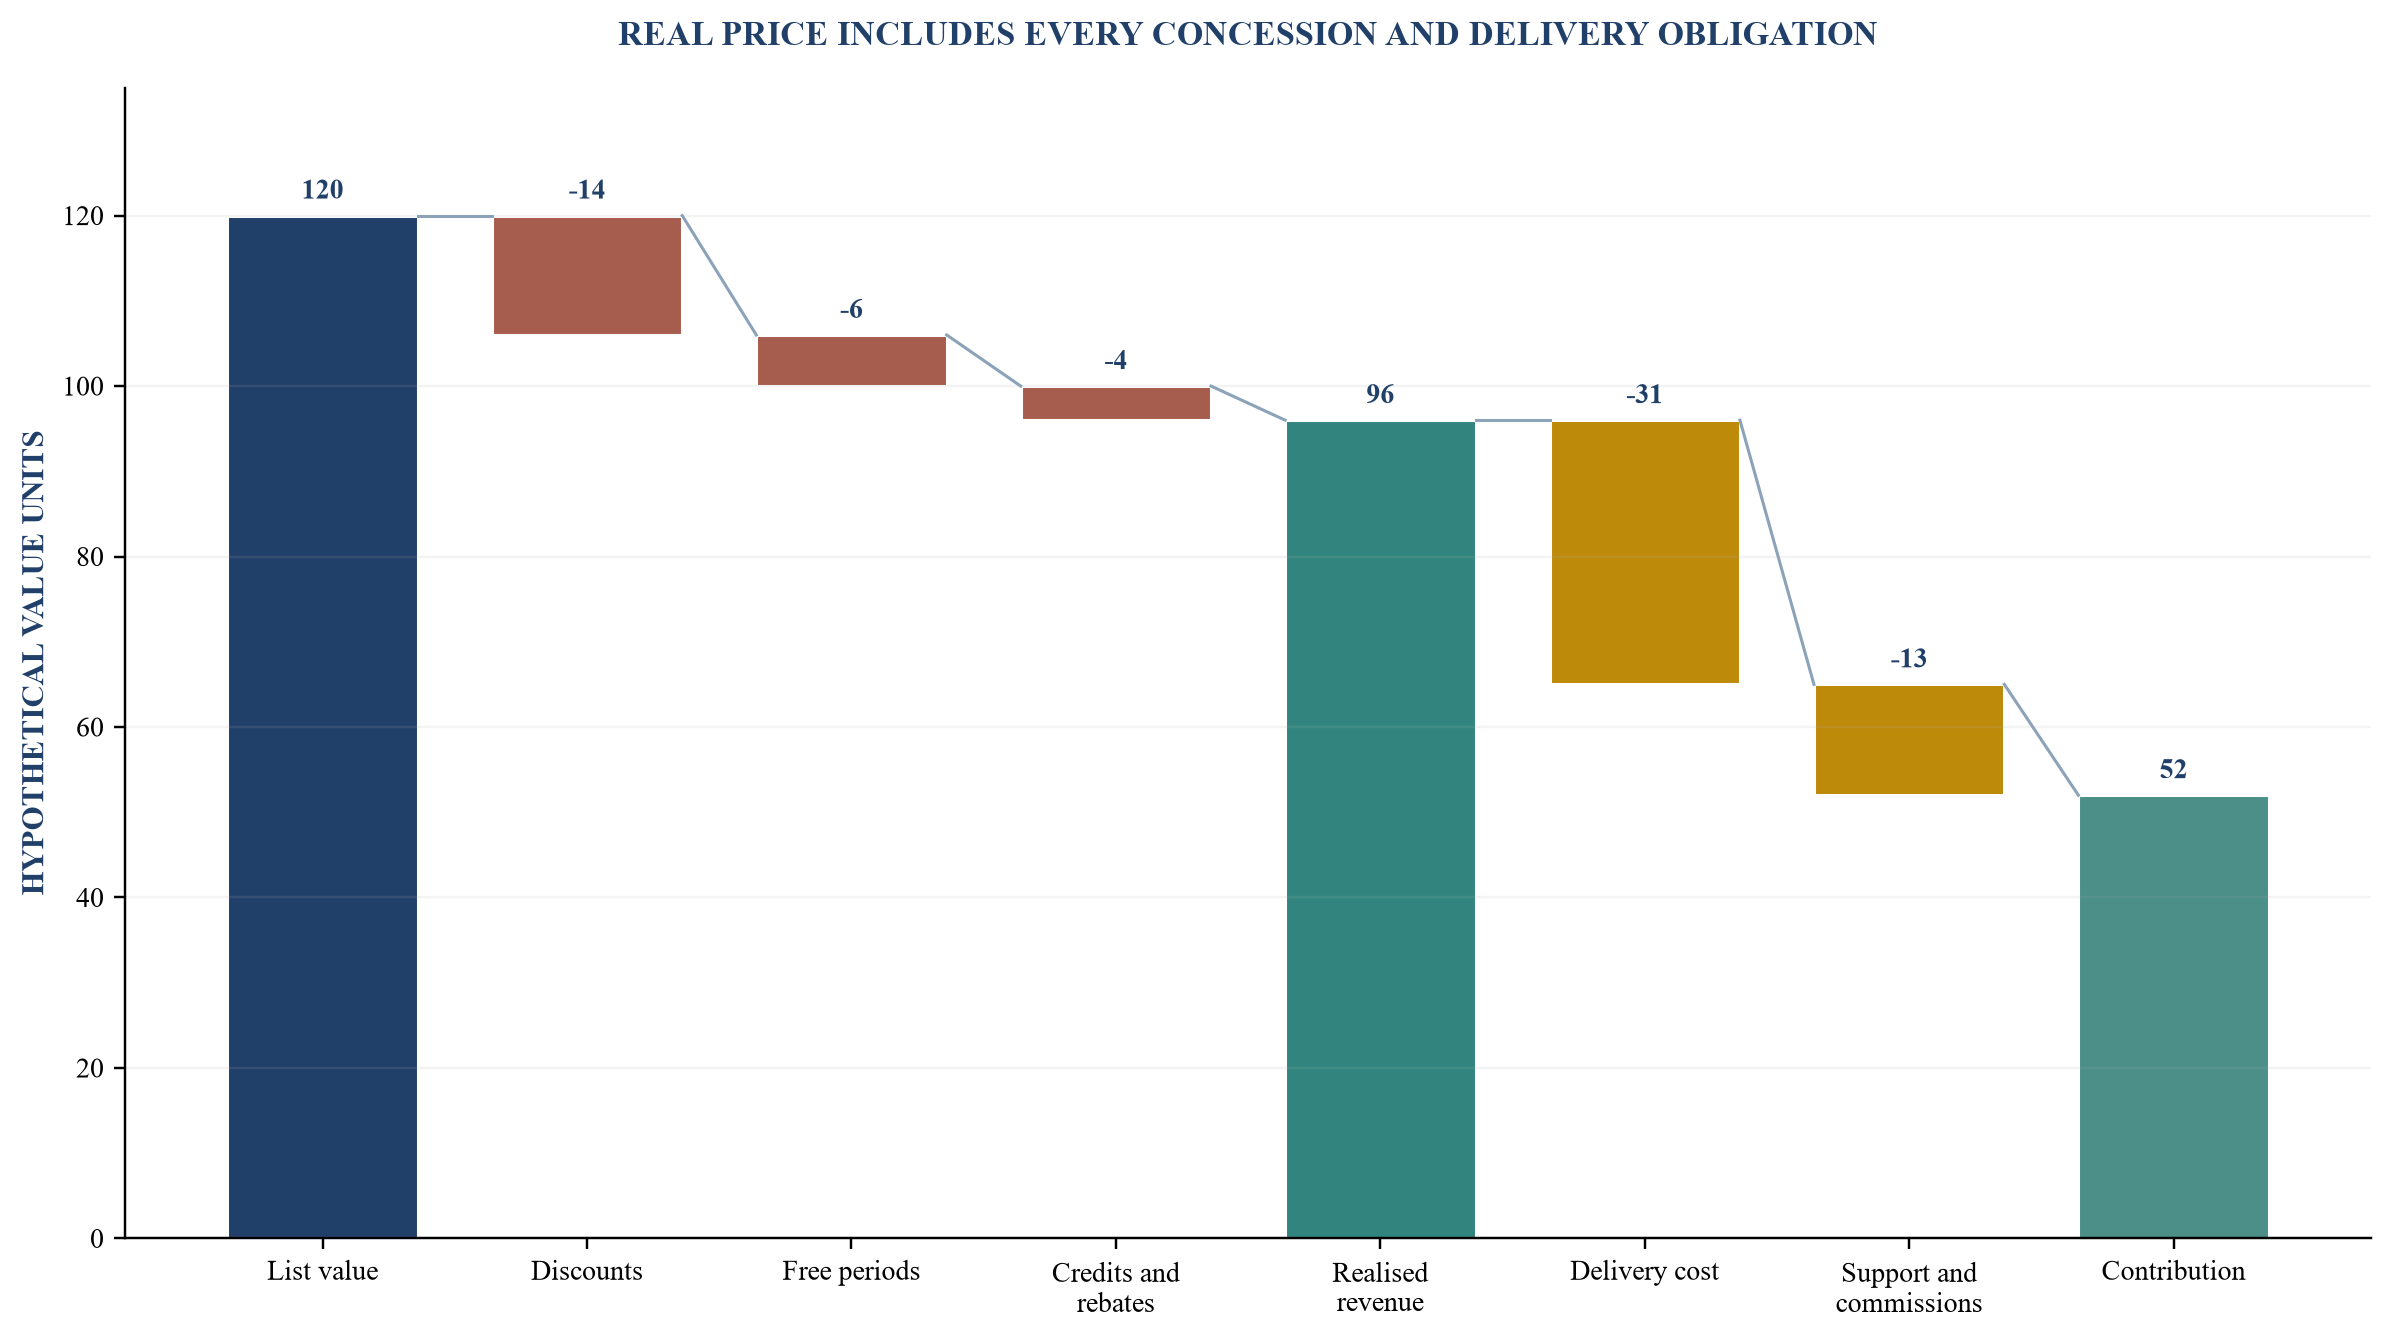
Values are hypothetical modelling assumptions in arbitrary monetary units. Cost classification and accounting treatment require company-specific analysis.
9. Connect commercial terms to revenue and cash
Commercial progress becomes economic progress through executable contracts, delivery and collection. The revenue system should therefore include finance and legal before the final contracting stage. Standard terms can accelerate cycle time, while controlled exceptions protect economics and accounting.
The contract record should identify customer, legal entities, products and services, price, currency, term, renewal, performance obligations, acceptance, variable consideration, termination, service levels, liability, data, tax, invoicing and payment. Sales operations should reconcile the approved quote to the executed agreement. Finance should determine the accounting treatment and schedule.
IFRS 15 requires judgments around matters such as distinct obligations, variable consideration, principal-agent relationships, contract modifications and recognition over time or at a point in time.[1] The FRC's review of large private-company reporting highlighted the need for entity-specific revenue policies explaining significant streams, recognition timing and how revenue amount is determined.[20] These are financial-reporting requirements and observations; they also show why commercial teams need contract data that finance can interpret.
Cash terms deserve equal visibility. Bookings secured through extended payment, acceptance conditions or disputed scope can create working-capital pressure. The weekly system should show invoices due, overdue balances, disputes, credit notes and the commercial owner for resolution. Sales incentives should avoid rewarding signed value without regard to approved terms, delivery feasibility or collection risk.
Contract changes must return to control. Scope additions, implementation delays, credits and renewals can alter contribution, recognition and customer health. A signed original contract should not remain the only economic record when the live arrangement has changed.
10. Make onboarding the first retention control
Retention begins before contract signature because the promise, scope and success criteria set customer expectations. A weak handoff from sales to delivery can convert an apparent win into delayed adoption, margin leakage, disputes and renewal risk.
The handoff should record customer objectives, users, sponsor, agreed outcomes, scope, assumptions, dependencies, timeline, commercial terms, risks and expansion hypotheses. Delivery should confirm feasibility before the final commitment when implementation complexity is material. The account record should preserve which promised features or outcomes are contractual, planned or aspirational.
Onboarding milestones should reflect value achieved rather than internal activity alone. Examples include data connected, user group activated, workflow adopted, first output accepted, business process changed or measurable benefit observed. Each milestone needs owner, evidence and target date. Delay reasons should distinguish customer dependency, product issue, resource constraint, scope change and poor qualification.
The first executive review should compare the agreed value case with actual progress. It can confirm sponsorship, adoption, delivery effort, emerging risk and the route to renewal. Early visibility allows the company to repair execution or reset expectations while choices remain available.
Implementation economics should feed pricing and segment strategy. A segment can appear attractive on gross revenue while consuming specialist time, custom development or support. Actual effort by account, product and segment improves future quoting and capacity decisions.
11. Measure retention through cohorts and economic movements
Retention should separate starting recurring revenue, churn, contraction, expansion, price, currency, acquisitions and reactivation. Gross revenue retention measures loss and contraction from the opening base before expansion. Net revenue retention includes expansion. Logo retention counts customers and can move differently from revenue retention when large accounts dominate.
Definitions need controlled treatment for pilots, usage contracts, seasonal business, renewals pending signature, acquired customers, migrations, currency and one-time services. A customer that reduces one product while expanding another requires a consistent account and product view. A delayed invoice does not necessarily equal churn, while silent non-use can signal future churn before contract end.
Cohorts should be grouped by acquisition period, segment, product, channel, seller, implementation pattern and contract type where useful. The purpose is to identify repeatable causes. A cohort with weak retention can reflect poor fit, overpromising, deficient onboarding, product gaps, service failure, budget change or an unstable customer base.
IFRS 8 requires disclosure of reliance on major customers when the specified threshold is met within its scope.[2] Internal management should examine concentration at lower decision-relevant thresholds as well. Strong aggregate retention can hide material dependence on one customer or renewal event.
Table 5. Retention cohort movement and intervention record
| Cohort movement | Definition | Primary evidence | Leading signal | Intervention owner |
|---|---|---|---|---|
| retained | opening recurring value continues on comparable scope | active contract and service | stable adoption and sponsor | account owner |
| price expansion | recurring value rises through approved price change | renewal or amendment | demonstrated value and early notice | commercial leader |
| volume or product expansion | additional units, usage, product or entity | executed order or contract | adoption, need and qualified expansion | account and product teams |
| contraction | lower recurring scope, volume or price | signed change or confirmed renewal | usage decline, budget or service issue | customer success |
| churn | customer relationship or recurring scope ends | termination, non-renewal or expiry | sponsor loss, unresolved value gap or competitive process | executive sponsor |
| reactivation | previously ended customer returns | new executed agreement | renewed trigger or changed proposition | sales and customer success |
Categories and trigger levels are illustrative. The company should define mutually exclusive movements and reconcile them to contracts, revenue and customer records.
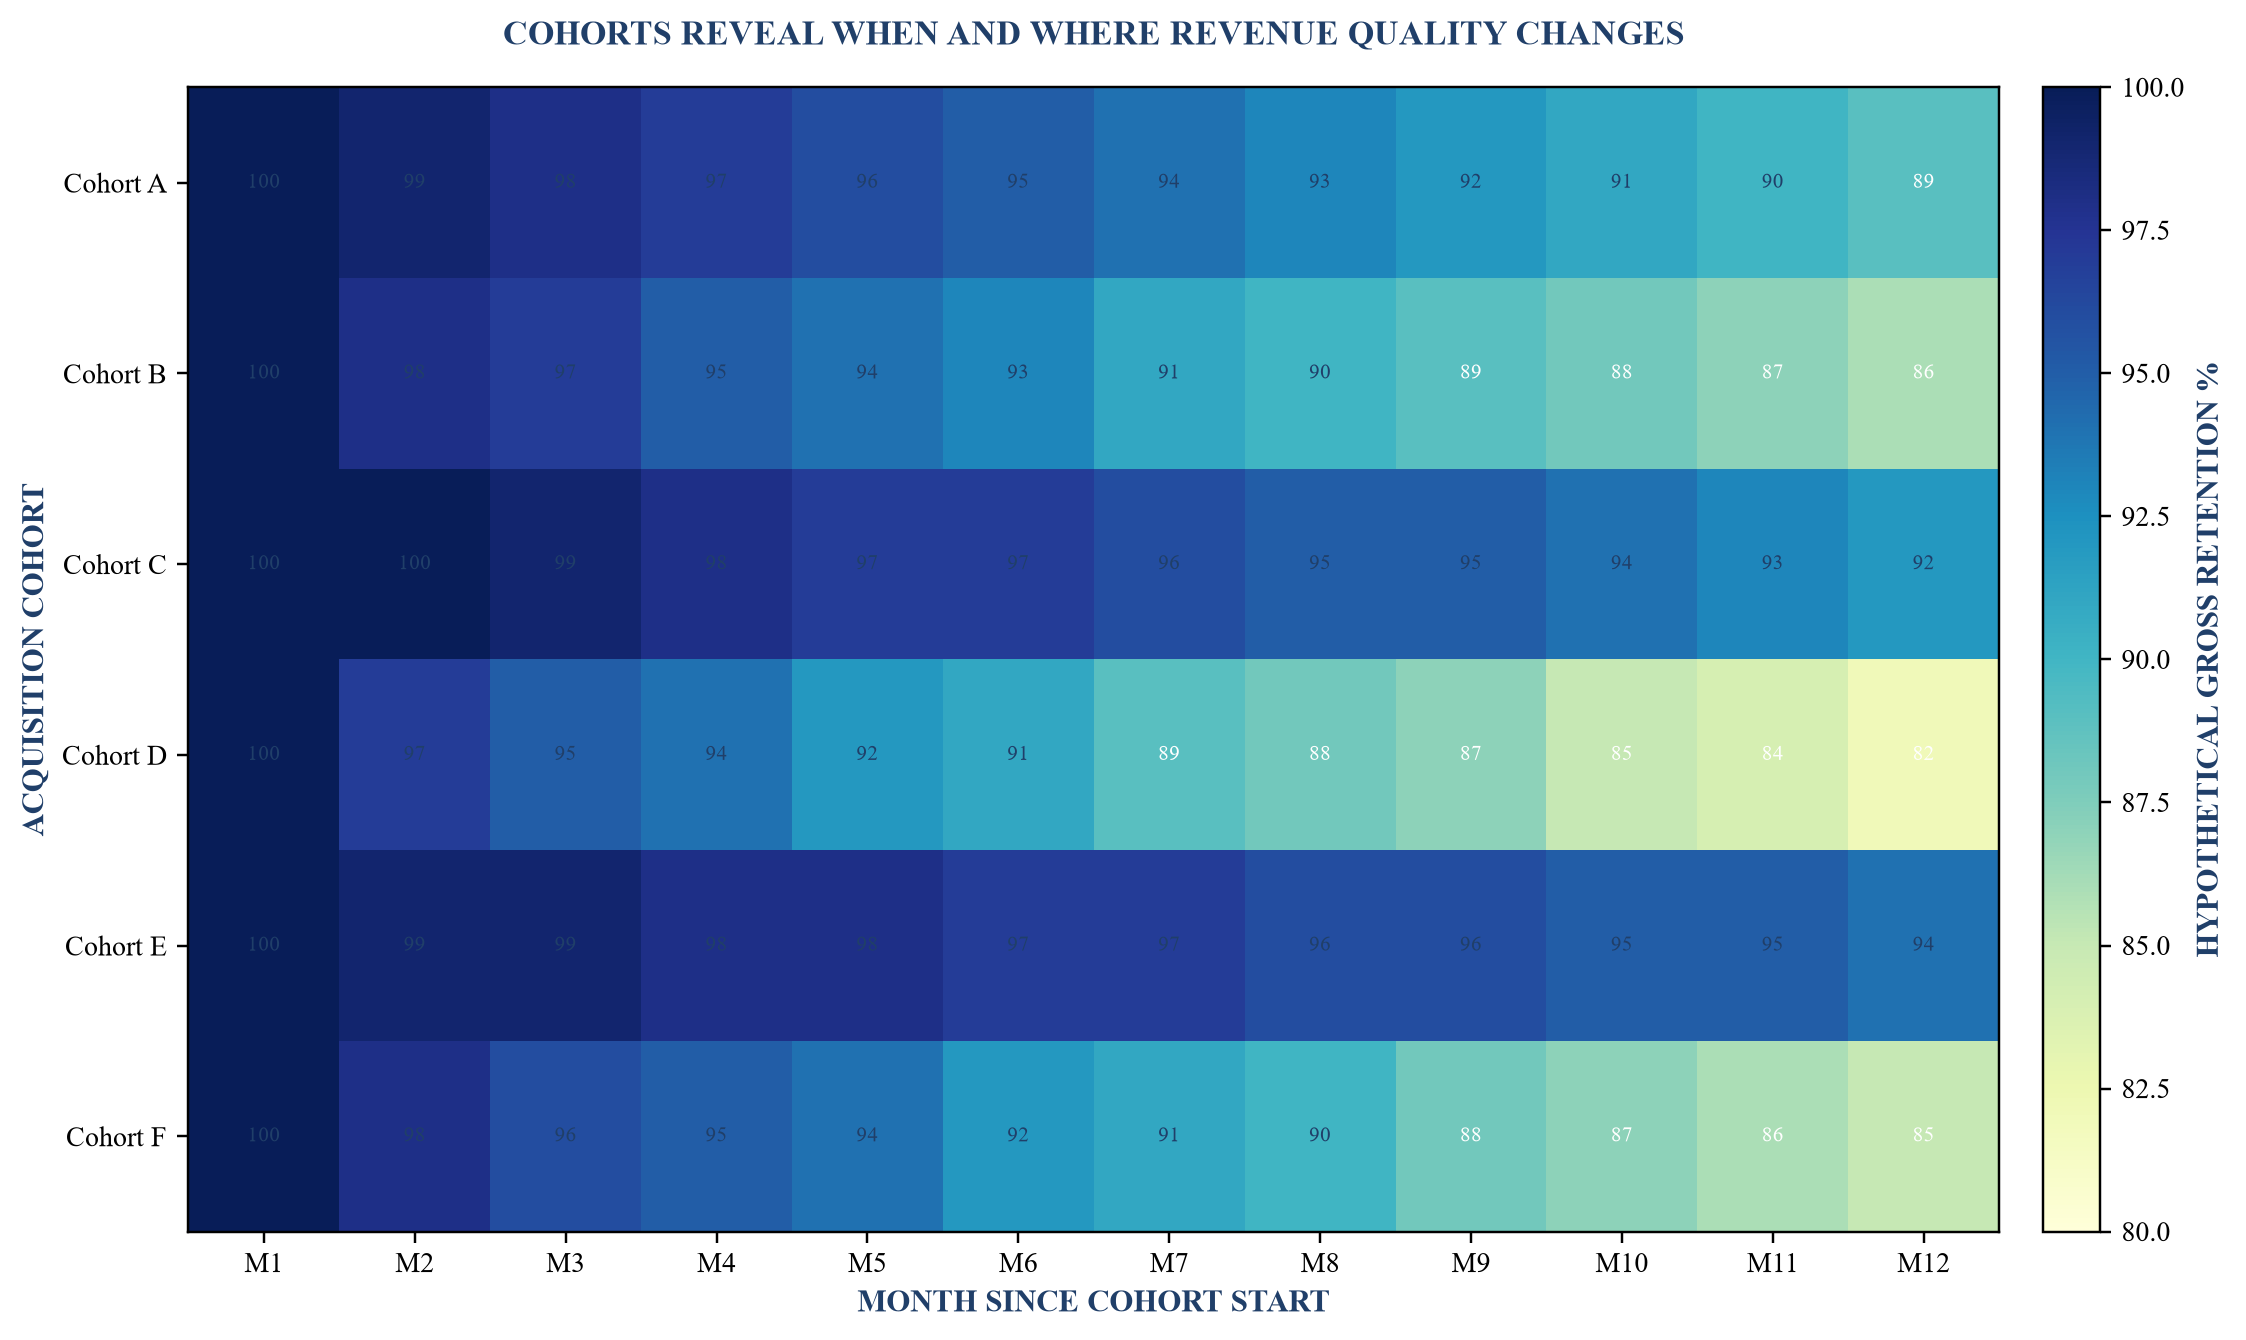
Percentages are hypothetical modelling assumptions. They illustrate cohort analysis and do not represent expected retention for any business model.
12. Treat expansion as a new qualified decision
Expansion can create efficient growth because the customer relationship, security review and operating context already exist. It can also become ungoverned scope growth that increases delivery cost and dependency. Each expansion should therefore have a customer problem, value case, sponsor, offer, commercial basis and delivery capacity.
The account plan should identify whitespace by product, use case, business unit, geography and user group. Adoption and support data can reveal where a customer derives value and where additional scope is credible. Expansion triggered solely by a seller target can create proposals without customer ownership.
Cross-sell needs a coherent proposition. Products should connect through workflow, data, economics or governance. A catalogue of unrelated offerings can confuse buyers and dilute delivery focus. The company should test attachment, time to expansion, incremental contribution, implementation effort and retention after expansion.
Executive sponsorship can help remove barriers and connect outcomes to the customer's priorities. It should add substance rather than ceremonial meetings. Sponsor reviews can confirm value realised, risks, decisions, upcoming changes and mutual commitments.
Expansion economics should remain visible in the retention bridge. Separating price, volume and product movements shows whether growth came from broader adoption, inflationary price, one large transaction or acquisition. This distinction matters to capacity planning and valuation.
13. Make channels accountable for end economics
Partners can expand reach, provide trust, add implementation capacity and lower acquisition cost. They can also obscure customer ownership, reduce realised price, increase support complexity and create concentration. Channel strategy should define the role, economics, account rules and evidence expected from each partner type.
The partner record should show sourced and influenced opportunities separately. It should identify customer access, qualification contribution, technical role, commercial entitlement, delivery responsibility, data rights and renewal ownership. Double counting occurs when multiple partners claim the same opportunity or when partner influence is recorded without evidence.
Economics include discount, commission, rebate, enablement, co-marketing, support and working-capital effects. The company should compare partner-led and direct motions on attainable contribution, conversion, cycle time, implementation and retention. A lower gross margin can be rational if capacity and access improve sufficiently.
Conflict and account ownership rules should be explicit. Registration should expire without progress. Named accounts need a tie-break process. Customer transparency should follow contractual and legal requirements. Partner incentives should reward executable revenue and customer outcomes rather than unqualified registrations.
Portfolio concentration can arise through one distributor or integrator even when end customers are diversified. Management should monitor the partner's financial condition, strategic priority, operational capacity, data access and termination consequences.
14. Run a weekly revenue operating cadence
The weekly meeting should convert evidence into decisions. It should review segment demand, account coverage, funnel changes, pricing exceptions, contracting, onboarding, retention risks, expansion and cash issues. Each item needs an owner, action, date and decision authority.
The pack should begin with reconciled outcomes and movements since the prior week. It should distinguish actuals, current forecast, committed customer actions and management scenarios. Forecast categories should have explicit evidence. A weighted pipeline calculation can support capacity analysis, but management should avoid treating probability multiplied by amount as contracted revenue.
The meeting should focus on exceptions and changes. New opportunity creation, stage movement, date movement, value change, stalled next actions, pricing concessions, contract blockers, onboarding delays, renewal risks and overdue cash are high-signal events. A full line-by-line recital of the pipeline can consume attention without decisions.
Monthly reviews should examine cohort conversion, segment economics, seller capacity, marketing contribution, product and delivery constraints, customer health and cash conversion. Quarterly board reviews should connect commercial outcomes to the value-creation plan, financing, risk and valuation.
Decision logs matter. The record should show what changed, why, who decided, which action follows and when the outcome will be checked. Repeated exceptions indicate a structural issue in proposition, pricing, capacity, process or data.
Table 6. Weekly revenue operating cadence and decision rights
| Review block | Evidence | Decision | Primary owner | Follow-through |
|---|---|---|---|---|
| segment and account coverage | target-account movement, access and triggers | allocate coverage and specialist capacity | commercial leader | named owner and next customer action |
| funnel movement | stage cohort, ageing, leakage and forecast change | advance, requalify, pause or close | sales leader | stage evidence and date updated |
| pricing and terms | waterfall, margin, cash and precedent | approve, change or decline exception | finance and commercial authority | quote and contract reconcile |
| contracting and onboarding | open clauses, obligations, dependencies and milestones | escalate blocker or reset commitment | legal, finance and operations | executable contract and delivery plan |
| retention and expansion | cohort movement, adoption, sponsor and renewal | intervene, expand, reprice or accept churn risk | customer success and executive sponsor | account action and outcome date |
| cash and disputes | invoices, overdue value, credits and disputes | collect, resolve, provision or stop service under policy | finance and account owner | cash or documented resolution |
Cadence and thresholds are illustrative. Meeting frequency and authority should follow the company's size, sales cycle, governance and risk.
15. Align incentives with durable contribution
Commercial incentives shape behaviour. A plan based only on signed value can reward discounting, weak qualification, poor terms and revenue that delivery cannot support. A plan based only on recognised revenue can under-reward long-cycle origination. The design should reflect controllable contributions across the customer lifecycle.
Measures may include approved bookings, recognised revenue, realised contribution, cash collection, renewal, expansion, price quality, strategic account progress and team outcomes. Weighting should remain understandable. Complex plans can create disputes and obscure the behaviour being rewarded.
Credit rules need treatment for multi-seller, partner, renewal and expansion situations. Clawbacks or deferrals should follow clear conditions such as cancellation, non-payment or material misrepresentation. The company should obtain legal, tax and employment advice for the jurisdictions involved.
Targets should reconcile to segment opportunity and capacity. Raising a quota without increasing accessible accounts, product readiness, seller capacity or conversion evidence can create pipeline inflation. Management should distinguish ambition from the operating assumptions required to deliver it.
Board and remuneration oversight should test whether incentives align with strategy, risk and long-term value. The G20/OECD Principles describe the importance of remuneration policies aligned with business strategy, governance and risk management.[15] Their scope is broader than this operating model, while the alignment principle remains relevant.
16. Build control into the revenue system
The revenue system influences contracts, financial reporting, forecasts, valuation, remuneration and lender information. Controls should cover access, approvals, changes, interfaces, reconciliations and review. They should remain proportionate to risk and company scale.
Role-based access should separate opportunity ownership, price approval, contract execution, revenue accounting and payment changes where practical. Material changes to amount, stage, close date, discount, terms and customer identity should be logged. Interfaces between CRM, contract, billing and finance systems should be monitored for failed or duplicate records.
Reconciliations should connect opportunity to quote, quote to contract, contract to billing, billing to revenue and receivables to cash. Samples can test whether records reflect source evidence. Forecast overrides should record rationale and authority. Manual spreadsheets used for board or lender reporting should have controlled inputs, versions and review.
COSO's Internal Control framework identifies control environment, risk assessment, control activities, information and communication, and monitoring as integrated components.[13] The FRC's UK Corporate Governance Code 2024 addresses board monitoring and review of material financial, operational, reporting and compliance controls for companies within its scope.[14] A PE-owned company can use these principles to design proportionate commercial controls even when the Code does not apply directly.
Revenue recognition commonly receives audit attention because management judgment and incentives can create risk. ISA 240 (Revised), issued in 2025, strengthens the fraud lens in audit risk assessment and response within its scope.[17] Management should ensure cut-off, side agreements, variable consideration and contract changes are visible to finance and auditors.
17. Connect operating improvement to an exit-value bridge
An exit-value bridge should show how operating changes affect enterprise value and equity value under explicit assumptions. It begins with a baseline of sustainable earnings or cash flow and the valuation approach. It then separates organic revenue growth, price and mix, retention, contribution margin, cost, acquisitions, multiple movement, debt and cash.
IFRS 13 defines fair value as an exit price based on market-participant assumptions under current market conditions within its scope.[5] The 2025 IPEV Guidelines describe current best practice for private-capital valuations reported at fair value.[6] The FCA's 2025 review emphasised valuation governance, conflicts, independence, documentation, consistency and transparent value bridges.[7] These frameworks do not validate a management exit case. They require disciplined evidence and judgment.
The bridge should distinguish controllable operating value from external multiple movement. Management can improve revenue quality and earnings while market multiples decline. An increase in multiple can reflect market conditions, business mix, scale, growth quality, concentration, governance or buyer expectations. Each driver should have evidence and sensitivity.
Adjusted EBITDA requires controlled definitions and reconciliation. The SEC's non-GAAP guidance illustrates why labels and adjustments matter where its rules apply.[8][9] Internal and transaction reporting should identify recurring and non-recurring items, cash consequences and the source of each adjustment. A prospective buyer will test sustainability.
Debt and cash complete the equity bridge. Revenue acceleration that consumes working capital or requires acquisition debt can increase enterprise value while producing less equity value than expected. The Bank of England's July 2026 report highlights leverage, valuation uncertainty and financing vulnerabilities in private markets.[18] Company-specific financing terms and downside capacity therefore belong beside commercial scenarios.
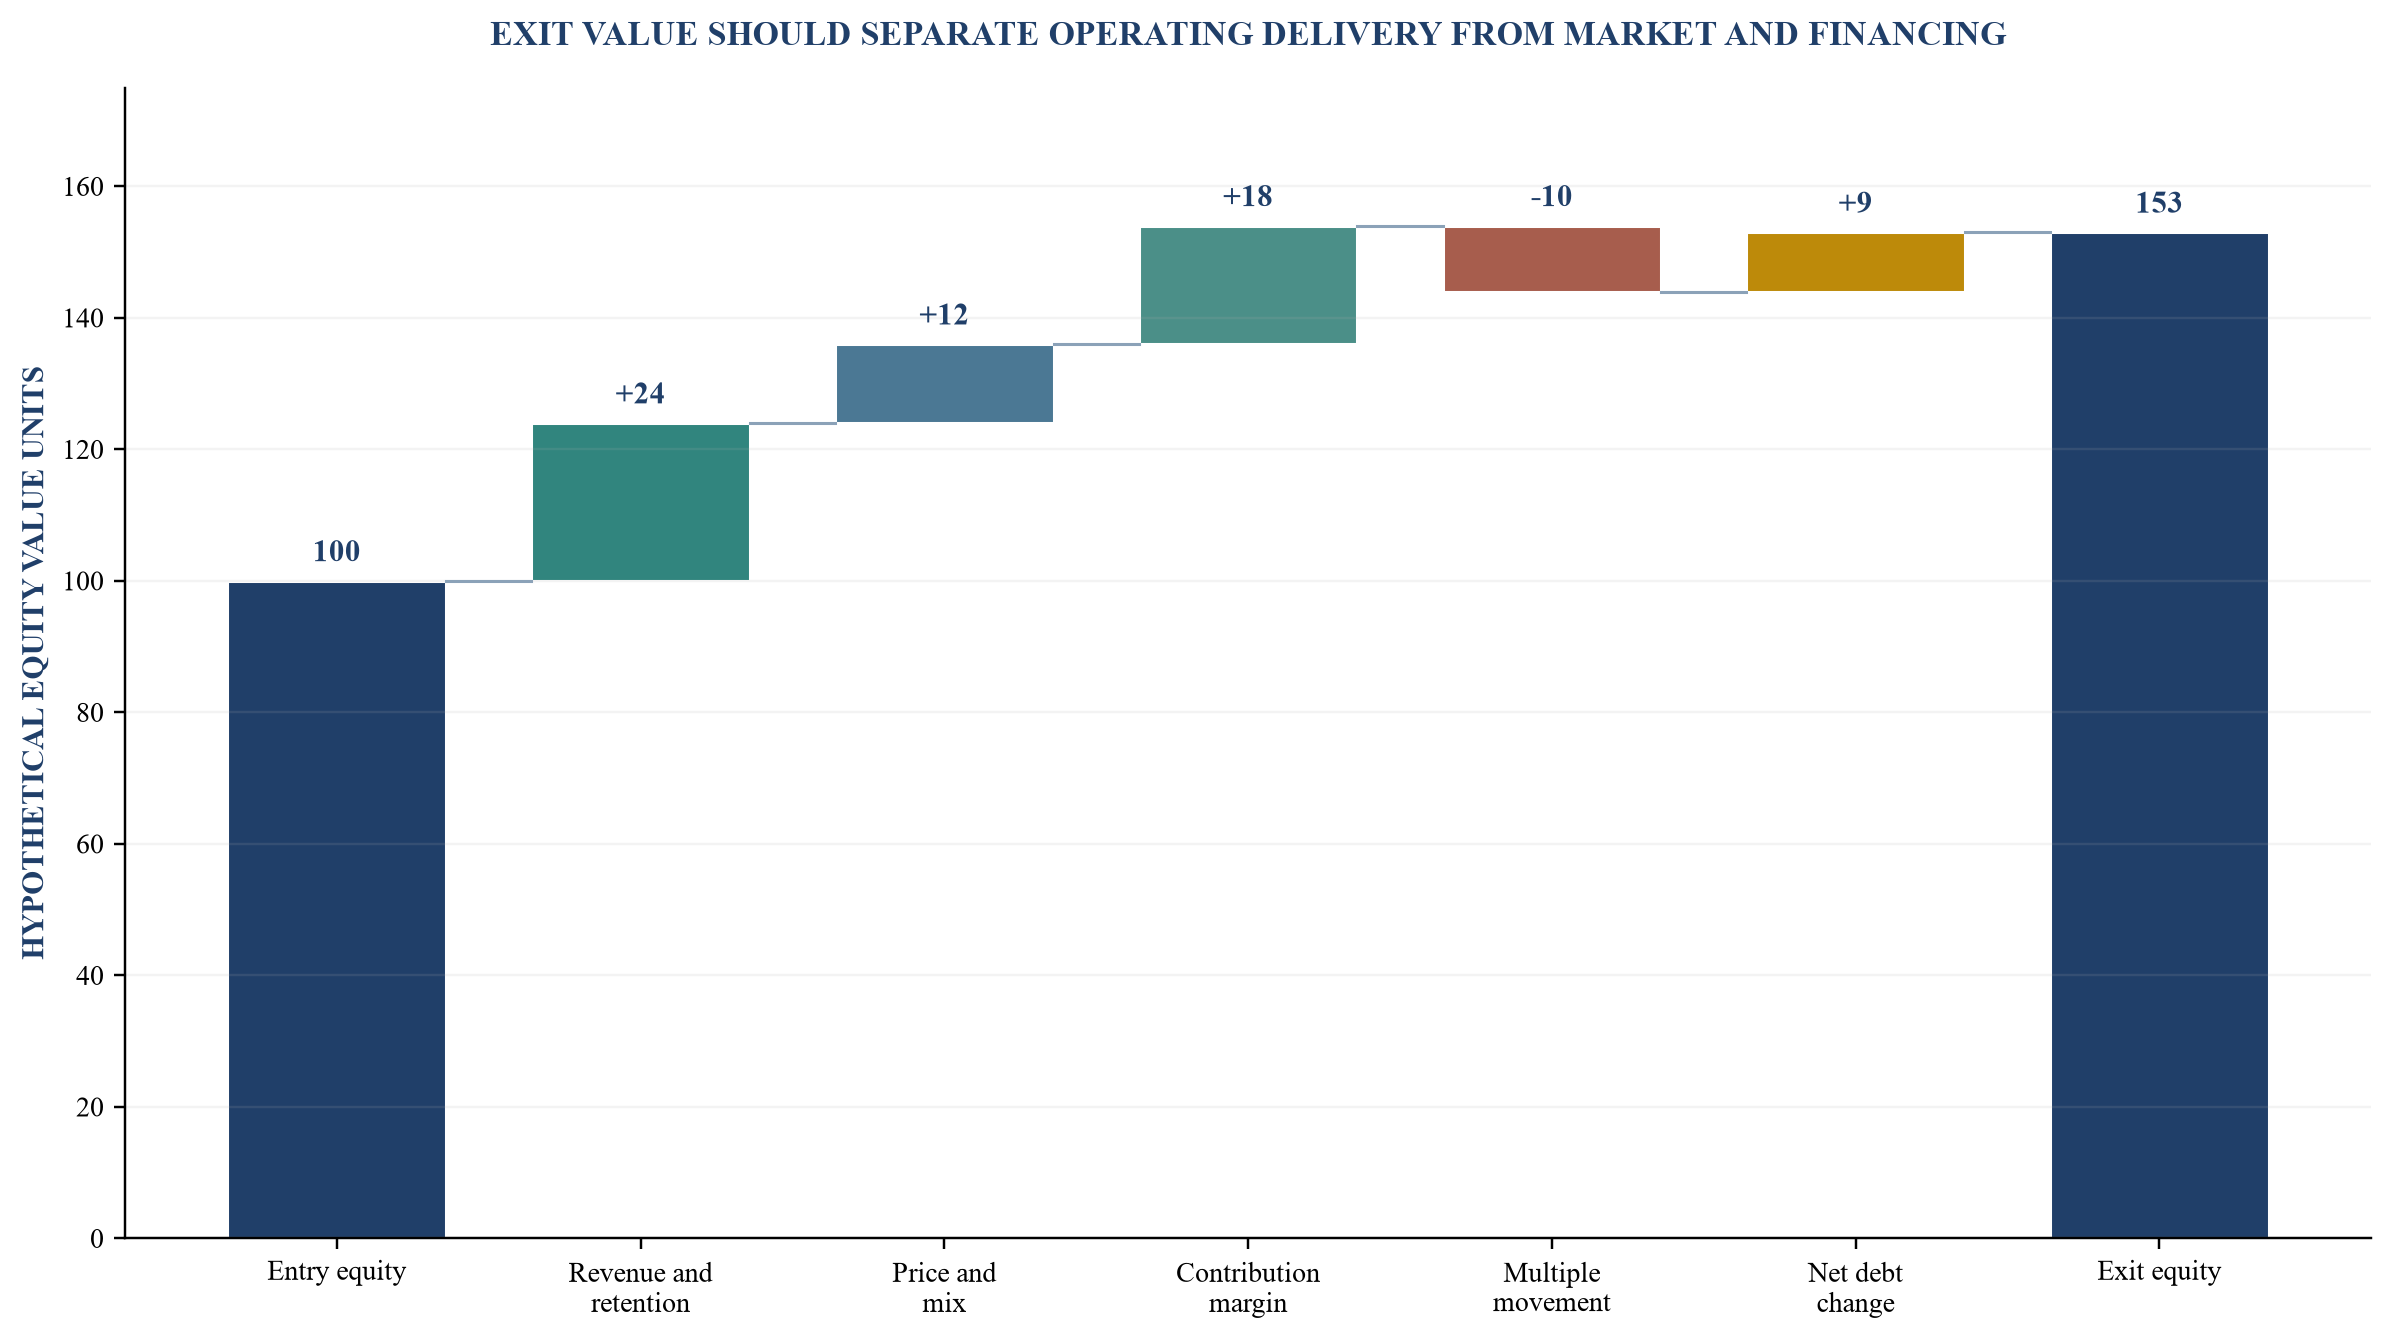
Values, multiples and adjustments are hypothetical modelling assumptions. The exhibit is not a valuation, forecast or investment-return estimate.
18. Mobilise the system in one hundred days
The first phase should establish facts, controls and a manageable cadence. It should avoid launching every commercial initiative at once. The company needs a reconciled baseline, segment priorities, metric dictionary, funnel rules, pricing authority, retention cohorts and a decision calendar.
During the first twenty days, management should reconcile contracts, revenue, margin, cash, customers and pipeline; map systems and owners; define metrics; and identify urgent revenue, retention and collection risks. Missing evidence should be recorded rather than reconstructed as certainty.
During days twenty-one to fifty, the company should score segments, define target accounts, rebuild stages around buyer evidence, introduce next-action discipline, establish the price waterfall and create renewal cohorts. Management should close stale opportunities and surface the resulting forecast change to the board.
During days fifty-one to eighty, the team should operate the weekly cadence, run win-loss and pricing reviews, correct onboarding handoffs, launch interventions for material renewal risks and reconcile the first complete revenue pack. Incentives and authority should be checked for alignment.
During days eighty-one to one hundred, management should test controls, review exceptions, update the value bridge and agree the next quarter's initiatives. The board should receive evidence of baseline quality, operating changes, observed results, remaining risks and scenario limitations.
Success should be measured through operating evidence: coverage with verified next actions, stage-record completeness, cohort conversion, stage ageing, realised price, contribution, onboarding time, retention movements, forecast accuracy, overdue cash and exception closure. No single measure proves acceleration. The connected pattern shows whether revenue is becoming more repeatable and valuable.
Conclusion
Revenue acceleration in a PE-owned B2B company requires a connected operating system. Segment choices determine where the company spends scarce capacity. Named-account coverage turns those choices into access. Stage evidence converts activity into a governable funnel. Pricing and commercial terms convert demand into contribution, recognised revenue and cash. Onboarding and retention determine whether the relationship compounds.
The weekly cadence should reveal changes and force decisions. It should expose weak qualification, stalled next actions, uncontrolled concessions, contracting blockers, delivery risk, renewal deterioration and cash disputes. Each exception needs an owner, authority, date and outcome check.
Exit readiness follows from the same evidence. A buyer or lender will examine market position, customer concentration, revenue recognition, pipeline reliability, pricing, margin, retention, cash conversion and controls. A transparent value bridge separates operating progress from external multiples, leverage and acquisition effects.
The practical test is simple. Management should be able to explain which segments create attractive contribution, which accounts are genuinely covered, where the funnel leaks, how price becomes cash, why customers renew, and how those outcomes affect sustainable value. The answers should reconcile to current records and clearly stated assumptions.
Appendix A. Controlled commercial metric definitions
Bookings are the value of executed customer commitments under the company's controlled definition. The definition should state treatment of cancellation, usage, variable consideration, renewals, services, currency and contract changes. Bookings do not equal recognised revenue or cash.
Backlog is contracted value expected to be recognised in future periods under the company's definition. Remaining performance obligations under IFRS reporting may differ from an internal backlog measure. Finance should explain and reconcile the difference where both are used.
Pipeline is the value of open opportunities meeting the minimum record and stage rules. Coverage divides a controlled pipeline measure by the relevant target, and its usefulness depends on stage quality, conversion, timing and deal mix. Weighted pipeline is a scenario tool rather than contracted revenue.
Gross revenue retention starts with a defined recurring-revenue base and subtracts churn and contraction from that cohort. Net revenue retention also includes expansion. Both require rules for price, currency, acquired customers, reactivation, one-time services, migration and account hierarchy.
Contribution should identify included revenue and direct costs. It may differ from gross profit or EBITDA. Realised price should include all discounts, free periods, credits, rebates and commercially linked concessions under a stated method.
Appendix B. Board challenge questions
- Which commercial measures reconcile directly to accounting records, and which are management-defined?
- Which segments receive incremental capacity, and what evidence supports their attainable contribution?
- What proportion of target accounts has verified buying-group access and a dated customer action?
- Which funnel stages require buyer evidence, and where are ageing and date movement concentrated?
- How much nominal price is lost through discount, free scope, terms, credits and delivery cost?
- Which onboarding delays arose from qualification, product, delivery or customer dependency?
- Which retention cohorts are weakening, and what causes are supported by account evidence?
- How concentrated are revenue, pipeline, channel access and renewals?
- Which forecast changes follow customer evidence, and which remain management scenarios?
- Which incentives could reward weak economics, poor terms or low-quality pipeline?
- Which system reconciliations and controls failed, and when will they be remediated?
- How much of the value bridge comes from operating delivery, multiple movement, leverage or acquisitions?
References
- IFRS Foundation, IFRS 15 Revenue from Contracts with Customers, issued standard and supporting overview, accessed 29 August 2026. https://www.ifrs.org/issued-standards/list-of-standards/ifrs-15-revenue-from-contracts-with-customers/
- IFRS Foundation, IFRS 8 Operating Segments, issued standard, including major-customer information, accessed 29 August 2026. https://www.ifrs.org/issued-standards/list-of-standards/ifrs-8-operating-segments/
- IFRS Foundation, IFRS Practice Statement 1 Management Commentary, revised June 2025. https://www.ifrs.org/issued-standards/list-of-standards/management-commentary-practice-statement-1/
- IFRS Foundation, IFRS 18 Presentation and Disclosure in Financial Statements, issued standard, accessed 29 August 2026. https://www.ifrs.org/issued-standards/list-of-standards/ifrs-18-presentation-and-disclosure-in-financial-statements/
- IFRS Foundation, IFRS 13 Fair Value Measurement, issued standard, accessed 29 August 2026. https://www.ifrs.org/issued-standards/list-of-standards/ifrs-13-fair-value-measurement/
- International Private Equity and Venture Capital Valuation Board, International Private Equity and Venture Capital Valuation Guidelines, December 2025. https://www.privateequityvaluation.com/Portals/0/Documents/Guidelines/2025%20IPEV%20Valuation%20Guidelines.pdf
- Financial Conduct Authority, Private market valuation practices: multi-firm review, published 5 March 2025. https://www.fca.org.uk/publications/multi-firm-reviews/private-market-valuation-practices
- U.S. Securities and Exchange Commission, Non-GAAP Financial Measures: Compliance and Disclosure Interpretations, last reviewed 13 December 2022. https://www.sec.gov/rules-regulations/staff-guidance/corporation-finance-interpretations/non-gaap-financial-measures
- U.S. Securities and Exchange Commission, Conditions for Use of Non-GAAP Financial Measures, issued 22 January 2003. https://www.sec.gov/rules-regulations/2003/03/conditions-use-non-gaap-financial-measures
- Competition and Markets Authority, Merger Assessment Guidelines, CMA129, published 18 March 2021. https://assets.publishing.service.gov.uk/media/61f952dd8fa8f5388690df76/MAGs_for_publication_2021_--_.pdf
- UK Government Data Quality Hub, The Government Data Quality Framework, published 3 December 2020. https://www.gov.uk/government/publications/the-government-data-quality-framework/the-government-data-quality-framework
- UK Government Data Quality Hub, Data Quality Action Plan Implementation Guide, published April 2026. https://www.gov.uk/government/publications/implement-a-data-quality-action-plan/data-quality-action-plan-implementation-guide
- Committee of Sponsoring Organizations of the Treadway Commission, Internal Control: Integrated Framework, framework resources, accessed 29 August 2026. https://www.coso.org/guidance-on-ic/pages/default.aspx
- Financial Reporting Council, UK Corporate Governance Code 2024, published January 2024. https://www.frc.org.uk/library/standards-codes-policy/corporate-governance/uk-corporate-governance-code/
- Organisation for Economic Co-operation and Development, G20/OECD Principles of Corporate Governance 2023, published 11 September 2023. https://doi.org/10.1787/ed750b30-en
- Financial Accounting Standards Board, Accounting Standards Update 2023-07: Segment Reporting (Topic 280), issued November 2023. https://storage.fasb.org/ASU%202023-07.pdf
- International Auditing and Assurance Standards Board, ISA 240 (Revised), The Auditor's Responsibilities Relating to Fraud in an Audit of Financial Statements, issued 8 July 2025. https://www.iaasb.org/publications/isa-240-revised-auditor-s-responsibilities-relating-fraud-audit-financial-statements
- Bank of England, Financial Stability Report, July 2026. https://www.bankofengland.co.uk/financial-stability-report/2026/july-2026
- Financial Reporting Council Lab, Performance Metrics: Principles and Practice, published November 2018. https://media.frc.org.uk/documents/Lab_Performance_Metrics__principles_and_practice.pdf
- Financial Reporting Council, Review of Reporting by the UK's Largest Private Companies, published 31 January 2024. https://www.frc.org.uk/news-and-events/news/2024/01/review-of-reporting-by-the-uks-largest-private-companies/
