

1. Define the transaction decision
An autonomous-trucking transaction should begin with a decision that can be tested. The buyer may seek a software platform, a safety case, access to trained personnel, a validated vehicle stack, commercial lanes, customer contracts, terminal infrastructure or an operating carrier. Each objective carries a different asset perimeter, capital requirement and liability profile. A presentation that combines autonomous miles, signed partnerships and addressable freight does not establish value.
The board should identify the economic unit it intends to acquire. For a lane-based freight service, that unit can be a paid, accepted and insured autonomous mile within a defined operational design domain, delivered at complete cost. Complete cost includes the tractor, trailer interface, autonomous hardware, software, connectivity, map maintenance, terminals, inspections, maintenance, remote assistance, roadside response, insurance, claims administration, customer operations and the capital required during ramp-up.
The counterfactual is equally important. A strategic buyer can license technology, invest through a joint venture, purchase selected intellectual property, contract for capacity or acquire the operating platform. Full acquisition may be rational where control of the safety case, engineering roadmap, customer operations and incident response is essential. A staged commercial arrangement may preserve capital where route validation, insurability or unit economics remain immature.
The investment memorandum should state excluded value. Unopened lanes, unapproved weather conditions, future vehicle generations, unsigned customers, assumed insurance savings and unsupported utilisation remain outside the base case. They can enter a probability-weighted expansion case when the technical, regulatory, commercial and capital gates are defined.
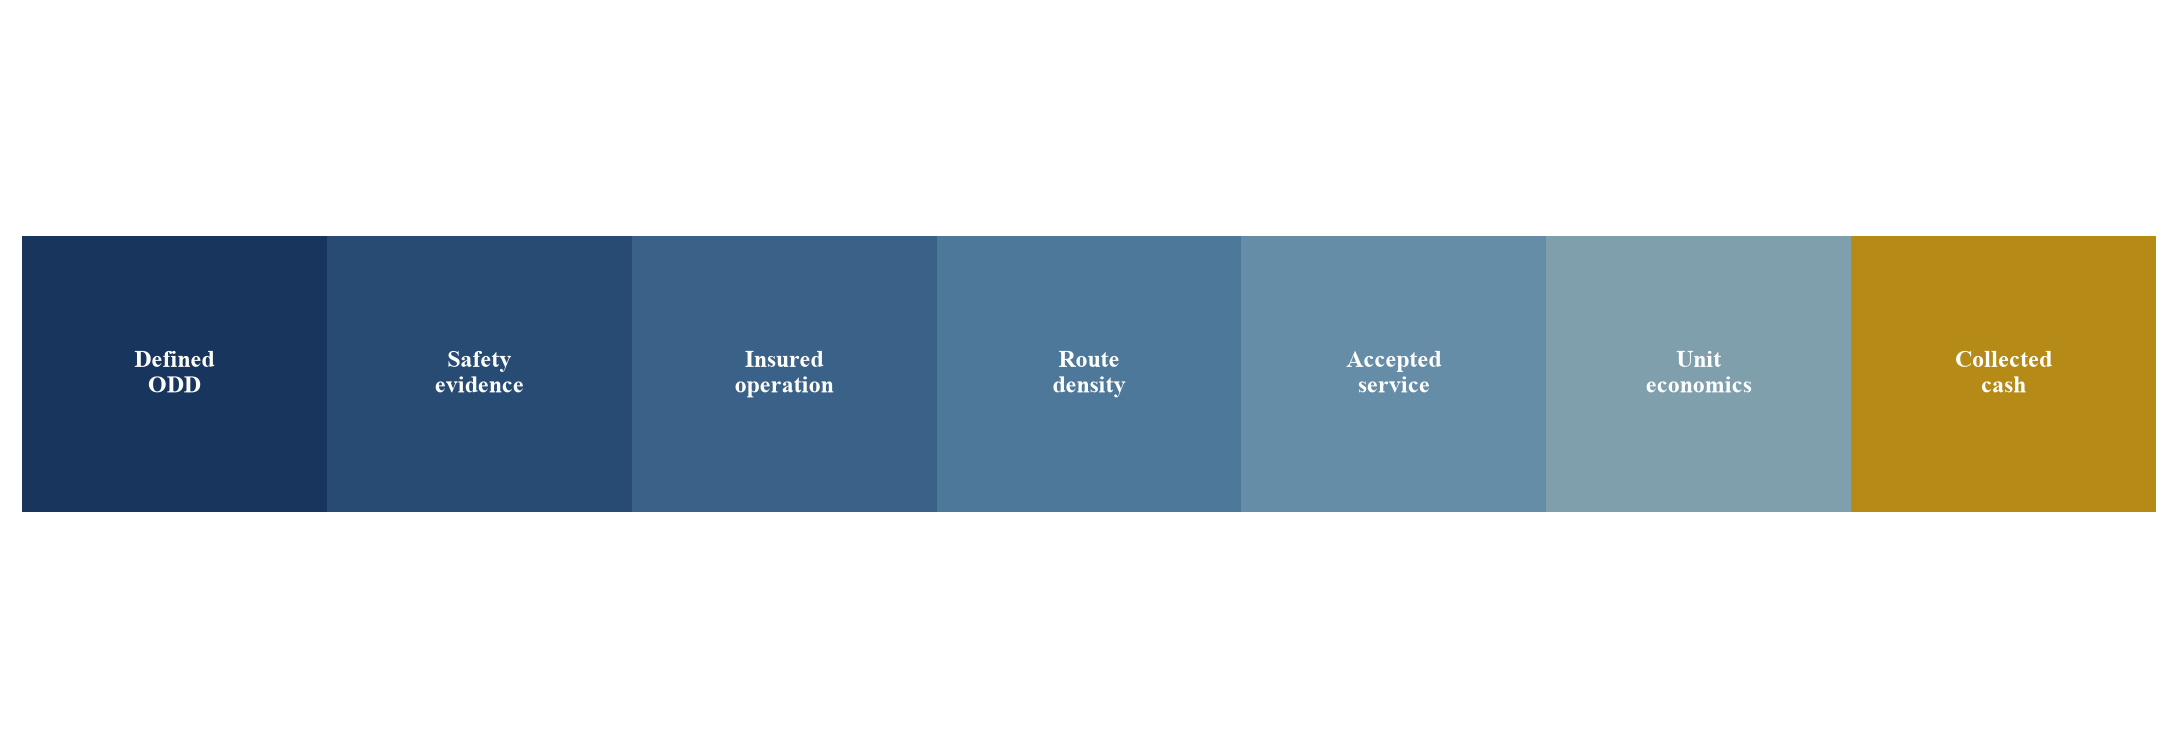
The proposed chain connects a defined operating domain to safety evidence, insured operations, route density, accepted freight service and collected cash.
2. Define the operational design domain
The operational design domain, or ODD, describes the conditions in which the automated driving system is designed to operate. Relevant dimensions include road classes, geography, traffic, construction, weather, visibility, speed, lighting, vehicle configuration, cargo constraints, communications and terminal operations. FMCSA research emphasises that ODD conditions can include environmental, geographical, time-of-day, traffic and roadway characteristics.[5]
The transaction team should convert the ODD from a product description into a controlled register. Each route segment receives an approved state, limitations, evidence owner, validation date and change history. A route that is commercially attractive can remain outside the approved domain. A route within the technical domain can remain uneconomic because of empty repositioning, low freight density, poor terminal access or expensive recovery coverage.
ODD boundaries need operational enforcement. Dispatch systems should prevent assignment outside approved conditions. Weather, road closures, construction, vehicle faults and map changes should trigger a defined response. The buyer should verify whether the system slows, exits, transfers to a minimal-risk condition, requests assistance or stops operations. A policy document without technical and dispatch controls does not establish compliance.
Expansion should be incremental and evidenced. Opening a related lane can reuse vehicles, terminals, maps, maintenance and safety methods, while new weather, geography or traffic conditions may require additional validation. The valuation model should distinguish simple route replication from material domain expansion.
| Dimension | Required evidence | Operating control | Valuation treatment |
|---|---|---|---|
| Geography and road | approved segments and change log | geofence and dispatch gate | include approved miles only |
| Weather and visibility | tested thresholds and monitoring | suspend or degrade by rule | probability-weight expansion |
| Traffic and construction | scenario coverage and route updates | dynamic restriction process | apply interruption and diversion cost |
| Vehicle and trailer | validated configurations | configuration identity check | exclude unqualified equipment |
| Terminal | yard process and hand-off acceptance | controlled entry and inspection | include terminal capacity cost |
| Communications | coverage latency and outage response | fallback and minimal-risk action | price resilience investment |
| Cargo | permitted loads and handling limits | booking and manifest rules | separate restricted revenue |
The register connects operating conditions to evidence, controls and transaction treatment.
3. Build a lane and vehicle ledger
The lane ledger is the commercial equivalent of an installed-base register. It should identify origin, destination, highway segments, terminals, operating windows, approved conditions, customer, commodity, contracted volume, actual loads, empty miles, price, service levels and interruption history. Each field needs a source and reconciliation owner.
The vehicle ledger should identify tractor, autonomous hardware, software release, sensor configuration, maintenance status, trailer compatibility, ownership, financing, insurance, inspection and operating history. Test vehicles, supervised vehicles, driverless commercial vehicles and spare capacity remain distinct. Miles from one category should not be used as evidence for another without a documented basis.
Route and vehicle records must connect. A platform may report many autonomous miles while commercial operations depend on a small number of vehicles on a narrow corridor. The buyer should reconcile dispatch, telematics, bills of lading, customer acceptance, invoices, claims and cash. This prevents test mileage, duplicate mileage or unpaid movements from entering the economic base.
The ledger also supports safety analysis. Events can be normalised by miles, operating hours, road class, weather, traffic, vehicle generation and software version. Changes in operating mix remain visible. A declining event rate can otherwise reflect easier routes rather than improved system performance.
4. Measure exposure before safety outcomes
Safety comparisons require a denominator that matches the risk. Vehicle miles travelled are essential and may be insufficient on their own. Exposure can vary by road type, speed, traffic, daylight, weather, construction, terminal interaction, cargo and vehicle configuration. An autonomous platform concentrated on limited-access highways should not be compared directly with a broad human-driver population without adjustment.
NHTSA's crash-reporting framework provides timely incident information for specified ADS and Level 2 systems. NHTSA also identifies limitations in the data, including reporting thresholds, incomplete exposure information, revisions and possible duplicate reports.[3][6] A transaction team should use the data as one evidence source, preserve those limitations and seek underlying records where available.
The buyer should create an exposure cube. Rows represent route, vehicle, release and period. Columns record miles, hours, weather, traffic, interventions, disengagements where relevant, roadside stops, near misses, crashes, injuries, property damage and claims. Definitions remain stable across the diligence period.
External benchmarks require matched scope. FMCSA crash statistics, carrier data, insurer portfolios and public databases can provide context, while each has different coverage and reporting rules. The investment case should present ranges and explain adjustments rather than claim a universal safety ratio.
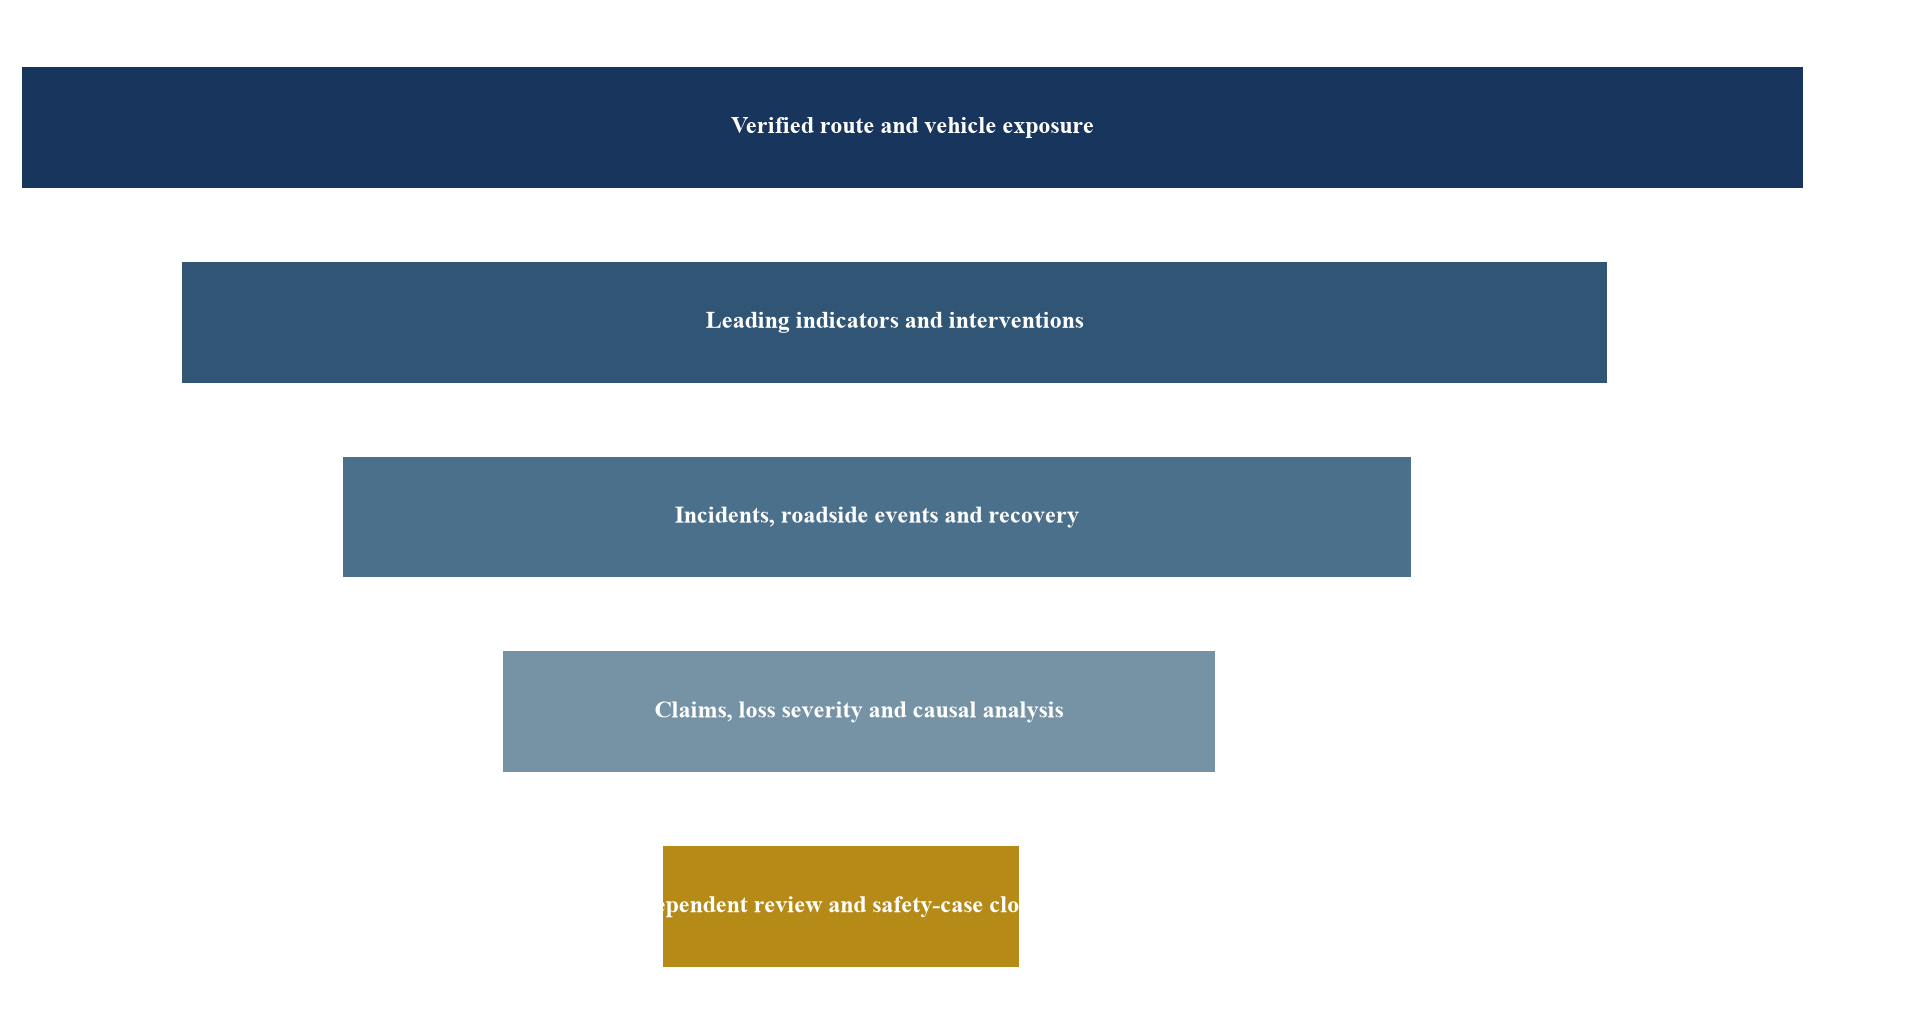
The proposed pyramid moves from verified operating exposure through leading indicators, incidents, claims and independent assurance to an approved safety case.
5. Construct the safety evidence case
A safety case is a structured argument supported by evidence that the system is acceptably safe for a stated use. It is broader than a test-mile total. The case should connect system requirements, hazards, controls, verification, validation, operations, maintenance, incident response and organisational accountability.
The transaction team should inspect the claim structure and evidence status. Top-level claims can cover the automated driving system, the vehicle platform, operations, cyber security and the relevant ODD. Subclaims should identify evidence, acceptance criteria, reviewer, exceptions and closure status. Aurora has publicly described a safety-case framework and a readiness measure used for its launch lane; transaction diligence still requires access to the underlying company-specific evidence and governance.[2][7]
Independence matters. Engineering teams can produce evidence, while material assumptions and closures should receive review proportionate to risk. The buyer should identify internal challenge, external assessors, regulators, insurers and customer reviewers. Disagreement, waivers and residual risk remain in the record.
Evidence ages. A new software release, hardware change, route, terminal, weather condition or supplier can affect claims. The safety case therefore needs configuration control and a change-impact process. The buyer should model the continuing cost of maintaining evidence, not treat safety approval as a one-time asset.
| Evidence level | Required record | Transaction question | Failure signal |
|---|---|---|---|
| Claim | defined safety proposition and scope | what is being asserted | ambiguous domain or outcome |
| Hazard analysis | scenarios causes and controls | what can go wrong | missing operational interactions |
| Verification | requirements tests and results | was the system built correctly | incomplete configuration trace |
| Validation | representative route evidence | is it suitable for intended use | laboratory-only coverage |
| Operations | dispatch maintenance and response | can safety persist in service | uncontrolled workarounds |
| Assurance | challenge closure and residual risk | who accepted the evidence | unresolved material exceptions |
The hierarchy separates broad assertions from controlled and decision-useful evidence.
6. Separate leading and lagging indicators
Crashes, injuries and insured losses are lagging indicators. They are economically important and statistically sparse during early deployment. Leading indicators can include safety-critical interventions, minimal-risk manoeuvres, perception uncertainty, hard braking, rule violations, degraded-mode entries, remote-assistance requests, maintenance defects and repeated scenario failures.
Leading indicators require discipline. A falling intervention rate can reflect software improvement, reduced observation, changed thresholds or easier conditions. The metric should state the trigger, exposure, version, route and review process. Events should be sampled against raw records and causal analysis.
The board dashboard should avoid one composite safety score unless the construction is transparent. A weighted readiness measure can help manage closure, while it can hide an unresolved high-severity claim. Critical claims and stop conditions should remain visible beside aggregate progress.
The buyer should also inspect operational learning. Incidents and near misses should generate containment, root-cause analysis, corrective action, validation and controlled release. Repeat events indicate that the feedback loop is weak even when overall rates appear favourable.
7. Test fallback, roadside and remote assistance
Driverless trucking must manage events that a driver ordinarily handles. FMCSA research on automated hazard-warning devices highlights a practical example: federal rules can require warning devices after a vehicle stops on or near the roadway, while a driverless vehicle may lack a person to deploy them.[4] The transaction case should price the complete response rather than assume the automated driving stack resolves every roadside obligation.
The buyer should catalogue fallback scenarios. Examples include sensor obstruction, tyre failure, trailer fault, communications loss, road closure, emergency-vehicle direction, cargo issue, terminal rejection and severe weather. Each scenario needs detection, decision authority, minimal-risk behaviour, assistance, recovery, evidence capture and return-to-service criteria.
Remote assistance should be distinguished from remote driving. The operating model should state what remote personnel can see, recommend or command, the latency and availability required, identity and access controls, staffing ratios, training, fatigue controls and jurisdictional restrictions. Service capacity should be stress-tested against correlated events.
Roadside response affects route economics and insurability. A dense network can support faster recovery and shared coverage. A remote lane may require dedicated capacity or longer interruption assumptions. Contracted response time, actual performance and customer service consequences should enter the lane model.
8. Connect evidence to insurance
Insurance translates uncertain events into coverage, limits, exclusions, retention, premium and claims handling. Autonomous trucking can redistribute risk among motor-carrier liability, commercial auto, physical damage, cargo, product liability, technology errors and omissions, cyber, general liability, workers' compensation and directors' liability. The relevant programme depends on the operating and contractual structure.
NAIC materials identify legal, liability and regulatory questions around autonomous vehicles and the continuing role of auto insurance during a mixed human and automated fleet transition.[8][9] Telematics can support usage-based underwriting through mileage, location, time and driving-behaviour data.[10] For an autonomous platform, the evidence package can extend to ODD compliance, software configuration, interventions, maintenance, remote operations and claims causation.
The safety premium is earned when evidence improves underwriting confidence or reduces expected loss and capital volatility. It may appear through broader coverage, lower retention, more stable renewal terms, capacity from additional insurers, lower premium per operating mile, improved contractual acceptance or less restrictive exclusions. A stated belief that automation is safer has no independent transaction value.
The buyer should preserve insurer feedback. Data requests, reservations, exclusions, binders, policy wording, loss-control recommendations and renewal changes reveal which risks have been accepted. Broker presentations alone do not prove coverage.
| Evidence set | Underwriting purpose | Diligence test | Economic output |
|---|---|---|---|
| ODD and route register | define covered operations | compare policy and dispatch scope | eligible insured miles |
| Exposure and event data | estimate frequency and severity | reconcile source systems | loss-cost range |
| Safety case | assess controls and residual risk | inspect claim closure | coverage confidence |
| Maintenance and updates | test continuing reliability | trace configuration and defects | retention and exclusion treatment |
| Remote and roadside operations | assess recovery exposure | test capacity and response | interruption and recovery cost |
| Claims files | validate causation and handling | reconcile notices reserves and payments | expected loss and tail |
| Cyber controls | assess connected-system risk | inspect identity update and response | cyber coverage and aggregation |
The pack connects operating evidence to underwriting, coverage and claims decisions.
9. Analyse policy wording and risk allocation
Premium is one line in the insurance decision. Coverage scope, exclusions, deductibles, self-insured retention, aggregate limits, defence costs, subrogation, notice obligations, territorial limits and claims cooperation can be more important. An inexpensive policy with material autonomous-operation exclusions may provide little economic protection.
Contracts can allocate responsibility among the technology provider, vehicle owner, fleet operator, shipper, broker, terminal, maintenance provider and emergency-response contractor. The buyer should reconcile indemnities and insurance requirements across those agreements. Gaps can arise where one party accepts liability that its policy excludes or where multiple policies dispute the same event.
Product changes require notice or approval under some arrangements. The company should have a controlled process for informing insurers about new routes, software, hardware, operating modes and incident trends. Failure to align change control with policy obligations can weaken coverage.
Claims administration is part of the asset. Rapid preservation of logs, vehicle state, communications, maintenance, cargo and scene evidence supports causation and defence. The buyer should inspect reserve history, open claims, coverage disputes, litigation, recovery and lessons incorporated into engineering or operations.
10. Measure route density
Route density is the concentration of qualified freight, vehicles, terminals and support resources across a connected network. It is not the number of lines on a map. A dense network should create repeatable paid miles, higher equipment utilisation, lower repositioning, shared terminal capacity, efficient maintenance and credible recovery options.
FHWA's Freight Analysis Framework combines commodity-flow and trade data to estimate freight movement by origin, destination, commodity and mode. Its highway assignment outputs estimate truck flows on network segments, while FHWA cautions that modelled national flows are not a substitute for local planning data.[11][12] A buyer can use these sources to screen corridors, then replace them with shipper, carrier, traffic and terminal evidence.
Density should be measured at several levels. Lane density covers loads and revenue by direction and period. Node density covers terminals, maintenance and response. Customer density measures concentration and cross-customer balancing. Network density measures how many approved routes and nodes can absorb disruption or reposition equipment.
The strongest route can still create a fragile business if one customer, one terminal or one weather window dominates activity. Density therefore needs diversification and resilience metrics beside utilisation.
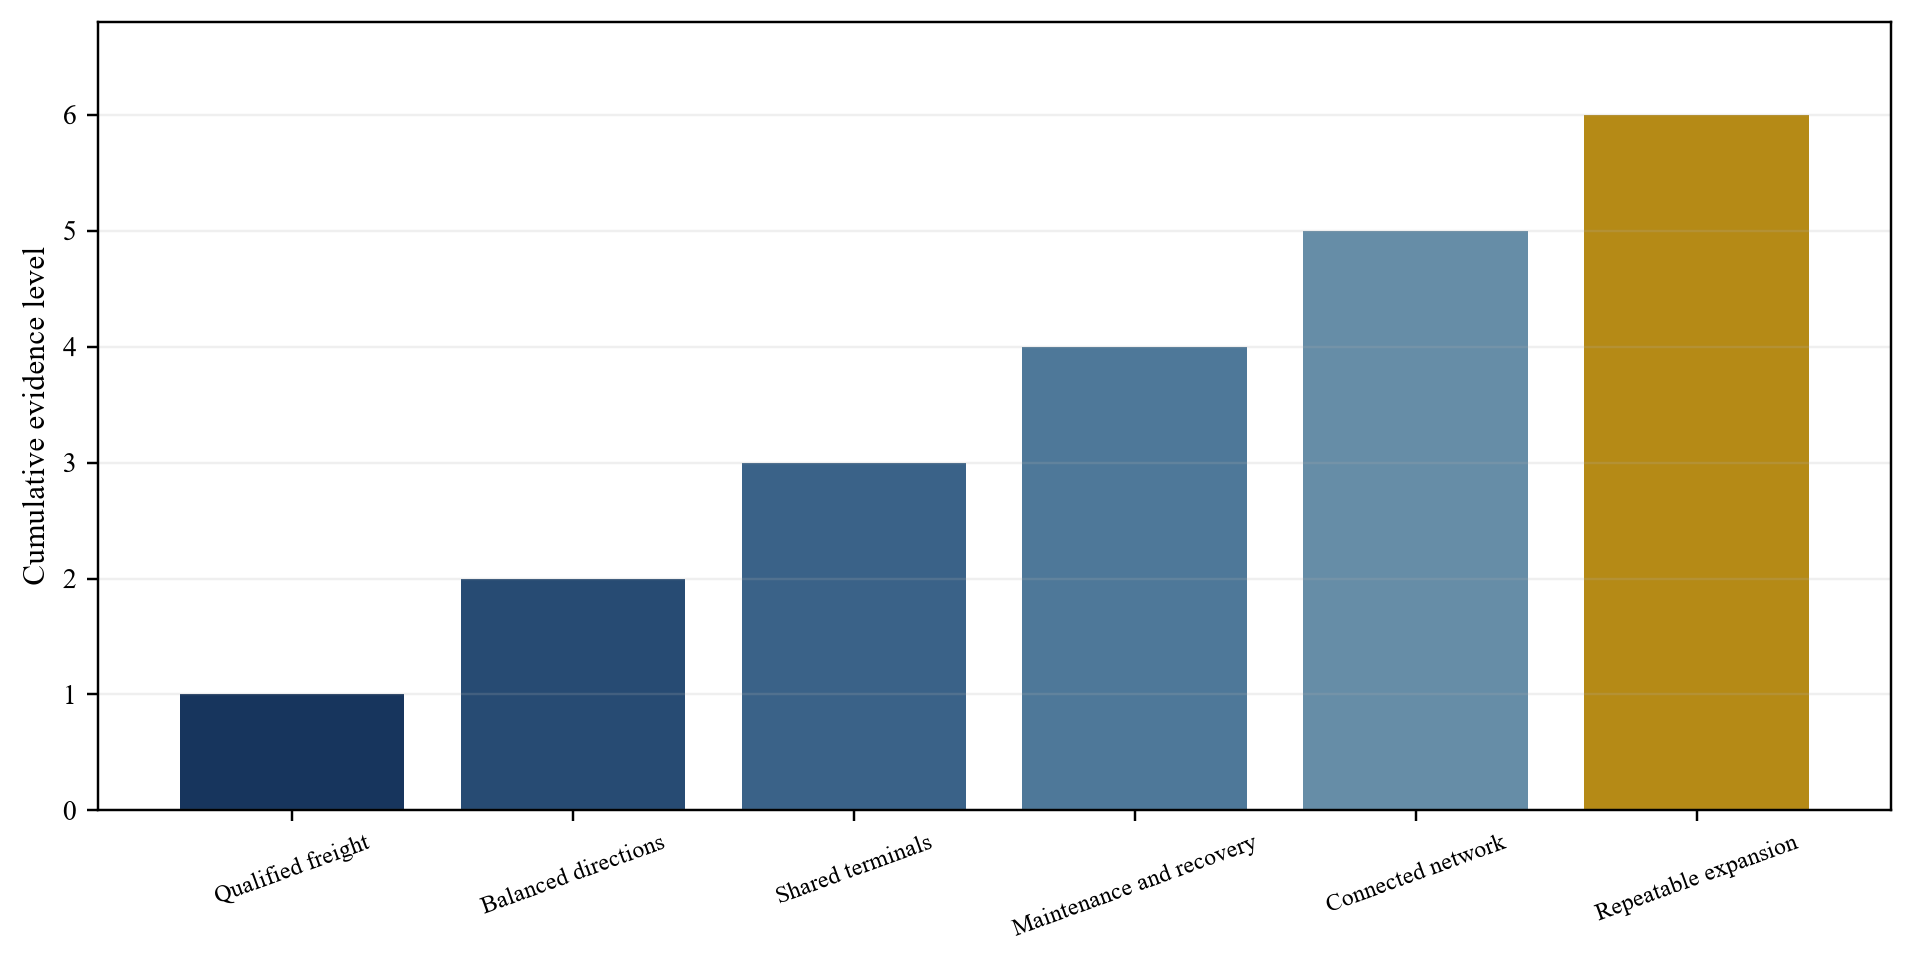
The proposed ladder connects qualified freight flows to balanced lanes, shared nodes, network resilience and repeatable route expansion.
| Dimension | Measure | Evidence source | Value question |
|---|---|---|---|
| Demand | qualified loads by direction and period | executed contracts and shipment data | are paid miles repeatable |
| Utilisation | paid miles divided by available miles | dispatch and telematics | is equipment productive |
| Balance | headhaul and backhaul contribution | lane-level revenue and cost | how much repositioning remains |
| Nodes | terminal maintenance and recovery coverage | site and vendor records | can the network support service |
| Resilience | approved alternatives and interruption time | route register and scenarios | can freight continue after disruption |
| Concentration | customer lane and terminal shares | parent-level commercial ledger | is density dependent on one counterparty |
| Expansion | incremental evidence and capital per lane | safety and deployment plans | can the network scale efficiently |
The metrics separate gross freight opportunity from economically usable autonomous capacity.
11. Convert density into unit economics
The lane contribution model should begin with paid miles and recognised revenue. It then deducts tractor and trailer costs, autonomous hardware amortisation, software, connectivity, fuel or energy, terminal, inspection, maintenance, tyres, remote assistance, roadside response, insurance, claims, customer operations and allocated route-development cost.
Empty and unavailable miles matter. A vehicle can operate safely and remain unproductive because freight is imbalanced, a terminal is constrained or weather closes the domain. Utilisation should distinguish calendar availability, dispatch availability, autonomous availability, loaded movement and paid movement.
Insurance can vary with evidence and exposure. The model should use actual premium, retention and claims assumptions for the lane, then stress them. A broad future safety discount should not compensate for current losses or coverage gaps. Similarly, maintenance savings should reflect autonomous hardware, sensor cleaning, calibration and redundant systems.
Cash timing needs separate analysis. Customers can pay after delivery while equipment, terminals, insurance and engineering are funded in advance. Growth can consume cash even when mature lane contribution is positive. The transaction model should include working capital and the capital required to validate each added lane.
The model should also reconcile accounting revenue with operating evidence. A subscription, freight charge, development payment or equipment sale can have different performance obligations and cash patterns. Deferred revenue can fund deployment while creating future service commitments. Capitalised hardware or development can reduce current expense without changing the cash consumed. Management should therefore present recognised revenue, invoiced revenue, collected cash and complete lane contribution together.
Vehicle availability should be decomposed into planned maintenance, unplanned maintenance, autonomous-system restriction, terminal delay, demand shortage and regulatory or weather suspension. These categories point to different remedies and capital needs. A single utilisation percentage can conceal a technical platform that is ready but commercially underloaded, or a strong freight book constrained by reliability. The acquisition model should value the verified bottleneck and fund the action needed to release it.
12. Underwrite terminal and transfer operations
Highway autonomy often depends on terminals or transfer hubs where trailers, loads or vehicles move between autonomous and human-driven operations. The transaction team should inspect land rights, permits, traffic access, yard safety, utilities, security, charging or fuelling, inspection, maintenance and operating hours.
Terminal throughput should reconcile to route schedules. A lane can support attractive driving economics while queues, trailer mismatch or manual hand-offs reduce service. The model should measure arrival variability, dwell, inspection, transfer time, rejection and recovery.
Terminal concentration creates exposure. Closure, landlord action, local restrictions, flooding, power interruption or neighbour complaints can stop multiple routes. Alternative nodes and temporary operating plans should be costed. Ownership is not always required, while control and continuity need contractual evidence.
Customer acceptance can depend on integration with transport-management systems, appointment processes, proof of delivery and exception handling. Terminal operations therefore connect the autonomous stack to recognised revenue and collected cash.
13. Map the regulatory operating perimeter
Autonomous trucking operates across vehicle-safety, motor-carrier, road, state, insurance, privacy and employment rules. The relevant perimeter depends on jurisdiction, operating model, automation level and whether a human driver is present. The diligence team should maintain a jurisdiction-by-route register rather than a generic regulatory summary.
At federal level in the United States, NHTSA addresses motor-vehicle safety and ADS crash reporting, while FMCSA regulates commercial motor-carrier operations. States can add vehicle, road-use, insurance, testing and operational requirements. Local authorities and terminal jurisdictions can affect access and emergency arrangements.
The buyer should distinguish permission from readiness. The absence of a prohibition does not establish that the company has completed carrier registration, operating procedures, reporting, law-enforcement engagement, roadside response, insurance and local coordination. Evidence should be route-specific.
Regulatory change belongs in the downside case. New reporting, inspection, equipment, remote-operation or human-attendance requirements can add cost or reduce the usable domain. The model should identify which assumptions depend on current interpretation and who monitors change.
14. Secure cyber and update controls
Autonomous trucks combine safety-critical software, sensors, vehicle networks, cloud services, maps, communications, terminals and remote tools. The buyer should map assets, identities, privileges, suppliers, data flows, software dependencies, update paths and incident responsibilities.
ISO/SAE 21434 addresses cyber security engineering for road vehicles, UNECE regulations address cyber security and software updates in relevant markets, and NIST frameworks provide broader governance for cyber and artificial-intelligence risk.[13][14][15][16] Applicable requirements depend on product and jurisdiction; the transaction should translate them into evidence for the actual system.
Update capability is central to both safety and valuation. Signed packages, staged deployment, compatibility testing, rollback and post-release monitoring determine whether the platform can correct faults without creating a fleet-wide event. The buyer should inspect release history, emergency changes, customer windows and vehicles that cannot receive current software.
Common technology can create scale and concentration. One control plane can reduce duplication while increasing the number of vehicles affected by a defect or attack. Segmentation, limited rollout, independent monitoring and recovery capacity are value-protection investments.
15. Test contract and customer quality
Commercial evidence should separate pilots, memoranda, framework agreements, minimum commitments, shipment orders and paid services. A customer announcement can show access and learning while providing little committed revenue. The buyer should trace each material relationship to volume, price, service level, liability, data rights, insurance, termination, assignment, change control, invoice and cash.
Service quality should be measured against the customer's freight requirement. On-time pickup and delivery, tender acceptance, cargo condition, exception response and invoice accuracy matter. Autonomous percentage or miles can be supporting metrics, while customers buy reliable movement.
Customer concentration may be necessary during launch and can distort density. One shipper can supply balanced loads and operational learning, yet renewal, repricing or strategy changes can affect the entire network. Ultimate-parent mapping and lane-level concentration should be visible.
Expansion rights require scrutiny. A contract may permit additional lanes but provide no committed volume. A technology partnership may depend on a specific vehicle manufacturer or carrier. The valuation should distinguish enforceable rights from relationship optionality.
16. Build a hypothetical route network
The illustrative network contains three approved freight lanes connecting four terminals. Lane North carries 52,000 annual loaded miles per vehicle with balanced contract demand. Lane Central carries 61,000 loaded miles with stronger headhaul demand and 18 percent empty repositioning. Lane South carries 44,000 loaded miles and has weather-related closure exposure.
The network has 36 commercial vehicles: 14 on North, 14 on Central and eight on South. All figures are management assumptions created for demonstration. The vehicles operate under one software release family, while route-specific maps, terminal procedures and recovery contracts differ.
Annual revenue is assumed at USD 18.4 million. Complete direct operating cost is USD 15.2 million, producing USD 3.2 million route contribution before central engineering and corporate cost. Insurance premium and expected retained loss total USD 1.1 million within direct cost. Route-development investment of USD 9 million is excluded from current contribution and evaluated as expansion capital.
The central commercial question is whether shared nodes and evidence reduce the marginal cost of opening the fourth lane. The model credits reuse only where safety claims, insurer acceptance, terminal capacity and customer demand have been verified.
| Measure | North lane | Central lane | South lane | Network |
|---|---|---|---|---|
| Commercial vehicles | 14 | 14 | 8 | 36 |
| Loaded miles per vehicle | 52,000 | 61,000 | 44,000 | 53,278 weighted |
| Empty-mile share | 9% | 18% | 14% | 13.6% weighted |
| Annual revenue | USD 6.7m | USD 8.2m | USD 3.5m | USD 18.4m |
| Complete direct cost | USD 5.4m | USD 6.8m | USD 3.0m | USD 15.2m |
| Route contribution | USD 1.3m | USD 1.4m | USD 0.5m | USD 3.2m |
| Primary constraint | terminal window | directional balance | weather domain | shared recovery capacity |
All figures are illustrative management assumptions and are not forecasts or representations of a named company.
17. Calculate the safety premium
The hypothetical base valuation starts with verified lane contribution and necessary central cost. It does not assume a safety premium. The transaction team then models evidence-linked effects: premium and retention stability, lower expected loss, higher customer renewal, reduced service interruption and faster approval of a related lane.
The central case assumes that improved exposure data and closed safety claims reduce annual insurance and retained-loss cost by USD 0.3 million after two renewals. It adds USD 0.4 million of customer contribution from improved renewal probability and USD 0.5 million from a fourth lane that reuses verified terminals and operational evidence. These amounts are illustrative and require company-specific replacement.
The annual gross benefit of USD 1.2 million is reduced by USD 0.35 million of continuing assurance, telemetry, independent review and response capacity. Mature net benefit is USD 0.85 million. A discounted value of USD 6 million is assigned after timing and probability, rather than capitalising the full gross benefit immediately.
The premium is therefore an evidence bridge, not a label. If loss data deteriorate, insurers restrict coverage, the ODD narrows or customer acceptance weakens, the value can be zero or negative.
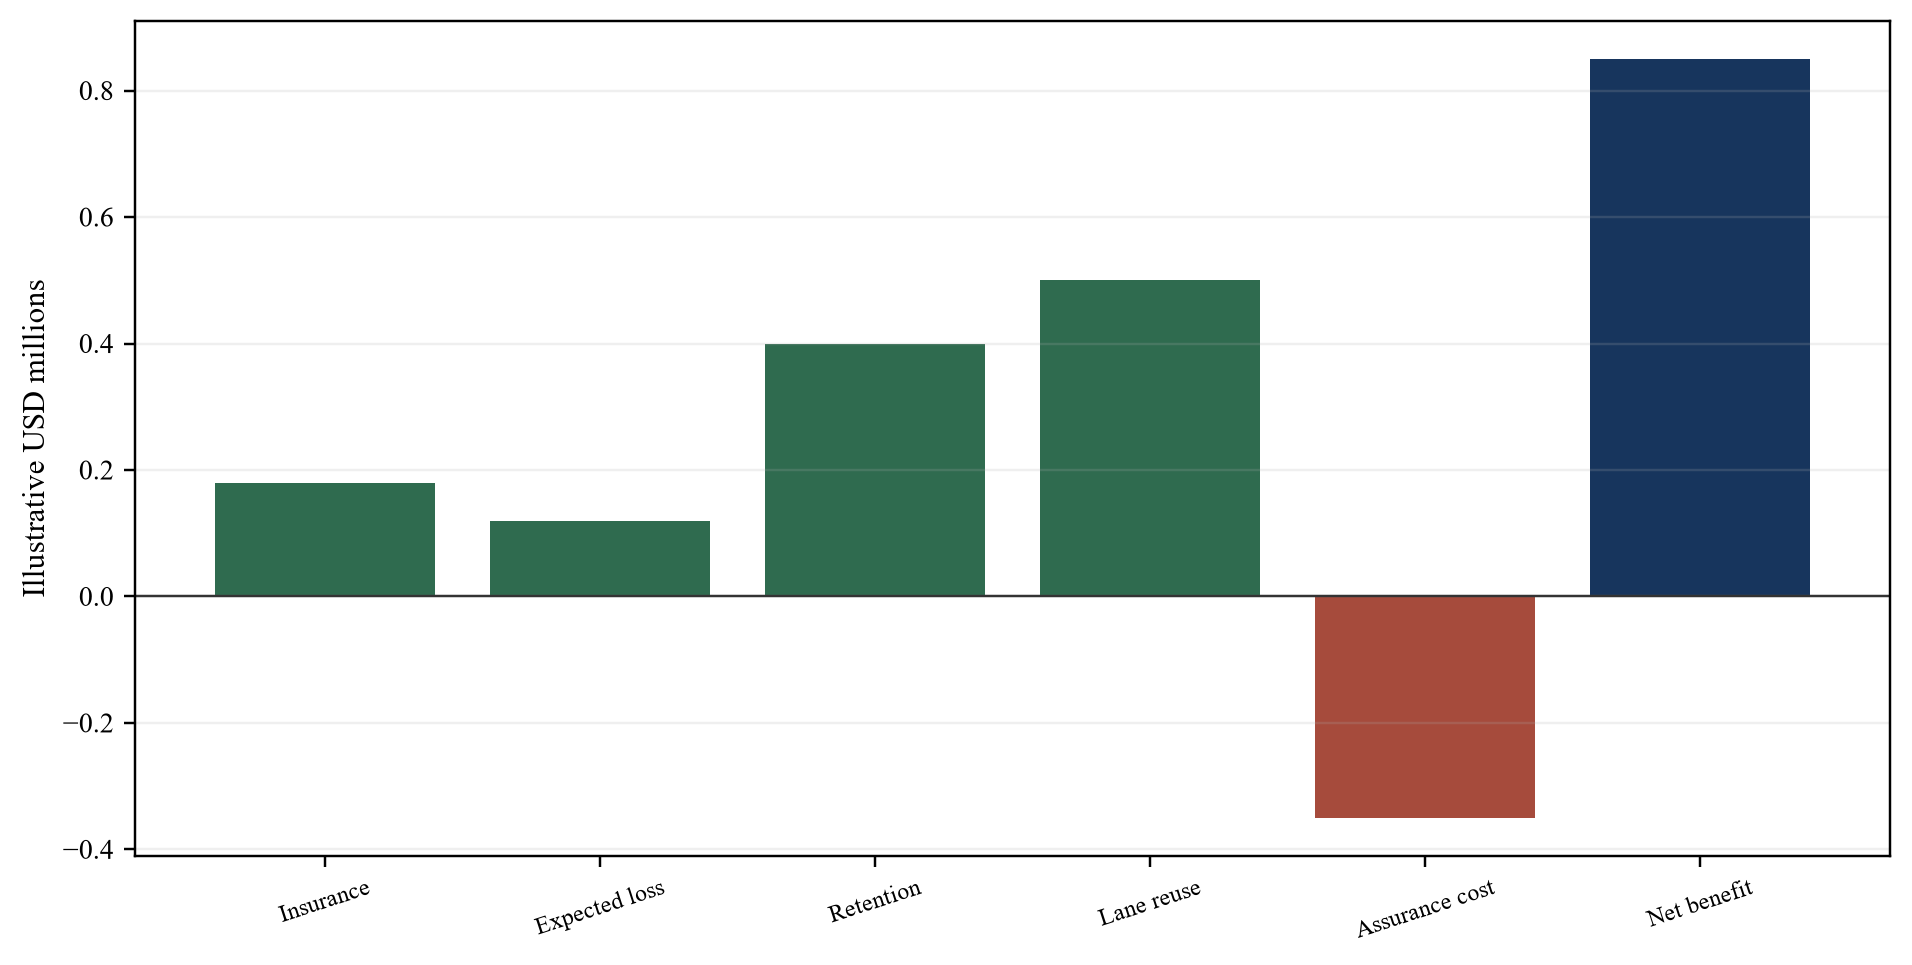
The illustrative bridge connects insurance, expected loss, customer retention and route expansion to continuing assurance cost and annual net benefit.
18. Stress route, safety and insurance assumptions
The downside case should attack the mechanism of value. A serious incident can pause a route, trigger investigation, change customer behaviour, increase claims and affect renewal. A software defect can create correlated exposure across the fleet. Severe weather or road works can narrow the ODD. Low backhaul demand can reduce paid utilisation.
The hypothetical insurance-tightening case increases premium and retained loss by USD 0.6 million and reduces coverage certainty. The route-disruption case removes 15 percent of paid miles for six months and adds recovery expense. The density case raises empty miles to 24 percent. The combined downside produces negative route contribution and requires USD 7 million of additional liquidity.
Timing matters. A route that reopens after engineering validation can still miss a shipping season or renewal. The model should show incident date, containment, evidence review, insurer decision, regulatory engagement, customer acceptance, return to service and cash recovery.
Stop conditions should be explicit. The board can suspend deployment after a defined severity event, repeated control failure, material evidence gap, insurer withdrawal or liquidity threshold. These conditions protect the safety case and prevent commercial pressure from silently widening the domain.
| Scenario | Annual route contribution | Additional liquidity | Insurance effect | Decision response |
|---|---|---|---|---|
| Central | USD 3.2m | planned capital only | stable programme | continue gated expansion |
| Insurance tightening | USD 2.6m | USD 1m | premium and retention increase | reprice and improve evidence |
| Route disruption | USD 1.7m | USD 3m | claim and interruption review | suspend affected lane |
| Density deterioration | USD 1.1m | USD 2m | exposure per paid mile worsens | rebalance customers and routes |
| Combined downside | negative USD 0.8m | USD 7m | coverage restriction assumed | reprice, restructure or decline |
The cases are illustrative management assumptions and require company-specific replacement.
19. Value the platform in layers
Valuation should separate verified operations, evidence-supported expansion and strategic options. Verified operations include approved lanes, insured activity, contracted freight, complete costs and necessary sustaining investment. Expansion value includes identified lanes that have funded evidence and commercial plans. Strategic options remain outside the base case.
Comparable-company analysis needs operating normalisation. Autonomous miles can be supervised or driverless, commercial or test, loaded or empty. Revenue can arise from logistics service, subscriptions, hardware, development or partnerships. Cash use can include research, vehicle ownership, terminals and working capital. The denominator should be explained before a multiple is applied.
The hypothetical case assigns USD 42 million to verified operations based on risk-adjusted cash flow. It adds USD 6 million for the safety premium, USD 9 million for probability-weighted adjacent lanes and USD 4 million for terminal and operating assets. It deducts USD 8 million for concentration, technology remediation, claims tail and transition risk, producing an illustrative enterprise value of USD 53 million before net debt and other claims.
Buyer-specific benefits remain separate. A carrier may contribute freight, terminals, maintenance and purchasing. An OEM may contribute vehicle integration. An insurer may improve data and capacity. These benefits require incremental cash evidence and should not automatically be paid to the seller.
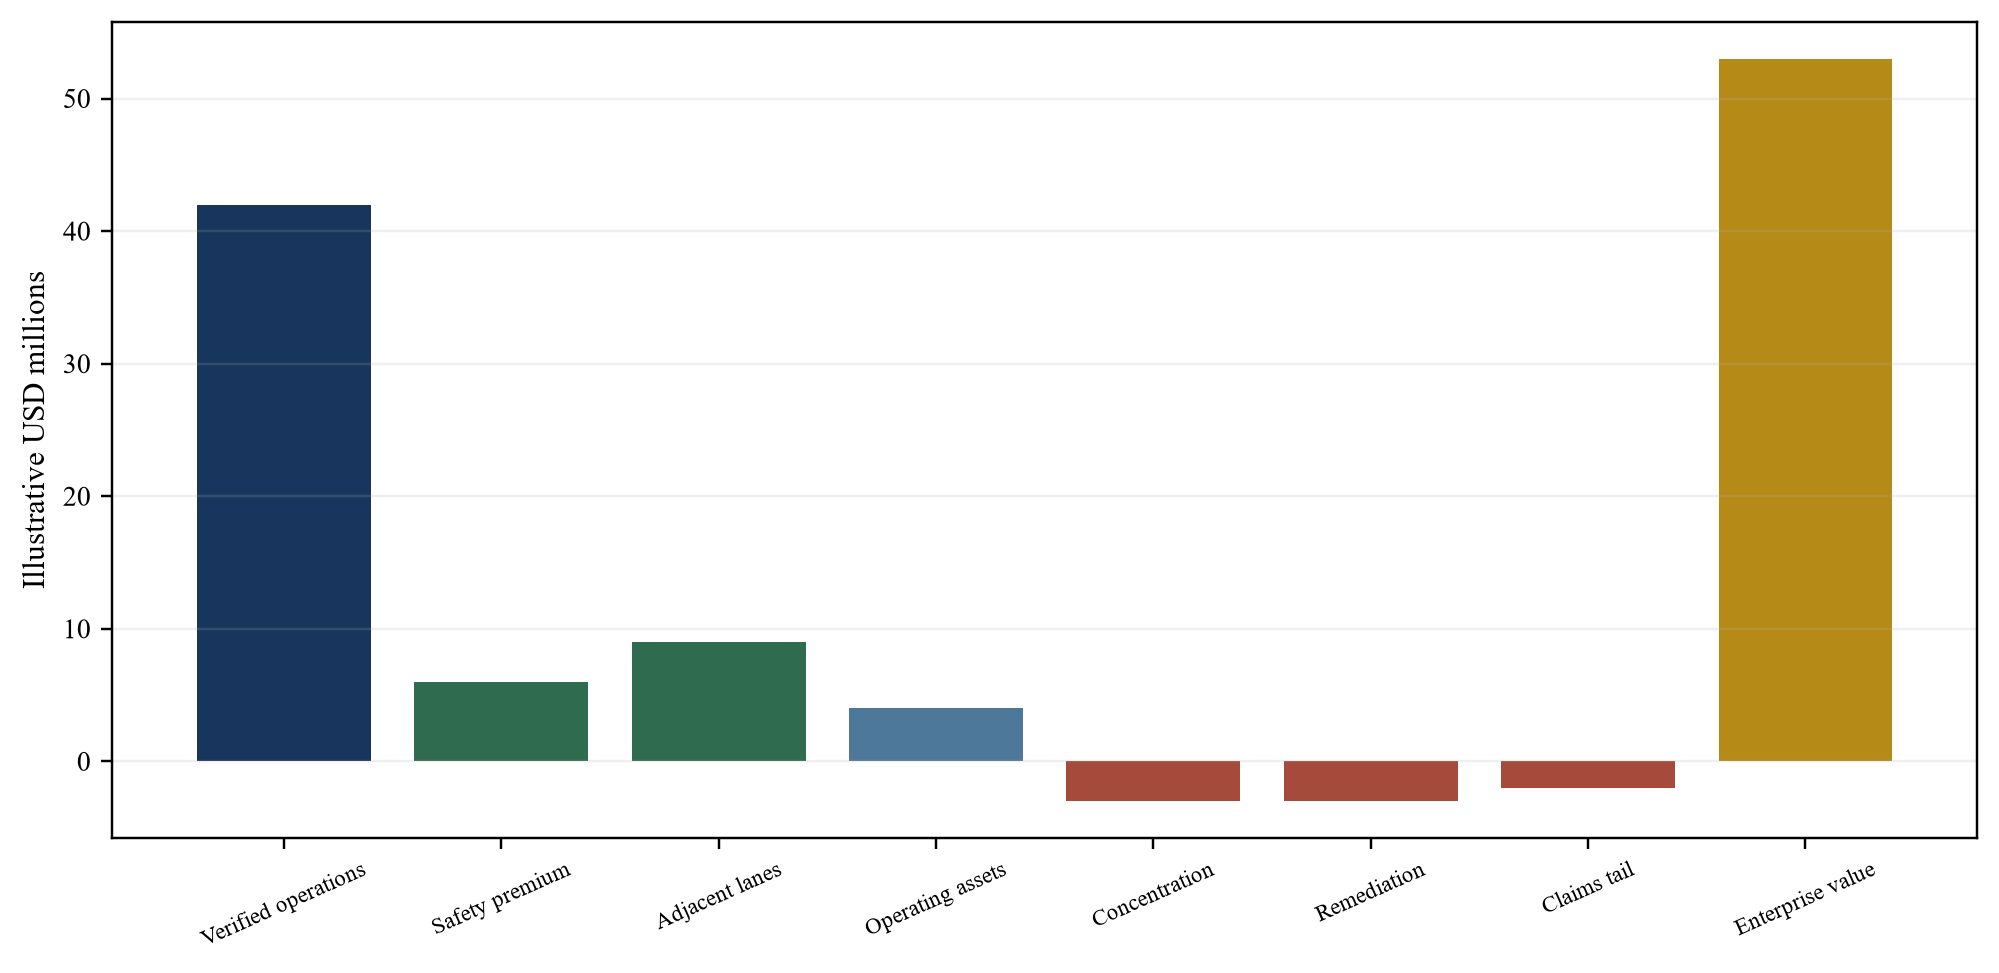
The illustrative bridge separates verified operations, evidence-supported safety and route value, operating assets and remaining transaction risks.
20. Structure the transaction around evidence
Transaction structure can allocate uncertainty that diligence cannot close. Consideration may include cash at closing, rollover equity, escrow, holdback and contingent payments. Milestones should be objectively measurable and connected to outcomes the seller can influence.
Relevant milestones can include delivery of complete safety-case materials, insurer binding on agreed terms, customer contract transfer, specified route availability, closure of material regulatory issues, retention of critical engineering and operations teams, and achievement of paid-mile or contribution thresholds without widening the approved domain.
Representations and warranties should match the operating architecture. Topics can include software and data rights, vehicle and hardware title, safety evidence, incident and claims reporting, regulatory compliance, customer contracts, insurance notices, cyber security, supplier commitments, employment inventions and open-source software. Qualified advisers define the appropriate scope.
Financing should recognise evidence risk. A lender may use borrowing-base or covenant controls linked to insured vehicles, active contracts, unrestricted cash and route contribution. Equity reserves can fund validation and downside liquidity. Purchase price and operating capital should be approved together.
21. Execute a 180-day validation programme
Days 1 to 30 stabilise control. The buyer confirms route, vehicle, customer, insurer and incident registers; freezes unauthorised changes; secures critical access; tests claims notice; and establishes board reporting. Material ODD expansion pauses until the governance model is working.
Days 31 to 60 reconcile evidence. Teams link miles, routes, software, maintenance, events, claims, policies, contracts, invoices and cash. They sample raw records, document limitations and establish matched exposure cohorts. Open safety and insurance items receive owners and deadlines.
Days 61 to 90 validate operations. The buyer runs controlled route, fallback, remote-assistance, recovery, terminal and cyber exercises. Insurers and customers receive agreed evidence. Economic baselines are locked by lane and vehicle cohort.
Days 91 to 180 execute approved improvements. Dispatch, maintenance, response and telemetry changes proceed through change control. The board approves adjacent-lane work only when safety, insurance, customer, terminal and capital gates pass.
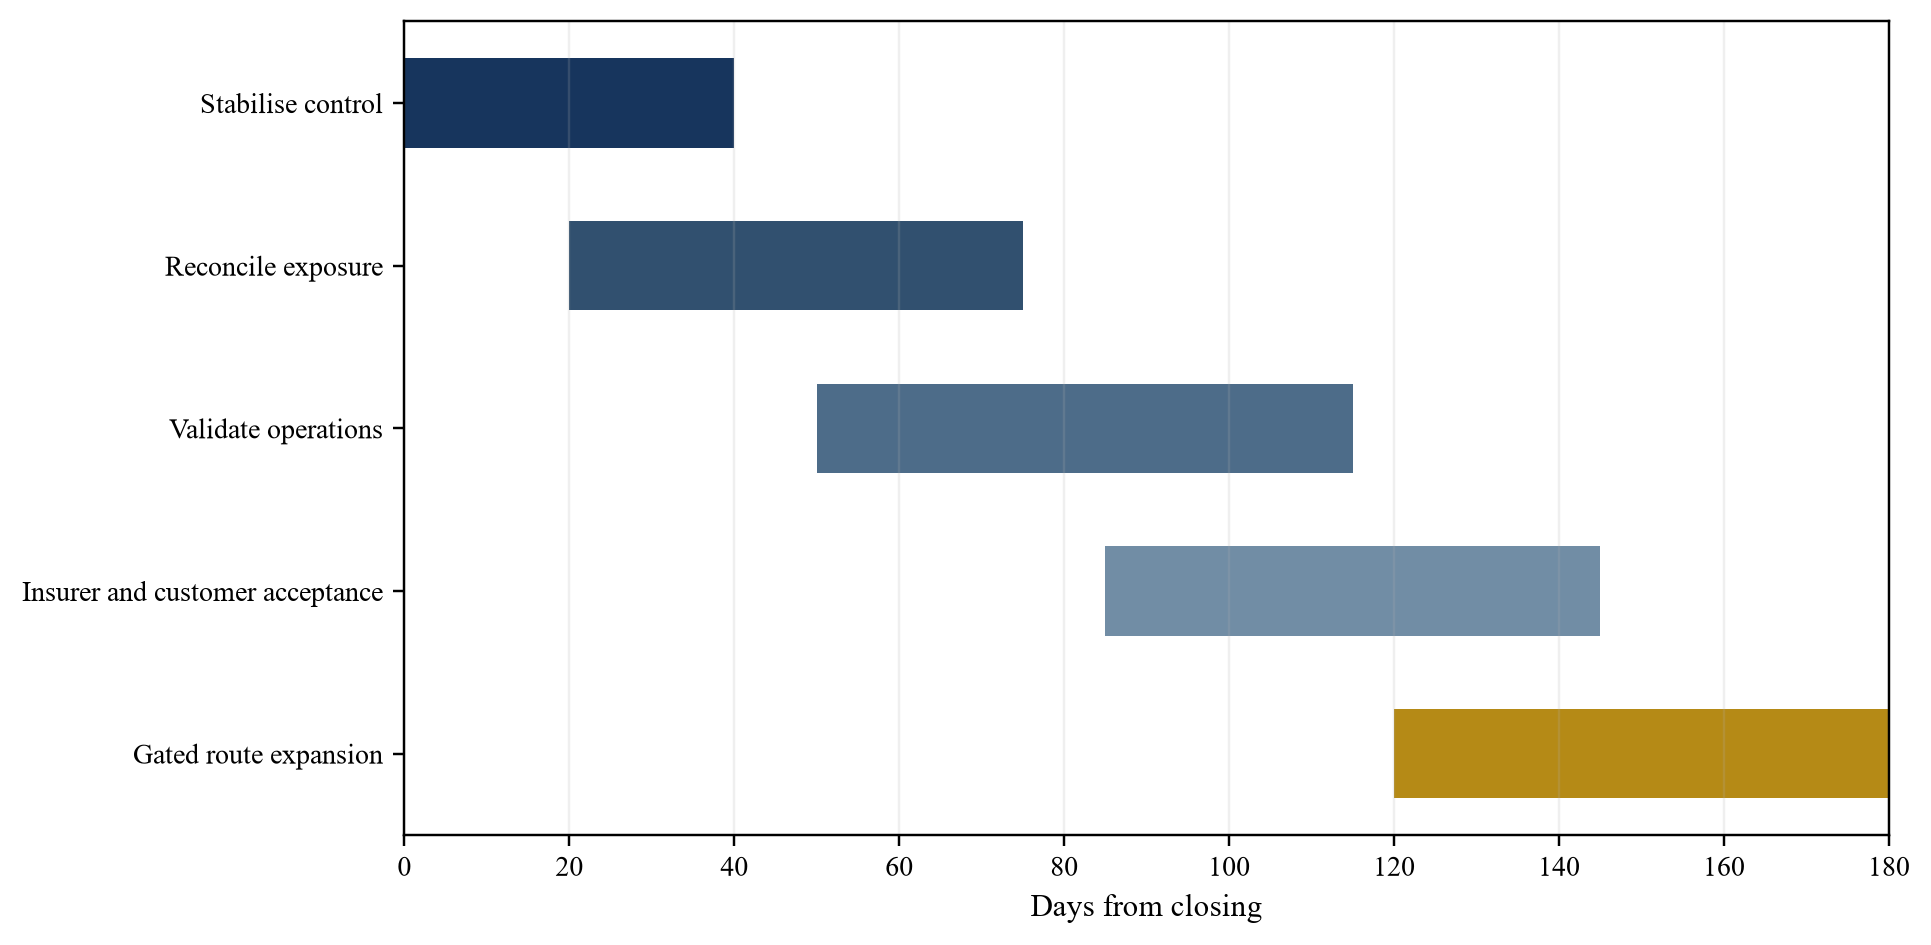
The programme sequences control stabilisation, evidence reconciliation, operational validation, insurer and customer acceptance, and gated route expansion.
| Workstream | Day 30 evidence | Day 90 gate | Day 180 outcome |
|---|---|---|---|
| ODD and routes | controlled route register | representative operating validation | approved domain and change process |
| Safety | claims exceptions and owners | evidence review and exercises | monitored closed safety case |
| Insurance | policy and claims reconciliation | agreed data and renewal plan | bound programme with known economics |
| Customers | contract and volume map | service and transfer acceptance | retained paid freight |
| Fleet | vehicle configuration ledger | maintenance and update validation | controlled commercial availability |
| Operations | fallback and response baseline | tested capacity and recovery | measurable service resilience |
| Finance | complete lane cost and liquidity | downside and covenant approval | collected cash and funded expansion |
The dashboard links diligence and integration workstreams to measurable decision evidence.
22. Make the investment decision explicit
The board should receive a decision pack that connects technology to commercial evidence. It should contain the ODD register, route and vehicle ledgers, safety-case status, exposure analysis, incidents and claims, policy wording, customer contracts, complete lane economics, terminal capacity, regulatory perimeter, cyber controls, liquidity and downside cases.
Approval conditions should be measurable. Examples include reconciliation of commercial miles, closure of specified safety claims, insurer acceptance, customer assignment, evidence rights, critical-team retention, recovery coverage and funded transition capital. Open items remain in a closing or post-closing register.
The decision should state which value layers are being paid for. Verified operations can support base consideration. Evidence-supported expansion can support contingent or staged value. Strategic options should remain with the buyer until the corresponding gates pass.
The decline or reprice case should also be explicit. Uncontrolled ODD expansion, weak exposure data, unresolved material incidents, inadequate coverage, fragile route concentration, negative complete economics, untransferable contracts or an unfunded downside can change structure or stop the transaction.
Conclusion
Autonomous-trucking value is created at the intersection of a defined operating domain, safety evidence, insurance acceptance and dense commercial routes. Each element is necessary. Technical capability outside an approved domain does not produce reliable revenue. Safety evidence without exposure context can mislead. Insurance without aligned policy wording can leave material gaps. Route demand without operating support can consume cash.
The ODD register defines where the system is intended to operate and how boundaries are enforced. It converts a broad capability claim into route, weather, vehicle, terminal and communications conditions that dispatch and engineering can control.
The route and vehicle ledgers establish what is operating, for whom, under which configuration and at what cost. They allow safety events, maintenance, claims, service and cash to reconcile to the same unit of analysis.
Exposure-adjusted evidence is the basis for a defensible safety case. Vehicle miles, hours, routes, traffic, weather, releases and interventions remain visible. Crash-reporting data and external benchmarks add context while retaining their limitations.
Insurance provides an external economic test. Underwriters ask how the domain is defined, how events are measured, how software changes, how vehicles are maintained, how roadside events are managed and how claims evidence is preserved. Better evidence can improve capacity, terms and predictability; every effect requires documentary proof.
Route density translates capability into commercial scale. Balanced freight, productive vehicles, shared terminals, maintenance, recovery and customer diversification determine whether each mile contributes cash. A larger route map can add complexity without creating density.
Valuation should therefore use layers. Verified operations support the base. Evidence-supported safety and route expansion receive probability, timing and continuing-cost adjustments. Unapproved lanes, unsigned freight and assumed insurance benefits remain options.
Transaction terms can align payment with safety-case delivery, insured operations, customer acceptance, route contribution and retained capability. The 180-day programme then stabilises controls, reconciles exposure, validates operations and releases expansion capital against evidence.
The safety premium is a measurable commercial outcome. It appears when the platform sustains safe operations within its domain, provides insurers and customers with decision-quality evidence, recovers reliably from exceptions and converts a dense route network into accepted service and collected cash.
Sources
- United States Securities and Exchange Commission, Aurora Innovation Annual Report 2025, Read the primary source
- United States Securities and Exchange Commission, Aurora Innovation First Quarter 2025 Shareholder Letter, Read the primary source
- National Highway Traffic Safety Administration, Standing General Order on Crash Reporting, Read the primary source
- Federal Motor Carrier Safety Administration, Hazard Warning Devices for Automated Commercial Motor Vehicles, Read the primary source
- Federal Motor Carrier Safety Administration, Automated Vehicle System Performance and Risk Assessment, Read the primary source
- National Highway Traffic Safety Administration, Third Amendment to Standing General Order 2021-01, Read the primary source
- Aurora Innovation, Safety Case Framework, Read the primary source
- National Association of Insurance Commissioners, Autonomous Vehicles, Read the primary source
- National Association of Insurance Commissioners, Insuring Autonomy, Read the primary source
- National Association of Insurance Commissioners, Telematics, Read the primary source
- Federal Highway Administration, Freight Analysis Framework, Read the primary source
- Federal Highway Administration, Freight Mobility Trends and Highway Bottlenecks, Read the primary source
- International Organization for Standardization, ISO SAE 21434 Road Vehicles Cybersecurity Engineering, Read the primary source
- United Nations Economic Commission for Europe, UN Regulation No. 155 Cyber Security, Read the primary source
- National Institute of Standards and Technology, Cybersecurity Framework 2.0, Read the primary source
- National Institute of Standards and Technology, Artificial Intelligence Risk Management Framework, Read the primary source
- Federal Motor Carrier Safety Administration, Automated Commercial Motor Vehicle Evaluation Program, Read the primary source
- Federal Motor Carrier Safety Administration, Human Factors in ADS Equipped Commercial Motor Vehicles, Read the primary source
- Federal Motor Carrier Safety Administration, Active Research Projects, Read the primary source
- National Highway Traffic Safety Administration, Automated Vehicles for Safety, Read the primary source
- National Highway Traffic Safety Administration, AV TEST Initiative, Read the primary source
- United States Department of Transportation, Automated Vehicles Comprehensive Plan, Read the primary source
- United States Department of Transportation, Highly Automated Systems Safety Center of Excellence, Read the primary source
- Bureau of Transportation Statistics, Freight Facts and Figures, Read the primary source
- Bureau of Transportation Statistics, Freight Analysis Framework, Read the primary source
- Federal Highway Administration, Freight Performance Measurement, Read the primary source
- Federal Highway Administration, Truck Parking Development Handbook, Read the primary source
- National Transportation Safety Board, Highway Investigations, Read the primary source
- National Transportation Safety Board, Most Wanted List of Transportation Safety Improvements, Read the primary source
- Insurance Institute for Highway Safety, Advanced Driver Assistance, Read the primary source
- Highway Loss Data Institute, Research and Data, Read the primary source
- Society of Automotive Engineers, J3016 Driving Automation Taxonomy, Read the primary source
- Underwriters Laboratories, UL 4600 Standard for Autonomous Products, Read the primary source
- International Organization for Standardization, ISO 26262 Road Vehicles Functional Safety, Read the primary source
- International Organization for Standardization, ISO 21448 Safety of the Intended Functionality, Read the primary source
- International Organization for Standardization, ISO 39001 Road Traffic Safety Management, Read the primary source
- National Institute of Standards and Technology, Secure Software Development Framework, Read the primary source
- Cybersecurity and Infrastructure Security Agency, Secure by Design, Read the primary source
- Cybersecurity and Infrastructure Security Agency, Known Exploited Vulnerabilities Catalog, Read the primary source
- IFRS Foundation, IFRS 3 Business Combinations, Read the primary source
- IFRS Foundation, IFRS 13 Fair Value Measurement, Read the primary source
- IFRS Foundation, IAS 36 Impairment of Assets, Read the primary source
- IFRS Foundation, IAS 38 Intangible Assets, Read the primary source
- IFRS Foundation, IFRS 15 Revenue from Contracts with Customers, Read the primary source
- International Valuation Standards Council, International Valuation Standards, Read the primary source
- United States Department of Justice and Federal Trade Commission, Merger Guidelines, Read the primary source
- European Commission, Merger Control, Read the primary source
- United Kingdom Competition and Markets Authority, Merger Assessment Guidelines, Read the primary source
- United States Federal Trade Commission, Premerger Notification Program, Read the primary source
- United States Securities and Exchange Commission, Cybersecurity Risk Disclosure Rules, Read the primary source
