

1. Define the roll-up investment thesis
A warehouse-robot roll-up should begin with a specific operating thesis. The buyer may seek a broader installed base, access to new customers, a complementary robot type, an orchestration layer, recurring service revenue, field-service density or engineering capability. Each thesis produces a different integration plan and evidence requirement. A presentation that combines unit counts and revenue does not show whether customers or economics can be integrated.
The board should define the customer problem the combined platform will solve. A customer may want one accountable service desk, mixed-fleet orchestration, faster site deployment, wider geographic coverage, lower spare-parts exposure or a migration path away from an ageing system. The transaction thesis becomes credible when those needs connect to executable products, service levels, prices and cash.
The counterfactual matters. A buyer can build an interface layer, form a commercial alliance, license software, hire service teams or acquire selected assets. Full acquisition can be rational when control over product roadmaps, customer contracts, safety evidence, software rights and operating teams is necessary. A partnership can preserve optionality where technology compatibility or customer consent is uncertain.
The decision memorandum should identify excluded value. Unsigned cross-selling, untested fleet integration, buyer-owned distribution, future autonomous capability and unsupported cost reduction remain outside the base case. They can enter an execution case when owners, capital, timing and measurable milestones are defined.
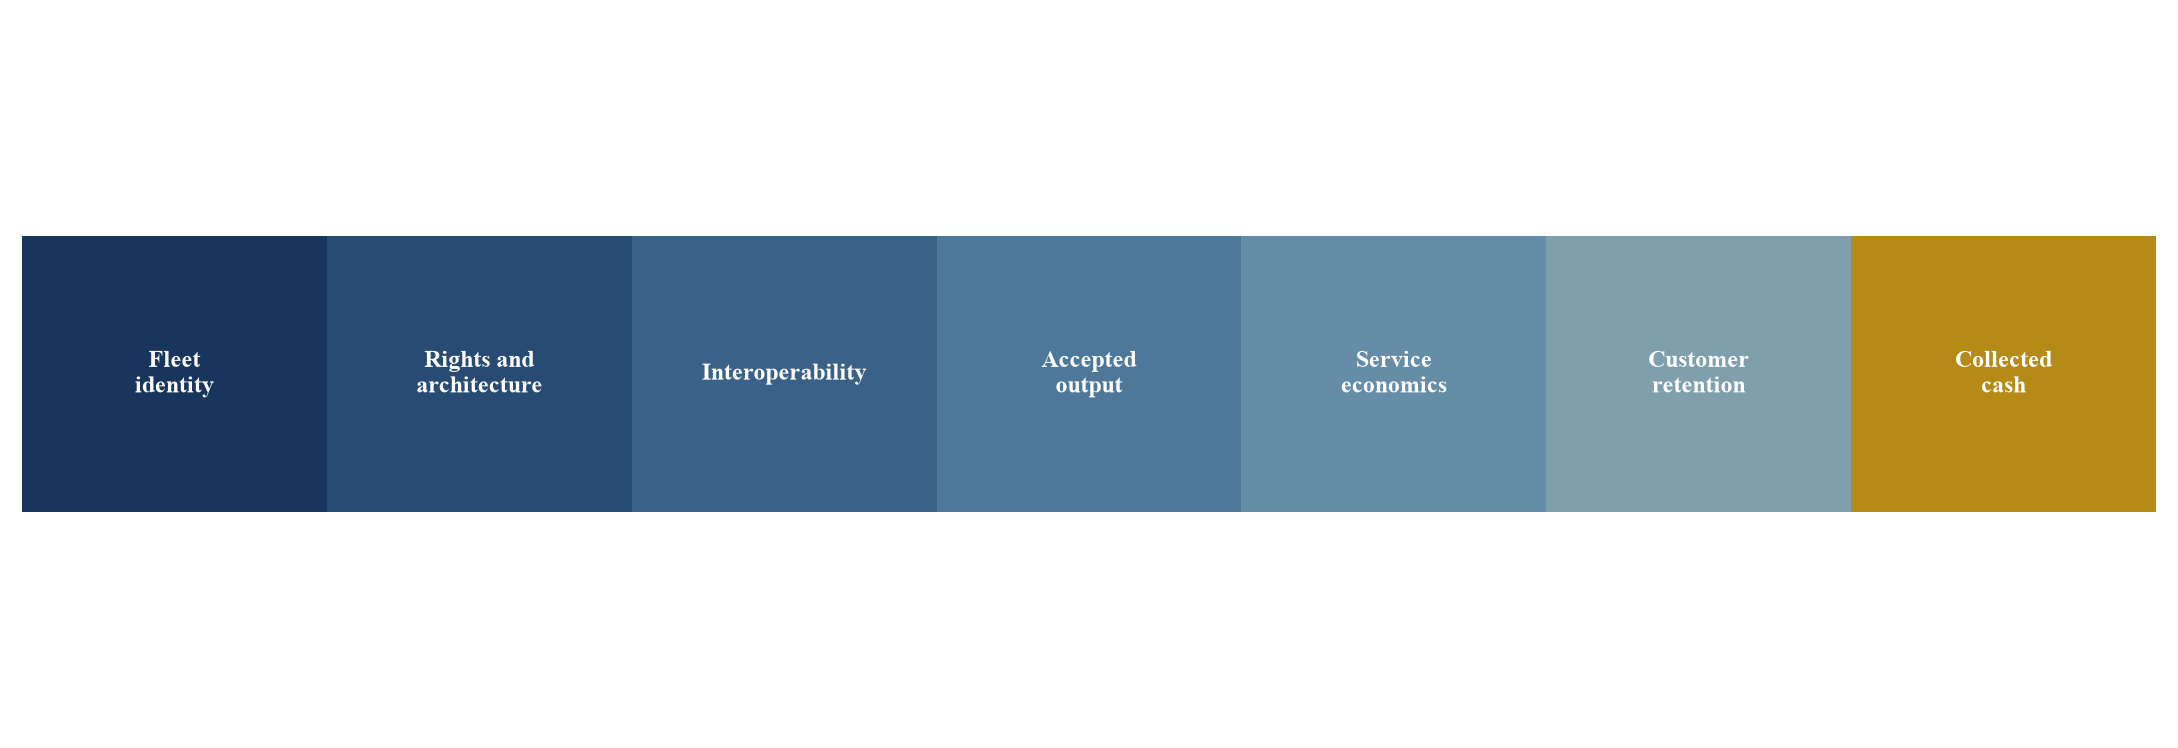
The proposed chain connects acquired fleet identity, interoperability, accepted warehouse output, service economics, customer retention and collected cash.
2. Separate aggregation from integration
Aggregation combines entities, customers, robots, people and reported financial results. Integration changes the way the combined business designs, sells, deploys, operates and supports those assets. The distinction prevents a buyer from treating a larger perimeter as an improved platform.
Fleet aggregation can create purchasing scale or a wider installed base while retaining separate product lines, software stacks and service teams. This structure may protect continuity and can leave duplicated engineering, support and inventory. Full product convergence may create stronger reuse and also introduce migration, safety, cyber and customer risk. The appropriate degree of integration varies by layer.
The buyer can use a layered target operating model. Commercial coverage, finance, procurement and selected field-service processes may combine early. Safety-critical controls, real-time orchestration and customer production interfaces may remain ring-fenced until verified. Product roadmaps can converge through new deployments while legacy fleets receive controlled support.
Integration value is measured against the approved counterfactual. If two businesses remain operationally separate, only evidenced corporate and procurement benefits belong in the model. If a shared service operation reduces response time, spare holdings and engineer travel without reducing availability, the measured saving can support value. The same discipline applies to engineering reuse, cross-selling and working capital.
3. Build an installed-base ledger
The installed-base ledger is the foundation of diligence. Each robot, controller, charger, workstation, safety device, software instance and site interface should have a unique identity. Required fields include hardware model, serial number, software version, customer, site, task, deployment date, ownership, service entitlement, warranty, operating status and last verified telemetry.
Reported unit counts often mix prototypes, demonstration units, spares, inactive equipment, customer-owned units and robots operating under service arrangements. A buyer should reconcile the commercial fleet to manufacturing, shipment, acceptance, invoice, service and telemetry records. Units without a current status remain an exception rather than assumed operating capacity.
Site context belongs in the ledger. The same robot can perform differently because of aisle width, flooring, traffic, wireless coverage, shift pattern, payload, worker interaction and warehouse-management rules. A fleet average that ignores these conditions can overstate transferability and hide support-intensive sites.
The ledger also supports purchase accounting, insurance, cyber response and working-capital decisions. Ownership and useful life affect asset treatment. Service entitlement affects recurring revenue. Component revision affects spares. Software version and connectivity affect vulnerability and upgrade planning.
| Dimension | Required record | Economic question | Diligence test |
|---|---|---|---|
| Unit identity | serial number and configuration | what fleet actually exists | reconcile build shipment and telemetry |
| Commercial status | ownership lease service or pilot | which units create revenue | trace contract invoice and cash |
| Site and task | environment workflow and acceptance | can performance transfer | compare matched operating cohorts |
| Software | version rights and support state | can the platform be maintained | test inventory and release records |
| Service | entitlement response and parts | what complete support costs | reconcile tickets labour and inventory |
| Safety | assessment events and controls | what deployment constraints remain | inspect site files and event registers |
| Customer rights | consent data and transfer terms | can integration proceed | review executed agreements |
The ledger preserves unit, site, contract and operating evidence needed for transaction and integration decisions.
4. Map the product and control architecture
Warehouse automation spans robots, traffic control, fleet management, warehouse control, warehouse execution, warehouse management, enterprise systems and customer equipment. A transaction map should show which layer makes each decision, which interface carries the instruction and which party owns the resulting data.
Interoperability can mean several things. Robots may share a map, receive tasks from one orchestrator, exchange state through an interface or remain separate while a higher layer allocates zones and workflows. A common dashboard without coordinated motion or exception handling provides visibility and does not constitute operational integration.
The architecture map should include real-time dependencies, failure modes and fallbacks. Warehouse operations can be sensitive to latency, wireless coverage, clock synchronisation and interface availability. The buyer should understand whether a central service interruption stops work, degrades optimisation or leaves local operations functioning.
Rights follow the architecture. Source code, configuration tools, application interfaces, third-party libraries, maps, customer data and trained models can have different ownership and licence terms. A roll-up cannot assume that technology used in one customer deployment is transferable to another product or site.
5. Define interoperability gates
Interoperability should be tested through operational gates rather than a broad compatibility claim. Gate one establishes identity, time, map and task semantics. Gate two validates interface behaviour and error handling. Gate three tests mixed operations in a representative environment. Gate four confirms customer acceptance, safety controls and support ownership.
The interface contract needs versioning, authentication, authorisation, message integrity, latency limits, retry behaviour and rollback. A laboratory connection can fail in production when task volume, wireless conditions, human traffic or exception rates change. Testing should include degraded modes and recovery.
Robot safety remains application-specific. ISO 10218, ISO 3691-4, ISO 12100 and related control standards provide relevant frameworks for industrial robots and driverless industrial trucks. The integrator and operator still need current assessments for the actual application, environment and jurisdiction.[4][5][6][7]
The acquisition plan should price adapters and migration. A reusable connector can reduce future integration time. A custom bridge that requires continuous engineering may create hidden service cost. The buyer should record development effort, validation scope, ownership, maintainability and customer-specific variation for every interface.
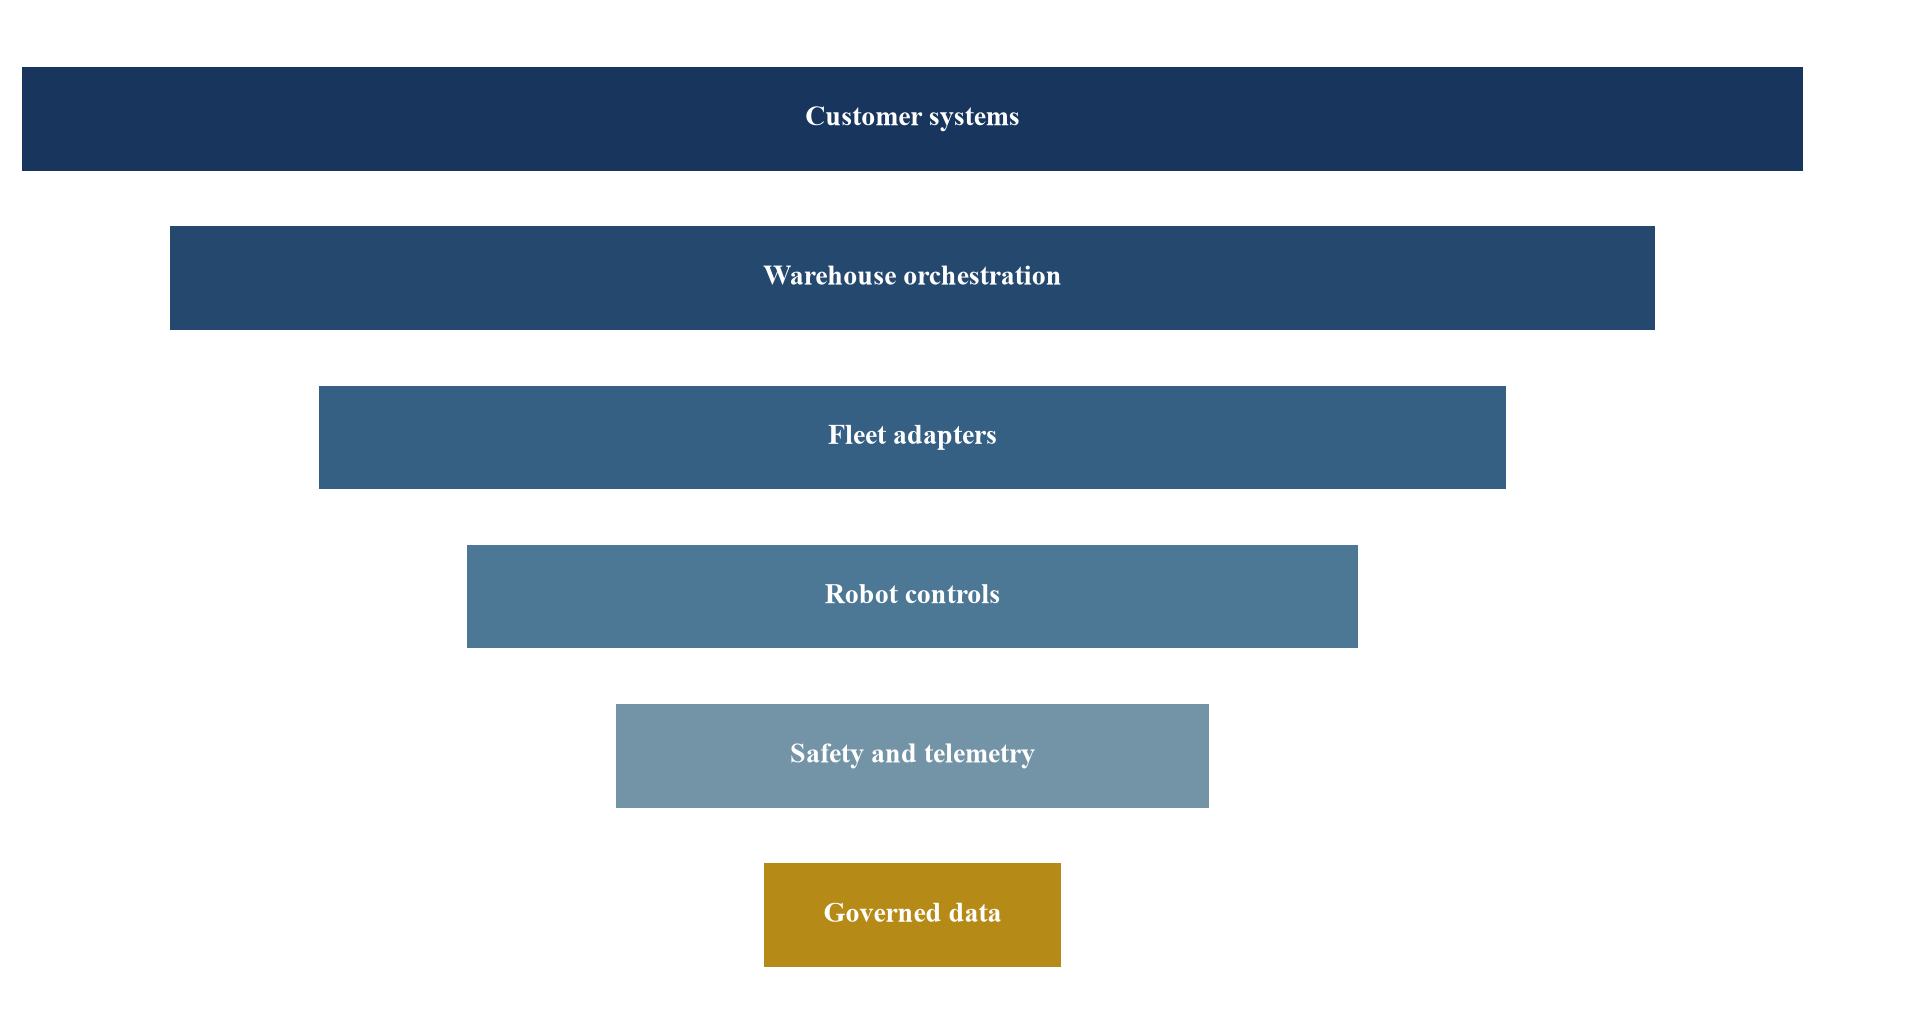
The proposed architecture separates customer systems, warehouse orchestration, fleet adapters, robot controls, safety functions, telemetry and governed data services.
6. Measure fleet performance by cohort
A combined platform needs one measurement dictionary. Productive hours, availability, intervention, task acceptance, throughput, latency, congestion, recovery and safety events should have consistent definitions. Source systems and exclusions remain visible so the buyer can distinguish genuine performance differences from measurement differences.
Cohorts should preserve robot type, software version, site, task and operating exposure. A roll-up can appear to improve when new sites are easier, underperforming units leave the denominator or one business uses a more favourable availability definition. Matched cohorts and exposure-adjusted measures reduce this risk.
Accepted warehouse output is the central unit. Moves, picks, cases, pallets or lines should reconcile to the customer's process and quality requirements. Robot activity can be high while downstream acceptance is low because of errors, waiting, congestion or rework. The economic model needs accepted output and the complete resources used to deliver it.
The baseline is captured before material integration. Data lineage, clock alignment and sampling rules should be documented. Post-close changes then have an attributable release, site, owner and expected outcome. This creates a controlled basis for synergy validation.
7. Value shared learning carefully
Shared learning can arise when operational data from one fleet improves planning, perception, routing, recovery, maintenance or deployment for another. The value mechanism needs four elements: comparable tasks, lawful data rights, a reproducible learning process and measured performance improvement.
Data volume alone does not prove learning value. Logs can be incomplete, inconsistently labelled or concentrated in easy conditions. A useful corpus preserves task context, failure cause, intervention, corrective action, software version and outcome. Coverage across sites and exceptions can be more important than raw event count.
The buyer should distinguish model reuse from process reuse. A learned policy may not transfer across hardware or environments. Evaluation tools, labelling methods, simulation assets, deployment pipelines and incident taxonomy can still create value by shortening the next site's learning cycle. This process benefit should be measured through engineering time, validation time and accepted performance.
Data rights require contract-level review. Customer operational data can include confidential process, worker, inventory and security information. Purpose limits, location, retention, transfer, model-training rights and deletion obligations can constrain combination. Shared learning enters the valuation only within the rights actually obtained.
| Evidence level | Required proof | Value implication | Common failure |
|---|---|---|---|
| Data inventory | governed datasets and rights | potential input asset | unclear ownership or coverage |
| Comparable cohorts | matched task site and version | valid performance comparison | changing mix |
| Reproducible method | code evaluation and release record | repeatable improvement process | one-off engineering effort |
| Controlled deployment | rollback monitoring and approval | operationally usable learning | laboratory-only result |
| Accepted improvement | customer output and complete cost | economic benefit | proxy metric without cash link |
The hierarchy separates a broad data claim from reproducible economic learning.
8. Underwrite service economics
Warehouse-robot businesses can combine equipment sales, subscriptions, maintenance, parts, deployment services and operating support. Consolidated margin can hide a profitable software stream, a loss-making service obligation or installation work required to activate future revenue. The model should separate each performance obligation and cost pool.
Service economics begin with the installed-base ledger. Revenue should reconcile by unit, site and entitlement. Cost includes field labour, remote support, travel, spares, freight, warranty, software operations, connectivity, customer success and the engineering required to sustain legacy configurations. Allocated overhead should be separated from avoidable operating cost.
Density can create value. More supported units within a region may reduce engineer travel, improve parts positioning and justify specialist coverage. Density can also increase correlated exposure when one software release, component defect or cyber event affects many sites. The model should include both efficiency and concentration.
Service-level penalties and customer production losses can materially affect economics. Ticket closure does not prove restored warehouse output. The support metric should connect detection, response, workaround, repair, validation and customer acceptance. Repeat faults and unresolved root causes remain visible.
| Item | Evidence | Central treatment | Integration question |
|---|---|---|---|
| Contracted service revenue | executed entitlement schedule | include by site and period | can terms and billing be aligned |
| Field labour | time and work-order records | direct complete cost | can coverage density improve |
| Remote operations | sessions operators and queue | direct complete cost | can one centre support mixed fleets |
| Parts and logistics | usage failure and freight | cohort-specific cost | can inventory be pooled safely |
| Warranty and credits | claims and service levels | expected cost and tail | does integration change exposure |
| Engineering sustainment | releases defects and tooling | product-line cost | which legacy stacks remain supported |
| Contribution | accepted revenue less complete cost | site and cohort result | is improvement measured in cash |
The bridge connects contracted revenue to the complete cost of keeping a mixed fleet productive.
9. Protect customer continuity
The warehouse is a live production environment. Integration that interrupts fulfilment can destroy the value the transaction was intended to capture. Customer continuity therefore becomes a gating workstream from diligence through the first operating cycle.
The buyer should map contract assignment, change-of-control, data, software, service, warranty and subcontracting provisions. Customer consent may be needed before transferring contracts, changing hosting, combining support or using operational data. The plan should distinguish legal transfer, operational readiness and customer acceptance.
Communication should be account-specific. Customers need clarity on service ownership, escalation, product roadmaps, security, support locations and planned changes. A generic synergy message can increase concern where customers depend on the system for critical throughput. Named account owners should hold a documented continuity plan.
No forced migration should occur without evidence. Legacy systems can remain supported while the buyer validates adapters, orchestration or replacement economics. End-of-life decisions require notice, spares, support, migration tools, customer approval and a tested fallback.
10. Test commercial quality and concentration
Commercial diligence should separate backlog, remaining performance obligations, orders, subscriptions, maintenance entitlements and non-binding pipeline. Symbotic's public filings illustrate that system revenue can depend on installation timelines, performance obligations and final acceptance, and that disclosed backlog can be concentrated in major relationships.[1][2]
The roll-up model should reconcile each material contract to delivery, acceptance, billing, collection and support cost. Orders with cancellation rights, performance conditions or customer-controlled schedules need separate probability and capital assumptions. Revenue quality improves when accepted deployments expand into repeat sites with collected cash.
Customer concentration can increase after aggregation. Two targets may serve different legal entities within one corporate group or depend on one integrator. Unique customer identifiers and ultimate-parent mapping prevent double counting. Concentration should be measured across revenue, backlog, receivables, installed units and support obligations.
Cross-selling remains an execution case until a customer has a defined problem, qualified product, commercial proposal, integration plan and decision route. Existing relationships can reduce access cost. They do not prove purchase intent or technical fit.
11. Map technology and product-roadmap overlap
The buyer should map every product against task, payload, environment, navigation, safety, orchestration, deployment and service capability. Overlap can enable convergence, customer choice or duplicated cost. The decision should reflect installed commitments and future market needs.
Product convergence often works better through future releases than forced retrofit. A common identity, telemetry, service and interface layer can create operating coherence while physical platforms remain distinct. New hardware can adopt shared components or controls after validation. Legacy products can follow a defined support policy.
Roadmap decisions require customer and engineering evidence. Removing a product can impair contracts, spares, talent retention and customer trust. Maintaining every product can dilute investment. The integration team should define strategic platforms, sustain products, migration candidates and exit products with a funded plan.
Technology debt belongs in valuation. Unsupported libraries, fragmented build systems, customer-specific forks, undocumented configuration and obsolete components consume future cash. Remediation estimates should include validation, safety evidence, deployment tools and customer acceptance rather than code effort alone.
12. Secure cyber, identity and operational data
A combined fleet expands the attack surface across robots, chargers, controllers, wireless networks, cloud services, customer systems and remote-support tools. The buyer should map assets, identities, privileges, certificates, interfaces, data flows, software dependencies and incident responsibilities before connecting environments.
Robot identity should be unique and cryptographically supportable. Shared credentials, unmanaged service accounts and customer-specific access workarounds complicate integration. The target state should define device identity, human identity, service identity, privileged access, key rotation and revocation. Temporary integration access requires expiry and monitoring.
The NIST Cybersecurity Framework 2.0 and related guidance provide a governance structure for identifying, protecting, detecting, responding and recovering.[8] The transaction team should translate this into a product and site control map. Evidence includes inventories, architecture, vulnerability handling, update capability, penetration tests, incident records, backup, recovery and customer obligations.
Operational data needs a governed model. Timestamp, site, robot, task, release, event, operator and outcome should be traceable. Data quality rules, retention, residency and access need owners. A combined data lake without lineage or purpose controls can increase risk and weaken the learning case.
Remote access deserves transaction-level scrutiny because it can cross customer boundaries. The buyer should identify which employees, contractors and suppliers can view or control each fleet, which tools they use, how sessions are approved and recorded, and whether emergency access is technically distinct. Access inherited from a seller or product team should not persist through closing without an accountable decision.
Software-update capability is both an asset and a liability. Signed packages, staged rollout, compatibility testing, customer windows, rollback and post-release monitoring determine whether the combined platform can correct faults safely. A business that cannot update deployed units consistently may carry a growing vulnerability and support tail. The integration budget should fund the control plane required for a heterogeneous installed base.
13. Rationalise spares and supply chains
Spares pooling is a common roll-up synergy and requires technical evidence. Similar-looking components can have different firmware, calibration, certification, warranty or safety implications. The buyer should classify parts as identical, qualified substitutes, repairable, strategic, obsolete or customer-specific.
Inventory records should reconcile quantity, location, condition, ownership, demand, lead time and installed compatibility. Slow-moving stock can be necessary insurance for legacy fleets. A simple inventory reduction can impair uptime. The model should calculate service risk and replenishment alternatives before releasing cash.
Supplier concentration may increase after the transaction. Motors, batteries, sensors, compute modules, safety devices and fabricated assemblies can depend on a small number of sources. Contract transfer, minimum orders, tooling ownership, quality history and end-of-life notices belong in diligence. A purchasing discount matters only when the combined volume is technically interchangeable and contractually available.
Design convergence can create future value. A shared component should pass engineering, supply, quality, safety and service gates. Qualification cost, redesign, customer validation and remaining legacy inventory reduce the benefit. The integration model should stage the benefit by product generation rather than applying it immediately to the entire fleet.
14. Retain engineering and field capability
Robotics value resides partly in teams that understand hardware, controls, autonomy, deployment and customer operations. Organisation charts do not show dependency. The buyer should map critical knowledge, decision authority, on-call coverage, customer relationships, code ownership and single-person risks.
Engineering capacity should be separated into new product, deployment, sustaining, defect remediation, customer customisation and integration. A roll-up can appear to have a large engineering team while most capacity is committed to contracted deliveries or legacy support. Planned synergy can then compete directly with customer obligations.
Field capability requires geography, certification, tools, access and task knowledge. Combining dispatch can improve coverage. Removing local expertise can increase mean time to restore. The operating model should define regional hubs, remote escalation, specialist pools, parts positions and customer-specific authorisation.
Retention measures should connect to roles and milestones. Broad retention payments can preserve headcount without protecting scarce capability. The buyer should identify the people required for continuity, rights transfer, release control, safety cases, major accounts and target architecture. Succession and documentation should reduce dependency over time.
15. Build the integration baseline
Synergy measurement requires a locked baseline. The baseline should include fleet size, accepted tasks, availability, intervention, incidents, service tickets, field hours, spares, customer revenue, complete contribution, working capital and planned product investment. Definitions and source systems must be preserved.
The buyer should separate run-rate, backlog delivery and exceptional work. A target may be adding engineers, building inventory or supporting early deployments. Removing these costs can reduce future revenue or impair acceptance. The baseline should link resources to contractual and operating obligations.
Dis-synergies belong in the same model. Customer consent, dual systems, retention, adapters, security remediation, rebranding, contract harmonisation, data migration and duplicated support can consume cash before benefits arrive. Revenue disruption, delayed installations and slower product releases need downside cases.
Every benefit should have an owner, source, action, investment, timing, metric and cash bridge. The integration office tracks realised evidence rather than presentation estimates. Benefits that depend on customer behaviour or technical validation remain probability-weighted until the relevant gate is passed.
Baseline governance should prevent retroactive changes. Finance owns the cash definition, operations owns the service and output definition, product owns release attribution, and account leaders own customer acceptance. Adjustments require an audit trail and approval. This allows the board to distinguish operational improvement from reclassification, changed allocation or favourable mix.
The baseline also needs a loss register. Customer churn, delayed installations, missed service levels, cancelled orders, excess spares, duplicate engineering and deferred roadmap work can offset visible savings. Recording losses against the same transaction thesis avoids a one-sided synergy report and improves capital allocation.
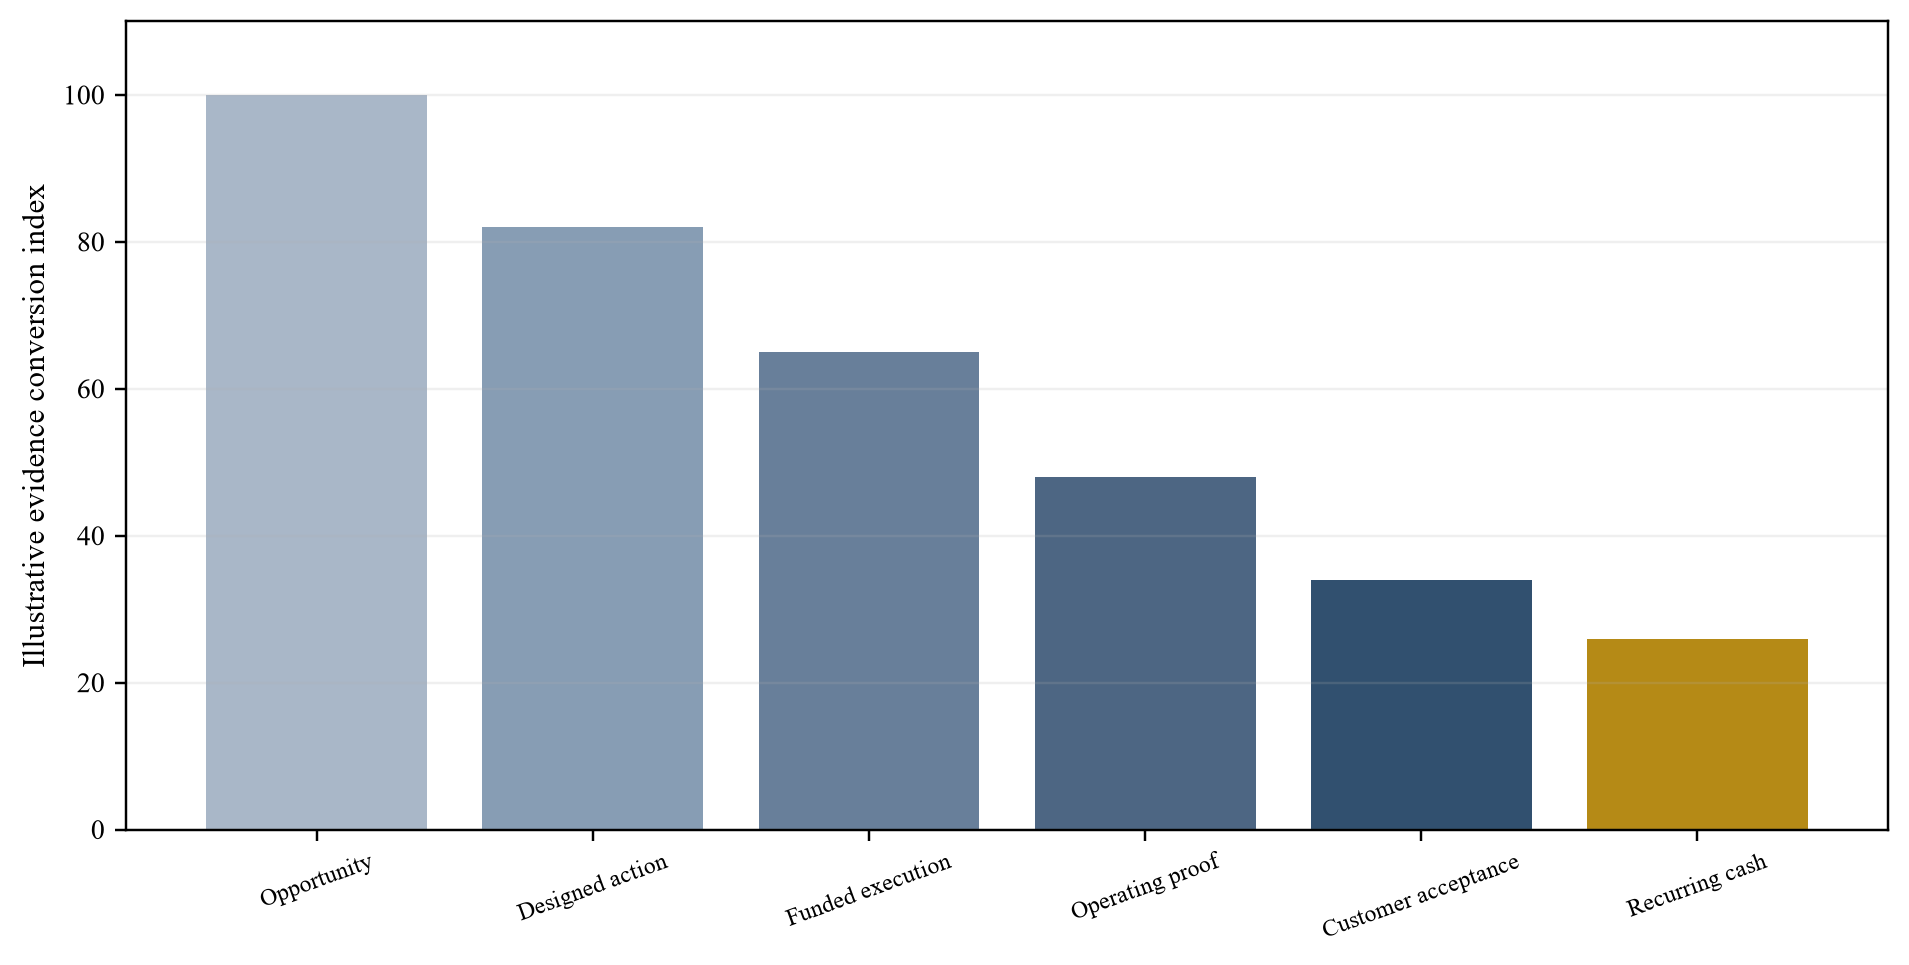
The proposed ladder moves from opportunity and designed action through funded execution, operating proof, customer acceptance and recurring cash.
16. Construct a hypothetical roll-up case
The illustrative case combines three warehouse-robot businesses. Target Alpha has 1,200 active mobile robots across 28 warehouses, established fleet software and concentrated customers. Target Beta has 700 robots across 19 sites, stronger field-service density and a different orchestration stack. Target Gamma has 300 specialist robots across 11 sites, valuable task capability and early service economics.
All figures are hypothetical management assumptions. They demonstrate calculation and do not describe a named company. The case assumes that 85 percent of reported units are reconciled as active commercial units, 8 percent are accepted pilots or deployment-stage units and 7 percent are internal, inactive or unsupported. The base valuation uses active commercial units and the contracted contribution attributable to them.
The integration case assumes no immediate hardware convergence. Identity, telemetry, service ticketing and customer reporting are unified first. Fleet adapters are built for selected mixed sites. Shared learning is limited to tasks with comparable definitions and lawful data rights. Product convergence begins only for a future hardware generation.
Revenue benefits include qualified cross-selling and improved retention. Cost benefits include field-service density, selected spares pooling, cloud and tooling rationalisation, procurement and duplicated corporate functions. The model includes adapters, security remediation, retention, dual operations, customer validation and product-roadmap investment.
| Measure | Alpha | Beta | Gamma | Combined baseline |
|---|---|---|---|---|
| Reported robots | 1,320 | 760 | 335 | 2,415 |
| Reconciled active commercial robots | 1,200 | 700 | 300 | 2,200 |
| Warehouses | 28 | 19 | 11 | 58 |
| Annual revenue | USD 96m | USD 49m | USD 24m | USD 169m |
| Complete service and software contribution | USD 22m | USD 12m | USD 4m | USD 38m |
| Largest customer share | 38% | 24% | 20% | requires parent reconciliation |
| Primary integration priority | data and concentration | service density | task capability | controlled platform |
All values are illustrative management assumptions created solely to demonstrate the transaction method.
17. Calculate value creation through cash
The central case begins with stand-alone cash flows after necessary product investment. Acquisition value is not created by relabelling target earnings as synergy. The combined model then adds benefits and costs according to evidence gates.
The hypothetical case assumes annual gross benefit of USD 18 million at maturity: USD 5 million field-service and parts efficiency, USD 3 million procurement, USD 2 million cloud and tooling, USD 3 million customer retention, and USD 5 million qualified cross-selling and deployment acceleration. It assumes USD 24 million of one-time integration investment and USD 6 million of recurring enabling cost.
Mature net benefit is therefore USD 12 million before tax and further reinvestment. The benefit is staged over four years because customer consent, adapters, operating-model change and product validation take time. The model separately includes transition risk and does not treat unqualified pipeline as committed revenue.
The cash bridge should include working capital. A larger installed base can require more spares, service inventory and receivables. Hardware deliveries may create milestone cash patterns. Integration can delay billing or collection if contract and system migrations are weak. Financing capacity should be tested against the actual transition profile.
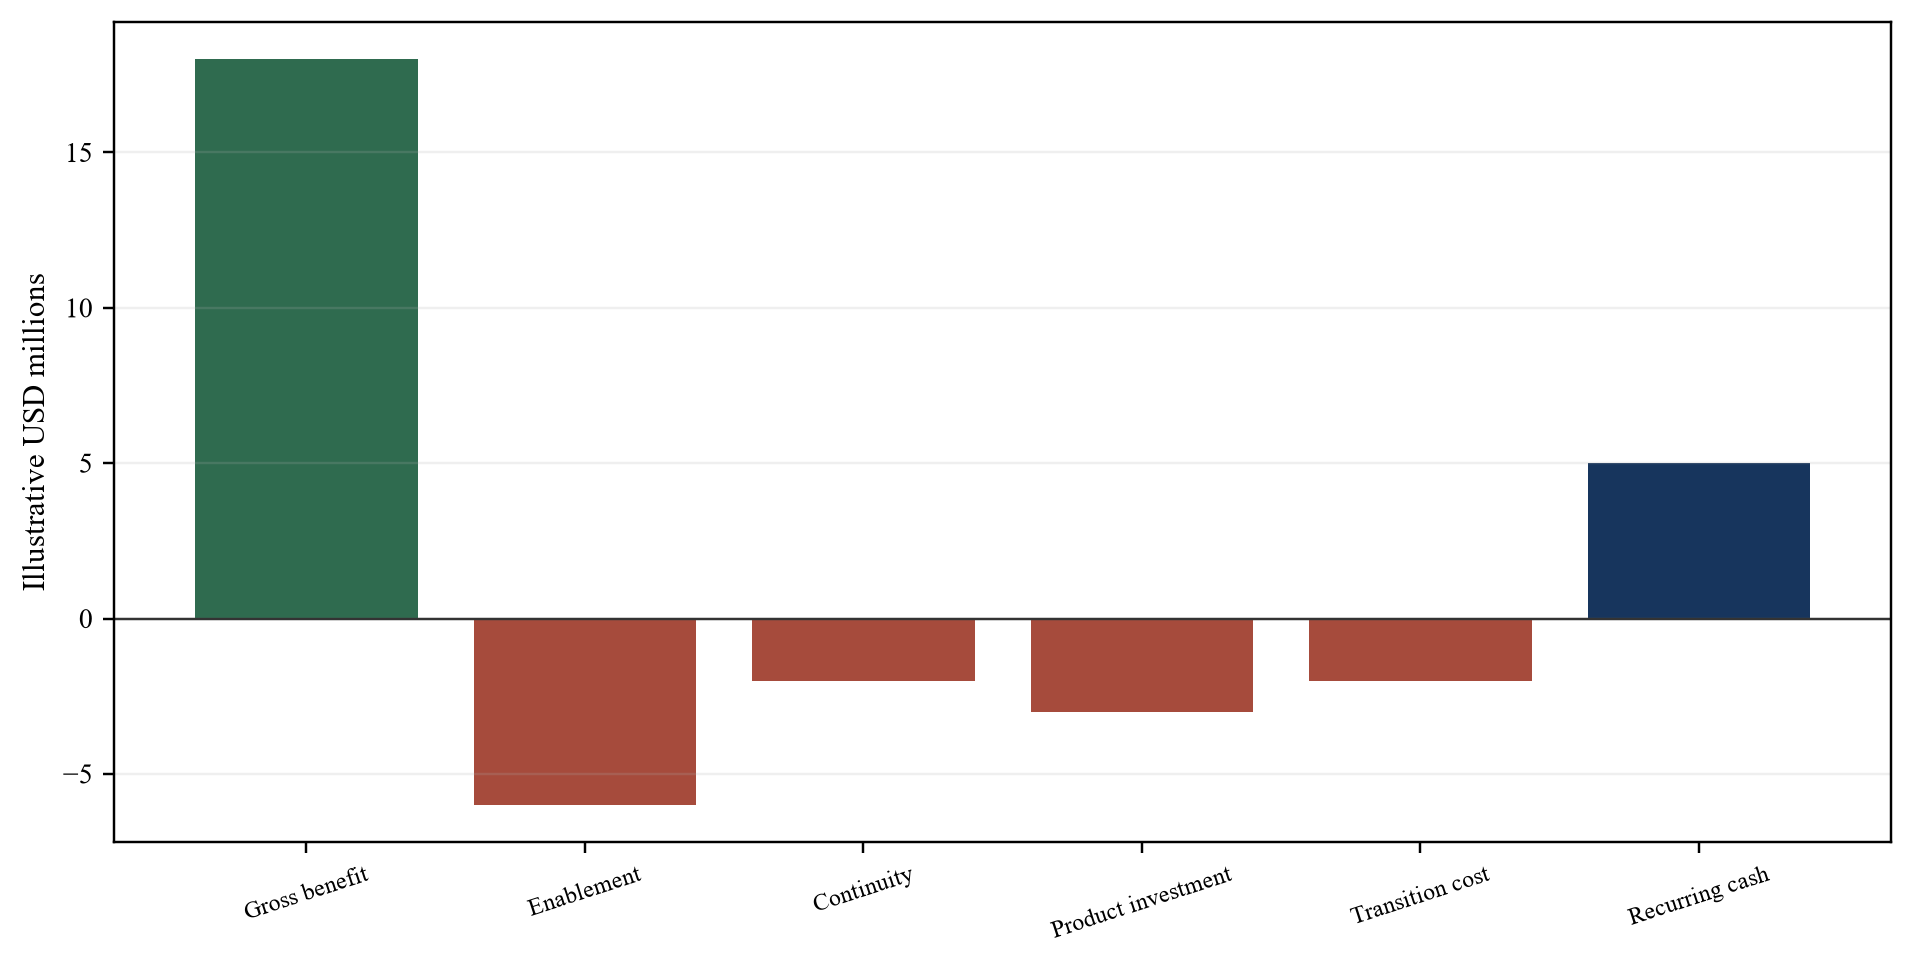
The illustrative bridge moves from gross benefits through recurring enablement, customer continuity, product investment and transition cost to recurring cash value.
| Item | Year 1 | Year 2 | Year 3 | Year 4 run-rate |
|---|---|---|---|---|
| Gross operating benefit | 3 | 9 | 15 | 18 |
| Recurring enabling cost | -4 | -5 | -6 | -6 |
| Net recurring benefit | -1 | 4 | 9 | 12 |
| One-time integration investment | -12 | -7 | -4 | -1 |
| Net annual integration cash | -13 | -3 | 5 | 11 |
| Cumulative integration cash | -13 | -16 | -11 | 0 |
Amounts are USD millions and are management assumptions for illustration only.
18. Stress the integration case
The downside case should attack the mechanism of value. Customer consent can be slower, adapters can cost more, telemetry can be incomparable, service consolidation can impair response, product releases can slip and key people can leave. Correlated technology or cyber failures can affect a larger installed base.
The hypothetical central case reaches USD 12 million of mature annual net benefit. A delayed-consent case reduces retention and cross-selling benefits by half for two years and adds USD 4 million transition cost. A technology-fragmentation case removes shared-learning benefit, adds USD 8 million engineering cost and preserves duplicate tooling. A customer-disruption case assumes 6 percent revenue attrition and service credits.
Stress results should feed liquidity, covenants and purchase price. A synergy model that only changes the exit multiple misses the cash needed to reach integration. The buyer should model monthly or quarterly cash through the transition, including committed product development and working capital.
Management should define stop conditions. If mixed-fleet testing cannot meet safety and output thresholds, the architecture remains separated. If customer consent is unavailable, data and service consolidation remain limited. If support metrics deteriorate, cost actions pause until continuity is restored.
Sensitivity should cover timing as well as magnitude. A benefit delayed by twelve months can consume additional transition cost and liquidity even if the eventual run-rate is unchanged. A staged model therefore tracks when each action starts, when the customer accepts it, when the accounting result appears and when cash is collected. The four dates can differ materially.
The buyer should also test portfolio correlation. Common orchestration, identity, cloud or component choices can reduce duplicated cost and create a larger failure domain. The model can assign an expected outage or remediation exposure to the common layer. Resilience design, segmentation, rollback and spare capacity then become value-protection investments rather than unallocated overhead.
| Scenario | Mature net benefit | Additional cost | Revenue effect | Decision response |
|---|---|---|---|---|
| Central | USD 12m | none beyond plan | retained | execute gated programme |
| Consent delay | USD 8m | USD 4m | cross-selling delayed | preserve account separation |
| Technology fragmentation | USD 5m | USD 8m | limited shared learning | ring-fence products |
| Customer disruption | USD 3m | USD 6m | 6% attrition assumption | pause service consolidation |
| Combined downside | negative USD 2m | USD 14m | attrition and delay | reprice or change structure |
The cases are illustrative management assumptions and require company-specific replacement.
19. Value the roll-up in layers
The valuation should separate stand-alone value, integration value and strategic options. Stand-alone value reflects verified contracts, active fleets, accepted revenue, complete costs, necessary product investment and target-specific risk. Integration value reflects funded benefits net of execution cost, time and probability. Strategic options include new tasks, geographies or business models that remain outside the base case.
Comparable-company and transaction references need operating normalisation. Robot units can differ in ownership, utilisation, service entitlement, task complexity and maturity. Revenue can contain hardware, implementation, recurring software and pass-through. EBITDA can omit necessary engineering or integration. A buyer should explain the denominator before applying a multiple.
The hypothetical case assigns USD 250 million to combined stand-alone operations. It models central integration value at USD 54 million after discounting staged net cash and terminal benefit. It deducts USD 20 million for concentration, technology remediation and transition risk, producing illustrative enterprise value of USD 284 million before net debt and other claims.
Buyer-specific benefits remain separate. Existing distribution, manufacturing, capital or service infrastructure can improve value for a particular owner. These synergies require incremental cash evidence and should not be paid entirely to the seller. The price-to-value bridge should state which party funds and captures each benefit.
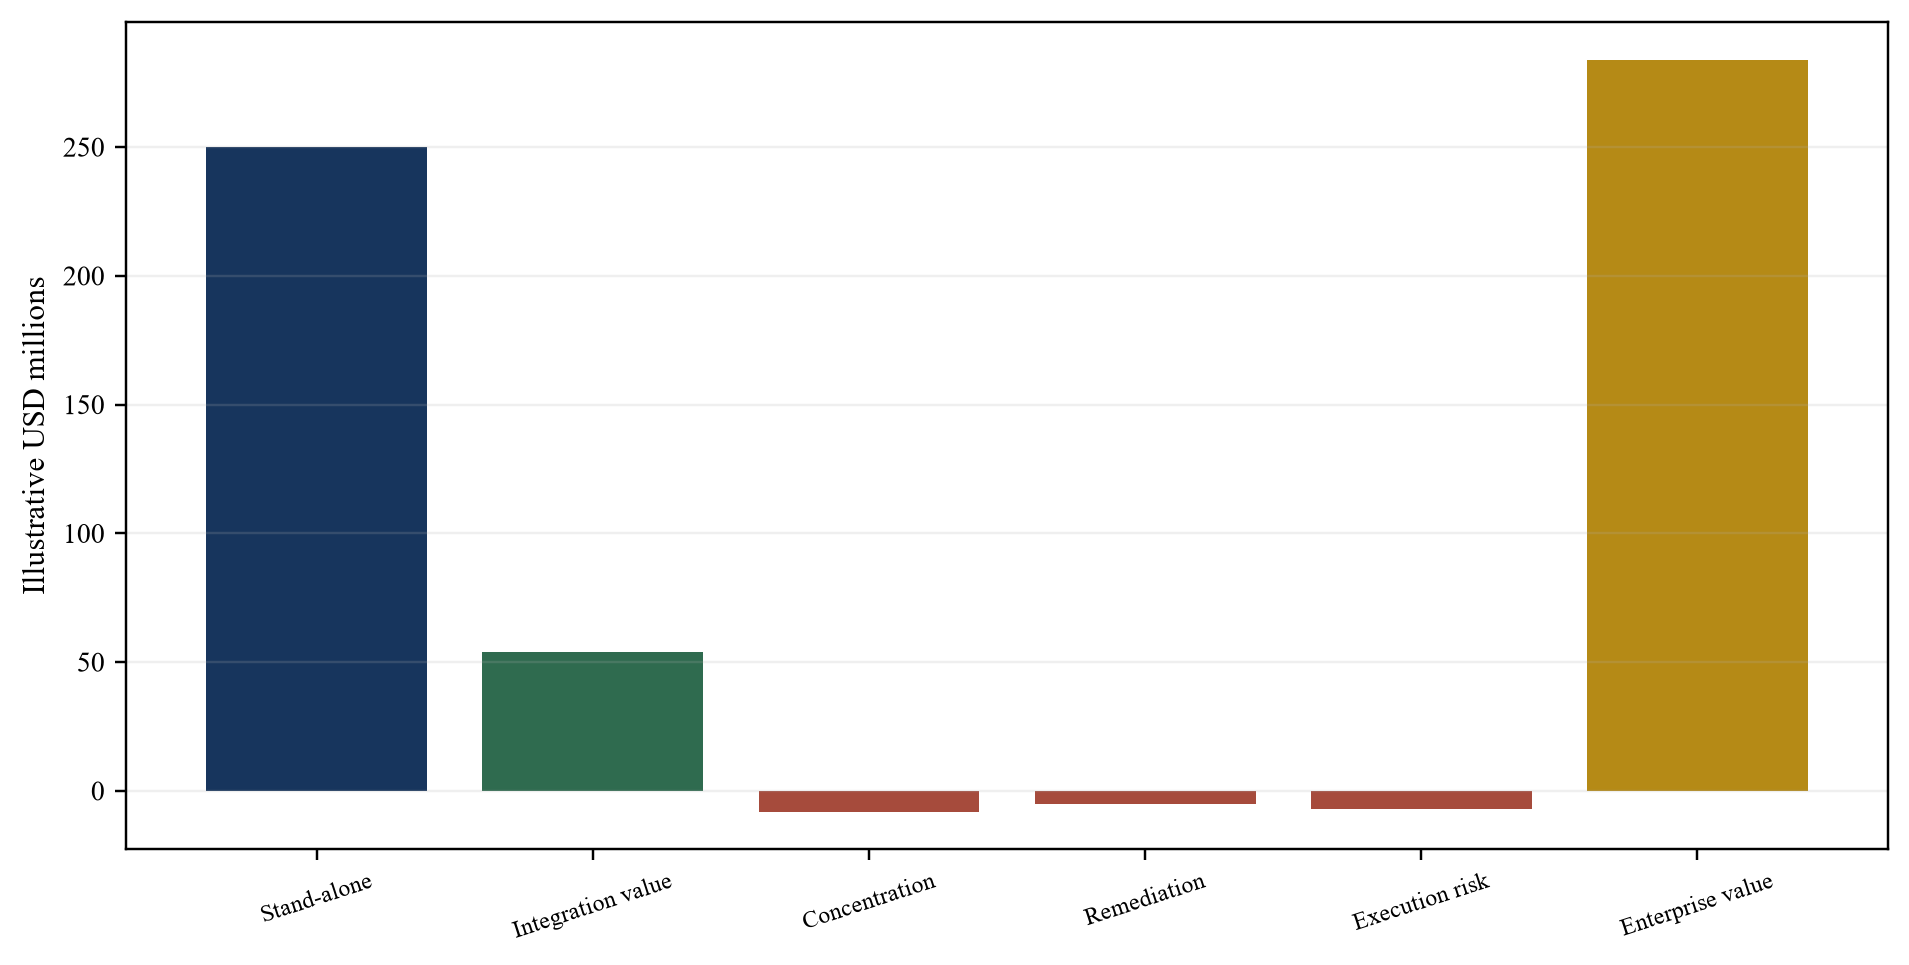
The illustrative bridge separates verified stand-alone operations, probability-weighted integration value, remaining investment, concentration and execution risk.
20. Structure the transaction around evidence
Transaction structure can allocate uncertainty that diligence cannot eliminate. Consideration can include cash at close, rollover equity, holdback, escrow and contingent payments. Milestones should connect to outcomes the seller can influence and the buyer can verify.
Relevant milestones can include customer consent, fleet-ledger reconciliation, accepted mixed-fleet operation, retention of critical teams, renewal of service contracts, delivery of software and rights, closure of specified cyber issues and achievement of contribution without degrading safety or service.
Representations and warranties should match the architecture. Topics include title to hardware, software and data rights, open-source compliance, customer contracts, service obligations, vulnerabilities, incidents, safety files, product claims, export controls, employee inventions, supplier commitments and inventory condition. Specialist advice defines the applicable scope.
Integration funding should be committed. A buyer that pays for future synergy while underfunding adapters, retention, security, product sustainment or field capacity can destroy the case. The investment committee should approve purchase price and transition capital together.
21. Execute a 180-day integration programme
Days 1 to 30 stabilise control. The buyer confirms leadership, customer ownership, service escalation, cyber access, cash controls, fleet inventory and critical supplier continuity. No material fleet or safety-control change occurs without the approved process.
Days 31 to 60 establish the common evidence model. Teams reconcile installed units, contracts, telemetry, service tickets, parts and engineering commitments. Baselines are locked. Customer consent and rights issues are classified. Architecture and product-roadmap decisions receive named owners.
Days 61 to 90 validate selected integration. The buyer pilots common identity, telemetry, reporting, service dispatch or adapters in controlled cohorts. Safety, cyber, customer output and rollback are tested. Benefits remain outside realised reporting until acceptance evidence is available.
Days 91 to 180 scale approved actions. Regional service coverage, parts pooling, procurement, customer offers and product-roadmap changes proceed only where the relevant gate passed. The integration office reports customer continuity, accepted output, incidents, service contribution, investment and cash against the baseline.
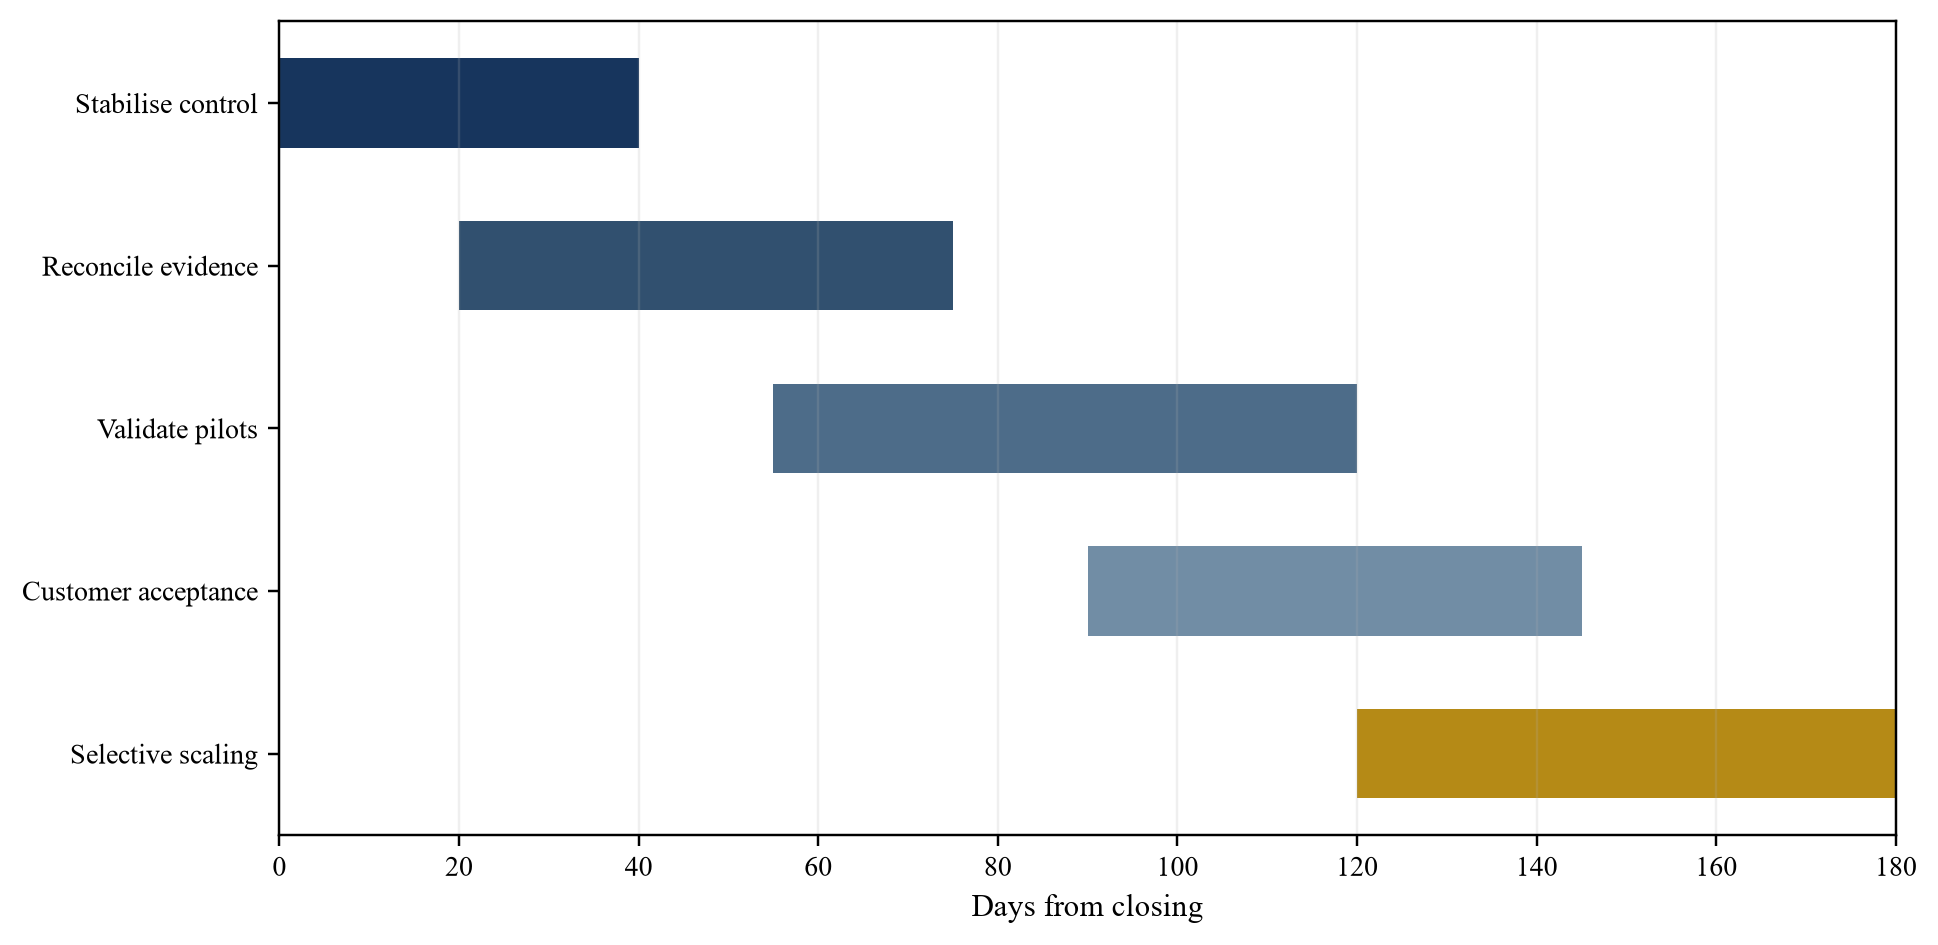
The programme sequences stabilisation, evidence reconciliation, controlled pilots, customer acceptance and selective scaling.
| Workstream | Day 30 evidence | Day 90 gate | Day 180 outcome |
|---|---|---|---|
| Fleet | reconciled identity exceptions | matched telemetry cohorts | controlled combined reporting |
| Customer | account and consent map | accepted pilot changes | retained service and qualified expansion |
| Technology | architecture and rights map | tested interfaces and rollback | approved shared services |
| Safety and cyber | control and incident inventory | representative validation | monitored production controls |
| Service | labour parts and ticket baseline | density pilot without service loss | measured complete contribution |
| People | critical capability and retention | succession and knowledge transfer | stable accountable organisation |
| Finance | baseline investment and liquidity | evidence-gated benefits | realised cash bridge |
The dashboard links workstreams to measurable decision evidence.
22. Make the transaction decision explicit
The board should receive a decision pack that distinguishes verified operations, funded integration and strategic options. It should show the installed-base ledger, customer concentration, architecture, rights, safety and cyber issues, complete service economics, product roadmap, people dependencies, liquidity and downside cases.
Approval conditions should be measurable. The buyer may require specified customer consents, delivery of source and build materials, closure of critical vulnerabilities, confirmation of fleet ownership, retention agreements, supplier continuity and a funded integration reserve. Open items remain in a closing and post-close register.
The decision should state the selected integration depth. Commercial and corporate functions may combine while product controls remain separated. Selected interfaces may proceed through pilots. Future products may converge. A clear perimeter protects customers and prevents uncontrolled technical integration.
The decline or reprice case should also be explicit. Unreconciled fleet claims, untransferable rights, unacceptable customer concentration, unsupported service economics, material safety gaps, underfunded product commitments or a negative combined-downside cash case can change the structure or stop the transaction.
Conclusion
Warehouse-robot roll-ups create value through controlled reuse rather than scale alone. A larger installed base can improve customer access, field-service density, spares, engineering and data. It can also combine incompatible products, concentrated contracts, legacy obligations and correlated operating risk.
The installed-base ledger establishes what is operating, for whom, under which rights and at what cost. It connects robots, software, tasks, sites, contracts, service and telemetry. Exceptions remain visible rather than disappearing inside a consolidated fleet count.
Interoperability is a sequence of gates. Common identity, time, task semantics and interfaces precede representative testing. Customer acceptance, safety, cyber controls, support and rollback determine whether a connection can enter production. A dashboard or laboratory demonstration is insufficient.
Shared learning has value when data is comparable, rights are secure, methods are reproducible and performance improves accepted customer output or complete cost. Process reuse can be valuable even when policies do not transfer across hardware. Both require measurement.
Service economics translate the fleet into recurring cash. Revenue, field labour, remote operations, spares, warranty, engineering sustainment and service levels belong in one bridge. Regional density can reduce cost while a common defect can increase correlated exposure.
Customer continuity is the first operating constraint. Contract transfer, data use, support ownership, product roadmaps and migrations require account-specific evidence. Legacy support can preserve value while the buyer validates new interfaces and future convergence.
Valuation should separate stand-alone operations, funded integration and strategic options. Benefits are staged by evidence and netted against enablement, investment, delay, working capital and customer risk. Buyer-specific synergies remain separately attributed.
Transaction terms can connect consideration to consent, rights, retained capability, accepted mixed-fleet operations and contribution. The 180-day programme stabilises the business, reconciles evidence, pilots selected changes and scales only approved actions.
The practical objective is one accountable operating platform across many warehouses, even when several robot types remain. That platform has controlled identity, comparable evidence, secure rights, reliable service, protected customers and a cash model that reconciles integration claims to realised value.
Integration success should therefore be visible at warehouse level and in consolidated cash. Sites should receive stable or improving service, employees should work within controlled procedures, customers should accept the output, and the combined business should reduce complete cost without hiding investment. A transaction that achieves accounting consolidation without these operating results has not demonstrated platform value.
The framework gives directors a repeatable sequence: verify the fleet, preserve continuity, map rights and architecture, test selected interfaces, measure complete economics, allocate uncertainty through terms and release capital against evidence. This sequence allows ambition and control to coexist throughout the roll-up.
The resulting record also supports lenders, auditors, insurers, regulators and future investors with a consistent explanation of the combined platform.
Sources
- United States Securities and Exchange Commission, Symbotic Inc Annual Report 2025, Read the primary source
- United States Securities and Exchange Commission, Symbotic Quarterly Report June 2025, Read the primary source
- United States Securities and Exchange Commission, Zebra Technologies Annual Report 2023, Read the primary source
- International Organization for Standardization, ISO 10218-1 Robotics Safety Requirements, Read the primary source
- International Organization for Standardization, ISO 10218-2 Robot Applications and Cells, Read the primary source
- International Organization for Standardization, ISO 3691-4 Driverless Industrial Trucks, Read the primary source
- International Organization for Standardization, ISO 12100 Machinery Risk Assessment, Read the primary source
- National Institute of Standards and Technology, Cybersecurity Framework 2.0, Read the primary source
- National Institute of Standards and Technology, Performance of Human Robot Interaction, Read the primary source
- National Institute of Standards and Technology, Manufacturing Robotics Testbed, Read the primary source
- United States Occupational Safety and Health Administration, Robotics Overview, Read the primary source
- United States Occupational Safety and Health Administration, Industrial Robot Systems Safety, Read the primary source
- International Federation of Robotics, World Robotics 2025, Read the primary source
- International Federation of Robotics, Service Robots 2025, Read the primary source
- European Union, Regulation 2023/1230 on Machinery, Read the primary source
- European Commission, AI Act Regulatory Framework, Read the primary source
- National Institute of Standards and Technology, AI Risk Management Framework, Read the primary source
- National Institute of Standards and Technology, Generative AI Profile, Read the primary source
- National Institute of Standards and Technology, Secure Software Development Framework, Read the primary source
- National Institute of Standards and Technology, Zero Trust Architecture, Read the primary source
- International Organization for Standardization, ISO 13849-1 Safety Related Control Systems, Read the primary source
- International Electrotechnical Commission, IEC 61508 Functional Safety, Read the primary source
- International Organization for Standardization, ISO TS 15066 Collaborative Robots, Read the primary source
- IFRS Foundation, IFRS 3 Business Combinations, Read the primary source
- IFRS Foundation, IFRS 13 Fair Value Measurement, Read the primary source
- IFRS Foundation, IAS 36 Impairment of Assets, Read the primary source
- IFRS Foundation, IAS 38 Intangible Assets, Read the primary source
- IFRS Foundation, IFRS 15 Revenue from Contracts with Customers, Read the primary source
- International Valuation Standards Council, International Valuation Standards, Read the primary source
- United States Department of Justice and Federal Trade Commission, Merger Guidelines, Read the primary source
- European Commission, Merger Control, Read the primary source
- United Kingdom Competition and Markets Authority, Merger Assessment Guidelines, Read the primary source
- United States Federal Trade Commission, Premerger Notification Program, Read the primary source
- United States Securities and Exchange Commission, Cybersecurity Risk Disclosure Rules, Read the primary source
- Organisation for Economic Co-operation and Development, Responsible Business Conduct Due Diligence, Read the primary source
- Organisation for Economic Co-operation and Development, AI Principles, Read the primary source
- European Union Agency for Cybersecurity, Good Practices for Supply Chain Cybersecurity, Read the primary source
- Cybersecurity and Infrastructure Security Agency, Secure by Design, Read the primary source
- Cybersecurity and Infrastructure Security Agency, Known Exploited Vulnerabilities Catalogue, Read the primary source
- United States Securities and Exchange Commission, Serve Robotics Annual Report 2025, Read the primary source
- United States Securities and Exchange Commission, Amazon Annual Report 2025, Read the primary source
- Ocado Group, Annual Reports and Accounts, Read the primary source
- AutoStore Holdings, Annual Reports, Read the primary source
- KION Group, Annual Reports, Read the primary source
- Jungheinrich, Annual Reports, Read the primary source
- Zebra Technologies, Fetch Robotics Acquisition Announcement, Read the primary source
- MHI, Industry Reports, Read the primary source
- Robotics Industries Association, Industrial Robot Safety, Read the primary source
- Open Robotics, ROS 2 Security, Read the primary source
- NIST, State of the Art in Human Robot Interaction, Read the primary source
