
1. Define the transaction decision
A buyer or investor should state which uncertainty it is paying to resolve. A robotics target can own hardware, actuators, controls, autonomy software, task data, deployment tools, service operations, customer contracts or an integrated system. Each layer has a different capital requirement, competitive boundary and path to cash. A transaction memorandum should identify the scarce asset and the evidence that supports its value.
The counterfactual may be an internal programme, a commercial partnership, another target, conventional automation or continued labour. The same task, site, service level and time horizon should be used across alternatives. A target that offers a versatile humanoid form can still lose economically to a fixed automation cell when the customer's task is stable and high volume. Versatility has value when it reduces redesign, expands eligible tasks or shortens deployment.
The acquisition thesis should define the value mechanism. Potential mechanisms include faster access to a deployable product, proprietary task data, manufacturing know-how, a safety case, customer distribution, scarce engineering talent or integration capability. Each mechanism should have a measurable baseline, implementation owner, required capital and failure condition. Strategic language without a cash bridge should remain outside the base valuation.
Timing matters because technology and capital needs evolve together. An early transaction can secure option value and exposes the buyer to technical, production and adoption risk. A later transaction can use stronger evidence and may require a higher price. The board should compare staged investment, minority ownership, commercial rights, acquisition and build alternatives using the same evidence milestones.
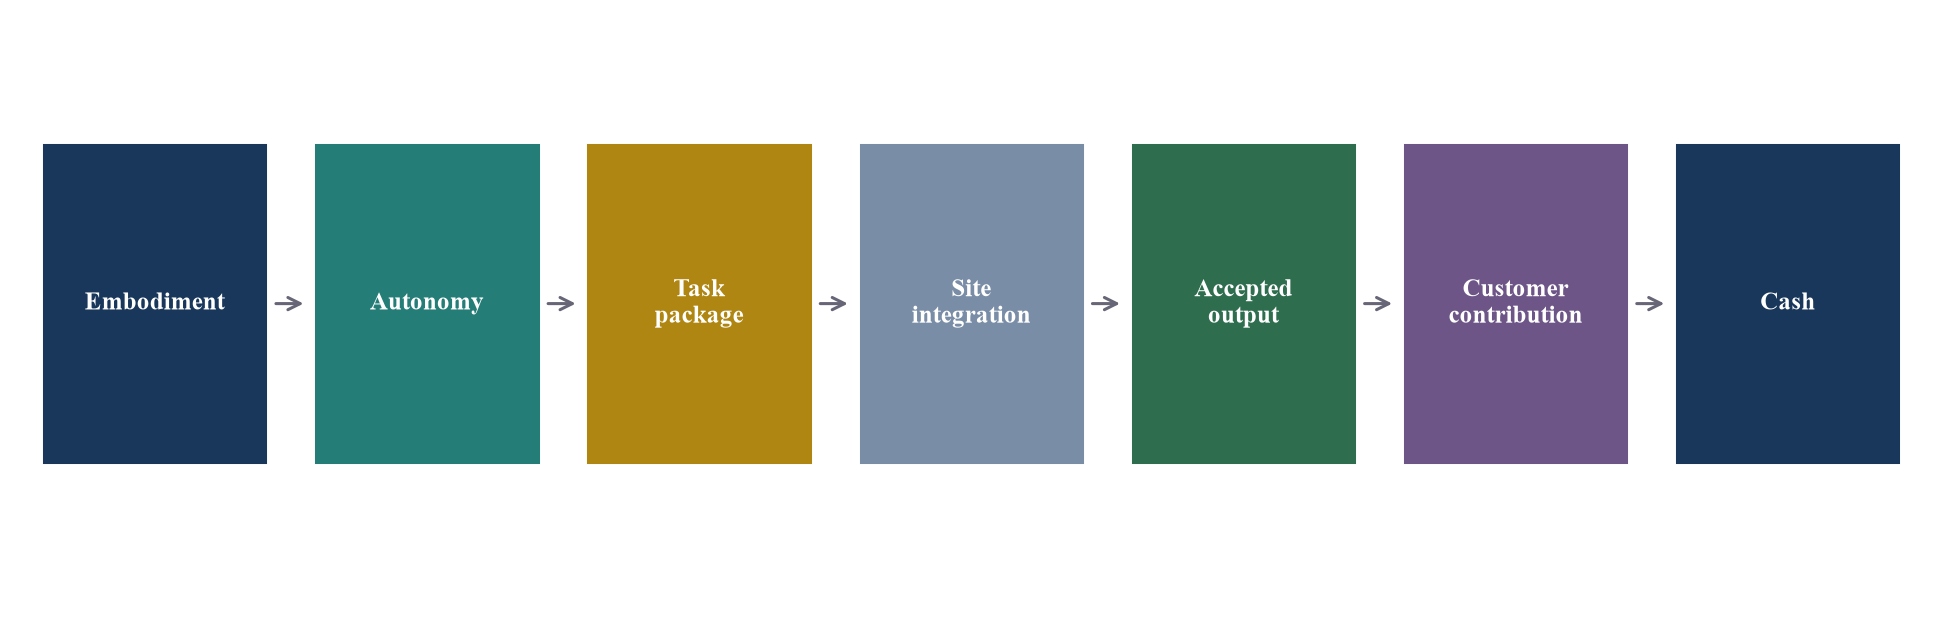
The chain identifies evidence required to connect a robot platform with accepted customer value and cash.
2. Separate the robotics value layers
Embodiment includes the mechanical structure, actuators, power, sensors, compute, end effectors and safety hardware. Autonomy includes perception, planning, control, task policy, monitoring and recovery. The task package adds tools, fixtures, workflow logic, site maps and acceptance criteria. Integration connects the robot to physical processes, information systems and worker procedures. Service operations keep the fleet available.
The layers can mature at different rates. A capable prototype can use expensive components and substantial teleoperation. A manufacturable robot can still lack reliable task autonomy. A strong autonomy stack can depend on third-party hardware. A transaction model should avoid assigning the same maturity to the entire system because one layer performed well in a demonstration.
Ownership also differs by layer. Hardware design can contain licensed components and supplier-controlled firmware. Autonomy can use open-source software, third-party models, customer data and contractor code. Deployment tools can depend on a cloud platform. Customer contracts may restrict data use or transfer. Due diligence should trace rights and dependencies through the actual production architecture.
The value bridge assigns revenue, cost, capital and risk to each layer. Hardware may generate sale revenue with warranty exposure. Software may generate recurring subscription revenue. Deployment and support can be labour-intensive services. Data may improve performance without being separately saleable. Consolidated gross margin can obscure a low-margin hardware ramp subsidised by engineering services or a recurring stream that depends on continual on-site labour.
3. Build fleet cohorts before extrapolating
A fleet should be divided into cohorts by hardware version, software release, site, customer, task, operating environment and deployment date. A blended fleet average can combine early prototypes, carefully supervised pilots and newer commercial units. The average then fails to represent any repeatable production state.
Each cohort needs a stable denominator. Useful denominators include powered hours, scheduled hours, productive hours, accepted tasks, distance, picks, cases or another task-specific unit. Calendar time alone can overstate learning when deployment volume is small. Unit count alone can understate exposure when a few robots operate intensively.
Cohort evidence should preserve inclusion rules. Units removed for repair, internal demonstrations, training, customer evaluation or non-production use can materially change the result. Management should reconcile serial numbers, software versions, sites and hours to service records and customer billing. Exceptions remain visible.
The transaction team should distinguish within-cohort learning from mix change. Apparent improvement can result from easier tasks, favourable sites, stronger operators or removal of difficult units. A valid learning curve holds relevant conditions constant or explains the adjustment. Site expansion should add environmental variability rather than only replicate the best pilot.
| Dimension | Required record | Economic question | Diligence test |
|---|---|---|---|
| Hardware version | serial number and configuration | are cost and reliability repeatable | reconcile build and service history |
| Software release | deployed version and change log | did performance improve after a controlled change | compare matched tasks and sites |
| Site | layout and operating conditions | can deployment transfer | test environmental differences |
| Task | defined start end and acceptance | what productive output is delivered | sample customer acceptance |
| Intervention | cause duration and operator | how much human support remains | trace events to labour records |
| Safety event | severity exposure and response | what loss and constraint exist | reconcile incident registers |
| Commercial status | pilot order deployment and billing | when evidence converts to cash | trace contract to collection |
Each cohort requires company-specific definitions, reconciliation and acceptance criteria.
4. Define the task before measuring autonomy
A humanoid can demonstrate walking, lifting or manipulation without completing a customer process. Transaction evidence should define the task from authorised start through accepted handoff. Warehouse movement can include item identification, grasp, transport, placement, exception handling and confirmation. Manufacturing work can include fixture interaction, quality checks and safe response to people and process changes.
The task definition should record object range, payload, reach, precision, cycle-time target, environment, tools, human proximity and failure consequences. A result obtained with selected objects in a controlled area cannot be applied to variable production without further evidence. The definition should state excluded conditions.
Task eligibility has commercial value. A versatile platform can spread fixed engineering across several tasks, while every additional task can require data, fixtures, safety assessment, validation and customer integration. The transaction model should price the cost and time to make a new task productive. A catalogue of demonstrations is weaker than a repeatable deployment process.
Accepted output belongs to the customer process. A robot can complete its motion and still create rework, delay or quality loss downstream. The acceptance rubric should include quantity, quality, timing, traceability and safety. Customer sign-off, process data and billing evidence provide stronger support than internal video.
5. Use an autonomy ladder with operational definitions
Autonomy should be described through observable operating states. One possible ladder separates direct teleoperation, supervised autonomy, exception-based assistance and unattended operation within a defined domain. The labels require thresholds for intervention, recovery, task acceptance and safety. A broad claim of autonomy without a defined operating domain has limited transaction value.
Teleoperation can support deployment, data collection and recovery. It also creates labour, latency, connectivity, capacity and jurisdiction dependencies. The economic model should include operator training, coverage, utilisation, supervision, facilities, network and quality control. A remote operator supporting several robots has different economics from one operator assigned to one unit.
Human-in-the-loop research shows that interventions can become training data and improve imitation learning in studied tasks.[14] The transaction team still needs evidence that the target's intervention data is correctly attributed, lawfully usable and effective for its own production tasks. Data volume alone does not show learning.
Progression between autonomy levels should be gated. A release can move to lower supervision after matched-cohort evidence shows acceptable task performance, safety and recovery. Regression triggers should restore supervision. This operating discipline gives the buyer a reproducible basis for valuing future labour reduction.
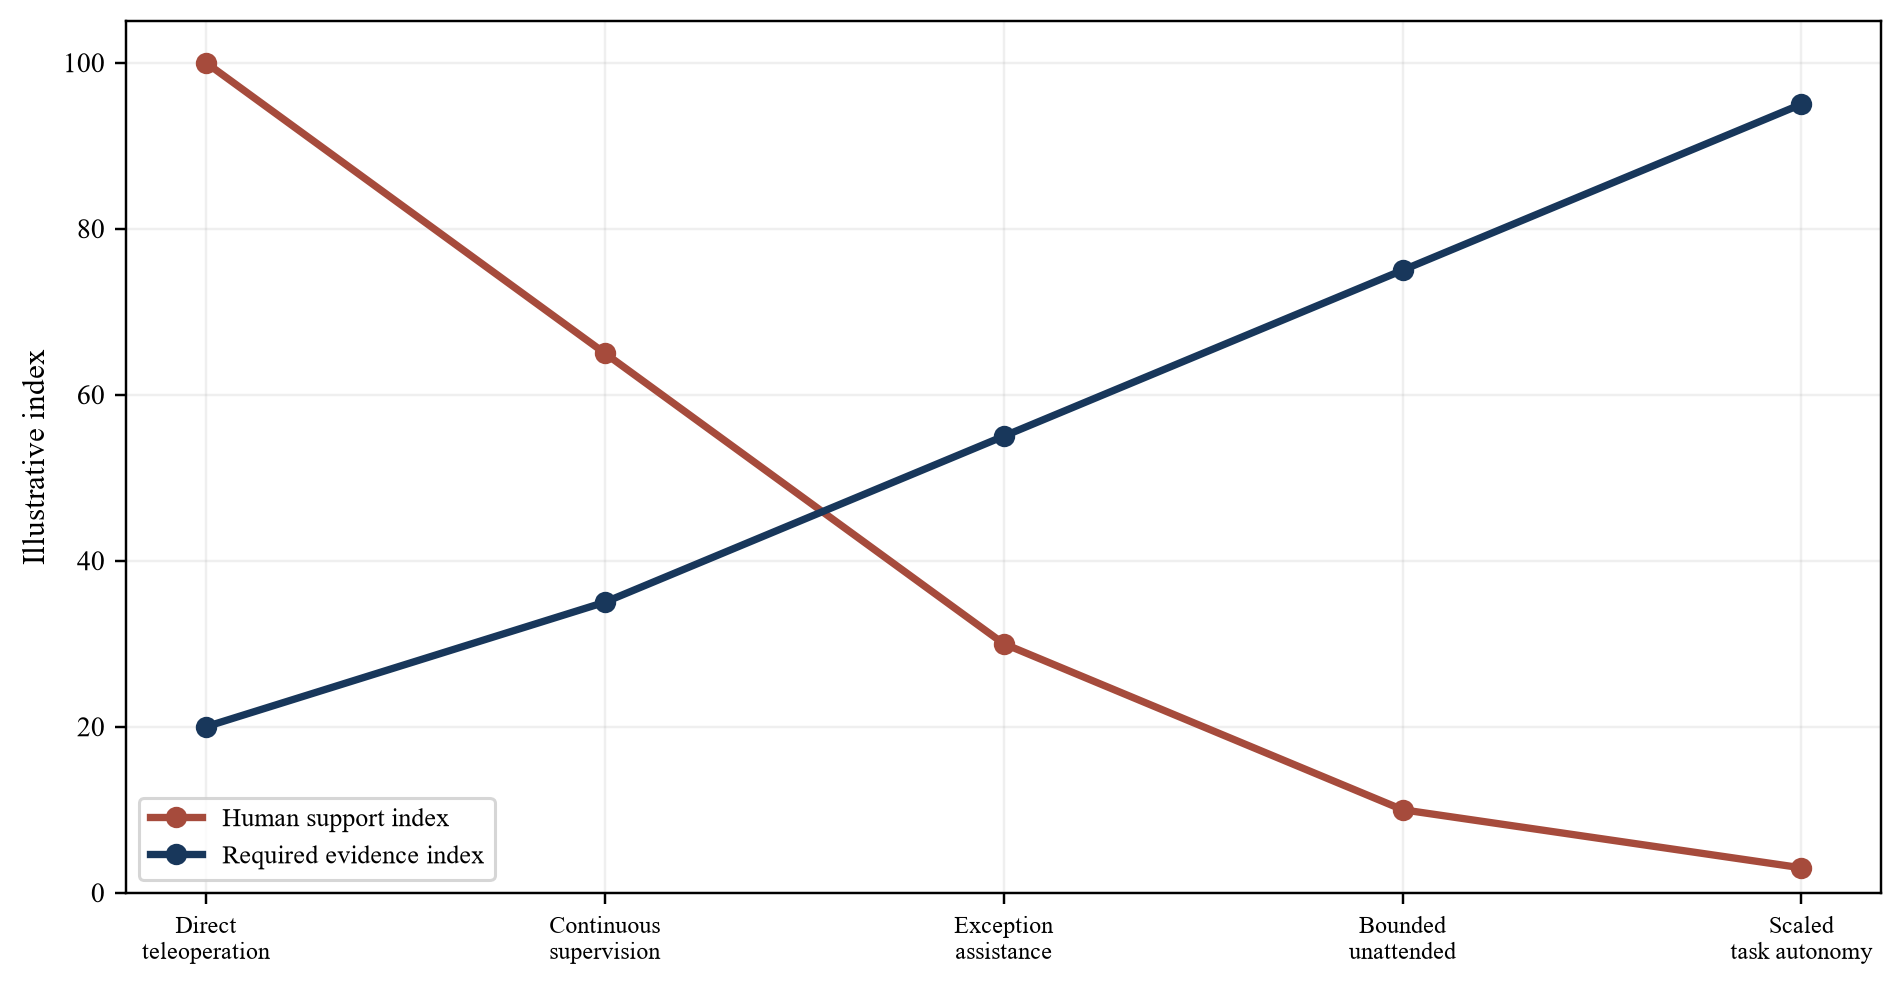
Levels are operating definitions for transaction analysis and do not replace application-specific safety assessment.
6. Measure intervention and recovery
Intervention rate should have a precise numerator and denominator. Events can be counted per productive hour, task, kilometre or another exposure measure. The platform should record who intervened, why, for how long, whether the task resumed and whether the output was accepted. Combining minor assistance with safety-critical intervention hides consequence.
Intervention duration can matter more than count. Ten brief approvals can cost less than one remote recovery that requires diagnosis and on-site work. The model should include direct operator time, queue delay, robot downtime, customer disruption and any rework. Concurrent supervision assumptions need observed evidence on operator load and peak demand.
Recovery capability affects availability. A robot that detects failure and returns to a safe state can reduce loss even when it does not finish the task. A robot that requires physical reset can create site labour and service travel. Recovery evidence should distinguish autonomous retry, remote assistance, trained customer action and specialist repair.
The learning curve should show intervention by cause. Perception, grasp, locomotion, planning, hardware, connectivity, safety and workflow causes require different remedies. A falling aggregate rate can coexist with a persistent high-severity failure. The buyer should fund and value the remediation programme by cause.
7. Convert activity into task productivity
Task productivity combines accepted output, cycle time, availability and human support. Productive task time excludes charging, waiting, maintenance, teleoperation, recovery, software update and unaccepted work. The definition should reflect the commercial contract and customer process.
Comparison with labour requires a complete baseline. Labour cost includes wages, benefits, shift premiums, recruitment, training, supervision, absence and turnover where relevant. It also includes process differences. A robot can operate longer hours and may require slower movement, fixtures, support and safety separation. The comparison should use output at required quality and service.
The customer's bottleneck determines value. Faster robot movement has limited benefit when upstream material or downstream inspection constrains throughput. A flexible humanoid may create value by covering variable tasks or shifts. The site model should quantify incremental accepted output, avoided cost, service resilience and capital required for integration.
Task productivity should be reported by cohort and confidence range. A short pilot can be sensitive to downtime and operator selection. The investment case should distinguish observed performance, funded improvement and management aspiration. Only observed and contractually supported benefits belong in the base case.
| Measure | Definition | Source | Transaction use |
|---|---|---|---|
| Scheduled hours | customer-authorised operating window | site schedule | capacity denominator |
| Productive hours | time performing accepted tasks | event logs and customer record | utilisation |
| Accepted tasks | outputs meeting rubric | process system | revenue and value |
| Intervention time | human assistance and queue time | support system | labour burden |
| Recovery time | autonomous remote and on-site recovery | incident trace | availability |
| Rework | correction caused by robot output | quality system | complete cost |
| Customer benefit | avoided cost or incremental contribution | customer finance evidence | pricing and retention |
Measures require stable task definitions and reconciled customer evidence.
8. Treat safety as an exposure-adjusted operating measure
ISO 10218-1:2025 addresses safety requirements for industrial robots, and ISO 10218-2:2025 covers robot applications and cells.[6][7] Their scope and application need professional assessment. Humanoid deployment can also involve mobile, collaborative, service or public-access conditions that require other standards and regulation. The diligence team should map each application.
OSHA notes that robot incidents often arise during non-routine operations such as programming, maintenance, testing, setup or adjustment.[8][9] A transaction review should therefore examine deployment and service work as well as normal operation. Contractor and customer incidents belong in the exposure record when they relate to the system.
Incident rate should use an exposure denominator and severity. Near misses, protective stops, property damage, first aid, injury and lost time have different consequences. A falling count can reflect less operating exposure. The board should receive absolute events, exposure-adjusted rates, root cause, corrective action and residual risk.
Safety evidence affects revenue, cost and capital. It can determine site acceptance, insurance, warranty, product liability, deployment pace and required redesign. A safety case that depends on fixed barriers or reduced speed can also affect task productivity. The valuation model should preserve this connection.
| Evidence | Denominator | Economic effect | Diligence response |
|---|---|---|---|
| Protective stop | operating exposure | lost productive time | test cause and reset |
| Near miss | relevant task exposure | potential loss and redesign | review trace and controls |
| Contact event | human proximity exposure | liability and site restriction | validate severity and response |
| Hardware failure | component hours | repair and warranty | cohort and supplier analysis |
| Software anomaly | release and task volume | service interruption | reproduce and test rollback |
| Maintenance event | fleet hours | labour and availability | reconcile service records |
| Regulatory or customer finding | sites and audits | deployment delay | close corrective action |
Categories are analytical; legal reporting and standard compliance require qualified advice.
9. Reconstruct hardware cost and manufacturing yield
Bill of materials is the starting point for hardware economics. Complete unit cost also includes inbound logistics, labour, factory overhead, test, scrap, rework, warranty provision, spares, field service, freight and installation. Prototype cost can decline with design changes and volume, while new quality controls and service infrastructure add cost.
The Agility Robotics transaction presentation filed in June 2026 shows company-prepared illustrative bill-of-material trajectories and unit-economics expectations across production scale. The filing states that these values reflect internal estimates and assumptions that may prove inaccurate.[1] Transaction analysis should preserve that status and reconcile each major cost reduction to design, supplier, volume, yield or process evidence.
Manufacturing yield controls whether theoretical bill-of-material improvement becomes delivered cost. First-pass yield, rework hours, scrap, component failure, calibration and final-test escape should be tracked by hardware cohort. A supplier quote does not prove production cost when yield and integration remain unstable.
Capacity should be separated from throughput. A factory can have installed capacity without qualified suppliers, trained labour, working capital, demand or acceptable yield. The valuation model should fund tooling, inventory, deposits, quality systems and ramp losses. It should also value delay when customer milestones depend on delivery.
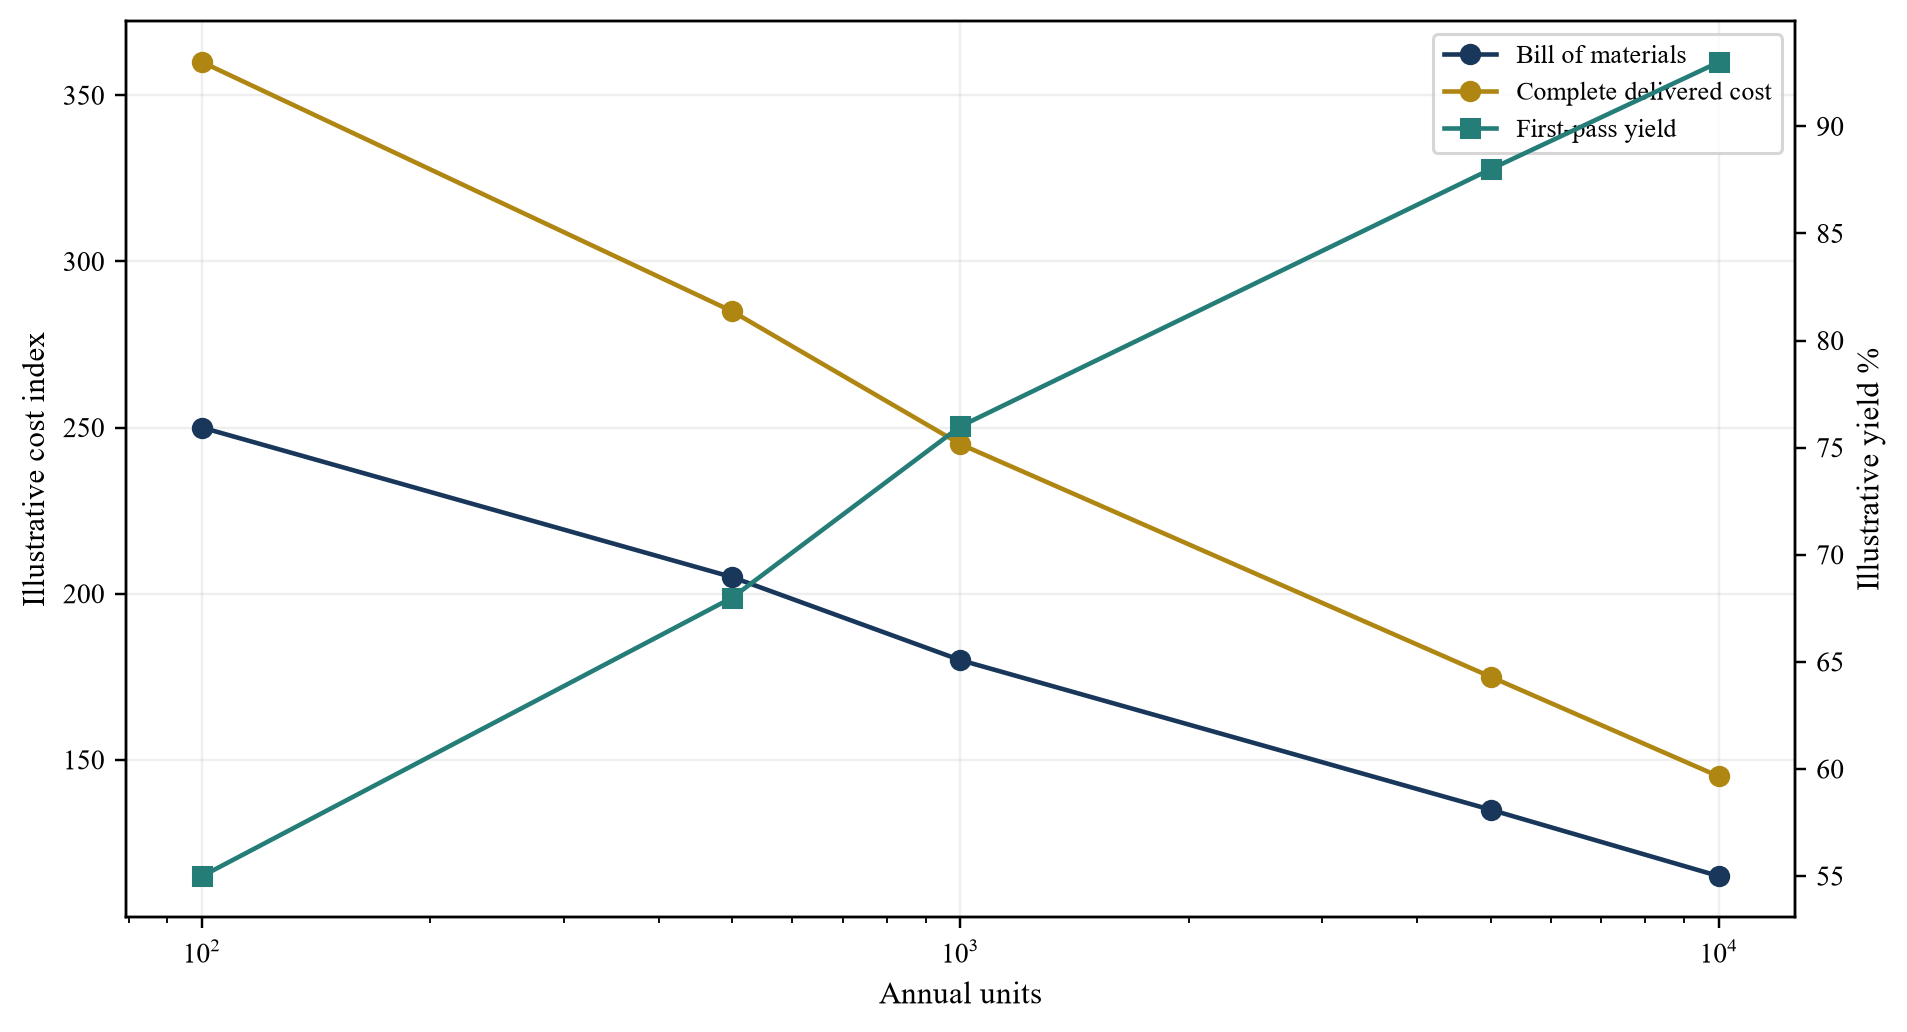
Values are hypothetical management assumptions created to demonstrate the method.
10. Test hardware and software learning separately
Hardware learning can come from design simplification, component negotiation, tooling, labour learning, yield, test automation and service feedback. Software learning can come from data, simulation, model updates, policy improvement and better recovery. The curves interact but should remain separately observable.
A cumulative-volume learning curve needs consistent cost scope. Management should show which costs are included, the production period, cohort and accounting treatment. Design substitutions can create step changes that are not volume learning. Temporary supplier concessions can reduce cost without creating a durable curve.
Software learning requires matched tasks and conditions. Performance improvement after an update can reflect easier site mix, more intervention or narrower acceptance. The target should preserve evaluation sets, production traces, release records and rollback evidence. NIST work on human-robot interaction emphasises repeatable metrics and test methods for real-world teams.[10][11][12]
The transaction model should assign confidence to each curve. Observed production points can support the base case. Signed supplier agreements and validated process changes can support a funded case. Unproven design, autonomy or scale benefits remain scenarios. This separation helps the board price current capability and future execution.
11. Compare sale lease and service economics
Robotics can be sold as hardware, leased, provided through robots-as-a-service or combined with software, integration and maintenance. The commercial form changes revenue recognition, capital, working capital, residual value, service obligations and customer payback. IFRS 15 and other applicable standards require company-specific accounting analysis.[36]
An upfront sale can accelerate cash and exposes the seller to warranty and acceptance. A subscription or service model can align price with operating value and requires the provider to finance hardware and fleet operations. Lease structures add residual-value, funding and utilisation questions. Mixed models need contract-level reconciliation.
Price should connect to customer contribution. Per-hour pricing can reward availability without task quality. Per-task pricing can align output and requires a stable acceptance definition. Shared saving needs an auditable baseline. Fixed subscription can simplify budgeting and transfers demand risk. The contract should also address minimum use, site readiness, intervention, data, safety, damage and termination.
The provider's contribution model includes revenue less depreciation or hardware cost, financing, intervention, cloud and connectivity, field service, spares, warranty, insurance, customer success and credits. Expansion should improve contribution through repeatable deployment and utilisation. Revenue growth that requires proportional engineering or teleoperation labour has a different value.
12. Secure data model and customer rights
Robotics data can include video, audio, location, worker activity, customer processes, object libraries, failures, interventions and maintenance. The target needs a lawful basis and enforceable rights for collection, training, evaluation, support and transfer. Rights can differ by customer, site, geography and purpose.
The data schedule should connect each dataset with origin, consent or contract, retention, access, security, labelling, model use and deletion. Customer data can improve a task without being available for general model training. A transaction does not automatically expand the permitted purpose. Change-of-control and subcontractor terms require review.
Model rights include weights, code, training inputs, evaluation sets, third-party licences and deployment permissions. Open-source components need a complete software bill of materials and licence compliance. Foundation or vision-language-action models can introduce provider terms, regional restrictions and dependency. The buyer should identify which capability can operate after a supplier change.
Data value depends on coverage and causal usefulness. Millions of similar frames can add less value than diverse interventions with accurate outcome labels. The target should show how a dataset changes task performance, recovery or deployment time. A buyer-owned distribution channel should remain a buyer synergy unless the target already has rights and access.
13. Test customer orders and deployment quality
Order announcements can range from non-binding interest to accepted and cash-generating commitments. Diligence should classify memorandum, pilot, purchase order, framework agreement, reservation, conditional order and deployed contract. Each class has different cancellation, milestone, acceptance, price and funding terms.
The Agility Robotics June 2026 materials disclose more than USD 300 million of multi-year orders and describe a commercial model and deployment milestones in company-prepared transaction materials.[1][2] The stated figures require analysis under their contractual definitions and filing qualifications. A buyer should reconcile customer, units, price, milestones, acceptance, termination and cash.
Deployment quality can be measured through time from contract to site readiness, installation, first accepted task, contracted service level and expansion. A large pipeline with long integration can consume capital before revenue. Expansion at an existing site can provide stronger product-market evidence than an unrelated pilot because the customer has observed operating performance.
Concentration matters by customer, integrator, site and use case. A strategic customer can provide data and credibility and can also negotiate price, demand custom work or terminate a material share of revenue. The valuation should test renewal, expansion and contribution under customer-specific terms.
| Commercial stage | Minimum evidence | Cash implication | Valuation treatment |
|---|---|---|---|
| Expression of interest | identified counterparty and scope | none committed | pipeline scenario |
| Pilot agreement | task site term and funding | limited pilot cash | evidence investment |
| Conditional order | units price and conditions | dependent on milestones | probability-weighted scenario |
| Accepted purchase order | enforceable terms and delivery | working-capital requirement | contracted backlog subject to cancellation |
| Deployed subscription | accepted site and billing | recurring collection | cohort retention and contribution |
| Expansion | additional units or tasks after use | repeat deployment cash | stronger commercial evidence |
Legal effect depends on the actual agreement; the table supports diligence classification.
14. Underwrite site integration and support
Site integration can include mapping, network, power, charging, fixtures, tools, safety assessment, workflow redesign, information-system interfaces, worker training and acceptance testing. The cost can be borne by provider, customer or integrator. Contract economics should match actual responsibility.
Repeatability determines scale. The target should record engineering hours, elapsed time, travel, hardware modification, software configuration and customer effort for each site. Improvement across comparable sites supports a deployment learning curve. A standard checklist with continuing bespoke engineering can still be service-intensive.
Support requires response, remote diagnosis, spares, field technicians, depot repair, software release and incident processes. A fleet distributed across regions can require inventory and service density before revenue reaches scale. Service-level commitments can create credits or termination rights. The model should fund the footprint needed for the forecast deployment map.
Partner dependence belongs in the integration schedule. Systems integrators, contract manufacturers, cloud providers, connectivity, component vendors and customer engineering teams can control delivery. The buyer should test capacity, incentives, change-of-control and substitution. A target's gross margin can rely on support supplied temporarily by a strategic partner.
15. Map supply chain and obsolescence
Humanoid platforms combine actuators, motors, drives, sensors, batteries, compute, communications, structural parts and safety components. Some components have long lead times, minimum orders, export restrictions or single-source exposure. The bill of materials should map supplier, country, contract, lead time, alternate qualification and inventory.
Design change can reduce cost and create qualification risk. A new actuator or sensor can alter reliability, control software, safety validation, tooling and spares. The transaction model should include engineering change, test, scrap and field retrofit. Cost saving belongs in the base case only after required validation.
Obsolescence affects prototypes and commercial fleets. Rapid compute and sensor development can improve performance while shortening component availability. Customer service periods can extend beyond a supplier roadmap. The buyer should fund last-time buys, redesign and software maintenance and identify which commitments pass through to customers.
Working capital can become a financing constraint. Deposits, tooling, inventory and contract manufacturing commitments may precede delivery and acceptance. A service model keeps hardware on the provider's balance sheet and can add debt or lease financing needs. Downside demand can strand components that are specific to one design.
16. Construct a hypothetical fleet case
Consider a hypothetical company with 120 humanoid robots across three hardware cohorts and four customer sites. Every value in the case is a management assumption for method demonstration. It is not a forecast, market quotation or representation of a named company.
The oldest cohort contains 20 pilot units, the middle cohort 40 early commercial units and the newest cohort 60 production-intent units. The company records scheduled hours, productive hours, accepted tasks, intervention, safety events, maintenance, revenue and direct cost by robot and site.
| Cohort | Robots | Productive utilisation | Interventions per 100 productive hours | Accepted tasks per productive hour | Complete monthly cost per robot |
|---|---|---|---|---|---|
| Pilot hardware | 20 | 38% | 32 | 5.1 | AED 47,000 |
| Early commercial | 40 | 57% | 17 | 6.4 | AED 35,000 |
| Production intent | 60 | 71% | 8 | 7.2 | AED 27,000 |
All values are illustrative management assumptions.
The latest cohort shows better assumed utilisation, intervention and unit cost. The transaction model does not apply that result to the full forecast automatically. It tests exposure hours, site mix, task consistency, hardware yield, warranty and customer acceptance. It also includes the cost of replacing or upgrading older units.
The company charges an assumed AED 38,000 per deployed robot per month and receives a separate deployment fee. Contribution varies by cohort because intervention, field service, depreciation and warranty differ. Expansion occurs only after a site meets agreed output and safety gates.
The base valuation uses observed latest-cohort performance for deployed and contracted near-term units. A funded case assumes defined improvements after specific engineering and manufacturing milestones. A strategic upside adds new tasks and buyer distribution after separate evidence. This structure keeps current value distinct from execution value.
17. Build the complete unit economics bridge
The unit economics bridge begins with collected customer revenue. It subtracts hardware depreciation or cost, financing, teleoperation and supervision, cloud and connectivity, site support, field service, spares, warranty, insurance, customer success, credits and allocated deployment labour. Corporate research and general administration remain visible below contribution.
Utilisation affects several lines. Higher productive hours can spread hardware and support cost and can raise variable compute, maintenance and energy. A per-task contract adds price and volume sensitivity. A fixed subscription can improve revenue stability and exposes the provider to underperformance. The bridge should show both robot-level and site-level contribution.
Customer value sets the pricing boundary. The buyer should verify the labour, throughput, quality, resilience or safety benefit that supports price. Claimed labour substitution can be reduced by remaining operator, supervision and support needs. A robot can still create value by increasing capacity or covering undesirable shifts without eliminating a role.
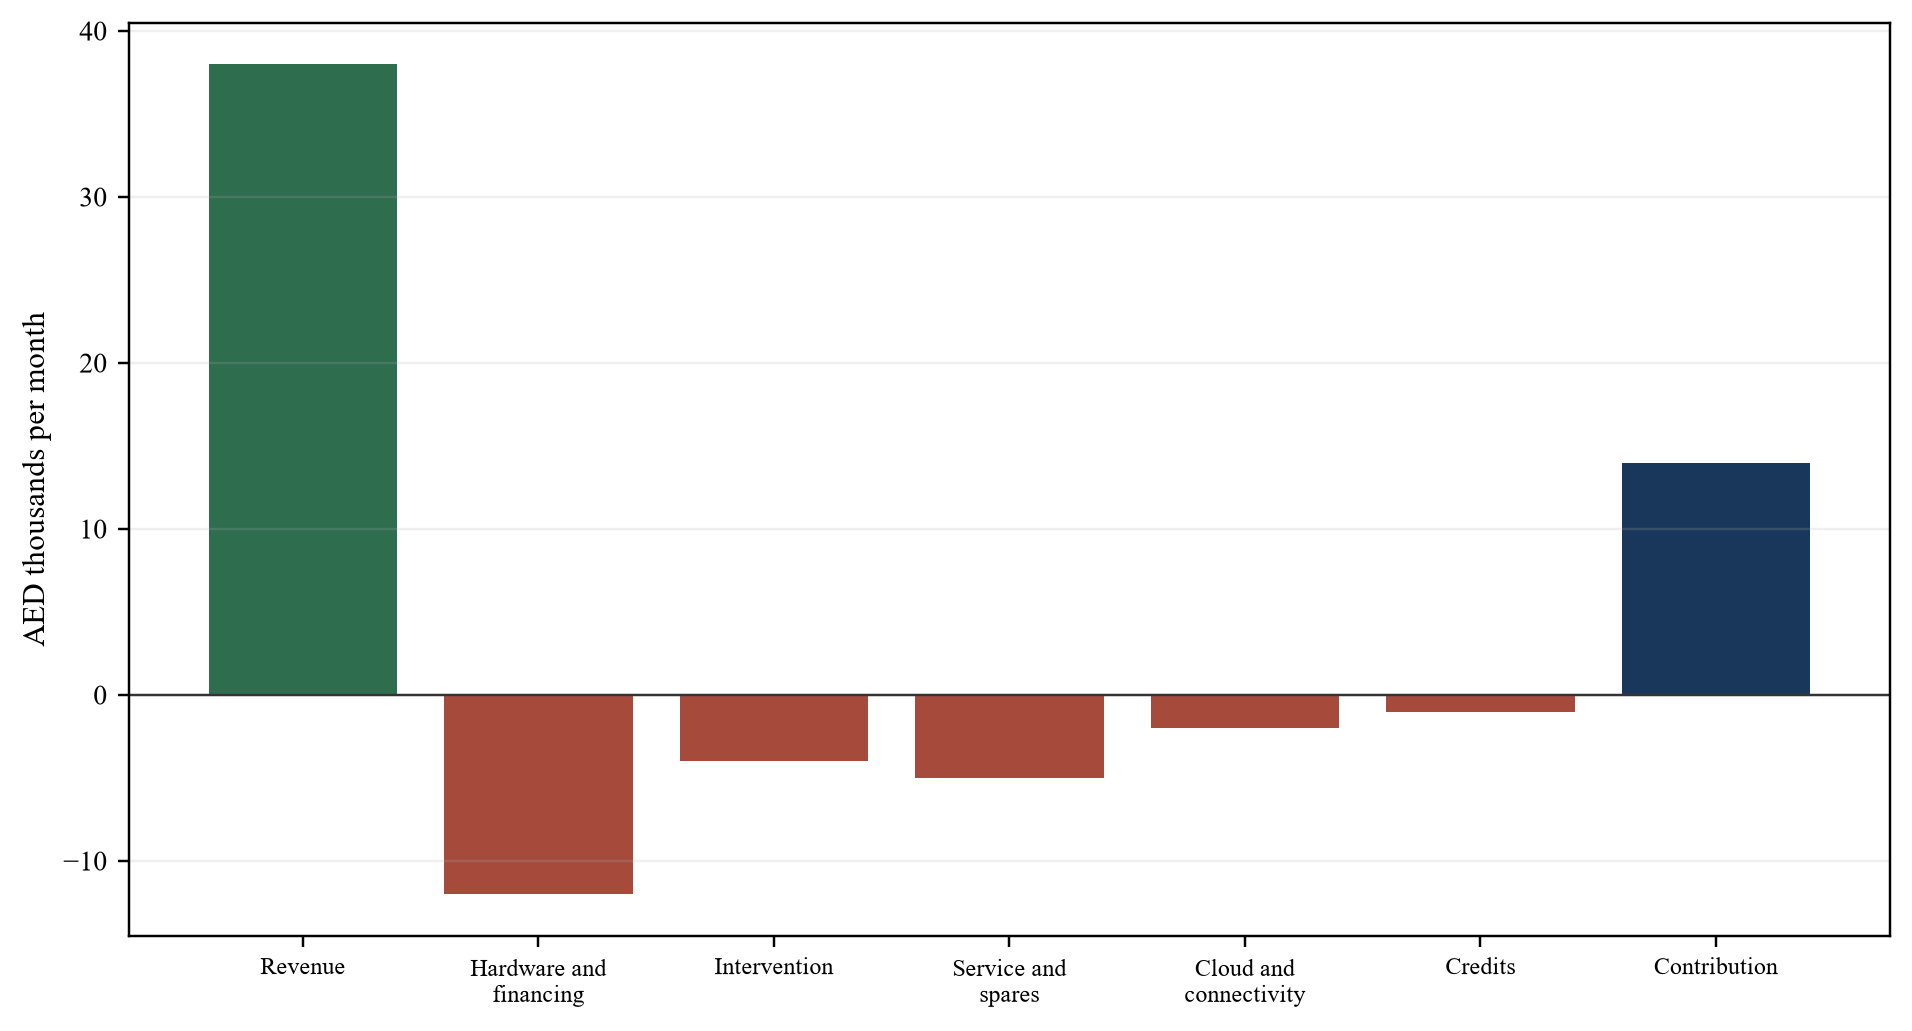
Values are illustrative management assumptions in AED thousands.
The hypothetical latest cohort generates AED 14,000 monthly contribution per robot before central costs, tax and growth capital. The pilot cohort remains negative. Consolidated contribution therefore depends on fleet mix, upgrade cost and the pace at which new cohorts replace early units. A valuation based only on latest-cohort economics can overstate near-term cash.
Cash requires a second bridge. Customer deposits, delivery milestones, acceptance, receivables, component deposits, inventory and capital expenditure can create a funding gap even when unit contribution is positive. The transaction plan should identify committed liquidity and downside covenants.
18. Stress the learning curves
The downside should combine hardware, autonomy, safety, demand and financing rather than stress each independently. Lower yield can delay delivery and increase cost. Delayed delivery can reduce customer confidence and collections. Low utilisation can increase intervention burden and weaken the customer's business case. A safety event can slow deployment and require redesign.
The model should include recovery time. Hardware redesign, supplier qualification, software validation, site re-acceptance and customer consent can take different periods. Dual operation and field retrofits consume cash. Insurance and regulatory effects require professional assessment.
| Scenario | Productive utilisation | Monthly contribution per latest-cohort robot | Additional funding | Transaction response |
|---|---|---|---|---|
| Base case | 71% | AED 14k | AED 0m | proceed with staged capital |
| Intervention stalls | 61% | AED 7k | AED 12m | retain supervision and reprice |
| Yield ramp delay | 66% | AED 5k | AED 28m | defer capacity and milestone payment |
| Customer conversion delay | 52% | negative AED 2k | AED 34m | reduce production and preserve cash |
| Combined safety and ramp event | 35% | negative AED 18k | AED 61m | invoke stop and funded remediation |
All values and probabilities are illustrative management assumptions.
Reverse stress testing identifies the conditions that exhaust liquidity, breach a covenant or destroy the acquisition thesis. The board can monitor productive utilisation, intervention hours, first-pass yield, warranty, accepted backlog, collections and safety exposure. Thresholds should be defined before closing.
Scenario weights are management assumptions. The base case should rely on observed cohorts and enforceable contracts. Improvements supported by funded work can sit in an execution case. New markets, general-purpose autonomy and uncontracted customer demand belong in strategic upside until evidence supports a different treatment.
19. Value the platform before mature scale
Income valuation should use probability-weighted cash from contracted and supportable fleet deployment. The model should include development, manufacturing, working capital, fleet financing, integration, service and remediation. Terminal assumptions require a mature cohort with evidence on replacement, price, contribution and customer retention.
Market comparisons require adjustment for business model, deployment maturity, capital intensity, recurring revenue, customer concentration, rights and safety. A software multiple applied to consolidated revenue can overstate value when hardware and services consume substantial capital. An industrial multiple can understate valuable autonomy, data or recurring software where rights and retention are strong.
Replacement cost can inform engineering, tooling, data and team value and may not capture customer access or time. Option value can arise from an adaptable embodiment, task data, manufacturing capability or strategic distribution. The probability, capital and time required to exercise each option should be explicit.
IFRS 3, IFRS 13, IAS 36 and IAS 38 address business combinations, fair value, impairment and intangible assets.[32][33][34][35] Applicable accounting analysis depends on the facts and qualified advice. The transaction model should provide cash and economic views alongside financial-reporting treatment.
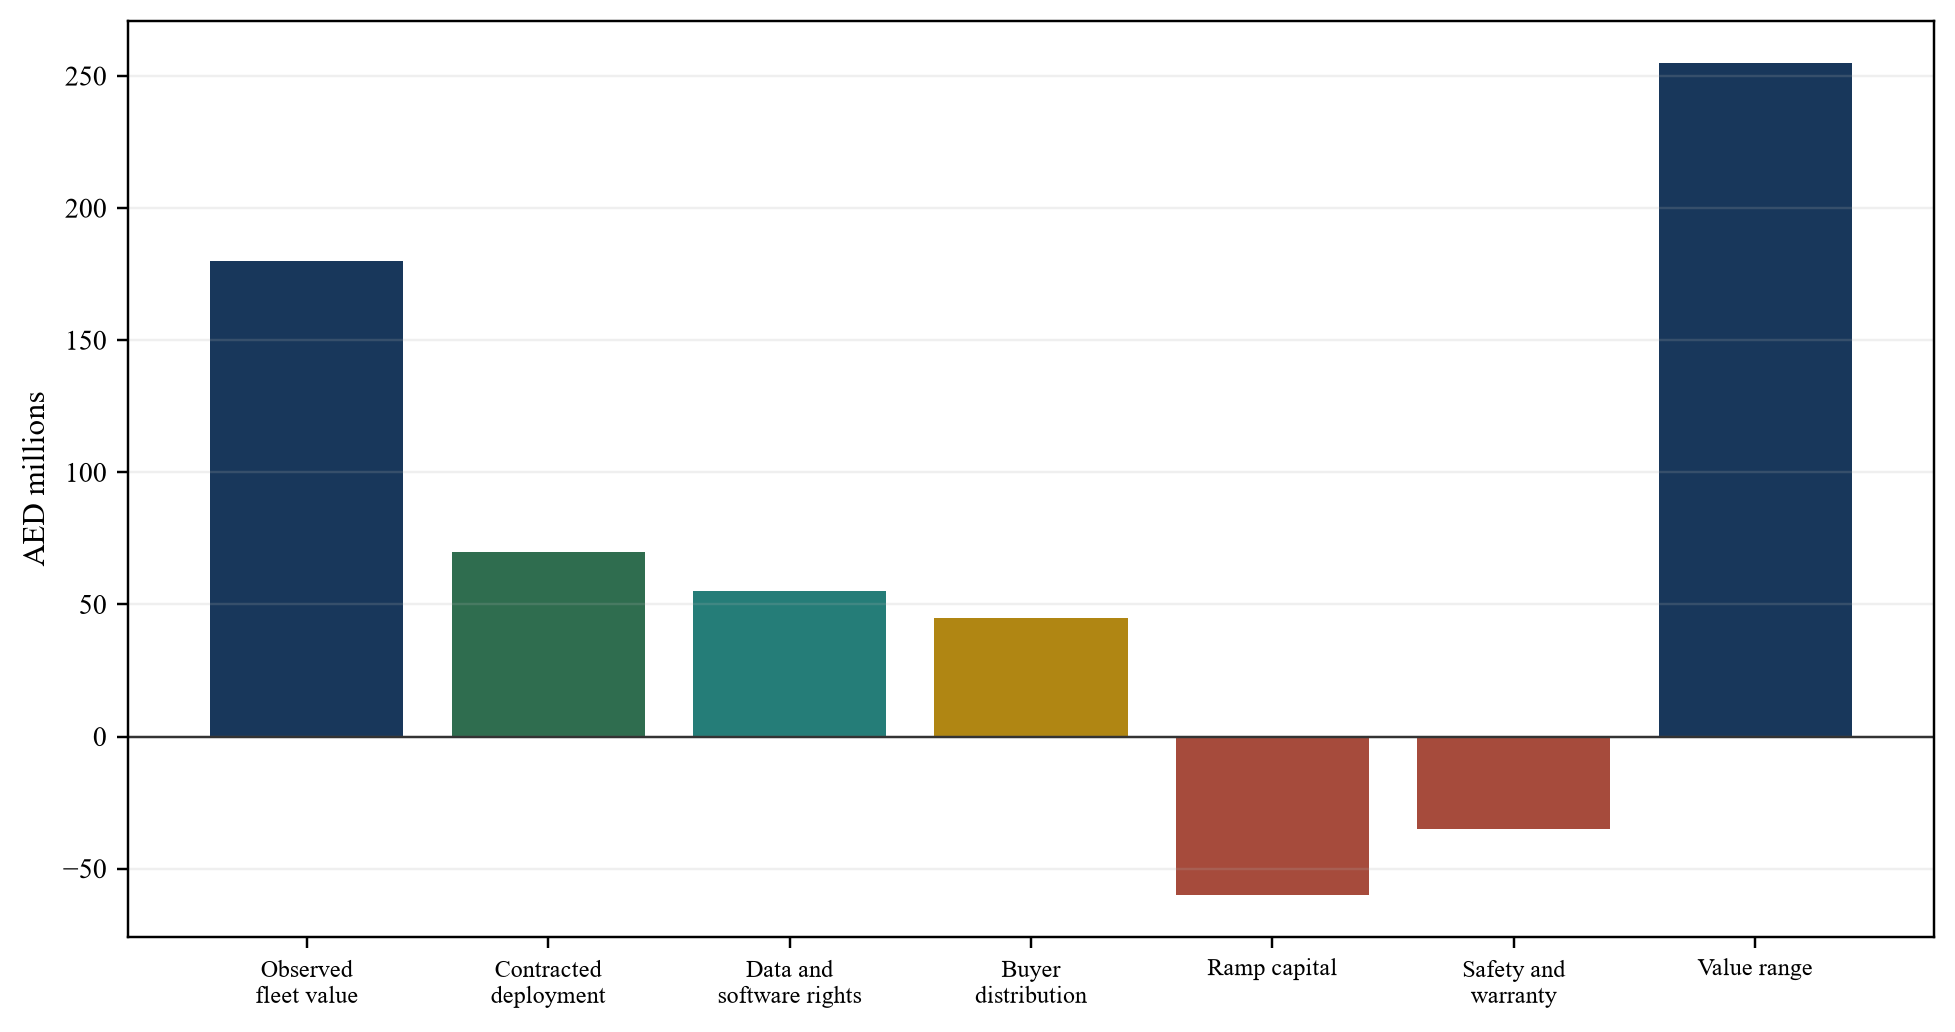
Values are hypothetical management assumptions in AED millions.
Buyer synergies should remain separate. Distribution requires eligible customers, sales capacity, integration and retention. Manufacturing synergy requires compatible processes and qualified suppliers. Data synergy requires lawful rights and useful coverage. Paying the seller for buyer-owned assets transfers value without reducing execution risk.
20. Define the M and A rationale and counterfactual
An acquisition can be rational when it secures a scarce platform, team, data right, safety case, customer position or time advantage that the buyer cannot obtain economically through build or partnership. The board should name the asset and quantify the delay avoided. A broad ambition to enter robotics is an insufficient transaction thesis.
The counterfactual should include partnership and minority investment. A commercial agreement can provide deployment evidence before acquisition. A minority stake can secure information or rights and can also complicate a later sale. A staged acquisition can link control to milestones. Internal build should include recruiting, prototypes, data, validation, manufacturing and lost market time.
Competition authorities examine actual market structure, customers, technology, ecosystems and potential foreclosure under current merger frameworks.[38][39][40][41] Robotics transactions can also involve export, national-security or foreign-investment review depending on technology, parties and jurisdictions. Qualified counsel should map the filing and remedy path.
Integration design should follow the value asset. Research teams may need autonomy and retention. Manufacturing may need rapid quality and supply-chain integration. Customer deployments need continuity and clear support authority. Data and model integration need purpose, access and security controls. The value plan should preserve the capability being purchased.
21. Build a reproducible diligence room
The diligence room should allow a reviewer to select a robot cohort, task and site; reproduce performance; trace interventions and incidents; reconcile hardware and service cost; inspect rights; and connect accepted output to billing and collection. A management demonstration is a starting point rather than completion evidence.
Core records include serial-number configuration, software release, task definitions, operating logs, video where lawfully available, intervention traces, safety and maintenance registers, bill of materials, supplier contracts, yield, warranty, customer agreements, acceptance, invoices and cash. The same cohort identifiers should connect technical and financial schedules.
Sampling should cover difficult sites, low-performing units, non-routine work, adverse conditions and customer complaints. Excluding failed pilots or retired hardware can overstate learning. The buyer should preserve the denominator and explain exclusions. Independent reproduction provides stronger evidence where practical.
| Workstream | Minimum evidence | Decision output |
|---|---|---|
| Fleet | serial cohort site hours and configuration | maturity and exposure |
| Tasks | definition acceptance and customer process | eligible revenue scope |
| Autonomy | intervention recovery and release records | human-support curve |
| Safety | assessment incidents and corrective action | deployment constraint |
| Manufacturing | bill of materials yield rework and warranty | delivered-cost curve |
| Commercial | contract milestone acceptance and collection | backlog quality |
| Rights | hardware software data model and customer terms | control and transfer |
| Finance | contribution working capital and funding | price and liquidity |
The checklist requires transaction-specific technical, legal, safety and financial adaptation.
Red flags include undocumented cohort changes, manual assistance excluded from autonomy, safety events without exposure data, bill-of-material claims without yield, order value without cancellation terms, customer benefits without process evidence, data without training rights, supplier commitments beyond demand and fleet growth without funded service capacity. Each issue needs remediation, price, term or decline treatment.
22. Allocate uncertainty through terms and execution
Purchase price can combine cash, shares, escrow, holdback and contingent consideration. Milestones can use accepted deployments, fleet hours, task performance, intervention, yield, safety closure, contracted contribution or cash collection. Metrics should be auditable and resistant to actions that inflate volume while reducing quality or margin.
Representations can address intellectual property, data, software, hardware specifications, safety records, customers, suppliers and financial information. Specific indemnities may address identified exposures. Warranty and indemnity insurance changes recourse and does not replace technical evidence. Qualified advisers should tailor the structure.
The first 180 days should protect service and create one evidence system. Days 1 to 30 establish fleet, task, safety, rights, cost and contract baselines. Days 31 to 90 reproduce priority tasks, reconcile contribution, close critical controls and test supplier capacity. Days 91 to 180 scale only cohorts and sites that pass defined gates.
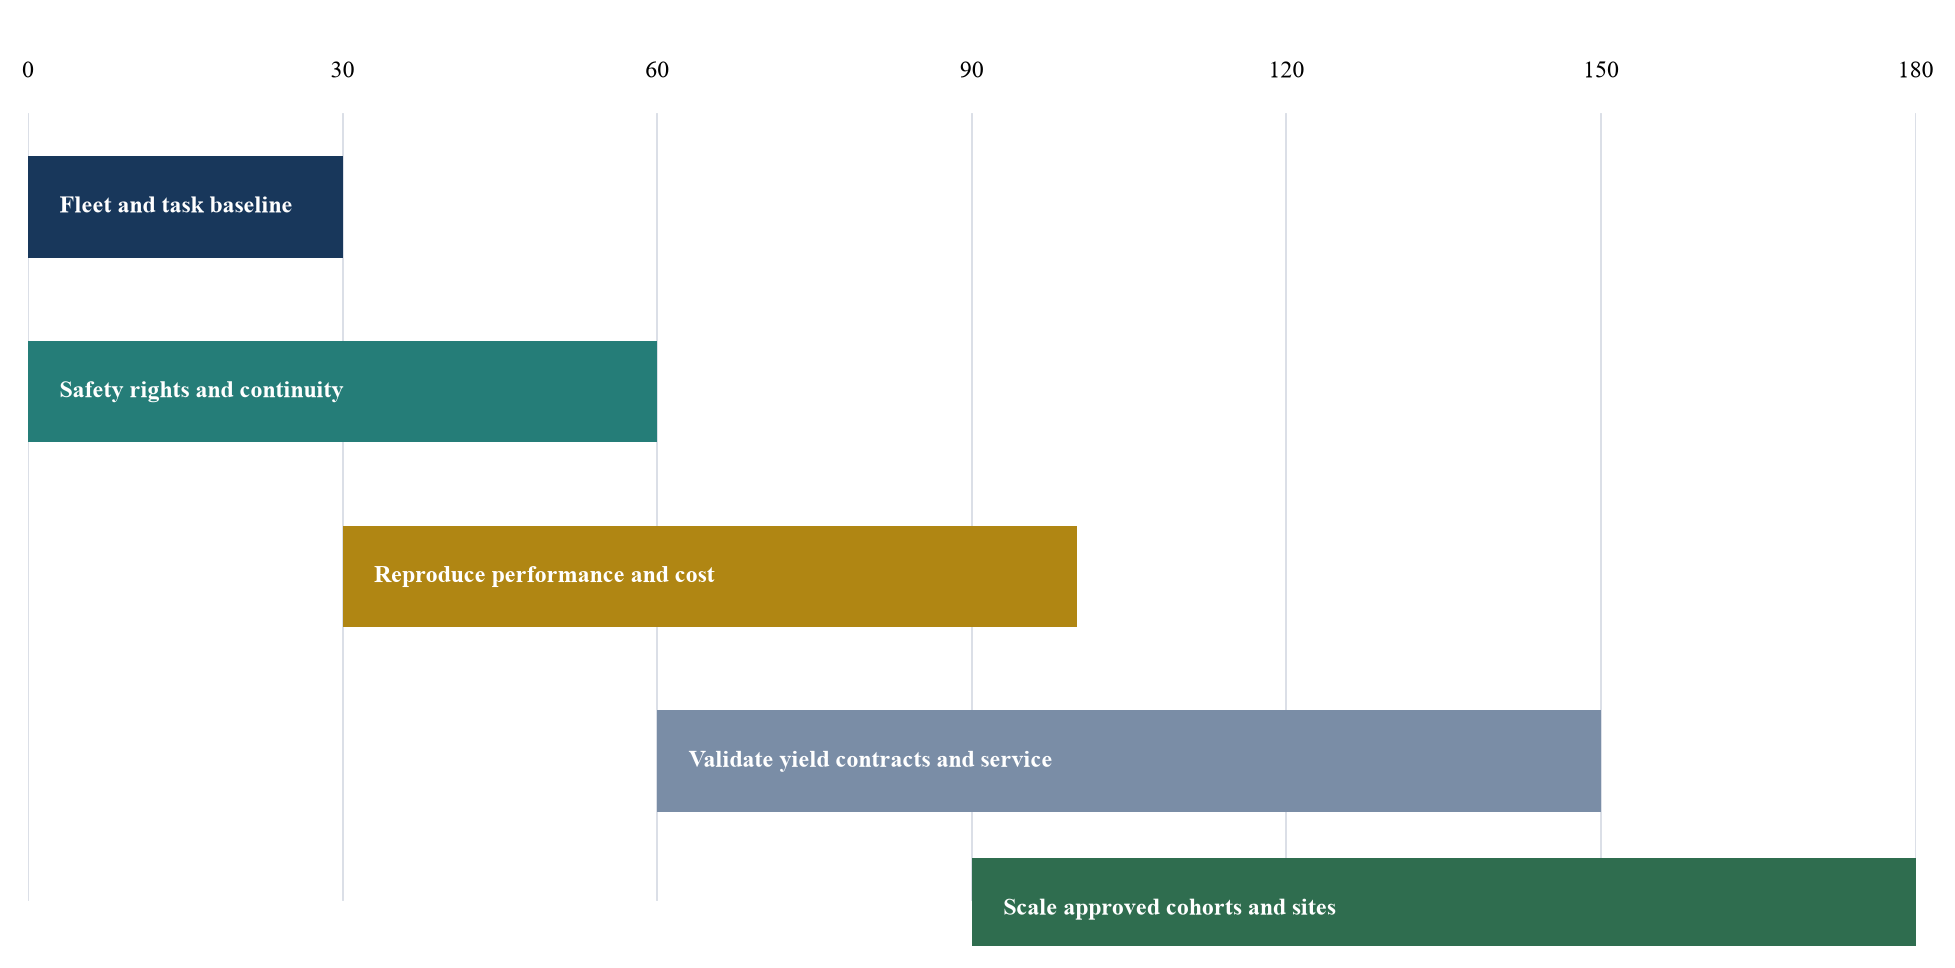
The sequence is a general implementation framework.
The integration team should report productive utilisation, accepted tasks, intervention, recovery, safety exposure, yield, delivered cost, warranty, order conversion, collections and liquidity. Measures remain connected to cohort and customer. The board releases capital against verified progress and retains a stop condition.
The decision memorandum should state excluded value. General-purpose autonomy, unvalidated tasks, unsigned demand, buyer-owned synergies and unfunded cost reductions remain outside the base case. A clear decline condition can include untransferable rights, unacceptable safety evidence, intervention economics that do not improve, unfundable working capital or customer contracts that do not support the forecast.
Conclusion
Humanoid robotics M&A requires a valuation method that works before mature scale. The method begins with a defined customer task and follows the evidence through embodiment, autonomy, site integration, accepted output, contribution and cash. Each link can fail independently, and a strong demonstration does not prove the complete chain.
Fleet cohorts provide the foundation. Hardware version, software release, site, task, exposure and commercial status should remain identifiable. Blended averages can hide prototypes, favourable pilots and low-performing units. Matched cohorts allow a buyer to test whether improvement comes from engineering learning or easier operating mix.
Intervention is an economic input and a learning signal. Event count, duration, cause, operator load, queue time and recovery determine the human-support curve. Teleoperation can accelerate deployment and data collection. It also creates labour, connectivity and capacity dependencies that belong in complete unit cost.
Task productivity connects robotics performance to customer value. Productive hours exclude waiting, charging, maintenance, remote assistance, recovery and rejected output. The customer process determines acceptance. Throughput, quality, service and safety should be measured together because improving one can constrain another.
Safety needs exposure-adjusted evidence across routine and non-routine work. Standards and regulator guidance support the assessment, while application responsibility remains specific. Incidents, near misses, protective stops and maintenance events affect deployment pace, insurance, warranty, product liability, customer acceptance and the speed at which revenue can scale.
Hardware learning requires more than a declining bill of materials. Yield, rework, test, warranty, field service, logistics and installation determine delivered cost. Capacity needs qualified suppliers, labour, tooling, working capital, demand and quality. A production target without these resources is an operating aspiration.
Software learning should be reproducible by task and cohort. Release records, evaluation sets, intervention traces and rollback provide the audit trail. Data has value when rights are secure and when the data improves performance, recovery or deployment. Volume without coverage and attribution can create a weak asset.
Commercial evidence has a hierarchy. Interest, pilots, conditional orders, accepted purchase orders, deployed subscriptions and expansions have different cash and cancellation properties. The transaction model should reconcile stated order value to enforceable terms, milestones, delivery, acceptance and collection.
Valuation should separate observed fleet value, funded execution and strategic upside. The base case uses verified cohorts and supportable contracts. The execution case prices defined engineering and manufacturing milestones. Strategic options retain explicit probability, capital and time. Buyer distribution and manufacturing assets remain separately evidenced synergies.
Deal terms can allocate residual uncertainty. Contingent consideration, holdbacks, retention, warranties and staged capital can link payment to accepted deployments, contribution, yield, safety closure and cash. Metrics should preserve quality and avoid rewarding units or hours that do not create customer value.
The board can then decide which uncertainty to own. A buyer with manufacturing, distribution and integration capability may rationally acquire an earlier platform. A financial investor may require stronger contracted contribution and a funded ramp. A strategic partner may validate the task and rights before committing capital. Each route uses the same evidence chain.
The practical objective is a fleet that learns faster than it consumes capital. That result appears in improving task acceptance, falling intervention, controlled safety exposure, rising yield, lower delivered cost, repeat deployment, customer expansion and collected contribution. When those measures reconcile, a robotics learning curve becomes an investable operating asset.
Sources
- United States Securities and Exchange Commission, Agility Robotics Investor Presentation, June 2026, Read the primary source
- United States Securities and Exchange Commission, Agility Robotics and Churchill Capital Corp XI Joint Press Release, 24 June 2026, Read the primary source
- United States Securities and Exchange Commission, Tesla Inc Annual Report for 2025, Read the primary source
- United States Securities and Exchange Commission, Serve Robotics Inc Annual Report for 2025, Read the primary source
- International Federation of Robotics, World Robotics 2025, Read the primary source
- International Organization for Standardization, ISO 10218-1:2025 Robotics Safety Requirements for Industrial Robots, Read the primary source
- International Organization for Standardization, ISO 10218-2:2025 Robotics Safety Requirements for Industrial Robot Applications and Robot Cells, Read the primary source
- United States Occupational Safety and Health Administration, Robotics Overview, Read the primary source
- United States Occupational Safety and Health Administration, Industrial Robot Systems and Industrial Robot System Safety, Read the primary source
- National Institute of Standards and Technology, Performance of Human Robot Interaction, Read the primary source
- National Institute of Standards and Technology, Test Methods and Metrics for Effective Human Robot Interaction, Read the primary source
- National Institute of Standards and Technology, Performance Evaluation of Human Detection Systems for Robot Safety, Read the primary source
- National Institute of Standards and Technology, Theory and Evaluation of Human Robot Interactions, Read the primary source
- Mandlekar et al, Human in the Loop Imitation Learning Using Remote Teleoperation, Read the primary source
- He et al, Learning Human to Humanoid Real Time Whole Body Teleoperation, Read the primary source
- Penco et al, Teleoperation of Humanoid Robots A Survey, Read the primary source
- Open X Embodiment Collaboration, Open X Embodiment Robotic Learning Datasets and RT X Models, Read the primary source
- Google DeepMind, RT 2 New Model Translates Vision and Language into Action, Read the primary source
- Octo Model Team, Octo An Open Source Generalist Robot Policy, Read the primary source
- NVIDIA, Project GR00T for Humanoid Robots, Read the primary source
- Google DeepMind, Robotics, Read the primary source
- Boston Dynamics, Ethics Principles, Read the primary source
- European Union, Regulation 2023/1230 on Machinery, Read the primary source
- European Commission, AI Act Regulatory Framework, Read the primary source
- National Institute of Standards and Technology, AI Risk Management Framework, Read the primary source
- National Institute of Standards and Technology, Generative AI Profile, Read the primary source
- National Institute of Standards and Technology, Cybersecurity Framework 2.0, Read the primary source
- International Organization for Standardization, ISO 13849-1 Safety Related Parts of Control Systems, Read the primary source
- International Organization for Standardization, ISO 12100 Safety of Machinery Risk Assessment and Risk Reduction, Read the primary source
- International Organization for Standardization, ISO TS 15066 Collaborative Robots, Read the primary source
- International Organization for Standardization, ISO 13482 Personal Care Robot Safety, Read the primary source
- IFRS Foundation, IFRS 3 Business Combinations, Read the primary source
- IFRS Foundation, IFRS 13 Fair Value Measurement, Read the primary source
- IFRS Foundation, IAS 36 Impairment of Assets, Read the primary source
- IFRS Foundation, IAS 38 Intangible Assets, Read the primary source
- IFRS Foundation, IFRS 15 Revenue from Contracts with Customers, Read the primary source
- International Valuation Standards Council, International Valuation Standards, Read the primary source
- United States Department of Justice and Federal Trade Commission, Merger Guidelines, Read the primary source
- European Commission, Merger Control, Read the primary source
- United Kingdom Competition and Markets Authority, Merger Assessment Guidelines, Read the primary source
- United States Federal Trade Commission, Premerger Notification Program, Read the primary source
- United States Securities and Exchange Commission, Cybersecurity Risk Management Strategy Governance and Incident Disclosure, Read the primary source
- Organisation for Economic Co-operation and Development, Due Diligence Guidance for Responsible Business Conduct, Read the primary source
- Organisation for Economic Co-operation and Development, AI Principles, Read the primary source
- International Electrotechnical Commission, IEC 61508 Functional Safety, Read the primary source
- UL Standards and Engagement, UL 1740 Robots and Robotic Equipment, Read the primary source
- International Federation of Robotics, World Robotics Service Robots 2025, Read the primary source
- United States Securities and Exchange Commission, Agility Robotics Transaction Filing, Read the primary source
- United States Securities and Exchange Commission, Apptronik and Dexmate Disclosure, Read the primary source
- National Institute for Occupational Safety and Health, Robotics Research, Read the primary source
