

Introduction
SAR can collect imagery day or night and through cloud, creating advantages for maritime surveillance, defence, infrastructure monitoring, disaster response, insurance, energy and natural-resource applications. Those advantages do not remove capacity constraints. A satellite still has finite power, duty cycle, geometry, downlink, processing and operational availability. Multiple customers can request the same window, and a high-priority mission can displace lower-priority work.
The valuation question is therefore operational: how reliably can the company turn a dated customer request into an accepted product before the decision window closes? Revisit describes potential access. Tasking economics describe the allocation, completion, latency, price and cost of serving the request. Sustainable value requires both.
This paper treats monitoring subscriptions, tasking orders, priority options, analytics and strategic combination benefits as separate cash ledgers. It reconstructs capacity from passes to accepted delivery, assigns costs to each service tier and funds replenishment before admitting terminal value.
1. Define the transaction decision
The analysis begins with the acquisition objective, valuation date, perimeter, decision users and intended operating model. SAR economics move through a chain from orbital opportunity to accepted customer outcome. The model should identify the capacity unit, time window, priority, quality threshold, customer use, price and cost for each material service. This permits the transaction team to distinguish potential access from cash-producing delivery.
The evidence set comprises board mandate, process materials, target structure, financial statements and product architecture. Records should be dated and reconciled by satellite, request, target, pass, product, contract and payment. Missing support remains a visible diligence gap. Valuation converts the verified record into the value attributable to owned sensors, contracted capacity, software and customer relationships. The board should approve one decision and evidence cut-off before modelling value, with every adjustment linked to one ledger and accountable owner. A control schedule should preserve source, calculation, reviewer, exception, decision and release evidence so that operating claims can be reproduced during diligence and after closing.
2. Map the SAR operating system
Decision usefulness requires a trace from spacecraft, radar payload, orbit, spectrum, ground stations, tasking software, downlink, processing, analytics, security and customer interfaces to a completed collection, delivered product, customer decision and cash. The trace should expose conflicts, overrides, failures, latency and quality exceptions. It should also show whether another sensor, public mission or customer process can substitute for the service.
Diligence should obtain asset registers, network diagrams, licences, software inventories and supplier agreements. The team should test completeness, technical fitness, contractual enforceability and commercial use. The financial model then measures the legal and technical dependencies behind each service. Decision makers should reconcile ownership with operational control and third-party reliance; the assumption register should prevent revisit, priority, analytics and customer retention from counting the same benefit more than once. The review file should reconcile exceptions to price, conditions, financing, integration milestones and post-close monitoring rather than bury them inside a blended valuation multiple.
3. Separate the cash ledgers
The control question concerns monitoring subscriptions, on-demand scenes, priority reservations, sovereign capacity, analytics and professional services. It should be answered through timestamped operating and customer evidence. Design revisit, constellation size, headline backlog and demonstration imagery can hide geometric limits, priority displacement, downlink constraints, rejected products and customers that do not depend on the service in production.
Required support includes contract schedules, invoices, collections, product entitlements, usage and serving cost. Exceptions, failed collections, missing rights and deteriorating performance deserve separate review. The model uses the evidence to calculate contribution and duration by product and customer cohort. The investment committee should keep service cash separate until combination benefits are verified, retaining deductions for replacement, performance, concentration, regulation and integration. Each deduction should have an owner, release test, funding source and review date, allowing value to increase only when the underlying evidence has improved.
4. Define the unit of capacity
The analysis begins with passes, access windows, imaging seconds, square kilometres, scenes, looks, downlink and accepted products. SAR economics move through a chain from orbital opportunity to accepted customer outcome. The model should identify the capacity unit, time window, priority, quality threshold, customer use, price and cost for each material service. This permits the transaction team to distinguish potential access from cash-producing delivery.
The evidence set comprises mission plans, telemetry, product catalogues and customer acceptance records. Records should be dated and reconciled by satellite, request, target, pass, product, contract and payment. Missing support remains a visible diligence gap. Valuation converts the verified record into one auditable capacity unit for planning and valuation. The board should avoid mixing theoretical opportunities with delivered products, with every adjustment linked to one ledger and accountable owner. A control schedule should preserve source, calculation, reviewer, exception, decision and release evidence so that operating claims can be reproduced during diligence and after closing.
5. Reconstruct gross access
Decision usefulness requires a trace from orbit geometry, field of regard, incidence angle, look direction, swath, resolution and target geography to a completed collection, delivered product, customer decision and cash. The trace should expose conflicts, overrides, failures, latency and quality exceptions. It should also show whether another sensor, public mission or customer process can substitute for the service.
Diligence should obtain ephemeris, mission-planning outputs, mode definitions and target history. The team should test completeness, technical fitness, contractual enforceability and commercial use. The financial model then measures gross opportunities by target, time window and imaging mode. Decision makers should use target-specific geometry rather than a global revisit slogan; the assumption register should prevent revisit, priority, analytics and customer retention from counting the same benefit more than once. The review file should reconcile exceptions to price, conditions, financing, integration milestones and post-close monitoring rather than bury them inside a blended valuation multiple.
6. Convert access into usable collection
The control question concerns sensor availability, duty cycle, power, thermal limits, calibration, manoeuvre time and operating constraints. It should be answered through timestamped operating and customer evidence. Design revisit, constellation size, headline backlog and demonstration imagery can hide geometric limits, priority displacement, downlink constraints, rejected products and customers that do not depend on the service in production.
Required support includes telemetry, anomaly logs, engineering limits and completed acquisitions. Exceptions, failed collections, missing rights and deteriorating performance deserve separate review. The model uses the evidence to calculate usable collection opportunities after physical constraints. The investment committee should reconcile design capability with achieved operations, retaining deductions for replacement, performance, concentration, regulation and integration. Each deduction should have an owner, release test, funding source and review date, allowing value to increase only when the underlying evidence has improved.
7. Measure achieved revisit
The analysis begins with elapsed time between accepted observations for each geography and service tier. SAR economics move through a chain from orbital opportunity to accepted customer outcome. The model should identify the capacity unit, time window, priority, quality threshold, customer use, price and cost for each material service. This permits the transaction team to distinguish potential access from cash-producing delivery.
The evidence set comprises request logs, collection timestamps, delivered products and exceptions. Records should be dated and reconciled by satellite, request, target, pass, product, contract and payment. Missing support remains a visible diligence gap. Valuation converts the verified record into observed revisit distributions and tail risk. The board should price the service level achieved for the customer, with every adjustment linked to one ledger and accountable owner. A control schedule should preserve source, calculation, reviewer, exception, decision and release evidence so that operating claims can be reproduced during diligence and after closing.
8. Model request-to-delivery latency
Decision usefulness requires a trace from request intake, validation, scheduling, collection, downlink, processing, quality control and delivery to a completed collection, delivered product, customer decision and cash. The trace should expose conflicts, overrides, failures, latency and quality exceptions. It should also show whether another sensor, public mission or customer process can substitute for the service.
Diligence should obtain timestamped workflow events, queue records, ground-station logs and service reports. The team should test completeness, technical fitness, contractual enforceability and commercial use. The financial model then measures median, percentile and breach latency by use case. Decision makers should value time-sensitive products through the full chain; the assumption register should prevent revisit, priority, analytics and customer retention from counting the same benefit more than once. The review file should reconcile exceptions to price, conditions, financing, integration milestones and post-close monitoring rather than bury them inside a blended valuation multiple.
9. Test collection probability
The control question concerns the probability that a request is collected within its decision window and quality specification. It should be answered through timestamped operating and customer evidence. Design revisit, constellation size, headline backlog and demonstration imagery can hide geometric limits, priority displacement, downlink constraints, rejected products and customers that do not depend on the service in production.
Required support includes requests, cancellations, conflicts, failures, reschedules and accepted deliveries. Exceptions, failed collections, missing rights and deteriorating performance deserve separate review. The model uses the evidence to calculate completion probability by tier, geography and lead time. The investment committee should distinguish marketed availability from fulfilled demand, retaining deductions for replacement, performance, concentration, regulation and integration. Each deduction should have an owner, release test, funding source and review date, allowing value to increase only when the underlying evidence has improved.
10. Reconstruct the priority stack
The analysis begins with sovereign rights, emergency overrides, subscription commitments, paid priority, spot tasking and internal calibration. SAR economics move through a chain from orbital opportunity to accepted customer outcome. The model should identify the capacity unit, time window, priority, quality threshold, customer use, price and cost for each material service. This permits the transaction team to distinguish potential access from cash-producing delivery.
The evidence set comprises contracts, mission rules, queue logic, overrides and displacement history. Records should be dated and reconciled by satellite, request, target, pass, product, contract and payment. Missing support remains a visible diligence gap. Valuation converts the verified record into capacity and revenue displaced by each priority class. The board should test whether premium rights erode other contracted service, with every adjustment linked to one ledger and accountable owner. A control schedule should preserve source, calculation, reviewer, exception, decision and release evidence so that operating claims can be reproduced during diligence and after closing.
11. Price monitoring subscriptions
Decision usefulness requires a trace from repeated coverage of defined areas under service-level commitments to a completed collection, delivered product, customer decision and cash. The trace should expose conflicts, overrides, failures, latency and quality exceptions. It should also show whether another sensor, public mission or customer process can substitute for the service.
Diligence should obtain coverage schedules, accepted deliveries, renewal, expansion, price and support. The team should test completeness, technical fitness, contractual enforceability and commercial use. The financial model then measures recurring contribution adjusted for missed coverage. Decision makers should value contracted behaviour rather than nominal area; the assumption register should prevent revisit, priority, analytics and customer retention from counting the same benefit more than once. The review file should reconcile exceptions to price, conditions, financing, integration milestones and post-close monitoring rather than bury them inside a blended valuation multiple.
12. Price on-demand tasking
The control question concerns customer-initiated requests for a target, window, mode and delivery time. It should be answered through timestamped operating and customer evidence. Design revisit, constellation size, headline backlog and demonstration imagery can hide geometric limits, priority displacement, downlink constraints, rejected products and customers that do not depend on the service in production.
Required support includes order records, win rate, fulfilment, price, urgency and collection cost. Exceptions, failed collections, missing rights and deteriorating performance deserve separate review. The model uses the evidence to calculate expected tasking contribution per requested window. The investment committee should include unsuccessful or displaced requests in the denominator, retaining deductions for replacement, performance, concentration, regulation and integration. Each deduction should have an owner, release test, funding source and review date, allowing value to increase only when the underlying evidence has improved.
13. Value priority-access options
The analysis begins with the customer's right to reserve, pre-empt or accelerate capacity. SAR economics move through a chain from orbital opportunity to accepted customer outcome. The model should identify the capacity unit, time window, priority, quality threshold, customer use, price and cost for each material service. This permits the transaction team to distinguish potential access from cash-producing delivery.
The evidence set comprises option terms, reservation fees, exercise history and displaced missions. Records should be dated and reconciled by satellite, request, target, pass, product, contract and payment. Missing support remains a visible diligence gap. Valuation converts the verified record into option value net of capacity opportunity cost. The board should recognise premium only when rights and service are enforceable, with every adjustment linked to one ledger and accountable owner. A control schedule should preserve source, calculation, reviewer, exception, decision and release evidence so that operating claims can be reproduced during diligence and after closing.
14. Test sovereign and defence economics
Decision usefulness requires a trace from dedicated satellites, national tasking control, security, data residency and assured capacity to a completed collection, delivered product, customer decision and cash. The trace should expose conflicts, overrides, failures, latency and quality exceptions. It should also show whether another sensor, public mission or customer process can substitute for the service.
Diligence should obtain government contracts, acceptance milestones, operating duties and renewal rights. The team should test completeness, technical fitness, contractual enforceability and commercial use. The financial model then measures contracted cash after mission-specific cost and restriction. Decision makers should separate strategic claims from enforceable payment; the assumption register should prevent revisit, priority, analytics and customer retention from counting the same benefit more than once. The review file should reconcile exceptions to price, conditions, financing, integration milestones and post-close monitoring rather than bury them inside a blended valuation multiple.
15. Test emergency-response economics
The control question concerns rapid rescheduling and low-latency delivery after natural or human-caused events. It should be answered through timestamped operating and customer evidence. Design revisit, constellation size, headline backlog and demonstration imagery can hide geometric limits, priority displacement, downlink constraints, rejected products and customers that do not depend on the service in production.
Required support includes activation records, scheduling changes, collection, delivery and customer use. Exceptions, failed collections, missing rights and deteriorating performance deserve separate review. The model uses the evidence to calculate incremental cost and willingness to pay for response. The investment committee should test performance during actual congested periods, retaining deductions for replacement, performance, concentration, regulation and integration. Each deduction should have an owner, release test, funding source and review date, allowing value to increase only when the underlying evidence has improved.
16. Measure image and product quality
The analysis begins with resolution, noise, calibration, geolocation, polarisation, artefacts and application fitness. SAR economics move through a chain from orbital opportunity to accepted customer outcome. The model should identify the capacity unit, time window, priority, quality threshold, customer use, price and cost for each material service. This permits the transaction team to distinguish potential access from cash-producing delivery.
The evidence set comprises quality reports, independent tests, rejected products and customer acceptance. Records should be dated and reconciled by satellite, request, target, pass, product, contract and payment. Missing support remains a visible diligence gap. Valuation converts the verified record into acceptance probability and remediation cost. The board should link technical quality to the purchased outcome, with every adjustment linked to one ledger and accountable owner. A control schedule should preserve source, calculation, reviewer, exception, decision and release evidence so that operating claims can be reproduced during diligence and after closing.
17. Reconcile SAR bands and modes
Decision usefulness requires a trace from X-band, C-band, L-band and other modes with different penetration, resolution and applications to a completed collection, delivered product, customer decision and cash. The trace should expose conflicts, overrides, failures, latency and quality exceptions. It should also show whether another sensor, public mission or customer process can substitute for the service.
Diligence should obtain payload specifications, mode use, customer requirements and substitutes. The team should test completeness, technical fitness, contractual enforceability and commercial use. The financial model then measures cash by technically suitable mode and mission. Decision makers should avoid treating all SAR capacity as interchangeable; the assumption register should prevent revisit, priority, analytics and customer retention from counting the same benefit more than once. The review file should reconcile exceptions to price, conditions, financing, integration milestones and post-close monitoring rather than bury them inside a blended valuation multiple.
18. Value interferometric continuity
The control question concerns repeat geometry, orbit control, coherence, calibration and time-series consistency required for InSAR. It should be answered through timestamped operating and customer evidence. Design revisit, constellation size, headline backlog and demonstration imagery can hide geometric limits, priority displacement, downlink constraints, rejected products and customers that do not depend on the service in production.
Required support includes orbit records, baseline control, paired scenes and product validation. Exceptions, failed collections, missing rights and deteriorating performance deserve separate review. The model uses the evidence to calculate cash that depends on a continuing comparable series. The investment committee should fund continuity before applying a data or workflow premium, retaining deductions for replacement, performance, concentration, regulation and integration. Each deduction should have an owner, release test, funding source and review date, allowing value to increase only when the underlying evidence has improved.
19. Test ground-segment capacity
The analysis begins with downlink windows, station diversity, data transport, processing queues, storage and delivery interfaces. SAR economics move through a chain from orbital opportunity to accepted customer outcome. The model should identify the capacity unit, time window, priority, quality threshold, customer use, price and cost for each material service. This permits the transaction team to distinguish potential access from cash-producing delivery.
The evidence set comprises station agreements, utilisation, outage logs, compute metrics and recovery tests. Records should be dated and reconciled by satellite, request, target, pass, product, contract and payment. Missing support remains a visible diligence gap. Valuation converts the verified record into end-to-end throughput and resilience. The board should retain deductions for bottlenecks below orbital capacity, with every adjustment linked to one ledger and accountable owner. A control schedule should preserve source, calculation, reviewer, exception, decision and release evidence so that operating claims can be reproduced during diligence and after closing.
20. Measure serving cost
Decision usefulness requires a trace from satellite operations, ground stations, bandwidth, compute, storage, quality control, support and security to a completed collection, delivered product, customer decision and cash. The trace should expose conflicts, overrides, failures, latency and quality exceptions. It should also show whether another sensor, public mission or customer process can substitute for the service.
Diligence should obtain cost ledgers, cloud bills, labour records and unit economics. The team should test completeness, technical fitness, contractual enforceability and commercial use. The financial model then measures gross margin by monitoring, tasking and priority tier. Decision makers should include cost generated by failed and repeated collections; the assumption register should prevent revisit, priority, analytics and customer retention from counting the same benefit more than once. The review file should reconcile exceptions to price, conditions, financing, integration milestones and post-close monitoring rather than bury them inside a blended valuation multiple.
21. Reconstruct customer workflows
The control question concerns how imagery or derived signals enter defence, maritime, disaster, infrastructure, insurance and resource decisions. It should be answered through timestamped operating and customer evidence. Design revisit, constellation size, headline backlog and demonstration imagery can hide geometric limits, priority displacement, downlink constraints, rejected products and customers that do not depend on the service in production.
Required support includes integrations, active users, alerts, decisions, renewal and switching evidence. Exceptions, failed collections, missing rights and deteriorating performance deserve separate review. The model uses the evidence to calculate retention and expansion attributable to production use. The investment committee should exclude demonstration activity from embedded-workflow value, retaining deductions for replacement, performance, concentration, regulation and integration. Each deduction should have an owner, release test, funding source and review date, allowing value to increase only when the underlying evidence has improved.
22. Test analytics conversion
The analysis begins with the conversion of complex SAR data into classifications, change detection, alerts and forecasts. SAR economics move through a chain from orbital opportunity to accepted customer outcome. The model should identify the capacity unit, time window, priority, quality threshold, customer use, price and cost for each material service. This permits the transaction team to distinguish potential access from cash-producing delivery.
The evidence set comprises model cards, training lineage, validation, adoption, drift and human review. Records should be dated and reconciled by satellite, request, target, pass, product, contract and payment. Missing support remains a visible diligence gap. Valuation converts the verified record into incremental contribution and operating leverage from analytics. The board should separate model value from the imagery that trains and feeds it, with every adjustment linked to one ledger and accountable owner. A control schedule should preserve source, calculation, reviewer, exception, decision and release evidence so that operating claims can be reproduced during diligence and after closing.
23. Benchmark public-data substitution
Decision usefulness requires a trace from free and open SAR missions, commercial alternatives and customer self-processing to a completed collection, delivered product, customer decision and cash. The trace should expose conflicts, overrides, failures, latency and quality exceptions. It should also show whether another sensor, public mission or customer process can substitute for the service.
Diligence should obtain mission catalogues, product specifications, latency, licence terms and customer interviews. The team should test completeness, technical fitness, contractual enforceability and commercial use. The financial model then measures the premium for timeliness, resolution, priority and workflow. Decision makers should stress price where public supply serves the same decision; the assumption register should prevent revisit, priority, analytics and customer retention from counting the same benefit more than once. The review file should reconcile exceptions to price, conditions, financing, integration milestones and post-close monitoring rather than bury them inside a blended valuation multiple.
24. Reconstruct customer cohorts
The control question concerns civil government, defence, maritime, energy, infrastructure, insurance, agriculture and finance customers. It should be answered through timestamped operating and customer evidence. Design revisit, constellation size, headline backlog and demonstration imagery can hide geometric limits, priority displacement, downlink constraints, rejected products and customers that do not depend on the service in production.
Required support includes contracts, backlog, usage, renewal, gross margin, concentration and procurement cycle. Exceptions, failed collections, missing rights and deteriorating performance deserve separate review. The model uses the evidence to calculate cohort cash and exposure to budget or mission change. The investment committee should value each cohort through observed collections and payments, retaining deductions for replacement, performance, concentration, regulation and integration. Each deduction should have an owner, release test, funding source and review date, allowing value to increase only when the underlying evidence has improved.
25. Test contract quality
The analysis begins with termination, acceptance, minimum purchase, priority, liability, data rights, security and change-of-control clauses. SAR economics move through a chain from orbital opportunity to accepted customer outcome. The model should identify the capacity unit, time window, priority, quality threshold, customer use, price and cost for each material service. This permits the transaction team to distinguish potential access from cash-producing delivery.
The evidence set comprises executed contracts, amendments, delivery records, disputes and collections. Records should be dated and reconciled by satellite, request, target, pass, product, contract and payment. Missing support remains a visible diligence gap. Valuation converts the verified record into cash enforceability and transferability. The board should condition value on assignable and performed obligations, with every adjustment linked to one ledger and accountable owner. A control schedule should preserve source, calculation, reviewer, exception, decision and release evidence so that operating claims can be reproduced during diligence and after closing.
26. Model fleet reliability
Decision usefulness requires a trace from satellite health, payload degradation, common-mode exposure, collision risk and remaining life to a completed collection, delivered product, customer decision and cash. The trace should expose conflicts, overrides, failures, latency and quality exceptions. It should also show whether another sensor, public mission or customer process can substitute for the service.
Diligence should obtain telemetry, anomaly history, insurance, redundancy and engineering review. The team should test completeness, technical fitness, contractual enforceability and commercial use. The financial model then measures expected usable capacity by fleet cohort. Decision makers should retain downside for correlated or uninsurable failures; the assumption register should prevent revisit, priority, analytics and customer retention from counting the same benefit more than once. The review file should reconcile exceptions to price, conditions, financing, integration milestones and post-close monitoring rather than bury them inside a blended valuation multiple.
27. Fund replacement capital
The control question concerns design, manufacture, launch, commissioning, calibration and initial operating loss for replenishment. It should be answered through timestamped operating and customer evidence. Design revisit, constellation size, headline backlog and demonstration imagery can hide geometric limits, priority displacement, downlink constraints, rejected products and customers that do not depend on the service in production.
Required support includes supplier agreements, launch slots, production history, cash plan and acceptance criteria. Exceptions, failed collections, missing rights and deteriorating performance deserve separate review. The model uses the evidence to calculate sustainable free cash flow after fleet replacement. The investment committee should fund the constellation state assumed in terminal value, retaining deductions for replacement, performance, concentration, regulation and integration. Each deduction should have an owner, release test, funding source and review date, allowing value to increase only when the underlying evidence has improved.
28. Test spectrum security and regulation
The analysis begins with frequency rights, national licensing, remote-sensing controls, export restrictions, cybersecurity and data residency. SAR economics move through a chain from orbital opportunity to accepted customer outcome. The model should identify the capacity unit, time window, priority, quality threshold, customer use, price and cost for each material service. This permits the transaction team to distinguish potential access from cash-producing delivery.
The evidence set comprises licences, filings, security assessments, customer restrictions and consent maps. Records should be dated and reconciled by satellite, request, target, pass, product, contract and payment. Missing support remains a visible diligence gap. Valuation converts the verified record into cash that can lawfully continue after change of control. The board should use closing conditions for material transfer uncertainty, with every adjustment linked to one ledger and accountable owner. A control schedule should preserve source, calculation, reviewer, exception, decision and release evidence so that operating claims can be reproduced during diligence and after closing.
29. Construct sustainable free cash flow
Decision usefulness requires a trace from cash after operations, failures, processing, replacement, tax and working capital to a completed collection, delivered product, customer decision and cash. The trace should expose conflicts, overrides, failures, latency and quality exceptions. It should also show whether another sensor, public mission or customer process can substitute for the service.
Diligence should obtain reconciled accounts, unit metrics, fleet plan and customer forecast. The team should test completeness, technical fitness, contractual enforceability and commercial use. The financial model then measures free cash flow supported by one consistent operating state. Decision makers should use the same capacity and replacement assumptions through terminal value; the assumption register should prevent revisit, priority, analytics and customer retention from counting the same benefit more than once. The review file should reconcile exceptions to price, conditions, financing, integration milestones and post-close monitoring rather than bury them inside a blended valuation multiple.
30. Build the hypothetical tasking case
The control question concerns USD 1.16 billion of admitted monitoring, tasking, priority and analytics value. It should be answered through timestamped operating and customer evidence. Design revisit, constellation size, headline backlog and demonstration imagery can hide geometric limits, priority displacement, downlink constraints, rejected products and customers that do not depend on the service in production.
Required support includes illustrative inputs clearly separated from public evidence. Exceptions, failed collections, missing rights and deteriorating performance deserve separate review. The model uses the evidence to calculate a service-led value sum before combination benefits and deductions. The investment committee should use the case to demonstrate mechanics rather than represent a company, retaining deductions for replacement, performance, concentration, regulation and integration. Each deduction should have an owner, release test, funding source and review date, allowing value to increase only when the underlying evidence has improved.
31. Apply replacement and performance deductions
The analysis begins with fleet replenishment, service breaches, rejected products and ground bottlenecks. SAR economics move through a chain from orbital opportunity to accepted customer outcome. The model should identify the capacity unit, time window, priority, quality threshold, customer use, price and cost for each material service. This permits the transaction team to distinguish potential access from cash-producing delivery.
The evidence set comprises engineering plans, service records, quality tests and executable budgets. Records should be dated and reconciled by satellite, request, target, pass, product, contract and payment. Missing support remains a visible diligence gap. Valuation converts the verified record into USD 0.30 billion of deductions in the worked case. The board should release deductions only after evidence and funded remediation, with every adjustment linked to one ledger and accountable owner. A control schedule should preserve source, calculation, reviewer, exception, decision and release evidence so that operating claims can be reproduced during diligence and after closing.
32. Apply concentration and integration deductions
Decision usefulness requires a trace from customer dependence, sovereign restrictions, platform migration, security and operating integration to a completed collection, delivered product, customer decision and cash. The trace should expose conflicts, overrides, failures, latency and quality exceptions. It should also show whether another sensor, public mission or customer process can substitute for the service.
Diligence should obtain cohort analysis, consent map, integration plan and costed milestones. The team should test completeness, technical fitness, contractual enforceability and commercial use. The financial model then measures USD 0.11 billion of deductions in the worked case. Decision makers should retain deductions until transfer and delivery risks are resolved; the assumption register should prevent revisit, priority, analytics and customer retention from counting the same benefit more than once. The review file should reconcile exceptions to price, conditions, financing, integration milestones and post-close monitoring rather than bury them inside a blended valuation multiple.
33. Admit verified combination value
The control question concerns benefits created by joining sensor capacity, analytics, distribution and customer access. It should be answered through timestamped operating and customer evidence. Design revisit, constellation size, headline backlog and demonstration imagery can hide geometric limits, priority displacement, downlink constraints, rejected products and customers that do not depend on the service in production.
Required support includes cross-sell evidence, product tests, customer commitments and avoided cost. Exceptions, failed collections, missing rights and deteriorating performance deserve separate review. The model uses the evidence to calculate USD 0.12 billion in the worked case. The investment committee should cap synergy by buyer capture and executable delivery, retaining deductions for replacement, performance, concentration, regulation and integration. Each deduction should have an owner, release test, funding source and review date, allowing value to increase only when the underlying evidence has improved.
34. Structure price and protection
The analysis begins with cash, shares, earn-outs, holdbacks, capacity milestones, warranties, indemnities and financing. SAR economics move through a chain from orbital opportunity to accepted customer outcome. The model should identify the capacity unit, time window, priority, quality threshold, customer use, price and cost for each material service. This permits the transaction team to distinguish potential access from cash-producing delivery.
The evidence set comprises term sheet, sources and uses, consent schedule and downside case. Records should be dated and reconciled by satellite, request, target, pass, product, contract and payment. Missing support remains a visible diligence gap. Valuation converts the verified record into risk allocation aligned with unresolved evidence. The board should tie contingent value to accepted delivery, retention and fleet milestones, with every adjustment linked to one ledger and accountable owner. A control schedule should preserve source, calculation, reviewer, exception, decision and release evidence so that operating claims can be reproduced during diligence and after closing.
35. Establish post-close governance
Decision usefulness requires a trace from authority over tasking, priority, fleet, security, customers, capital and integration to a completed collection, delivered product, customer decision and cash. The trace should expose conflicts, overrides, failures, latency and quality exceptions. It should also show whether another sensor, public mission or customer process can substitute for the service.
Diligence should obtain board mandates, dashboards, model governance, assurance and decision logs. The team should test completeness, technical fitness, contractual enforceability and commercial use. The financial model then measures accountable delivery and early warning. Decision makers should refresh valuation when capacity, latency or retention changes materially; the assumption register should prevent revisit, priority, analytics and customer retention from counting the same benefit more than once. The review file should reconcile exceptions to price, conditions, financing, integration milestones and post-close monitoring rather than bury them inside a blended valuation multiple.
36. Define the investment decision
The control question concerns price, perimeter, conditions, financing, downside liquidity and post-close actions. It should be answered through timestamped operating and customer evidence. Design revisit, constellation size, headline backlog and demonstration imagery can hide geometric limits, priority displacement, downlink constraints, rejected products and customers that do not depend on the service in production.
Required support includes final value bridge, evidence exceptions, consent plan and accountable owners. Exceptions, failed collections, missing rights and deteriorating performance deserve separate review. The model uses the evidence to calculate an approve, reprice, restructure or decline decision. The investment committee should record the decision with explicit evidence and funding conditions, retaining deductions for replacement, performance, concentration, regulation and integration. Each deduction should have an owner, release test, funding source and review date, allowing value to increase only when the underlying evidence has improved.
Conclusion
SAR company valuation should begin with achieved service rather than constellation count or design revisit. Gross access becomes valuable only after availability, priority allocation, collection, downlink, processing, quality acceptance and timely delivery. Each stage has evidence, cost and failure risk.
The framework separates monitoring, tasking, priority options, analytics and customer-workflow cash, then funds replacement capital and removes overlap. It also treats sovereign rights, emergency response and strategic combination benefits as value only when contracts, performance and buyer capture support them.
For a board or investment committee, the decisive test is whether the fleet and operating system can continue delivering the promised decision outcome after change of control and replenishment. The answer determines price, structure, financing, protections and post-close governance.
Appendix A. Request-to-delivery register
The minimum register contains customer, contract, request time, target, window, mode, priority, candidate passes, scheduled pass, collection result, quality result, delivery time, acceptance, price, cost, exception and accountable owner.
Appendix B. Fleet and replacement register
For each spacecraft and payload cohort, record launch, commissioning, modes, capacity, reliability, anomalies, remaining life, common-mode dependencies, insurance, replacement supplier, launch slot, budget and acceptance milestones.
Appendix C. Investment checklist
The approval file should contain capacity definitions, request history, achieved revisit, latency, fulfilment, priority rules, service-level performance, quality, contracts, customer cohorts, public substitutes, analytics validation, cost, fleet reliability, replacement funding, spectrum, security, consents, integration, financing and downside liquidity. Evidence should be dated and owned.
Appendix D. Worked-case figures and tables
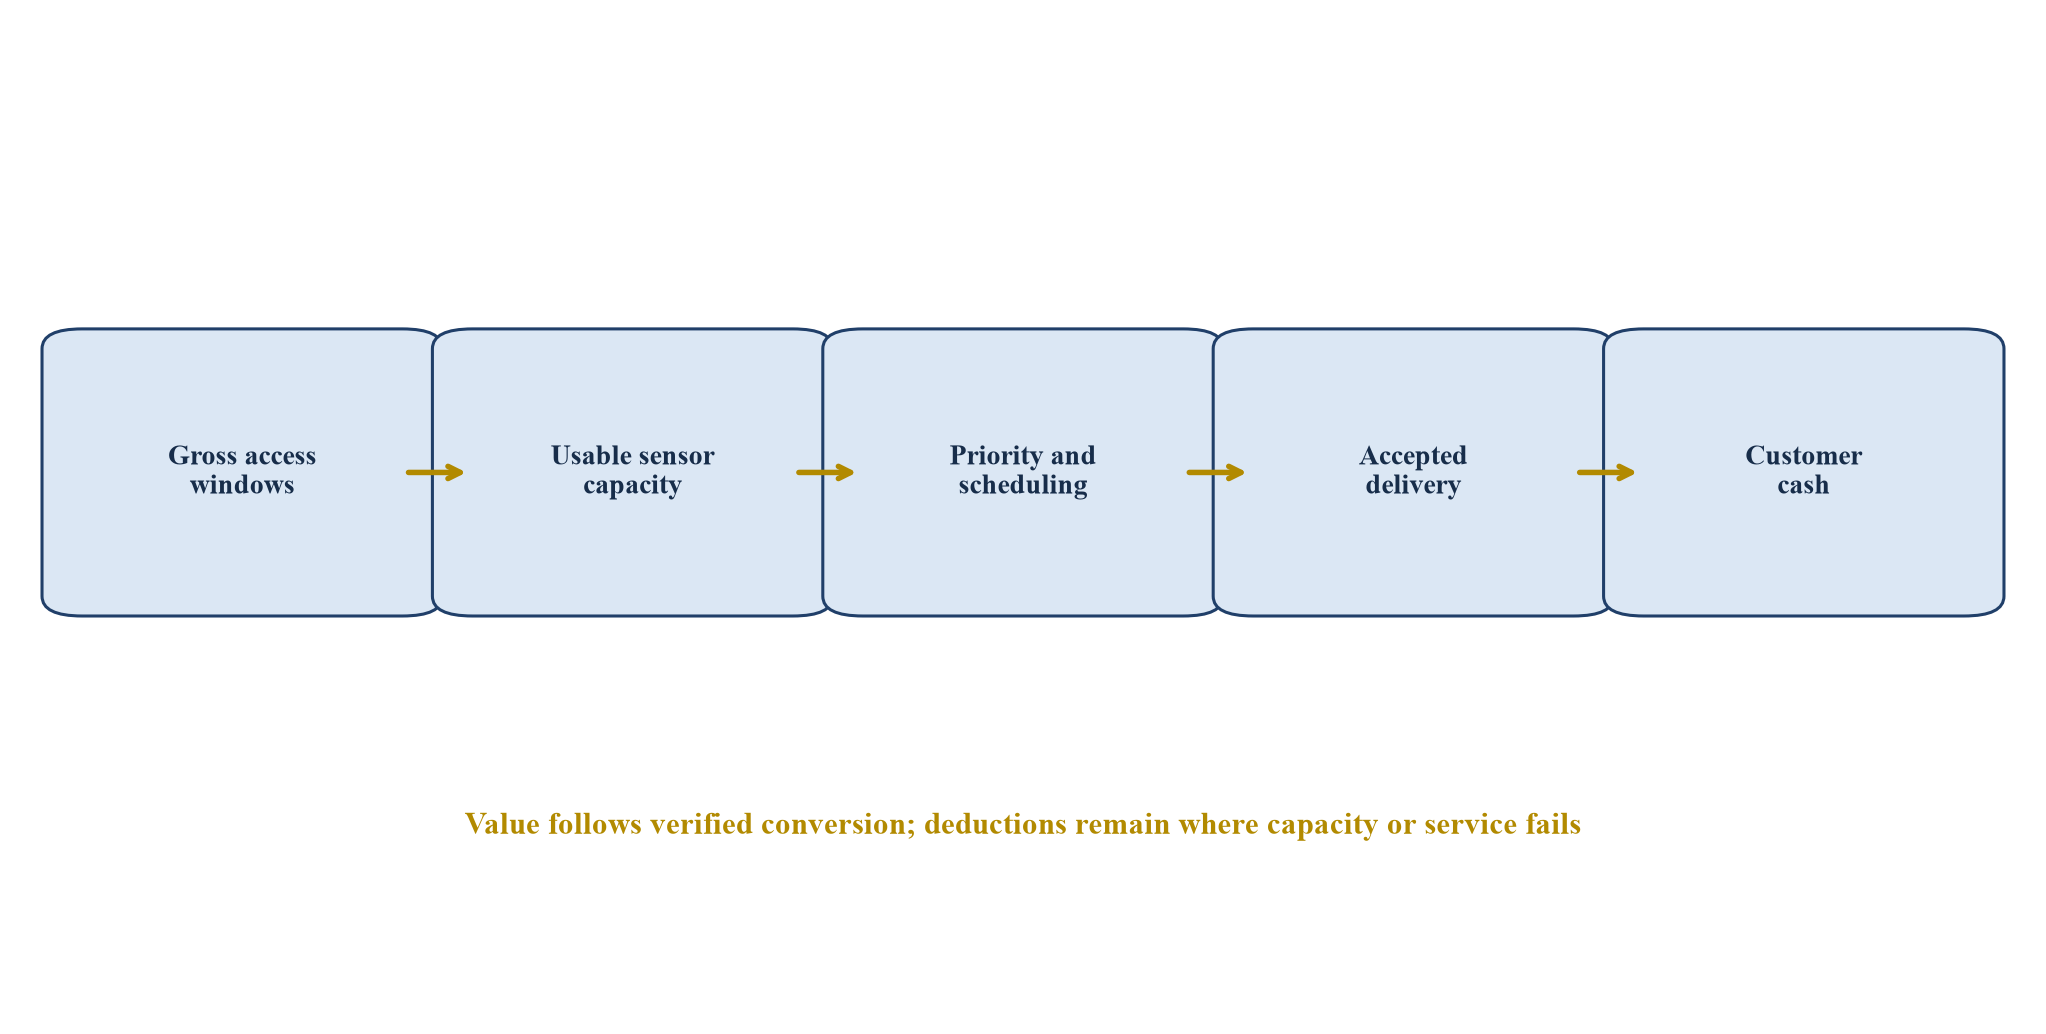
Proposed architecture linking access windows, priority allocation, accepted delivery and customer cash.
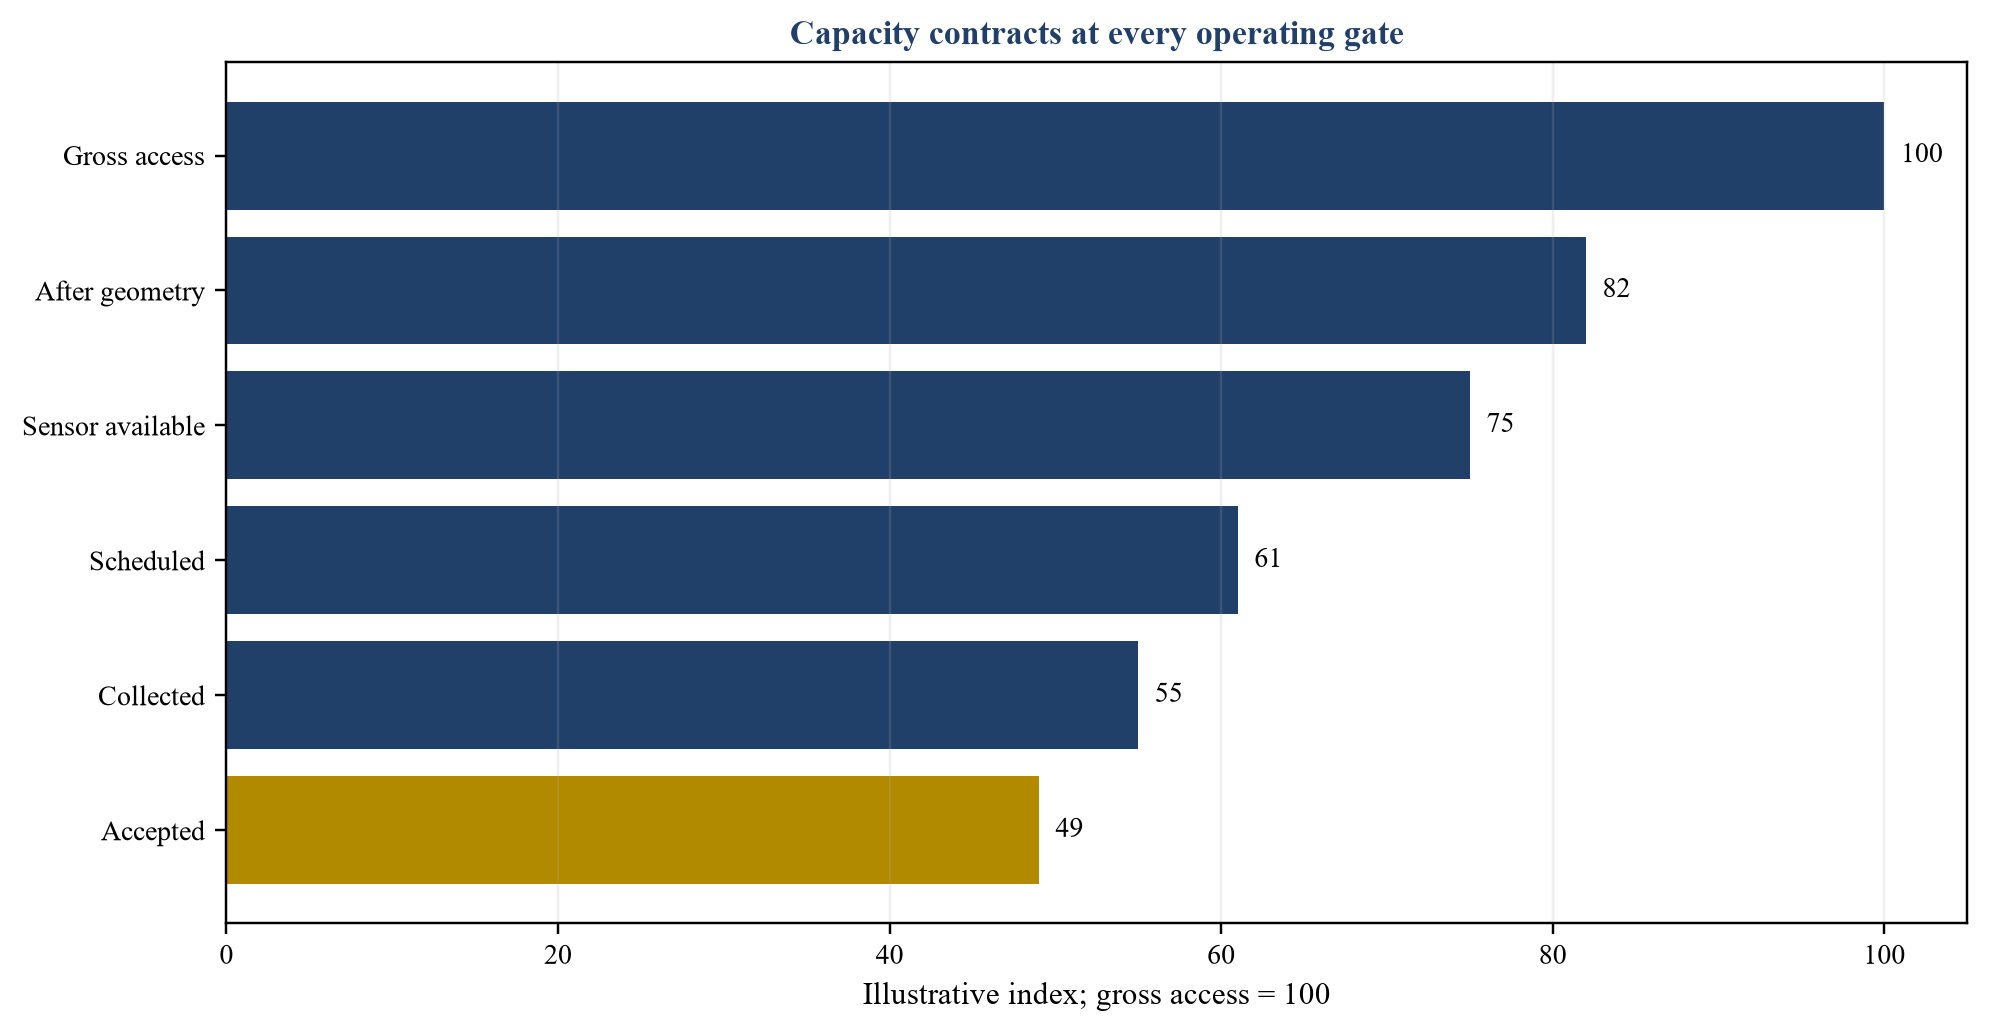
Illustrative conversion of gross access windows into accepted products.
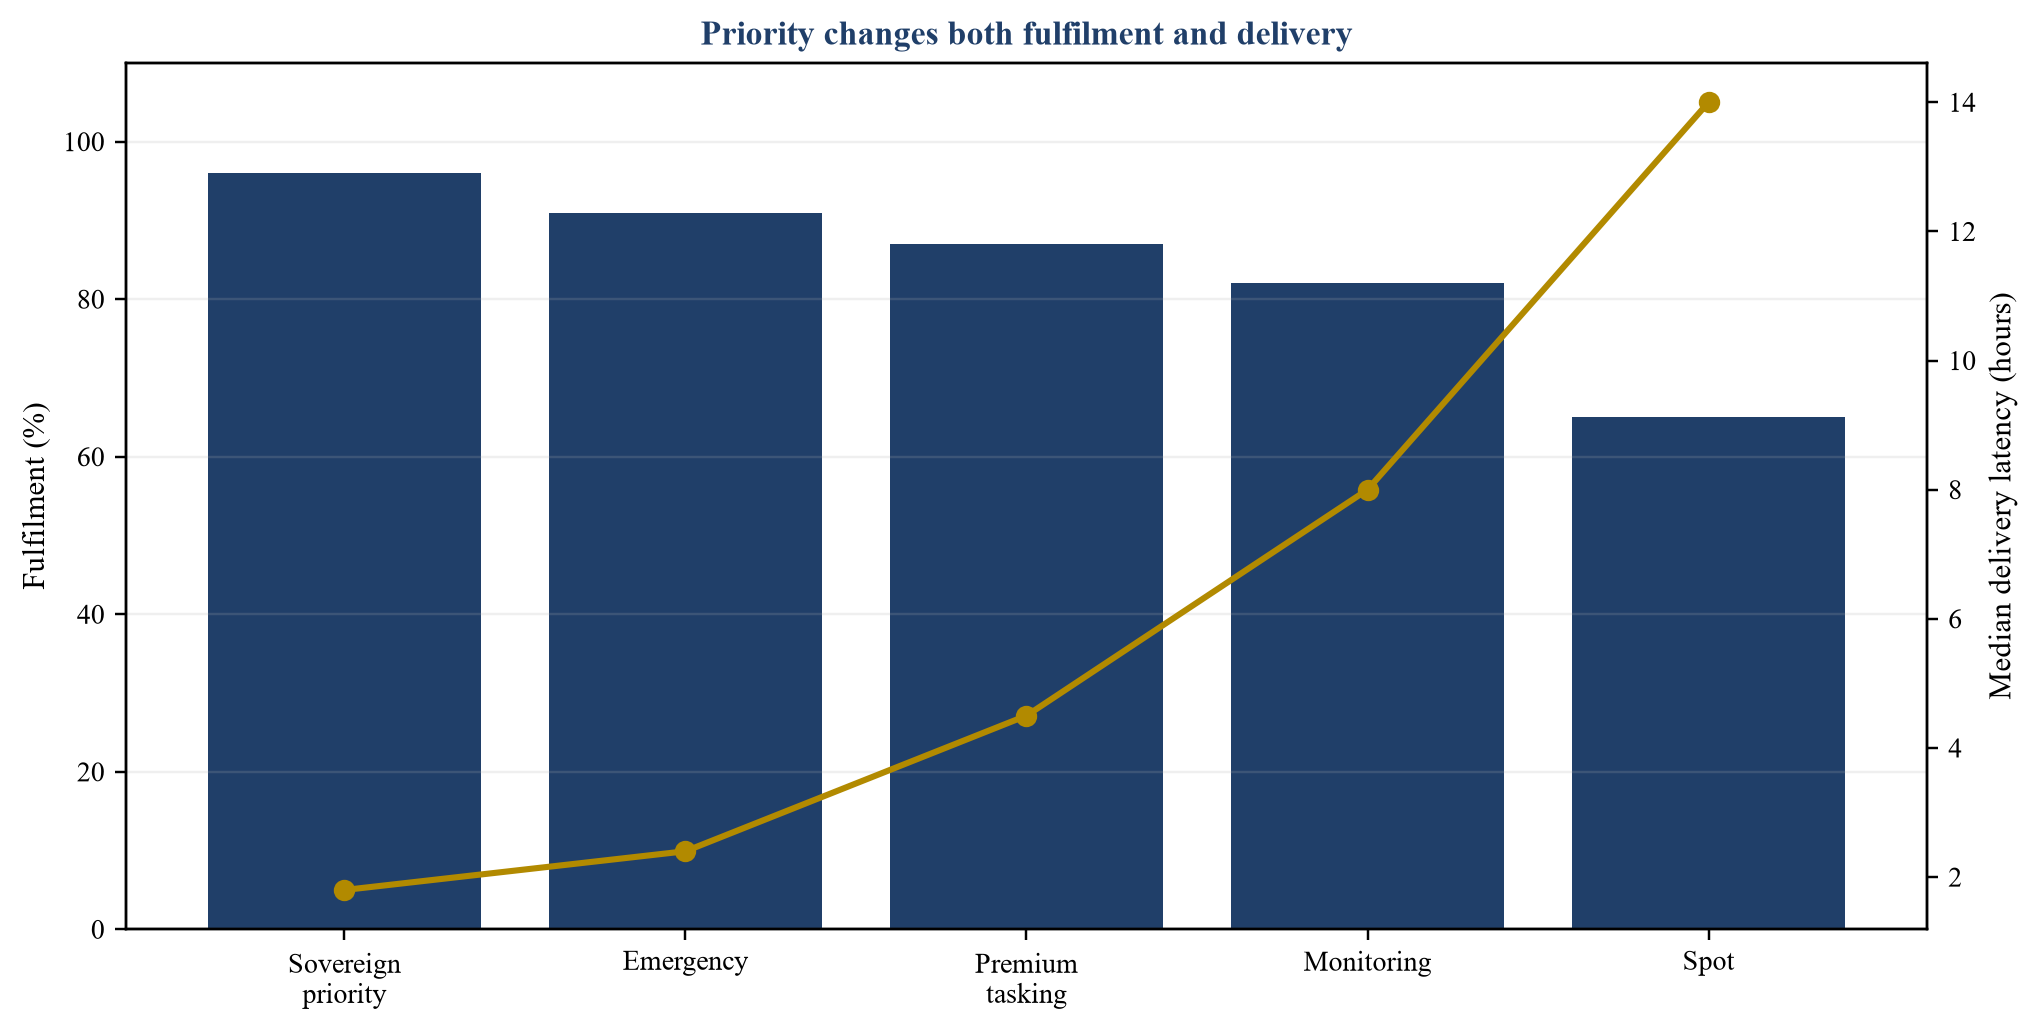
Illustrative completion probability and median delivery latency.
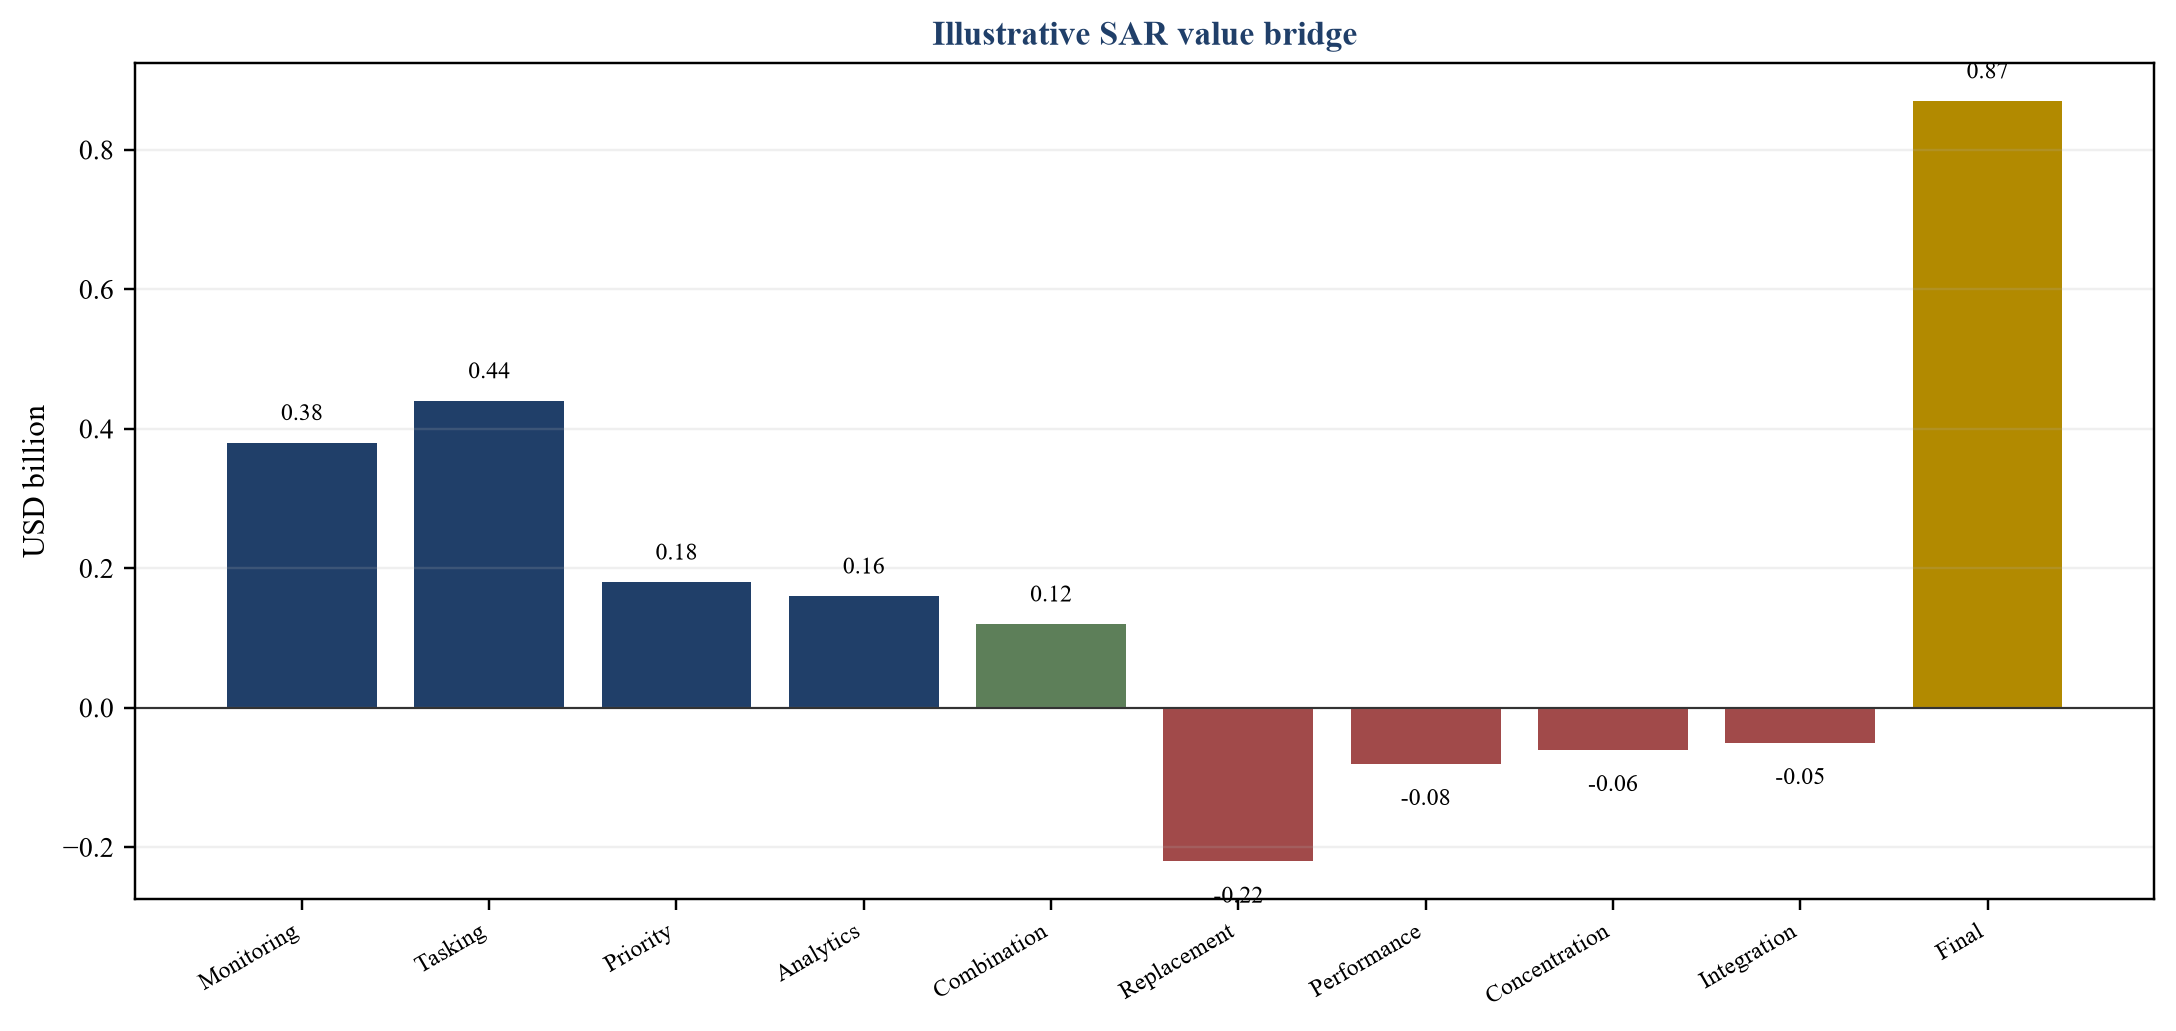
Illustrative bridge from service components to final transaction value.
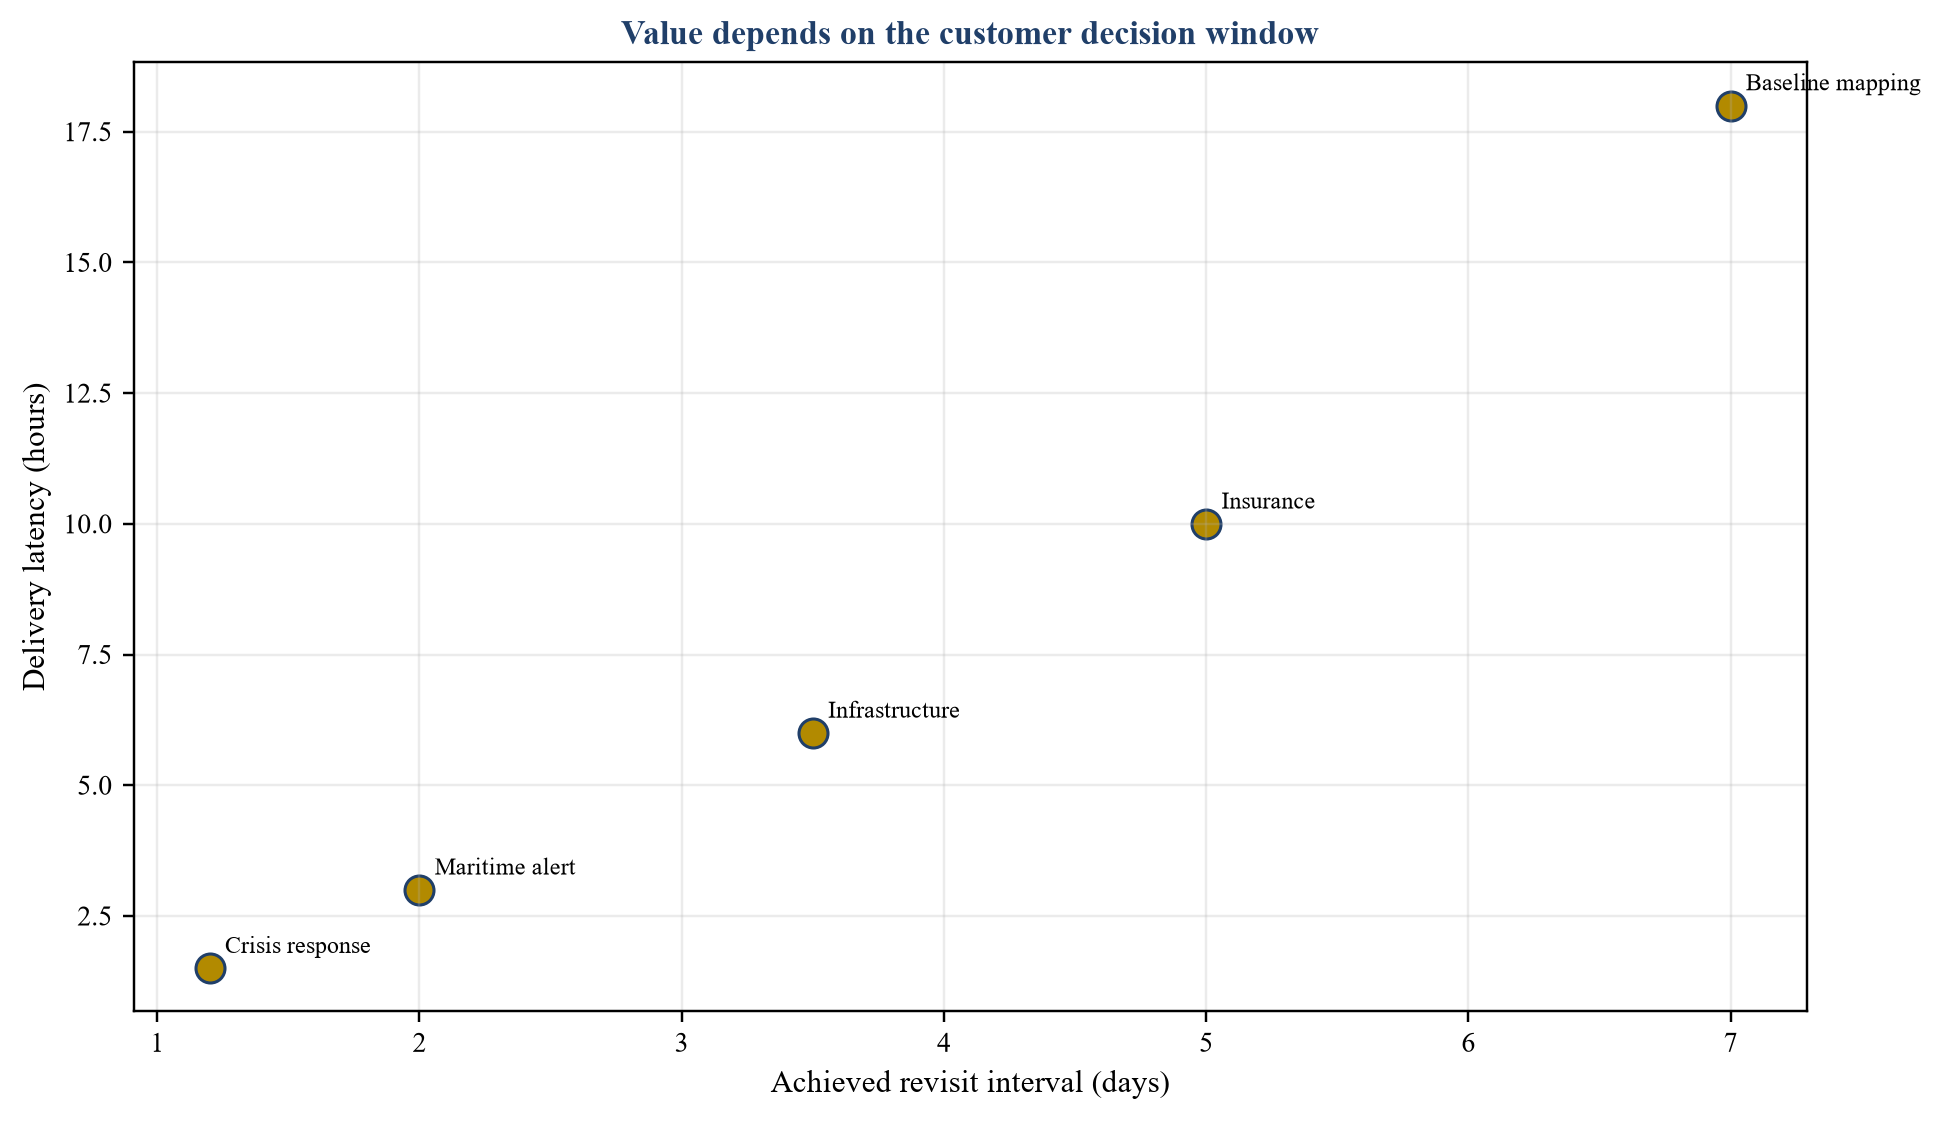
Proposed matrix linking achieved revisit and delivery latency to customer value.
| Ledger | Minimum evidence | Primary cash mechanism |
|---|---|---|
| Monitoring | repeated accepted coverage and renewal | subscription contribution |
| Tasking | requested completed and paid scenes | order contribution |
| Priority | enforceable reservation and exercise | option and capacity premium |
| Analytics | attributable adoption and performance | software and workflow cash |
Proposed separation of transaction value.
| Stage | Index | Primary loss driver |
|---|---|---|
| Gross access windows | 100 | orbit and target geometry |
| After geometry and mode | 82 | incidence and mode limits |
| Sensor available | 75 | health duty cycle and calibration |
| Scheduled | 61 | priority conflicts and capacity |
| Collected | 55 | anomaly and operational failure |
| Accepted | 49 | quality latency and customer criteria |
Illustrative conversion from access to accepted delivery.
| Dimension | Evidence | Valuation use |
|---|---|---|
| Achieved revisit | accepted timestamps by target | workflow fit |
| Fulfilment | completed requests divided by valid requests | expected service |
| Latency | request through accepted delivery | time-sensitive value |
| Priority displacement | overridden and rescheduled missions | opportunity cost |
| Replacement | funded manufacture launch and commissioning | sustainable capacity |
Proposed diligence fields.
| Step | Amount | Evidence required |
|---|---|---|
| Contracted monitoring | 0.38 | accepted coverage renewal and contribution |
| On-demand tasking | 0.44 | requests fulfilment price and cost |
| Priority-access options | 0.18 | enforceable rights exercise and displacement |
| Analytics and workflow | 0.16 | performance adoption and cash attribution |
| Verified combination benefit | plus 0.12 | buyer capture and delivery evidence |
| Replacement capital | minus 0.22 | funded fleet plan |
| Delivery and performance | minus 0.08 | service remediation |
| Customer and mission concentration | minus 0.06 | cohort downside |
| Integration | minus 0.05 | costed milestones |
| Final illustrative value | 0.87 | integrated evidence set |
All amounts are illustrative USD billions.
| Gate | Approval evidence | Stop condition |
|---|---|---|
| Capacity | reconciled access-to-acceptance funnel | theoretical capacity only |
| Service | achieved revisit fulfilment and latency | material service gap |
| Customer | renewal use and collected contribution | unverified workflow value |
| Fleet | reliability life and funded replacement | unfunded capacity decline |
| Regulation | transferable rights and consents | unresolved change-of-control risk |
| Combination | attributable buyer benefit | duplicated or aspirational synergy |
Proposed board control.
| Risk | Potential protection | Release evidence |
|---|---|---|
| Service fulfilment | earn-out or holdback | accepted deliveries |
| Fleet performance | milestone payment | achieved capacity and reliability |
| Replacement | funding covenant | launch and commissioning |
| Customer retention | earn-out | collected retained revenue |
| Regulatory transfer | closing condition | formal consent |
| Analytics performance | staged payment | independent validation |
Proposed risk allocation.
| Dimension | Core measure | Trigger |
|---|---|---|
| Capacity | accepted products per usable window | conversion deterioration |
| Revisit | achieved interval by cohort | missed workflow requirement |
| Latency | request-to-delivery percentile | service breach |
| Fleet | availability life and replacement | capacity shortfall |
| Customers | renewal expansion contribution | cohort below case |
| Analytics | accuracy adoption and serving cost | performance drift |
| Capital | cash burn replacement and liquidity | funding shortfall |
Proposed monthly decision record.
Sources
- NASA, NISAR Mission Overview. Read the primary source
- NASA, NISAR Mission Requirements. Read the primary source
- NASA JPL, NISAR Radar Instruments. Read the primary source
- NASA JPL, NISAR Mission Concept and Open Data. Read the primary source
- NASA JPL, Interferometric Synthetic Aperture Radar. Read the primary source
- NASA, NISAR Active Mission and Data Access. Read the primary source
- European Space Agency, Sentinel-1 Mission. Read the primary source
- Copernicus Data Space Ecosystem, Sentinel-1 Data. Read the primary source
- ICEYE, Four New SAR Satellites Launched on Transporter-17. Read the primary source
- ICEYE, Portugal Acquires Two Additional SAR Satellites. Read the primary source
- ICEYE, Company and Constellation Overview, May 2026. Read the primary source
- IonQ, 2025 Annual Report, Capella Space Acquisition. Read the primary source
- IonQ, Capella Space Purchase Price Allocation. Read the primary source
- IonQ, Completion of Capella Space Acquisition. Read the primary source
- MDA Space, Canadian Space Agency SAR Replenishment Satellite Contract. Read the primary source
- MDA Space, Space-Based Geointelligence Transaction Presentation. Read the primary source
- Voyager Technologies, 2025 Annual Report and EMSI Acquisition. Read the primary source
- NASA, Commercial Satellite Data Acquisition Programme. Read the primary source
- IFRS Foundation, IFRS 3 Business Combinations. Read the primary source
- IFRS Foundation, IAS 36 Impairment of Assets. Read the primary source
- IFRS Foundation, IFRS 13 Fair Value Measurement. Read the primary source
- IFRS Foundation, IFRS 15 Revenue from Contracts with Customers. Read the primary source
- International Valuation Standards Council, International Valuation Standards. Read the primary source
- U.S. National Institute of Standards and Technology, Cybersecurity Framework 2.0. Read the primary source
- U.S. National Institute of Standards and Technology, AI Risk Management Framework. Read the primary source
