
Introduction
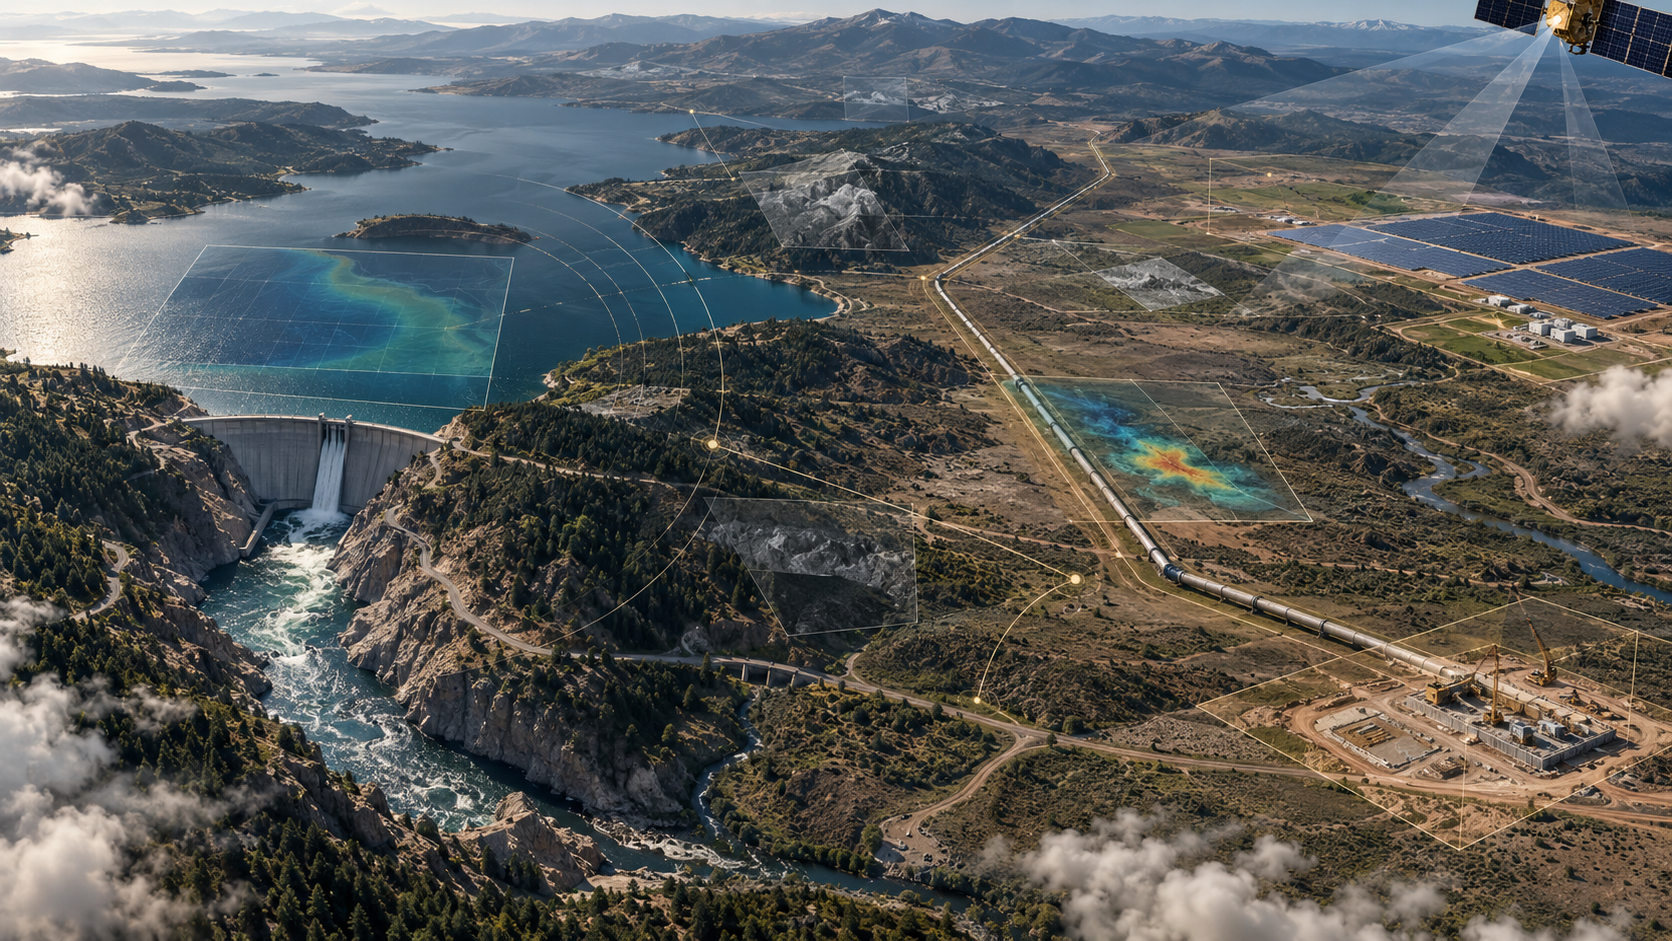
An infrastructure asset can now be observed repeatedly without placing an inspector at every location. Radar can identify surface displacement around a corridor or dam. Optical imagery can document land-cover change, excavation and visible construction. Thermal observations can identify heat patterns. Spectrometers can detect some large atmospheric plumes. Altimetry can measure water-surface elevation, while multispectral imagery can support indicators related to water quality. These capabilities create a new evidence layer for owners, investors, insurers, lenders and regulators.
The same capabilities can create false confidence. A satellite image is a measurement shaped by the instrument, orbit, atmosphere, surface, processing method and acquisition time. An analytics platform adds models, thresholds and asset attribution. The output may show a change without explaining its cause. A clear scene can still miss an event between overpasses. A methane plume can be detected without proving which piece of equipment emitted it. A deformation signal can indicate motion without establishing imminent failure. Decisions become defensible only when observation, interpretation, validation and response are connected.
The central conclusion is that satellite monitoring should be treated as a governed evidence system. It can widen coverage, establish an independent time series and direct scarce field resources. It should enter financing, procurement or intervention decisions through an assurance gate that records what was measured, when it was measured, the uncertainty, the corroborating evidence and the accountable response. Its strongest role is usually to complement field systems, create exceptions for investigation and strengthen the audit trail.
1 Define the decision before selecting imagery
The programme should begin with a decision statement. “Monitor the pipeline” is a broad intention. “Identify ground movement within the right-of-way that requires an engineering review before the next scheduled patrol” is testable. “Determine whether certified monthly construction progress supports a drawdown” is another. “Escalate a large methane event for operator investigation within twenty-four hours” has a different latency and attribution requirement.
The decision record should identify the asset boundary, user, trigger, consequence of error, response time, existing evidence, required confidence and final authority. A false negative in a safety application can have a high consequence. A false positive can also matter when it sends crews into remote terrain, interrupts operations or delays a financing certificate. The acceptable trade-off depends on the decision.
The same imagery can therefore have different evidential weight. A low-resolution optical series may support portfolio triage but not quantity certification. A radar displacement product may identify a corridor segment for geotechnical review but not replace an integrity assessment. A reservoir elevation series may improve regional context while local gauges remain authoritative for operations. Procurement should specify the decision rather than purchase a generic dashboard.
2 Build the observation chain
A complete observation chain has six links: sensor, acquisition, processing, interpretation, validation and action. The sensor has spatial, spectral and radiometric characteristics. Acquisition adds orbit, look angle, revisit and environmental conditions. Processing converts raw measurements into calibrated products. Interpretation associates the product with an asset and decision. Validation compares the result with independent evidence. Action assigns an owner, response and closure record.
Weakness at any link limits the whole chain. A sensitive instrument cannot compensate for an ambiguous asset boundary. A strong analytics model cannot recover an event that was never observed. High-resolution imagery cannot prove progress when the contract milestone concerns installed equipment hidden inside a building. A well-detected anomaly has little value when no response protocol exists.
The chain should be documented for each use. The data register should record provider, product level, licence, acquisition time, processing version, coordinate reference, quality flags, model version, validation source, alert history and retention. Derived observations should remain traceable to source scenes. This record enables audit, model change control and reconstruction after a disputed decision.
Table 1. Sensor families, infrastructure uses and minimum corroboration
| Sensor family | Illustrative asset evidence | Principal constraint | Appropriate decision role | Minimum corroboration |
|---|---|---|---|---|
| Synthetic-aperture radar | Surface displacement, inundation, land-cover change and all-weather imaging | Line-of-sight geometry, vegetation, coherence loss and interpretation ambiguity | Corridor screening, deformation trend and exception routing | Survey points, geotechnical review or site inspection |
| Optical multispectral | Visible construction, land disturbance, water extent and spectral indices | Cloud, haze, illumination, shadows and concealed work | Progress context, encroachment and water-quality screening | Engineer records, gauges, samples or higher-resolution imagery |
| Thermal infrared | Heat signatures, thermal discharge and selected equipment or fire conditions | Atmospheric correction, spatial resolution and emissivity | Anomaly screening and environmental surveillance | Ground temperature, process data or inspection |
| Atmospheric spectroscopy | Methane and other gas plume detection under suitable conditions | Wind, cloud, surface brightness, detection threshold and attribution | Large-event alerting and portfolio transparency | Operator investigation, source-level measurement and repeat observation |
| Radar or laser altimetry | Water-surface elevation and selected terrain or ice measurements | Ground track, footprint, waveform and temporal sampling | Reservoir and basin trend monitoring | Gauge data, bathymetry and operating records |
| Very-high-resolution commercial imagery | Detailed surface change and visible asset condition | Cost, tasking, coverage and interpretation | Targeted diligence, construction evidence and incident review | Approved scope, timestamp verification and field certification |
The table is an author-developed decision aid. Actual suitability depends on the sensor, asset, geography, season and decision.
3 Match resolution, revisit and latency to the decision
Spatial resolution determines the size of visible features; revisit determines how often a location can be acquired; latency determines how quickly usable output reaches the decision-maker. These dimensions interact. A narrow high-resolution instrument may provide detail with less frequent coverage. A broad mapping sensor may identify regional events while a targeted instrument provides attribution. A monitoring design often needs more than one layer.
The requirement should begin with the event. A fast-developing spill or large methane release can require prompt detection and escalation. Slow subsidence around a corridor can be assessed through a time series. Monthly construction certification may tolerate longer latency while requiring accurate date, footprint and contractual alignment. Seasonal reservoir planning needs a consistent time series and an understanding of measurement gaps.
Service-level agreements should distinguish acquisition from delivery. A nominal revisit does not mean every scene is usable. Cloud can affect optical products. Radar coherence can decline in vegetation or rapidly changing surfaces. Tasking can be constrained by orbit and capacity. The programme should report effective coverage: the proportion of the required asset-time window for which decision-quality evidence was actually available.
4 Establish a multi-sensor architecture
No single instrument provides universal monitoring. Wide-area public missions can establish persistent baselines and direct attention. Commercial constellations can add resolution, frequency or specialised measurements. Drones, aircraft, gauges, supervisory systems and field teams provide local context and validation. The architecture should assign each layer a defined evidential role.
A practical pattern has four levels. The first is a broad public baseline, such as Sentinel or Landsat products. The second is an automated change or anomaly screen. The third is targeted higher-resolution acquisition or specialist analysis. The fourth is field confirmation and engineering disposition. Escalation is based on consequence and confidence, not merely on visual novelty.
Combining sensors can reduce uncertainty. Radar remains useful through cloud and at night; optical imagery can provide intuitive surface context; atmospheric instruments can identify emissions; altimetry can add water-level information. Fusion requires temporal alignment, coordinate control and an explicit model of uncertainty. A polished composite should not conceal that its inputs were acquired on different dates or at different scales.
5 Treat ground truth as part of the product
Satellite analytics require independent comparison with the physical asset. Ground truth can include gauges, survey monuments, inspection reports, gas measurements, laboratory samples, construction records, photographs, telemetry and maintenance events. The validation set should cover normal conditions, known anomalies, seasons and asset types.
The provider and asset owner should agree the unit of validation. A pixel-level accuracy claim may not translate into an asset-level decision. A methane plume model can be evaluated for detection and quantification, while the decision also requires facility attribution and response. A construction-change model can identify new surface features, while the finance decision requires alignment with bill-of-quantities milestones.
Validation should remain independent of model tuning where possible. A protected holdout set, third-party engineering review or owner-controlled test area can reduce circularity. Results should be reported by operating regime and geography. Average accuracy can hide poor performance in desert glare, steep terrain, urban clutter, dense vegetation or monsoon cloud.
6 Monitor reservoirs as a storage system
Reservoir monitoring involves elevation, extent, storage, inflow, release, evaporation, sedimentation and water quality. Satellite altimetry can measure water-surface elevation at suitable targets. Optical and radar imagery can delineate water extent. Storage estimation then depends on a relationship between elevation, area and volume, often derived from bathymetry or design information.
NASA's Surface Water and Ocean Topography mission was designed to survey surface-water elevation and extent at global scale. Its products can strengthen basin and portfolio visibility, especially where gauge coverage is sparse. The USGS WaterMAP demonstrates a combined model: satellite observations are presented alongside field measurements and spatial hydrography. This is a useful governance principle because independent data sources reveal disagreement rather than forcing one series to appear authoritative.
The decision design should state whether the output supports regional context, seasonal planning, covenant monitoring or direct operations. Reservoir rules, intake geometry, local gauge datum and bathymetry affect interpretation. A change in surface area may reflect operation, drought, sediment, cloud classification or shoreline complexity. Operational action should remain connected to local instruments and accountable water managers.
7 Add water-quality screening with disciplined language
Multispectral remote sensing can support indicators related to chlorophyll, turbidity, suspended matter, surface temperature and harmful algal bloom conditions. These are optical or thermal observations with algorithms calibrated to particular waters. They are not direct laboratory analyses of every contaminant or depth.
Water bodies vary in colour, sediment, dissolved organic matter, depth and adjacency effects. Atmospheric correction and cloud masking materially affect the result. A model calibrated for one lake may not transfer to another. The programme should define the target variable, sampling depth, laboratory method, temporal tolerance and spatial match between image and field sample.
The strongest operating model uses satellite evidence to expand spatial awareness and direct sampling. A utility can identify unusual zones, track surface patterns and compare them with intake or recreational areas. Field teams then confirm conditions and follow the approved water-safety plan. Public communication should describe the measured indicator and uncertainty rather than declare water safe or unsafe from imagery alone.
8 Observe dams and surrounding ground movement
Interferometric synthetic-aperture radar compares radar phase across acquisitions to estimate line-of-sight displacement. Time-series methods can reveal gradual ground motion over broad areas. Copernicus ground-motion services and national programmes illustrate the scale at which systematic products can be produced. Dams, embankments, slopes and surrounding terrain can be included in a wider surveillance programme.
Interpretation needs care. The measurement is along the satellite line of sight rather than a complete three-dimensional displacement vector. Atmospheric effects, vegetation, snow, rapid change and loss of coherence can reduce quality. Motion near a structure can reflect regional subsidence, seasonal soil behaviour, construction or other processes. A remote signal does not establish structural condition by itself.
The surveillance protocol should define trend thresholds, persistence, spatial pattern and corroboration. Anomalies should route to dam-safety engineers who can examine instruments, surveys, piezometers, seepage, loading and site conditions. Satellite monitoring is valuable when it improves coverage and prioritisation while preserving the established engineering authority.
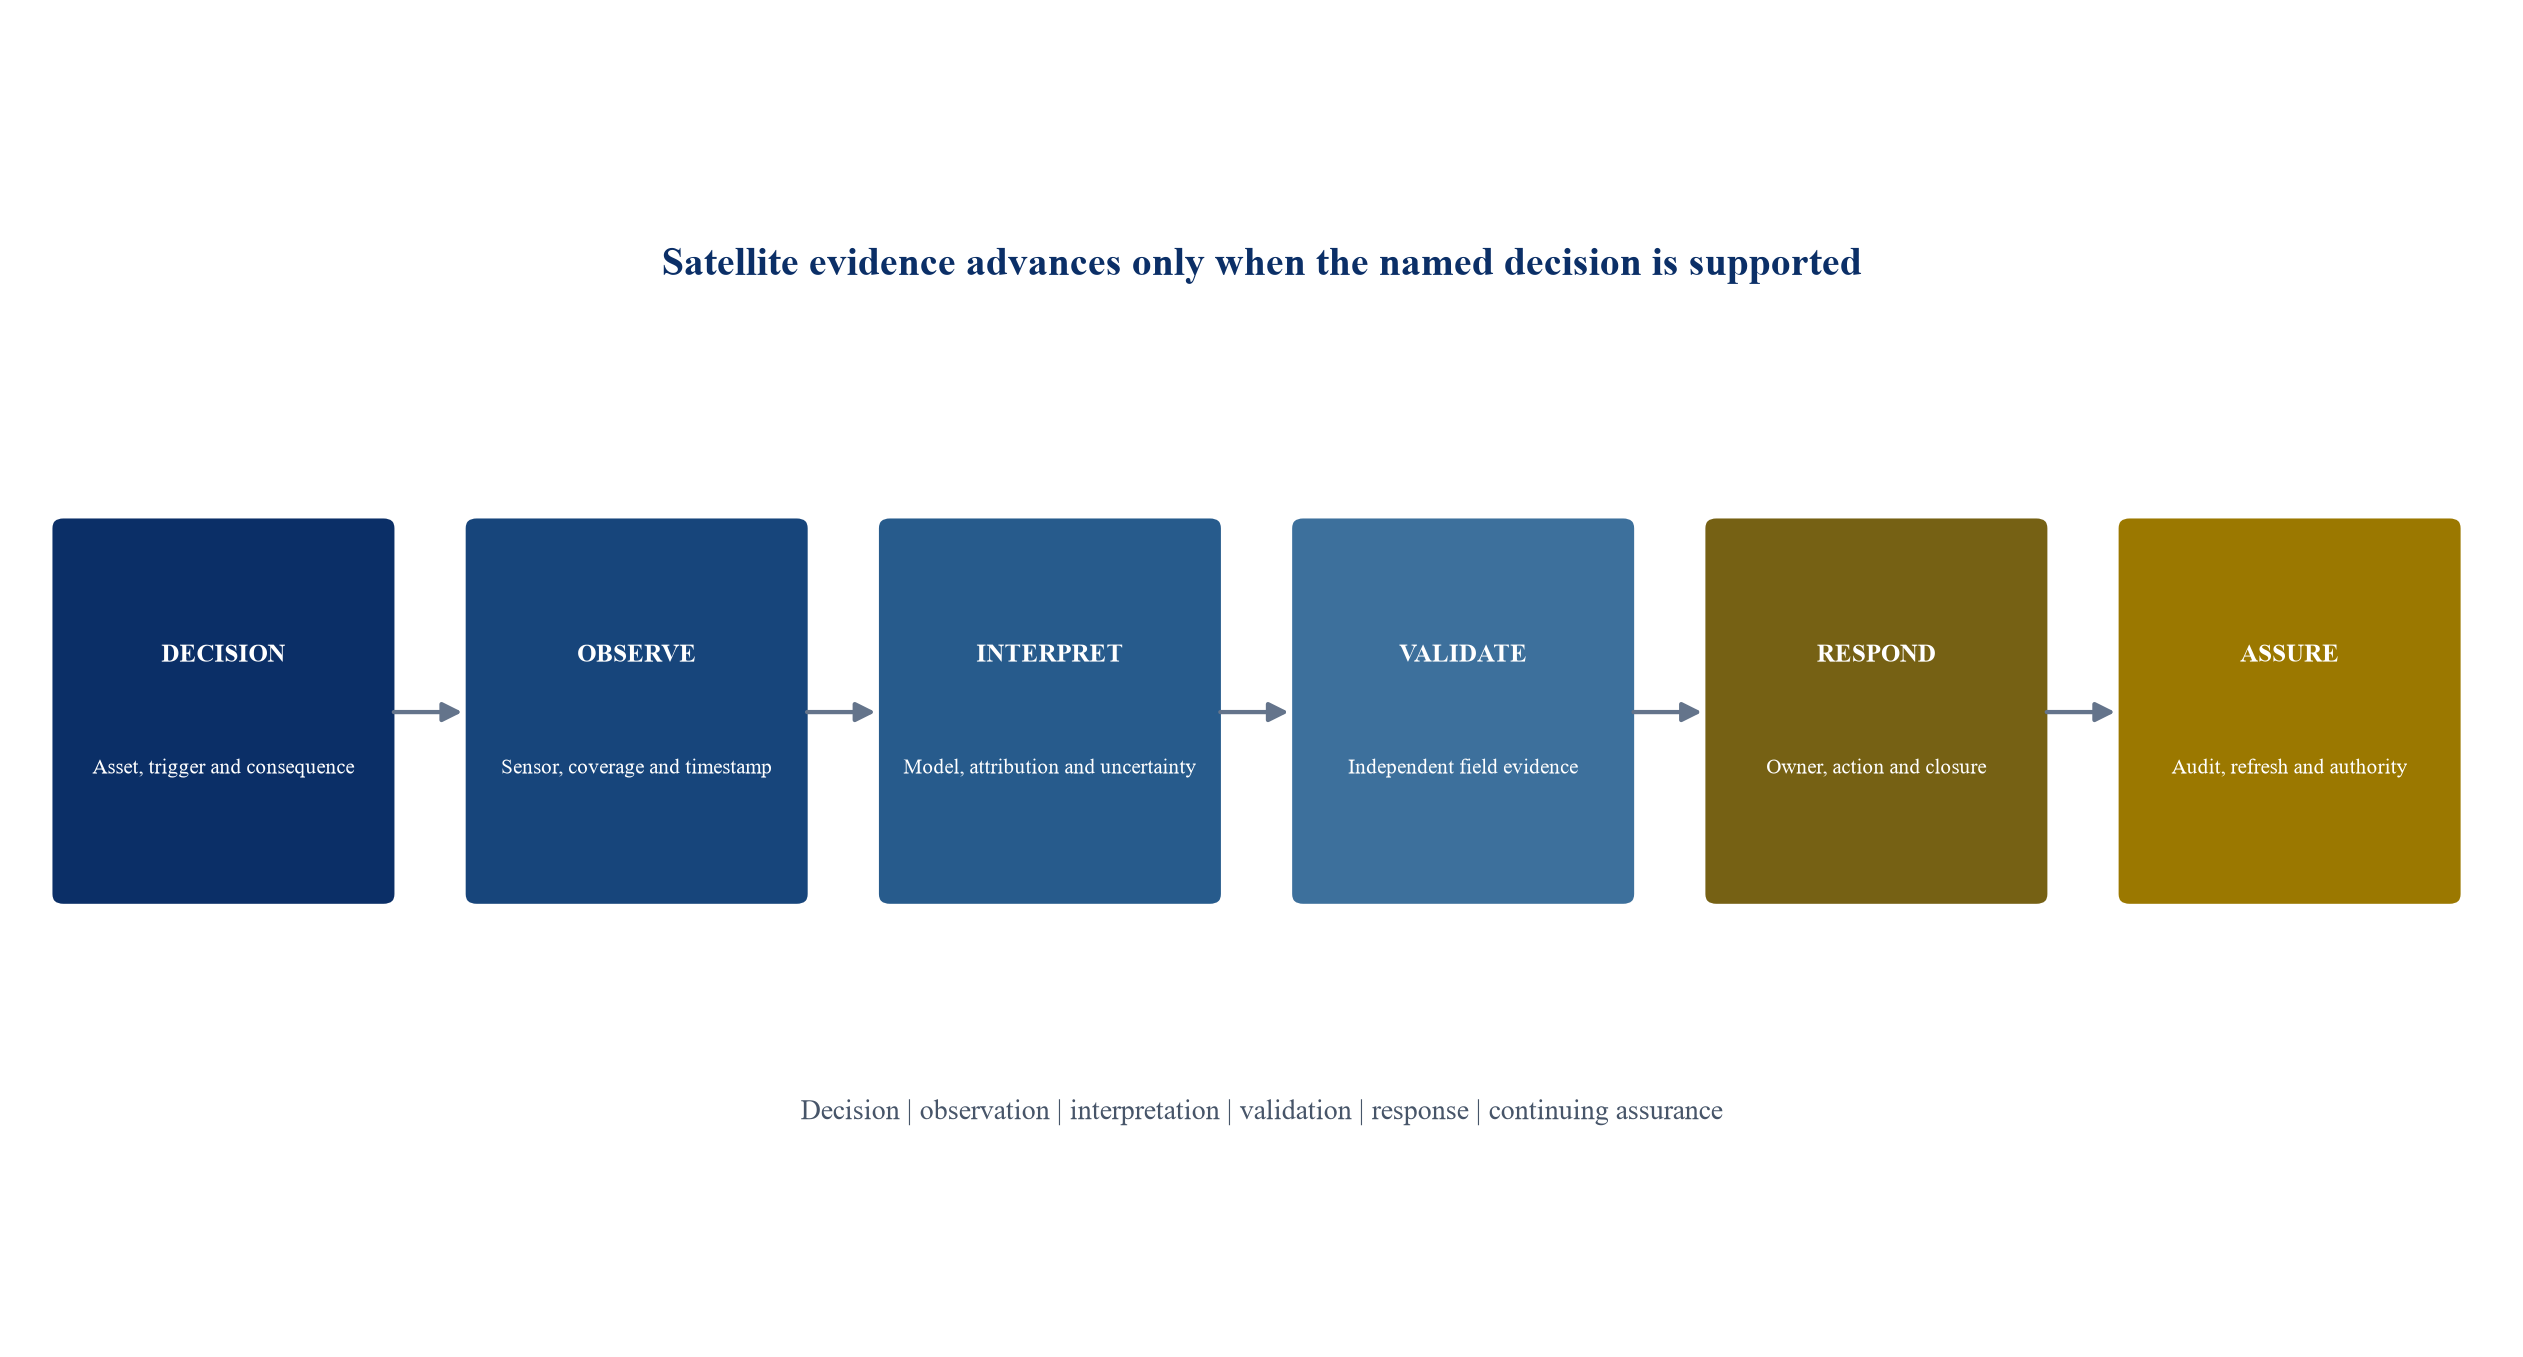
The framework is author-developed. Each stage requires traceable evidence before a satellite-derived observation receives greater decision authority.
9 Use satellite evidence for pipeline geohazards
Pipeline corridors face landslides, subsidence, erosion, river movement, flooding, construction encroachment and vegetation change. Satellite radar, optical imagery, terrain models and precipitation products can support regional screening and site-specific monitoring. PHMSA research material identifies satellite observations, gauges and remote monitoring among inputs to geohazard management.
The value lies in combining scale with prioritisation. A long corridor can be screened for change, with engineering attention directed to segments where movement, hydrology or third-party activity has changed. Time-series evidence can support trend analysis and post-event review. Commercial services can add tasking, higher resolution and specialist interpretation.
The limitations should be explicit. Surface movement may not represent pipe strain. Vegetation and geometry can reduce radar coherence. A right-of-way feature can be obscured or misclassified. Regulatory acceptance varies by jurisdiction and use. In the United States, PHMSA has considered technology-neutral right-of-way patrol rules involving remote sensing; a proposal or withdrawn rule should not be represented as final permission. The operator should obtain current regulatory and engineering confirmation.
10 Convert methane detection into response
Satellite methane monitoring has progressed from scientific mapping to operational notification systems. UNEP's International Methane Emissions Observatory operates the Methane Alert and Response System, which combines multiple satellite instruments, scientific analysis and stakeholder notification. Its published workflow separates detection and attribution, notification, action, and follow-up tracking. That separation is commercially important.
Detection depends on plume size, wind, surface conditions, cloud, instrument sensitivity and acquisition opportunity. Attribution can require higher-resolution observations and ancillary data. Quantification contains uncertainty. A large event can be material even when a satellite system does not see smaller or intermittent releases. Absence of a detection does not demonstrate absence of emissions.
An asset programme should define who receives an alert, how the asset is identified, what evidence is shared, how quickly the operator investigates, which measurement methods confirm the source, and how closure is verified. The record should preserve false alerts and missed events discovered through other systems. Satellite evidence can support transparency and prioritisation; source-level measurement and repair remain operational responsibilities.
11 Connect monitoring to regulation and market access
Regulatory regimes increasingly refer to remote measurement and independent data. Regulation (EU) 2024/1787 establishes methane measurement, reporting and verification requirements and provides for a global monitoring tool based on satellite data and certified data providers. It also addresses high-emitting events and rapid reaction. The regulation demonstrates that satellite information can enter an official transparency system.
Compliance design still requires careful legal analysis. A satellite alert is not automatically a complete regulatory report. Operators may need source-level quantification, site-level measurement, verification statements, leak detection and repair records, and jurisdiction-specific methods. Importers and suppliers can face requests for asset and methane information across complex value chains.
For transactions, the diligence team should map regulation to asset data. It should test monitoring coverage, reported emissions, independent alerts, response logs, remediation cost and contractual allocation. Purchase agreements, financing documents and supply contracts can address disclosure, access to monitoring records, remediation, audit rights and changes in law, subject to current legal advice.
12 Monitor flaring, spills and surface disturbance
Thermal and optical satellite data can support surveillance of flaring, fire, surface spills, disturbed land and selected water impacts. Radar can assist with oil-spill detection on water under suitable conditions. These applications can provide independent evidence across large portfolios and remote geographies.
Interpretation should distinguish detection from causation. A thermal anomaly can have several sources. A dark radar feature on water can arise from low wind or natural films. Optical evidence can be blocked by cloud or resemble other surface change. The protocol should combine automated detection with contextual review, weather, operating data, higher-resolution scenes and field confirmation.
Portfolio owners can use the evidence to route exceptions and compare response performance. Lenders can request periodic reports showing event, confidence, operator response, closure and residual exposure. Public claims should be limited to verified findings and should describe the method and date. The programme should retain contested cases and model corrections.
13 Observe construction progress without confusing visibility and completion
Earth observation can document excavation, roads, buildings, reservoirs, transmission corridors, solar arrays and other visible change. A time series can provide independent evidence of site activity and broad progress. This can help investors and lenders identify delay, scope change or unusual inactivity across a portfolio.
Visible progress is different from contractual completion. Installed equipment can be inside a structure. Commissioning, quality, permits and performance tests may not be visible. Earthworks can appear advanced while critical-path engineering remains delayed. Imagery should therefore be mapped to visible work packages, not to an undifferentiated completion percentage.
For drawdowns, the independent engineer remains central. Satellite evidence can support site selection, exception review and comparison with submitted photographs or schedules. The certification file should show acquisition dates, visible milestones, contractor records, engineer assessment and any unresolved variance. An automated progress score should not release funds without approved authority.
14 Build a lender and investor evidence pack
A financing evidence pack can contain an asset register, monitoring objective, sensor coverage, baseline period, material alerts, response status, unresolved exceptions and limitations. Construction assets can add visible milestone maps. Operating assets can add reservoir, corridor, emissions or environmental indicators. The pack should link each observation to the covenant, risk or investment question it supports.
The pack should avoid data theatre. A large volume of imagery does not establish control. Investors need the material exceptions, confidence, response and trend. The provider should disclose data gaps, model changes and asset boundary changes. Management should distinguish observed satellite evidence, operator-provided information and analytical interpretation.
Transaction teams can use the record to target diligence. A persistent deformation signal can trigger geotechnical work. An emissions alert can trigger measurement and maintenance review. Divergence between reported construction and visible change can trigger schedule and payment testing. Each trigger leads to a specialist investigation rather than a conclusion generated from space alone.
15 Create an alert hierarchy
An alert should contain asset, location, time, observation, confidence, severity, uncertainty, evidence links and required response. Severity can combine consequence and confidence. A high-consequence low-confidence observation may require rapid validation. A lower-consequence persistent trend may enter planned inspection.
The hierarchy should prevent alert fatigue. Thresholds can use persistence, spatial extent, rate of change and agreement across sensors. Duplicate observations should be grouped into one case. The case remains open until an accountable owner records disposition. Model feedback should distinguish true event, benign change, uncertain result and data-quality issue.
Escalation should include human review for material decisions. Artificial intelligence can prioritise scenes, classify change and draft summaries. Engineering, operational, regulatory and financial authority remains assigned to named people. Automation should preserve the original evidence and show which parts of the output were model-generated.
Table 2. Minimum validation and response scorecard
| Dimension | Example measure | Evidence source | Failure signal | Accountable owner |
|---|---|---|---|---|
| Coverage | Decision-quality acquisitions divided by required asset-time windows | Acquisition and quality logs | Nominal revisit hides repeated unusable scenes | Monitoring product owner |
| Detection | Recall for known events within defined magnitude and conditions | Ground-truth event set | Material events are missed in important regimes | Technical validation lead |
| False alerts | False cases per asset-month and investigation burden | Alert and closure register | Operations cannot process the alert volume | Operations owner |
| Attribution | Correct association with facility, corridor segment or project area | Owner-controlled asset map and field review | Alerts attach to the wrong asset or source | Asset-data owner |
| Quantification | Error and uncertainty against approved reference measurement | Gauges, surveys, samples or direct measurement | Bias changes the decision or covenant assessment | Engineering authority |
| Latency | Time from acquisition to validated alert and accountable receipt | System logs | Evidence arrives after the decision window | Service owner |
| Response | Confirmed cases investigated and closed within protocol | Case-management record | Alerts remain unowned or unresolved | Operating executive |
| Decision value | Avoided inspection, earlier intervention or financing evidence after lifecycle cost | Finance-approved baseline | Technical output does not improve an approved decision | Sponsor and finance |
Thresholds should be set for the named asset and decision before operational use.
16 Govern artificial intelligence in geospatial analytics
Machine learning is used for segmentation, change detection, object detection, plume analysis, forecasting and prioritisation. The model should be governed as part of the measurement chain. The record should include training data, geography, sensor versions, labels, class balance, preprocessing, model version, thresholds and known limitations.
Distribution shift is common. New satellites, processing levels, seasons, construction materials, land cover and atmospheric conditions can change input data. A model trained in one geography may perform poorly in another. Validation should therefore be stratified and repeated after material changes. Human reviewers should see uncertainty and source scenes, not only a categorical alert.
Foundation models can accelerate feature extraction and natural-language reporting. They can also generate plausible but unsupported explanations. A language model should not infer a cause or recommend an intervention beyond the verified evidence. Reports should distinguish measured observation, model classification, contextual data and human conclusion.
17 Protect sensitive infrastructure information
Geospatial monitoring can reveal asset locations, routes, capacity, construction status and operational patterns. Some source imagery is public, while asset-specific analytics, labels and response records can be commercially or security sensitive. The programme should classify data at each stage.
Access controls should address raw scenes, precise asset boundaries, derived alerts, model outputs and incident records. Contracts should cover permitted use, redistribution, model training, subcontractors, security incidents, retention and deletion. Providers should disclose where processing occurs and which third-party services are used.
Aggregation can support investor reporting without exposing sensitive details. Public statements can describe portfolio coverage and closed material events while restricted systems retain precise locations and operational responses. Security review should consider the combined information available from multiple public and private sources.
18 Design procurement around evidence
Procurement should use a decision-specific test. The buyer supplies representative asset boundaries and a controlled validation set. Bidders process common historical scenes and, where feasible, a prospective period. Metrics include coverage, detection, false alerts, attribution, quantification, latency, usability, integration and lifecycle cost.
The protocol should include difficult conditions and known non-events. A provider can achieve impressive demonstrations on selected scenes while failing across a full seasonal cycle. Prospective testing reduces selection bias. The buyer should record manual analyst effort, because a service that depends on extensive hidden review may scale differently from an automated platform.
Commercial milestones can separate proof of capability, protected validation, operational pilot and scale. Payment and term can be linked to verified service levels. The contract should address data continuity if a satellite, supplier or model changes. Exit provisions should preserve the alert history, metadata and audit record needed by the asset owner.
19 Measure total lifecycle cost
Costs include imagery, tasking, analytics, cloud processing, integration, asset mapping, validation, specialist interpretation, field confirmation, security, training and refresh. Public data can reduce acquisition cost but still require substantial processing and engineering. High-resolution tasking can be economical when targeted to exceptions and expensive when applied indiscriminately.
The baseline should include current patrols, surveys, inspections, gauges, incident response and reporting. Satellite monitoring may reduce some travel, improve prioritisation or identify events earlier. It also creates new work through alert review and confirmation. A credible business case measures net change in the complete process.
Shared infrastructure can improve economics across reservoirs, corridors and construction portfolios. The common layer includes asset boundaries, acquisition management, evidence storage and case workflow. Specialist models remain use-specific. The sponsor should avoid allocating every platform cost to the first application or assuming that every later application is free.
20 Use scenario valuation
Investment evaluation can use three scenarios. The visibility case uses public observations and analyst review for periodic portfolio screening. The assurance case adds commercial data, independent validation, integrated alerts and response workflow. The platform case extends the operating model across assets, geographies and external customers.
Each scenario should state coverage, adoption, staffing, false-alert burden, avoided activity and implementation cost. Value should be released against evidence such as validated detection performance, observed response time, reduced survey cost, earlier intervention or improved financing control. Future customer and regulatory benefits remain contingent until supported by contracts or operating results.
For acquisition diligence, current assets can include data rights, labelled archives, models, customer contracts, integration, specialist staff and validated workflows. Dependence on a single satellite, analyst, customer or public subsidy should be tested. Earn-outs or staged capital can link consideration to coverage, renewal, validated performance and margin after human review cost.
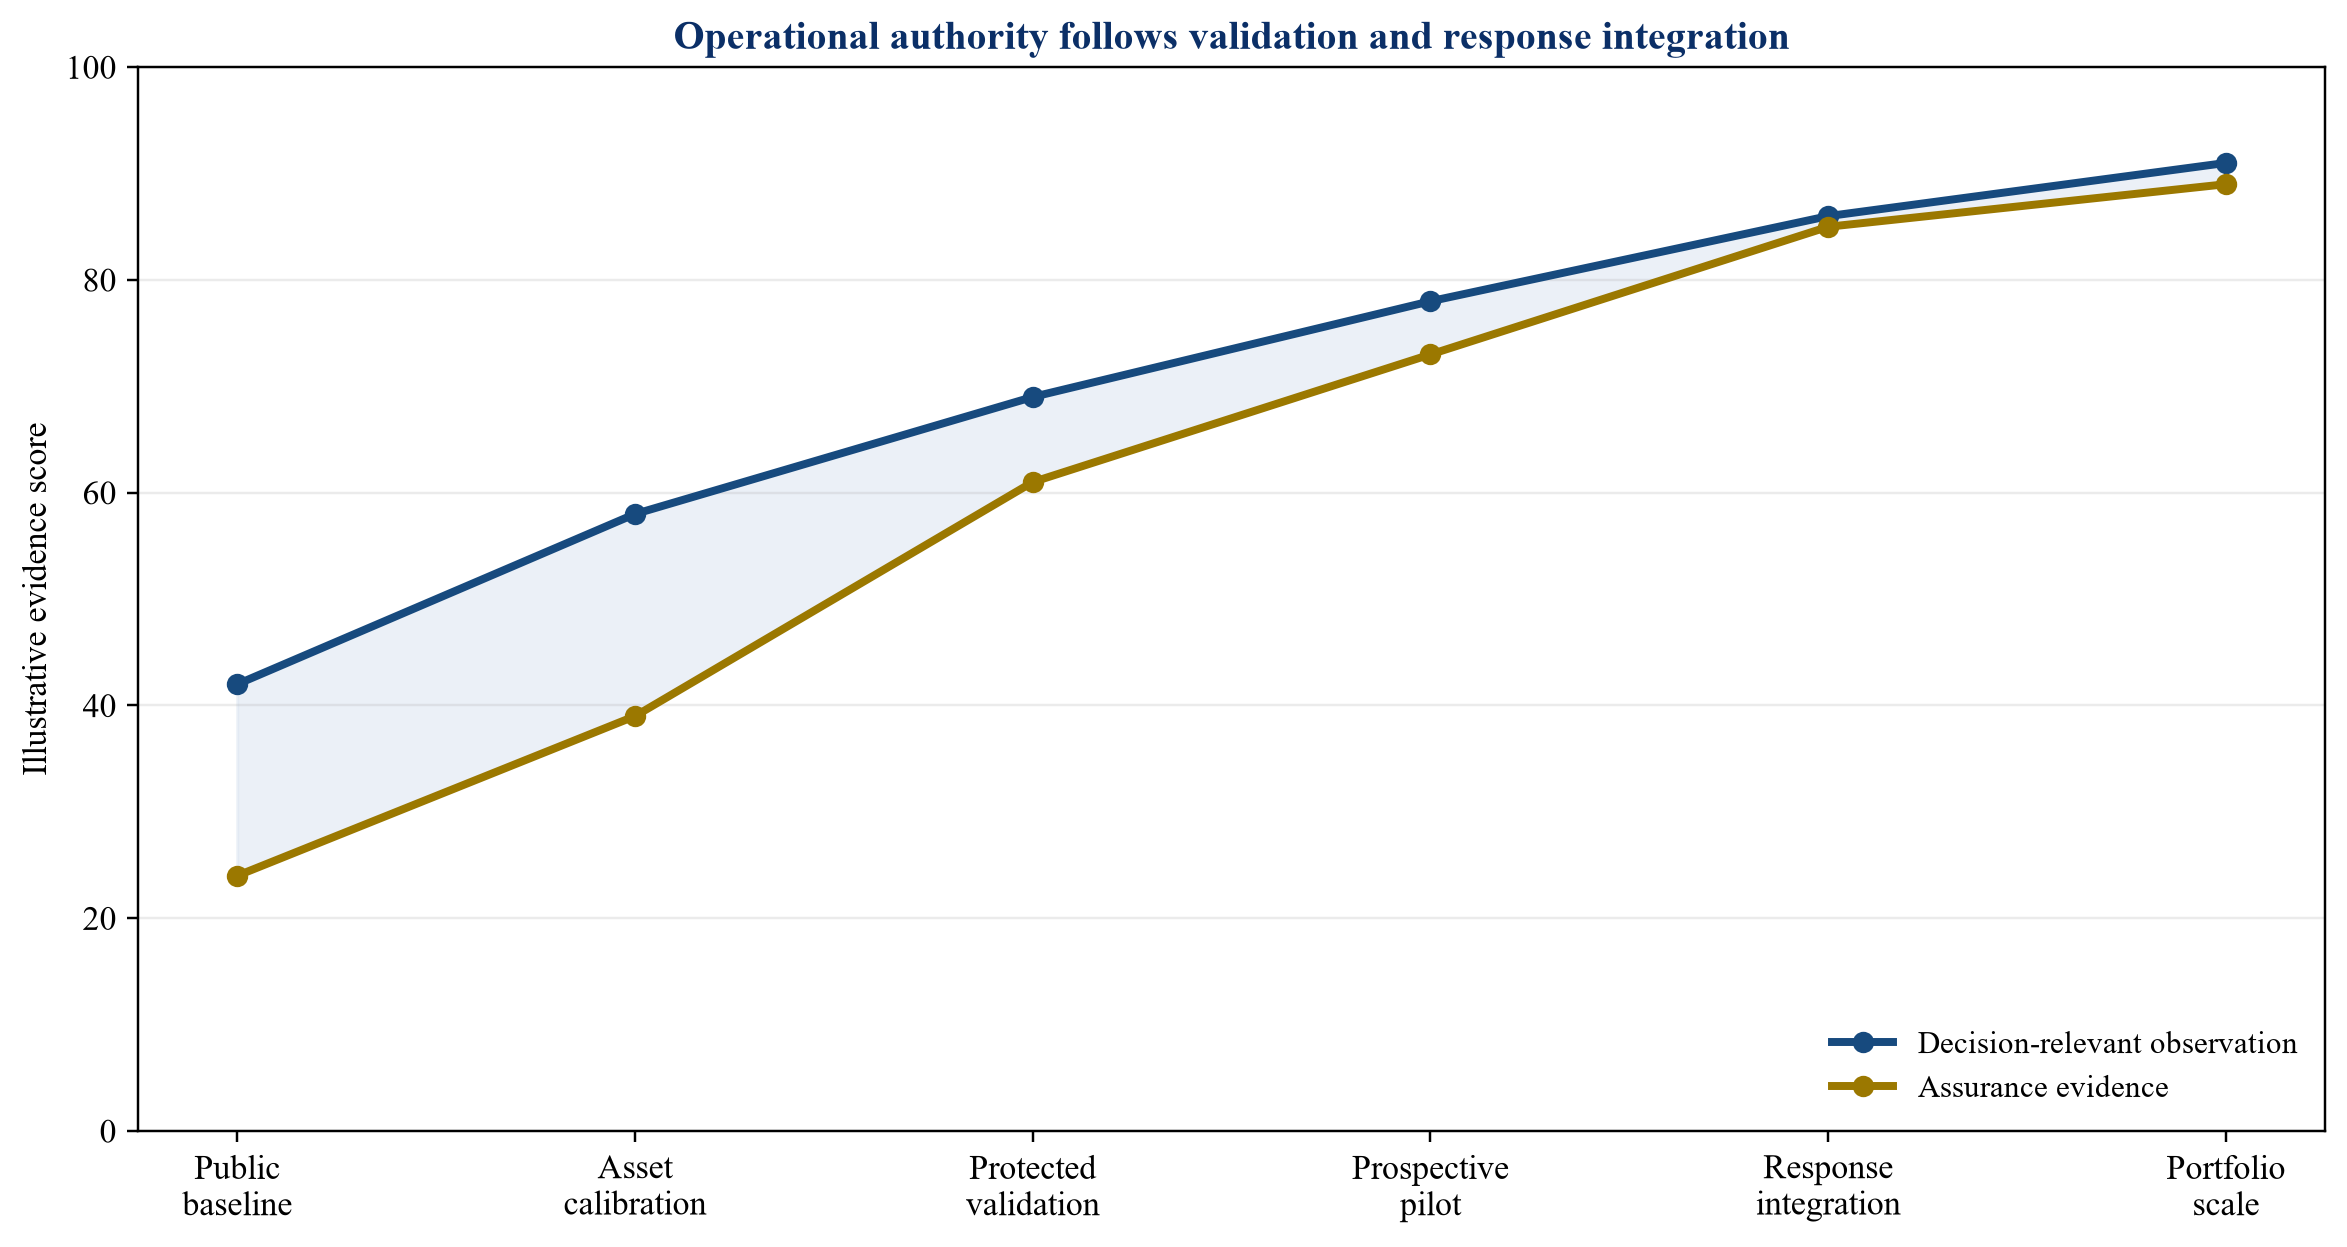
Values are hypothetical author-developed assumptions. They do not represent observed performance for any provider or asset.
21 Build a stage-gated operating model
The define stage names the asset decision, consequence, response time and existing evidence. The baseline stage assembles asset boundaries, historical scenes and field records. The validate stage tests performance across seasons and known events. The pilot stage runs prospective monitoring without changing formal authority. The integrate stage connects validated alerts to operations. The scale stage expands only after finance and operational outcomes are observed.
Decision rights should remain explicit. The geospatial team owns data and model quality. Engineering owns technical disposition. Operations owns intervention. Compliance owns regulatory interpretation. Finance owns investment and benefit recognition. Internal audit or independent assurance can test the complete chain.
Stage gates protect capital. A failed validation can lead to recalibration, a narrower use or termination. A successful pilot can still stop when response cost exceeds value. Expansion should depend on repeatable onboarding, stable performance and an operating model that does not rely on undocumented analyst judgement.
Table 3. Stage-gated deployment and commercialisation roadmap
| Stage | Core work | Required evidence | Decision | Stop condition |
|---|---|---|---|---|
| Define | Name asset, decision, consequence and response | Approved scope, authority and limitations | Fund a bounded baseline | No material decision or accountable user |
| Baseline | Map assets, sources, history and field evidence | Traceable data register and representative cases | Fund independent validation | Rights, boundaries or reference data are inadequate |
| Validate | Test coverage, detection, attribution, uncertainty and false alerts | Pre-approved scorecard across relevant regimes | Approve a prospective pilot | Performance fails in a material regime |
| Pilot | Run live monitoring in advisory mode | Timely alerts, operational review and complete closure record | Integrate selected alerts | Burden, latency or missed events remain unacceptable |
| Integrate | Connect workflow, controls, contracts and reporting | Named response, audit trail and finance-approved value | Expand across the portfolio | Authority is unclear or value is unobserved |
| Scale | Refresh models, suppliers and assurance | Repeatable onboarding, resilience and realised outcomes | Commercialise, renew or retire | Dependency or lifecycle cost exceeds benefit |
The stages are author-developed and should be adapted to the asset, jurisdiction and risk.
22 Plan the first ninety days
Days one to fifteen should define two or three decisions rather than a general platform. The team selects representative assets, maps existing evidence and assigns engineering, operations, data, security and finance owners. It records sensor, revisit, latency and ground-truth requirements.
Days sixteen to thirty-five should assemble historical imagery and field events. The team verifies asset boundaries, timestamps, licences and reference data. It creates a blind validation set and approves metrics before processing results. Procurement can invite providers to a common test.
Days thirty-six to sixty should run retrospective validation and analyse failure modes. The team reviews false alerts, missed events, attribution, analyst effort and geographic variation. It selects the narrowest use that passes the gate. Days sixty-one to ninety should run prospective advisory monitoring, measure latency and response, and prepare a financing or procurement decision.
23 Define credible success conditions
Technical success requires traceable data, effective coverage, validated performance and disclosed uncertainty. Operational success requires alerts that reach a named owner, lead to proportionate action and close with evidence. Financial success requires an observed improvement after imagery, integration, validation and response cost.
Governance success requires version control, access control, model monitoring and a clear authority boundary. Strategic success can include wider asset coverage, stronger diligence, independent evidence and a reusable response workflow. None of these outcomes should be claimed from a demonstration alone.
The programme should state evidence that would disprove its thesis. Examples include repeated missed events, unacceptable false-alert burden, poor transfer to a new geography, inability to attribute observations, unresolved security issues, or lifecycle cost above realised benefit. These conditions keep the success definition stable.
24 Recognise common failure modes
The first failure is buying imagery before defining the decision. The second is treating nominal revisit as effective coverage. The third is using a visually persuasive dashboard without independent validation. The fourth is confusing a detected change with its cause.
Other failures include outdated asset boundaries, mixed acquisition dates, missing uncertainty, weak ground truth, unreported analyst intervention and models transferred across geographies without testing. Construction monitoring can overstate invisible work. Emissions monitoring can overstate non-detection. Ground-motion monitoring can overstate structural meaning.
Operating models fail when alerts lack owners or remain open. Commercial models fail when every asset requires bespoke analyst work. Transaction diligence fails when satellite findings are accepted without specialist follow-up. The assurance gate prevents these errors by tying every observation to validation, response and authority.
25 Implications for owners, investors and advisers
Asset owners should treat Earth observation as an additional instrument network. It can extend visibility, direct inspections and create an independent record. The monitoring programme should be designed with the engineers and operators who will act on its outputs.
Investors and lenders should examine source rights, effective coverage, validation, unresolved alerts, response performance and lifecycle cost. They should distinguish public-data analytics from proprietary evidence. A large image archive has limited value when it lacks asset mapping, ground truth and an integrated response process.
Advisers can connect technical evidence with capital decisions. A useful mandate can structure provider procurement, validate a portfolio, build a covenant evidence pack, quantify lifecycle economics, test a target's data and model assets, and create staged investment or transaction terms. Claims should remain tied to observed evidence and current specialist advice.
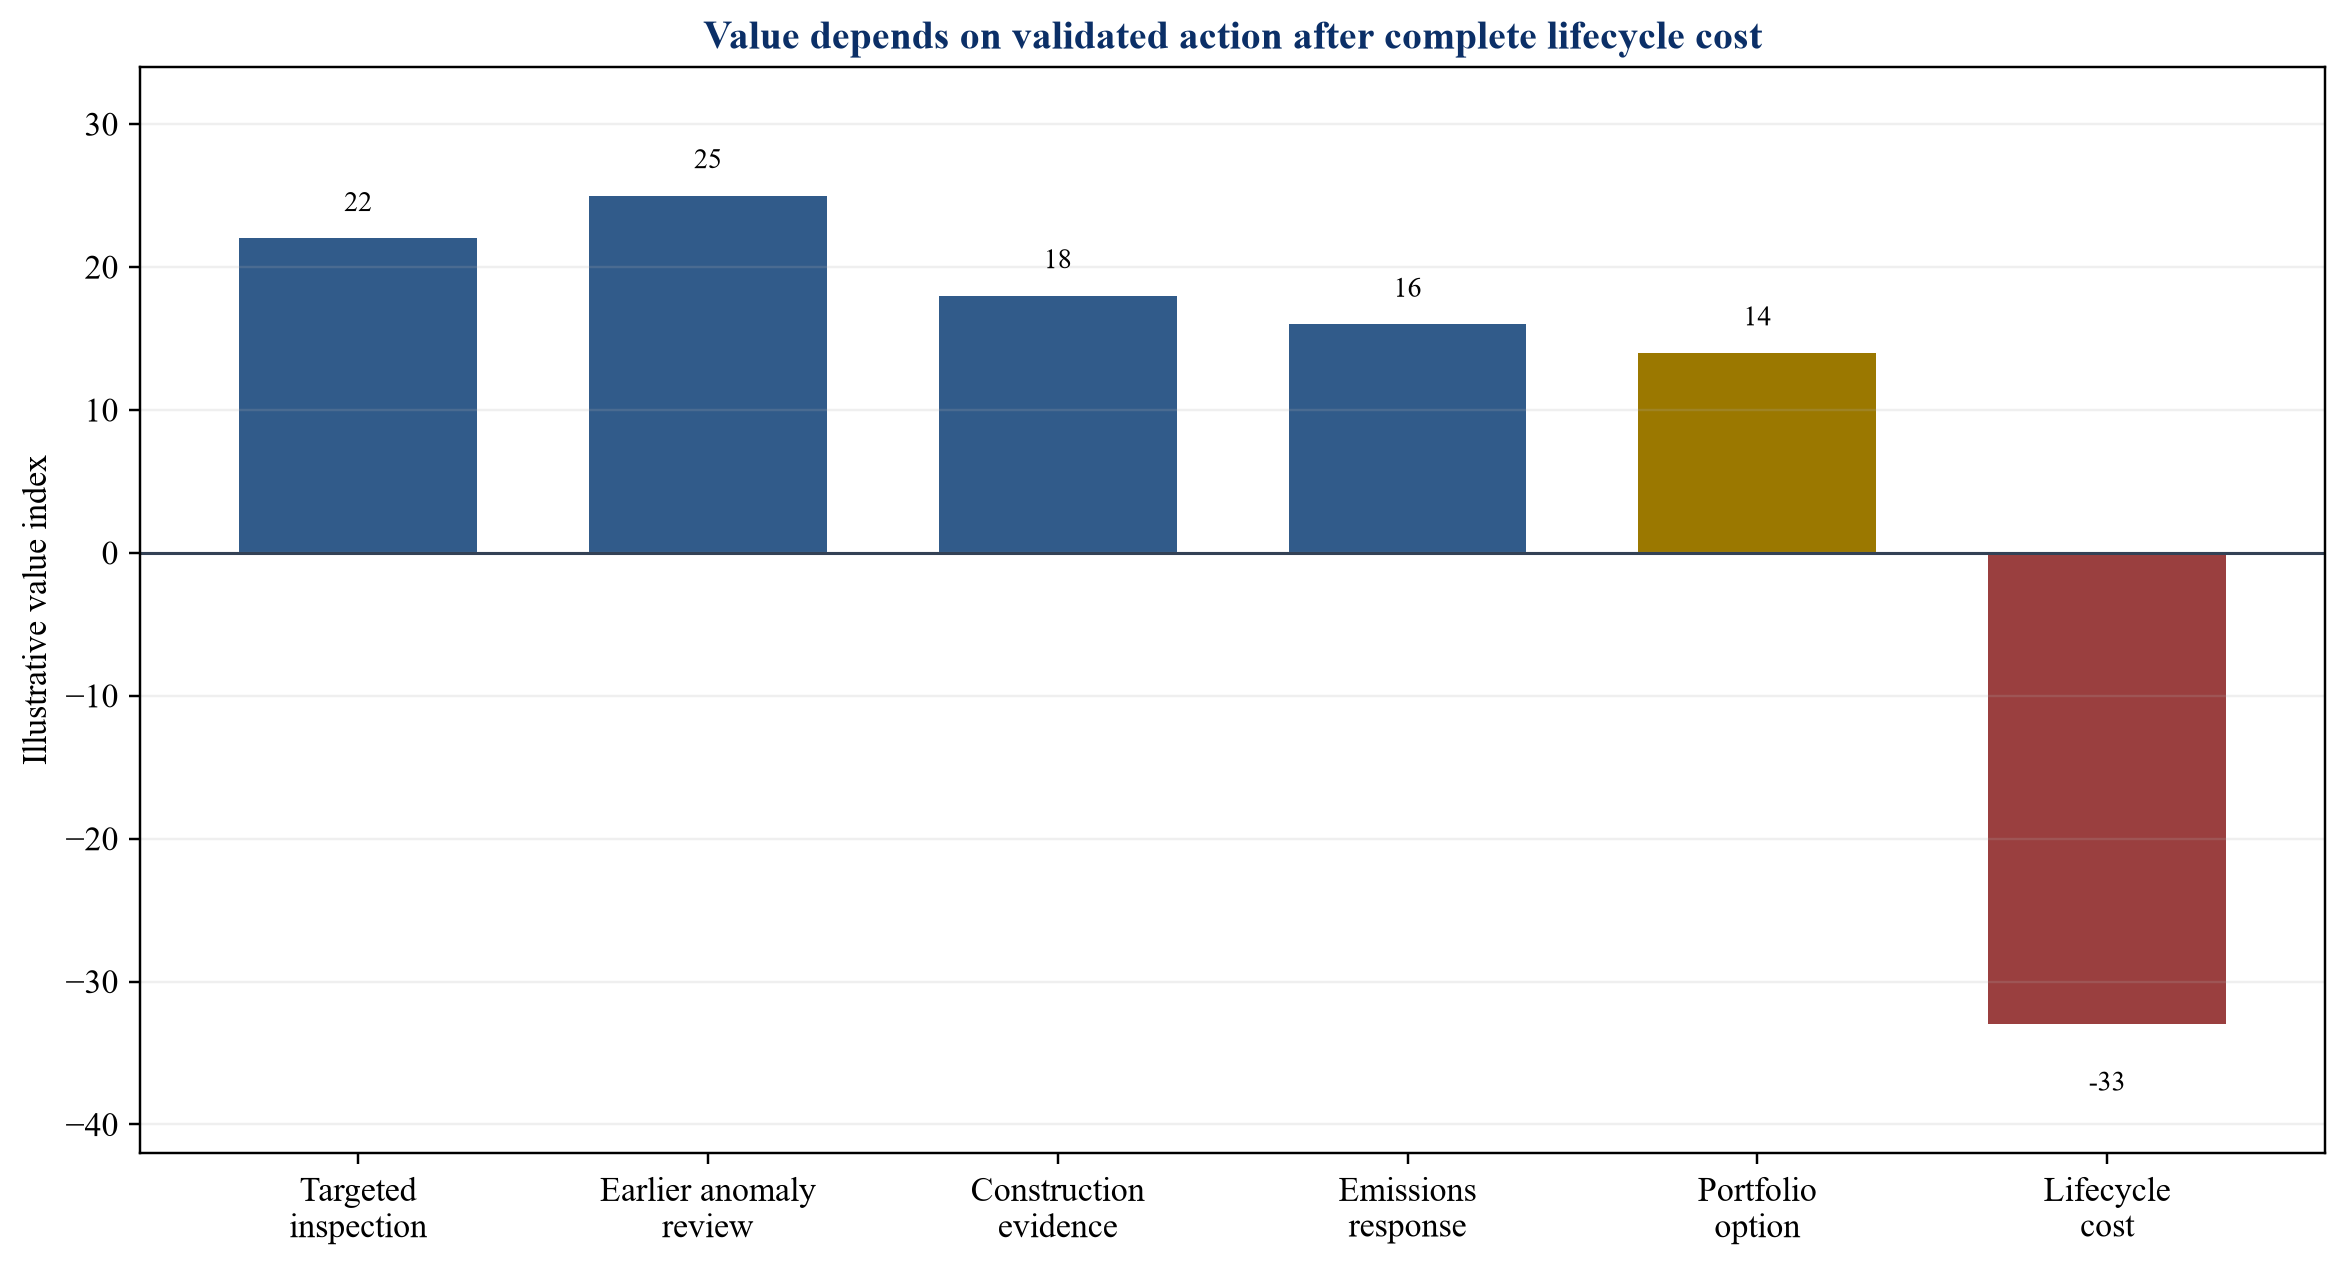
Amounts are hypothetical author-developed index points. They are not forecasts, market quotations or performance claims.
26 Limitations
This paper does not establish that a specific satellite, provider, model or alert is fit for an asset decision. Performance depends on sensor, orbit, processing, geography, atmosphere, surface, event magnitude, asset data and validation. Public programmes have different objectives and should not be treated as vendor warranties.
Remote sensing observes surface or atmospheric signals. It may not reveal concealed equipment, subsurface condition, full structural behaviour or contractual completion. Non-detection does not establish absence. Anomaly detection does not establish cause. Regulatory acceptance and evidential requirements vary by jurisdiction and can change.
The figures and tables are decision aids using hypothetical author-developed assumptions. They do not represent measured performance, pricing or expected returns. Asset action and commercial structures require current engineering, environmental, legal, regulatory, cybersecurity, tax, accounting and insurance advice.
Conclusion
Satellite monitoring can widen the field of view for energy and water infrastructure. It can observe reservoirs, screen water conditions, identify ground movement, support pipeline geohazard management, detect some large methane events and document visible construction. Its commercial value depends on the decision system around the observation.
The Space-to-Decision Assurance Gate establishes that system. It defines the decision, records the measurement chain, matches resolution and latency, validates against independent evidence, routes alerts to accountable owners and measures value after full lifecycle cost. The result is a disciplined evidence layer that complements field instruments and specialist judgement while strengthening oversight, financing and transaction diligence.
References
- NASA, Surface Water and Ocean Topography Mission. https://science.nasa.gov/mission/swot/
- NASA Jet Propulsion Laboratory, SWOT Mission. https://swot.jpl.nasa.gov/
- NASA Earthdata, SWOT Science Data Products User Handbook, 2024. https://earthdata.nasa.gov/s3fs-public/2024-06/D-109532_SWOT_UserHandbook_20240502.pdf
- NASA Physical Oceanography Distributed Active Archive Center, SWOT Data. https://podaac.jpl.nasa.gov/SWOT
- NASA Global Water Monitor, Lakes and Reservoirs. https://earth.gsfc.nasa.gov/gwm/lake/Index
- US Geological Survey, WaterMAP: Water Monitoring Above the Planet, 2026. https://www.usgs.gov/mission-areas/water-resources/science/watermap-water-monitoring-above-planet
- US Geological Survey, WaterMAP Application. https://apps.usgs.gov/watermap/
- US Geological Survey, Landsat Water Resources. https://www.usgs.gov/landsat-missions/landsat-water-resources
- NASA, Monitoring Global Terrestrial Surface Water Height Using Remote Sensing, 2025. https://www.earthdata.nasa.gov/s3fs-public/2025-06/arset-swot-agenda.pdf
- European Space Agency, Sentinel-1 Mission. https://www.esa.int/Applications/Observing_the_Earth/Copernicus/Sentinel-1
- Copernicus, Sentinel-1 Mission Guide. https://sentinels.copernicus.eu/copernicus/sentinel-1
- Copernicus Land Monitoring Service, European Ground Motion Service. https://land.copernicus.eu/en/products/european-ground-motion-service
- European Space Agency, InSAR Principles and Applications. https://www.esa.int/Applications/Observing_the_Earth/Copernicus/Sentinel-1/Interferometry
- European Space Agency, Sentinel-2 Mission. https://www.esa.int/Applications/Observing_the_Earth/Copernicus/Sentinel-2
- European Space Agency, Sentinel-3 Mission. https://www.esa.int/Applications/Observing_the_Earth/Copernicus/Sentinel-3
- European Space Agency, Sentinel-5P Mission. https://www.esa.int/Applications/Observing_the_Earth/Copernicus/Sentinel-5P
- European Commission, Copernicus Emergency Management Service. https://emergency.copernicus.eu/
- UNEP International Methane Emissions Observatory, Methane Alert and Response System. https://www.unep.org/topics/energy/methane/how-mars-works
- UNEP, IMEO Technical Documentation for Methane Satellite Detection and Quantification, 2024. https://wedocs.unep.org/items/c77a439f-9689-4164-874d-d49045e6d097/full
- UNEP, MARS Mitigation Action. https://www.unep.org/topics/energy/methane/mars-mitigation-action
- UNEP, Eye on Methane Data Platform. https://methanedata.unep.org/
- European Parliament and Council, Regulation (EU) 2024/1787 on Methane Emissions in the Energy Sector. https://eur-lex.europa.eu/eli/reg/2024/1787/oj/eng
- International Energy Agency, Global Methane Tracker 2025. https://www.iea.org/reports/global-methane-tracker-2025
- NASA Jet Propulsion Laboratory, Carbon Mapper Coalition Satellite Observations. https://www.jpl.nasa.gov/missions/tanager-1/
- NASA Jet Propulsion Laboratory, OPERA Surface Displacement Product. https://www.jpl.nasa.gov/go/opera/products/
- NASA OPERA, Surface Displacement Product Specification. https://opera.jpl.nasa.gov/products/surface-disturbance/
- Pipeline and Hazardous Materials Safety Administration, Integration of Innovative Remote Sensing Technologies for Right-of-Way Patrols, 2026. https://www.phmsa.dot.gov/regulations/federal-register-documents/2026-08080
- Pipeline and Hazardous Materials Safety Administration and Pipeline Research Council International, Geohazard Strategic Research Programme, 2023. https://primis-meetings.phmsa.dot.gov/meetings/0499bb79-3321-4148-9120-766398d2e3b9/files/02c3a71c-9ae4-4e6d-891c-5e895bd822ce/40_-_Koduru-PHMSA_RD_PRCI_Geohazard_SRP_October_2023.pdf
- United States Department of Transportation, Pipeline Safety Management Systems. https://www.phmsa.dot.gov/pipeline/sms/pipeline-safety-management-systems
- US Geological Survey, Landslide Hazards Program. https://www.usgs.gov/programs/landslide-hazards
- US Geological Survey, National Water Dashboard. https://dashboard.waterdata.usgs.gov/
- World Meteorological Organization, State of Global Water Resources 2024. https://wmo.int/publication-series/state-of-global-water-resources-2024
- World Bank, Remote Sensing for Infrastructure Monitoring. https://www.worldbank.org/en/topic/transport/brief/geospatial-technology
- International Commission on Large Dams, Dam Surveillance Guidance. https://www.icold-cigb.org/
- Committee on Earth Observation Satellites, Analysis Ready Data. https://ceos.org/ard/
- Group on Earth Observations, Earth Observations for Infrastructure and Water. https://earthobservations.org/
- Open Geospatial Consortium, SpatioTemporal Asset Catalog Specification. https://www.ogc.org/standards/stac/
- Open Geospatial Consortium, SensorThings API. https://www.ogc.org/standards/sensorthings/
- International Organization for Standardization, ISO 19157 Geographic Information Data Quality. https://www.iso.org/standard/78900.html
- International Organization for Standardization, ISO 31000 Risk Management. https://www.iso.org/iso-31000-risk-management.html
- International Organization for Standardization, ISO/IEC 27001 Information Security Management Systems. https://www.iso.org/isoiec-27001-information-security.html
- International Organization for Standardization, ISO/IEC 42001 Artificial Intelligence Management Systems. https://www.iso.org/standard/81230.html
- NIST, Artificial Intelligence Risk Management Framework 1.0, 2023. https://www.nist.gov/itl/ai-risk-management-framework
- NIST, Guide to Operational Technology Security, SP 800-82 Revision 3, 2023. https://doi.org/10.6028/NIST.SP.800-82r3
- European Parliament and Council, Regulation (EU) 2024/1689, Artificial Intelligence Act. https://eur-lex.europa.eu/eli/reg/2024/1689/oj
- IFRS Foundation, IFRS 13 Fair Value Measurement. https://www.ifrs.org/issued-standards/list-of-standards/ifrs-13-fair-value-measurement/
- IFRS Foundation, IAS 36 Impairment of Assets. https://www.ifrs.org/issued-standards/list-of-standards/ias-36-impairment-of-assets/
- IFRS Foundation, IAS 37 Provisions, Contingent Liabilities and Contingent Assets. https://www.ifrs.org/issued-standards/list-of-standards/ias-37-provisions-contingent-liabilities-and-contingent-assets/
About the Author
Chennakeshav (CK) is a corporate finance and investment banking executive with 25+ years of global experience in deal origination, structuring and execution across M&A, growth capital and corporate strategy. He has led value-creation mandates for founders, corporates and funds — bridging the boardroom view to hands-on execution and close.
His career spans Morgan Stanley, HSBC, Lloyds Banking Group, EWEC, ADQ portfolio companies and Emirates Growth Fund, across TMT, real estate, fintech, deeptech, cleantech, infrastructure and energy. He has partnered with C-suite leaders, private equity and venture funds, sovereign wealth funds and family offices to finance complex fund raises and scale-up ventures, and has led M&A due diligence, post-merger integration and business-transformation initiatives to create value.
At Matchpoint Partners he is Managing Partner, leading the firm's corporate finance, M&A and capital-raising practice. He holds an MBA from London Business School, an engineering degree from VTU and a Master of Laws (LLM, in progress) from UCL London.
An active start-up mentor, CK mentors at Techstars, DIFC FinTech Hive, Startup Grind, Founder Institute and IN5, serves as Entrepreneur Mentor in Residence (EMiR) at London Business School, and judges the Entrepreneurship World Cup.
