

Introduction
Variable renewable generation creates a timing problem. Electricity must be scheduled, balanced and settled while wind and solar output remain uncertain. A forecast reduces that uncertainty, yet its commercial effect depends on the market, the contract, the asset configuration and the decisions available to the operator. The same improvement in statistical accuracy can have different value for a fixed-price project, a merchant plant, a hybrid renewable-plus-storage facility and a utility portfolio.
International Energy Agency guidance on renewable integration links improved forecasting with shorter market intervals, closer-to-real-time trading and efficient balancing. The International Renewable Energy Agency describes AI-enhanced forecasting as an input to dispatch, reserve procurement, storage scheduling and renewable-market participation. National Renewable Energy Laboratory work distinguishes deterministic forecasts from probabilistic forecasts that describe a distribution of possible output. These sources establish the operating relevance of forecasts. The financing question requires an additional step: which forecast-driven decision changes a cash flow that supports equity value, debt service or system cost?
This paper answers that question through a decision architecture. It treats the forecast as one component of a wider system that includes data, market rules, contracts, controls, storage, people, settlement and governance. The analysis is designed for utility-scale wind and solar, hybrid assets, aggregators and portfolios. Project-specific engineering, market, tax, accounting, legal and regulatory advice remains necessary.
1 Start with the financially binding decision
Forecast programmes often begin with model selection. A commercial programme should begin with the decision that becomes financially binding. Examples include the day-ahead nomination, intraday re-trade, reserve offer, storage charge or discharge instruction, curtailment response, maintenance window, hedge volume and liquidity reserve.
Each decision has a gate-closure time, an authorised actor, a volume limit and a settlement consequence. A forecast delivered after the decision deadline has limited value even when it is statistically superior. A forecast produced at the correct time can still lack value where an operator has no market access, the PPA transfers the exposure, the battery is unavailable or the control room cannot act.
The business case should state the counterfactual decision. That counterfactual may be persistence, a vendor forecast, an operator judgement, the system operator's forecast or a contracted nomination. Value is measured against that baseline rather than against perfect foresight.
2 Separate forecast quality from decision quality
Forecast quality describes how predicted output compares with realised output. Common measures include mean absolute error, root mean square error, bias and quantile loss. Decision quality describes whether the forecast produced a better action after considering prices, constraints, transaction costs and risk limits.
A lower average error can coexist with a worse commercial outcome. Large errors during scarcity periods can dominate settlement cost. A model can improve the centre of the distribution while missing ramps that determine reserve and storage value. A forecast can also encourage over-trading where price uncertainty exceeds the value of the improved generation estimate.
The performance report should therefore contain statistical and economic measures. Statistical measures test calibration and drift. Economic measures compare realised settlement, curtailment, trading, reserve and storage outcomes with the approved baseline. Governance should prevent model developers from selecting only the measure that presents their model favourably.
3 Match the horizon to the action
Table 1. Forecast horizons and financially binding decisions
| Horizon | Typical information | Executable decision | Primary value channel | Evidence required |
|---|---|---|---|---|
| Seasonal to monthly | Climate signals, resource distribution, maintenance and price scenarios | Liquidity plan, hedge envelope, maintenance programme and covenant forecast | Financing resilience and availability | Calibrated distributions, historical back-test and downside linkage |
| Day ahead | Numerical weather prediction, plant availability, constraints and market prices | Energy nomination, reserve offer and storage schedule | Imbalance, dispatch and market revenue | Timestamped forecast, market gate and approved optimisation rule |
| Intraday | Updated weather, telemetry, outages and market depth | Re-trade, re-nomination, reserve adjustment and flexible-load instruction | Imbalance and avoided replacement cost | Tradable volume, liquidity, transaction cost and decision log |
| Minutes to hours | Radar, satellite, sky imagery, local sensors and live output | Battery response, curtailment management and rapid reserve action | Ramp management, curtailment and ancillary services | Latency, control integration, physical limits and settlement trace |
| Real time | SCADA, state estimation, frequency and dispatch instruction | Automatic or operator-approved control action | Reliability and balancing | Cybersecurity, control authority, fail-safe behaviour and audit trail |
The table is a general decision map. Market intervals, gate closures, products and responsibilities vary by jurisdiction and contract.
The table creates a practical distinction between planning forecasts and operating forecasts. A seasonal distribution can support cash planning while remaining unsuitable for dispatch. A minute-ahead nowcast can improve battery control while adding little to annual debt sizing. The programme needs a separate service level for each decision horizon.
Time alignment also determines data quality. Every observation, forecast, decision and settlement item should use a consistent clock and interval. Daylight-saving changes, missing telemetry and retrospective data corrections can create false performance conclusions if timestamps are poorly governed.
4 Build the forecast-to-cash chain
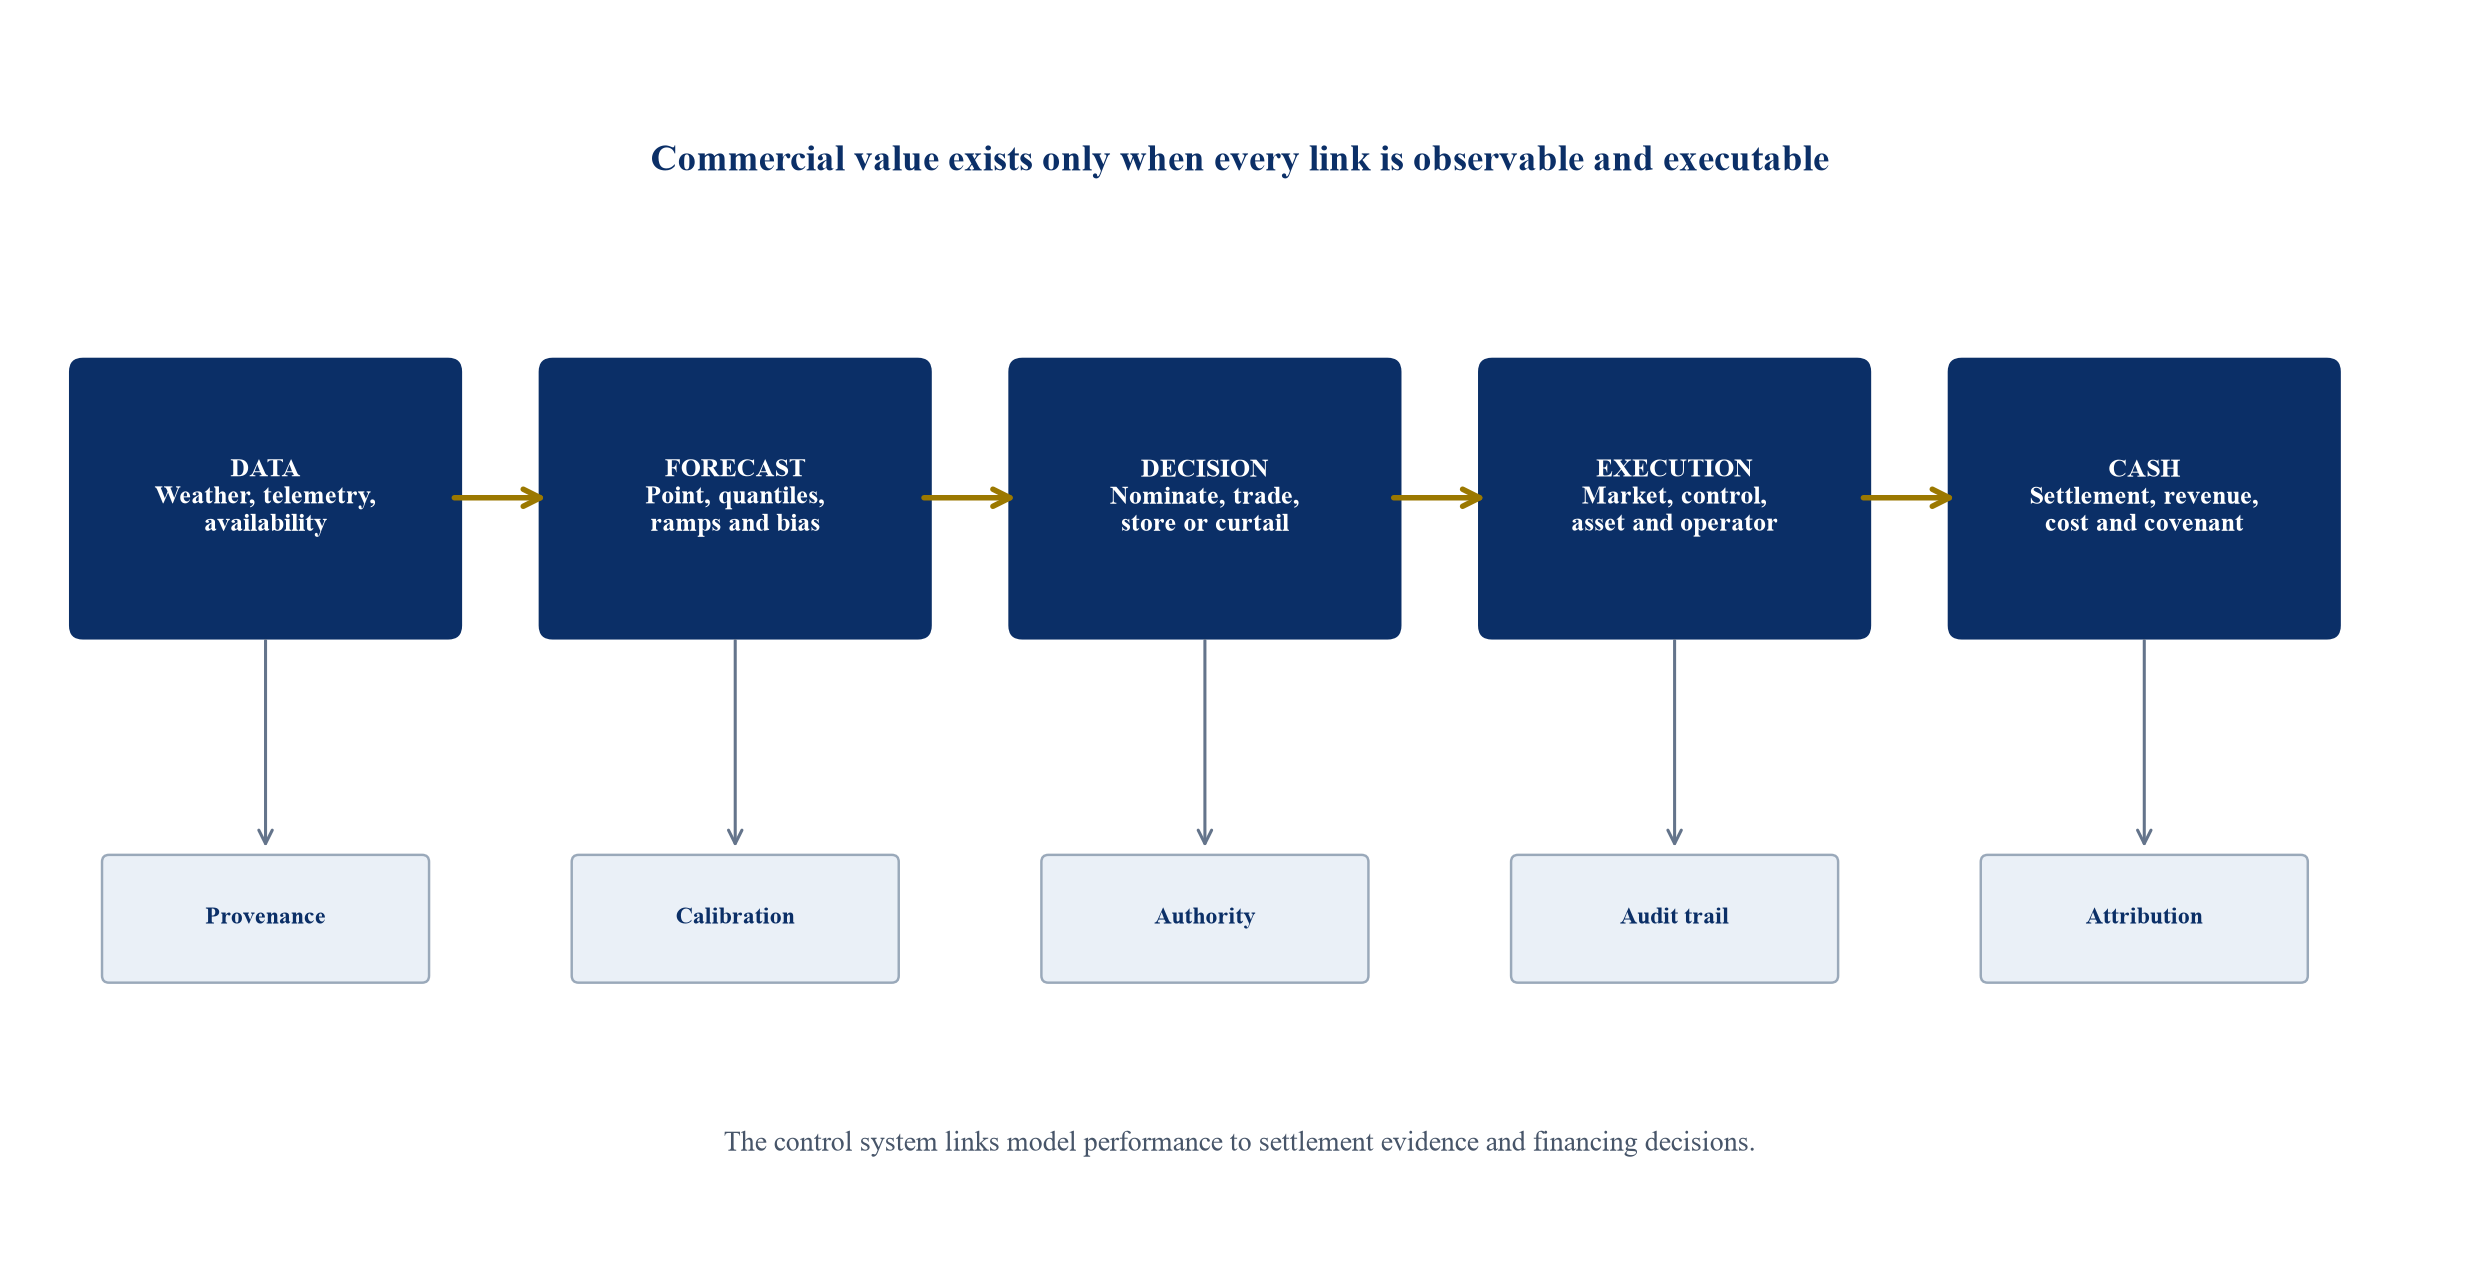
The figure is an author-developed control framework. Each connection requires asset-specific technical, market, contractual and governance evidence.
The chain begins with weather, telemetry, asset availability and market data. The forecast layer converts those inputs into point estimates, probability distributions, ramp warnings and bias adjustments. The decision layer combines forecasts with prices, contracts, risk limits and physical constraints. Execution occurs through market orders, nominations, plant controls, storage dispatch or operator instructions. Settlement converts execution into revenue, cost and cash.
Every hand-off can destroy value. Incomplete availability data can make a weather forecast appear inaccurate. An optimisation engine can recommend an infeasible battery schedule. A trader can lack authority to adjust the position. A market order can fail. Settlement data can arrive in a form that prevents attribution.
The investment case should allocate funding across the complete chain. Spending on a forecast model without telemetry, integration, decision rights and measurement can produce an impressive technical pilot with no durable cash outcome.
5 Define the baseline before procurement
The baseline establishes what would happen without the proposed system. It should be frozen before a vendor or internal team is evaluated. Baselines may differ by horizon, asset and season because the incumbent method can vary.
The baseline dataset should include forecasts available at the decision time, realised generation, availability, curtailment instructions, prices, nominations, trades, storage state, outages and settlement. Retrospective forecasts that use data unavailable at the decision time are unsuitable for commercial attribution.
An investment committee should require a shadow period. During that period, the new system generates timestamped recommendations without controlling live positions. The results are evaluated against the baseline using pre-agreed statistical and economic measures. A controlled live phase can follow within limits that protect the asset and market position.
6 Use probabilistic forecasts for asymmetric decisions
Point forecasts provide a single expected output. Probabilistic forecasts estimate a range or distribution. National Renewable Energy Laboratory research describes Bayesian and machine-learning methods for producing probabilistic solar and wind forecasts at day-ahead, intraday and hour-ahead timescales. The distribution matters when the cost of being short differs from the cost of being long.
A battery schedule can use quantiles rather than the mean. A conservative quantile may protect a firm delivery obligation. A wider distribution may justify holding more reserve or liquidity. The selected quantile should follow the actual loss function, price regime and risk appetite.
Calibration is essential. A stated 90 per cent interval should contain realised output at approximately the expected frequency over a representative sample. Coverage alone is insufficient because a very wide interval can be well calibrated and commercially unhelpful. Sharpness, bias and performance during ramps should also be reported.
7 Model ramps and regime changes
Average errors can conceal operationally important ramps. Cloud fronts, wind cut-out, storms, dust, fog and plant outages can change output quickly. These events affect reserve, intraday trading, storage and reliability.
The model should identify the event definition that matters to the asset. That definition may be a megawatt change over a specified interval, a probability of breaching a delivery band or a combination of weather and plant conditions. Detection should be assessed through missed events, false alarms, lead time and financial consequence.
Regime changes require explicit monitoring. New turbine controls, panel degradation, repowering, vegetation, soiling, curtailment policy, nearby construction and climate patterns can alter the relationship between weather and output. A model governance process should detect degradation and define retraining, recalibration or fallback.
8 Attribute imbalance value
Imbalance value arises when a better forecast changes a scheduled or traded position and reduces the cost of the residual difference between contracted and realised delivery. The calculation should follow the applicable market settlement and contract.
The attribution requires four records: the position before the forecast-driven decision, the approved forecast, the executed change and the final settlement. The analyst should compare the actual result with a reconstructable baseline. Transaction fees, bid-ask spread, liquidity limits and execution failures should be included.
The result should be reported by market interval, season, asset and price condition. A model may deliver most value during a small number of volatile intervals. Concentration can support the business case while increasing dependence on rare events and making annualisation uncertain.
9 Measure curtailment separately
Curtailment has several causes. System operators can instruct reductions for network or reliability reasons. Market prices can make production uneconomic. Plant controllers can cap output to preserve equipment or provide upward flexibility. Contract terms determine whether lost production is compensated.
Forecasting can help when earlier knowledge changes a decision. It may improve congestion anticipation, allow storage to create headroom, move flexible demand, change an offer or support a more accurate estimate of available power. Forecasting cannot remove a network constraint by itself.
The curtailment benefit should therefore identify the event, cause, decision and contractual treatment. Avoided lost megawatt-hours, improved storage capture and compensation should not be counted twice. World Bank guidance on power projects treats curtailment allocation and compensation as material bankability questions; the forecast programme should support that contract analysis rather than obscure it.
10 Integrate storage through co-optimisation
Storage converts forecast information into an executable intertemporal decision. The optimisation should consider expected renewable output, prices, delivery obligations, reserve products, state of charge, power and energy limits, efficiency, degradation and grid constraints.
The objective function should reflect the asset's contract. A merchant battery may optimise gross margin subject to risk limits. A hybrid PPA may prioritise delivery firmness. A regulated utility may minimise system cost and reliability risk. A lender may focus on cash available for debt service under downside conditions.
Back-tests should include realistic information timing and operational limits. Perfect-foresight dispatch materially overstates achievable value. Forecast-based value should be compared with a simple approved rule and the existing operating policy.
11 Coordinate flexible demand and sector coupling
Electrolysers, desalination, district cooling, pumping, data centres, industrial loads and electric-vehicle charging can respond to renewable availability when their process constraints permit. Forecasts can move these loads to periods of expected generation or low prices.
The commercial case depends on the flexibility envelope. It should identify minimum run times, product or service requirements, storage, ramp rates, interruption cost and delivery obligations. Energy savings can be outweighed by production loss or equipment wear if the process model is incomplete.
IRENA's flexibility tools and digitalisation work treat demand response, storage and sector coupling as system resources. A project-finance model should convert that system concept into an enforceable operating protocol and revenue allocation between the generator, flexible load, network and service provider.
12 Value reserve and ancillary-service participation
Improved forecasts can increase confidence in the capacity available for reserve or other system services. The asset may need telemetry, control performance, prequalification and a route to market. Opportunity cost matters because energy held for reserve cannot always be sold elsewhere.
The model should estimate availability, activation probability, performance penalties and interaction with energy positions. Revenue should be separated into capacity and activation components where the market uses both. Historical prices should be tested across representative regimes rather than extrapolated from a short high-price period.
Forecasting can also affect reserve procurement by a system operator. IRENA cites evidence that probabilistic solar forecasts can reduce reserve procurement in studied settings. That system value does not automatically become project revenue. The contract or market design must provide a payment mechanism.
13 Create a settlement-grade data model
Table 2. Minimum forecast-to-cash evidence register
| Evidence object | Minimum fields | Control owner | Commercial use |
|---|---|---|---|
| Forecast version | Model, issue time, delivery intervals, point estimate, quantiles and quality flags | Forecast owner | Back-test, calibration and decision reconstruction |
| Asset state | Availability, derating, curtailment, outage, storage state and control mode | Operations | Separate weather error from plant and control effects |
| Decision record | Recommendation, authorised action, limits, override, user and timestamp | Trading or control owner | Prove which forecast changed the position |
| Execution record | Order, nomination, instruction, accepted quantity, price and failure | Market operations | Reconcile intended and completed action |
| Settlement record | Metered output, imbalance, market charge, PPA treatment and payment | Finance | Calculate realised cash effect |
| Model control | Version, data lineage, approval, monitoring, incident and fallback | Model risk owner | Demonstrate governed use and operational resilience |
Retention periods, access controls and data fields should follow applicable market, contract, privacy and cybersecurity requirements.
The evidence register should use immutable identifiers that connect each forecast to its decision and settlement. Corrections should be versioned. Access rights should separate model development, operating approval and financial validation where scale and risk justify segregation.
Settlement-grade data supports vendor payment, internal assurance, lender review and dispute resolution. It also allows management to identify whether value failed because of the model, the decision rule, execution, market liquidity or the contract.
14 Measure value net of implementation cost
The economic case should include data licences, sensors, telemetry, model development, cloud or computing cost, integration, market access, trading cost, control-room staffing, cybersecurity, assurance and ongoing maintenance. Costs should be assigned to the horizons and assets they support.
Benefits should be reported gross and net. Shared platform costs can support several assets, while incremental use costs may be small. Allocation should remain transparent so that a portfolio platform does not make every individual asset appear artificially attractive.
The model should distinguish realised cash, avoided cost, accrued settlement, expected value and operational option value. Only realised and contractually supportable cash should flow directly into historical debt-service evidence. Expected and option values can inform investment decisions with suitable risk treatment.
15 Build a value bridge
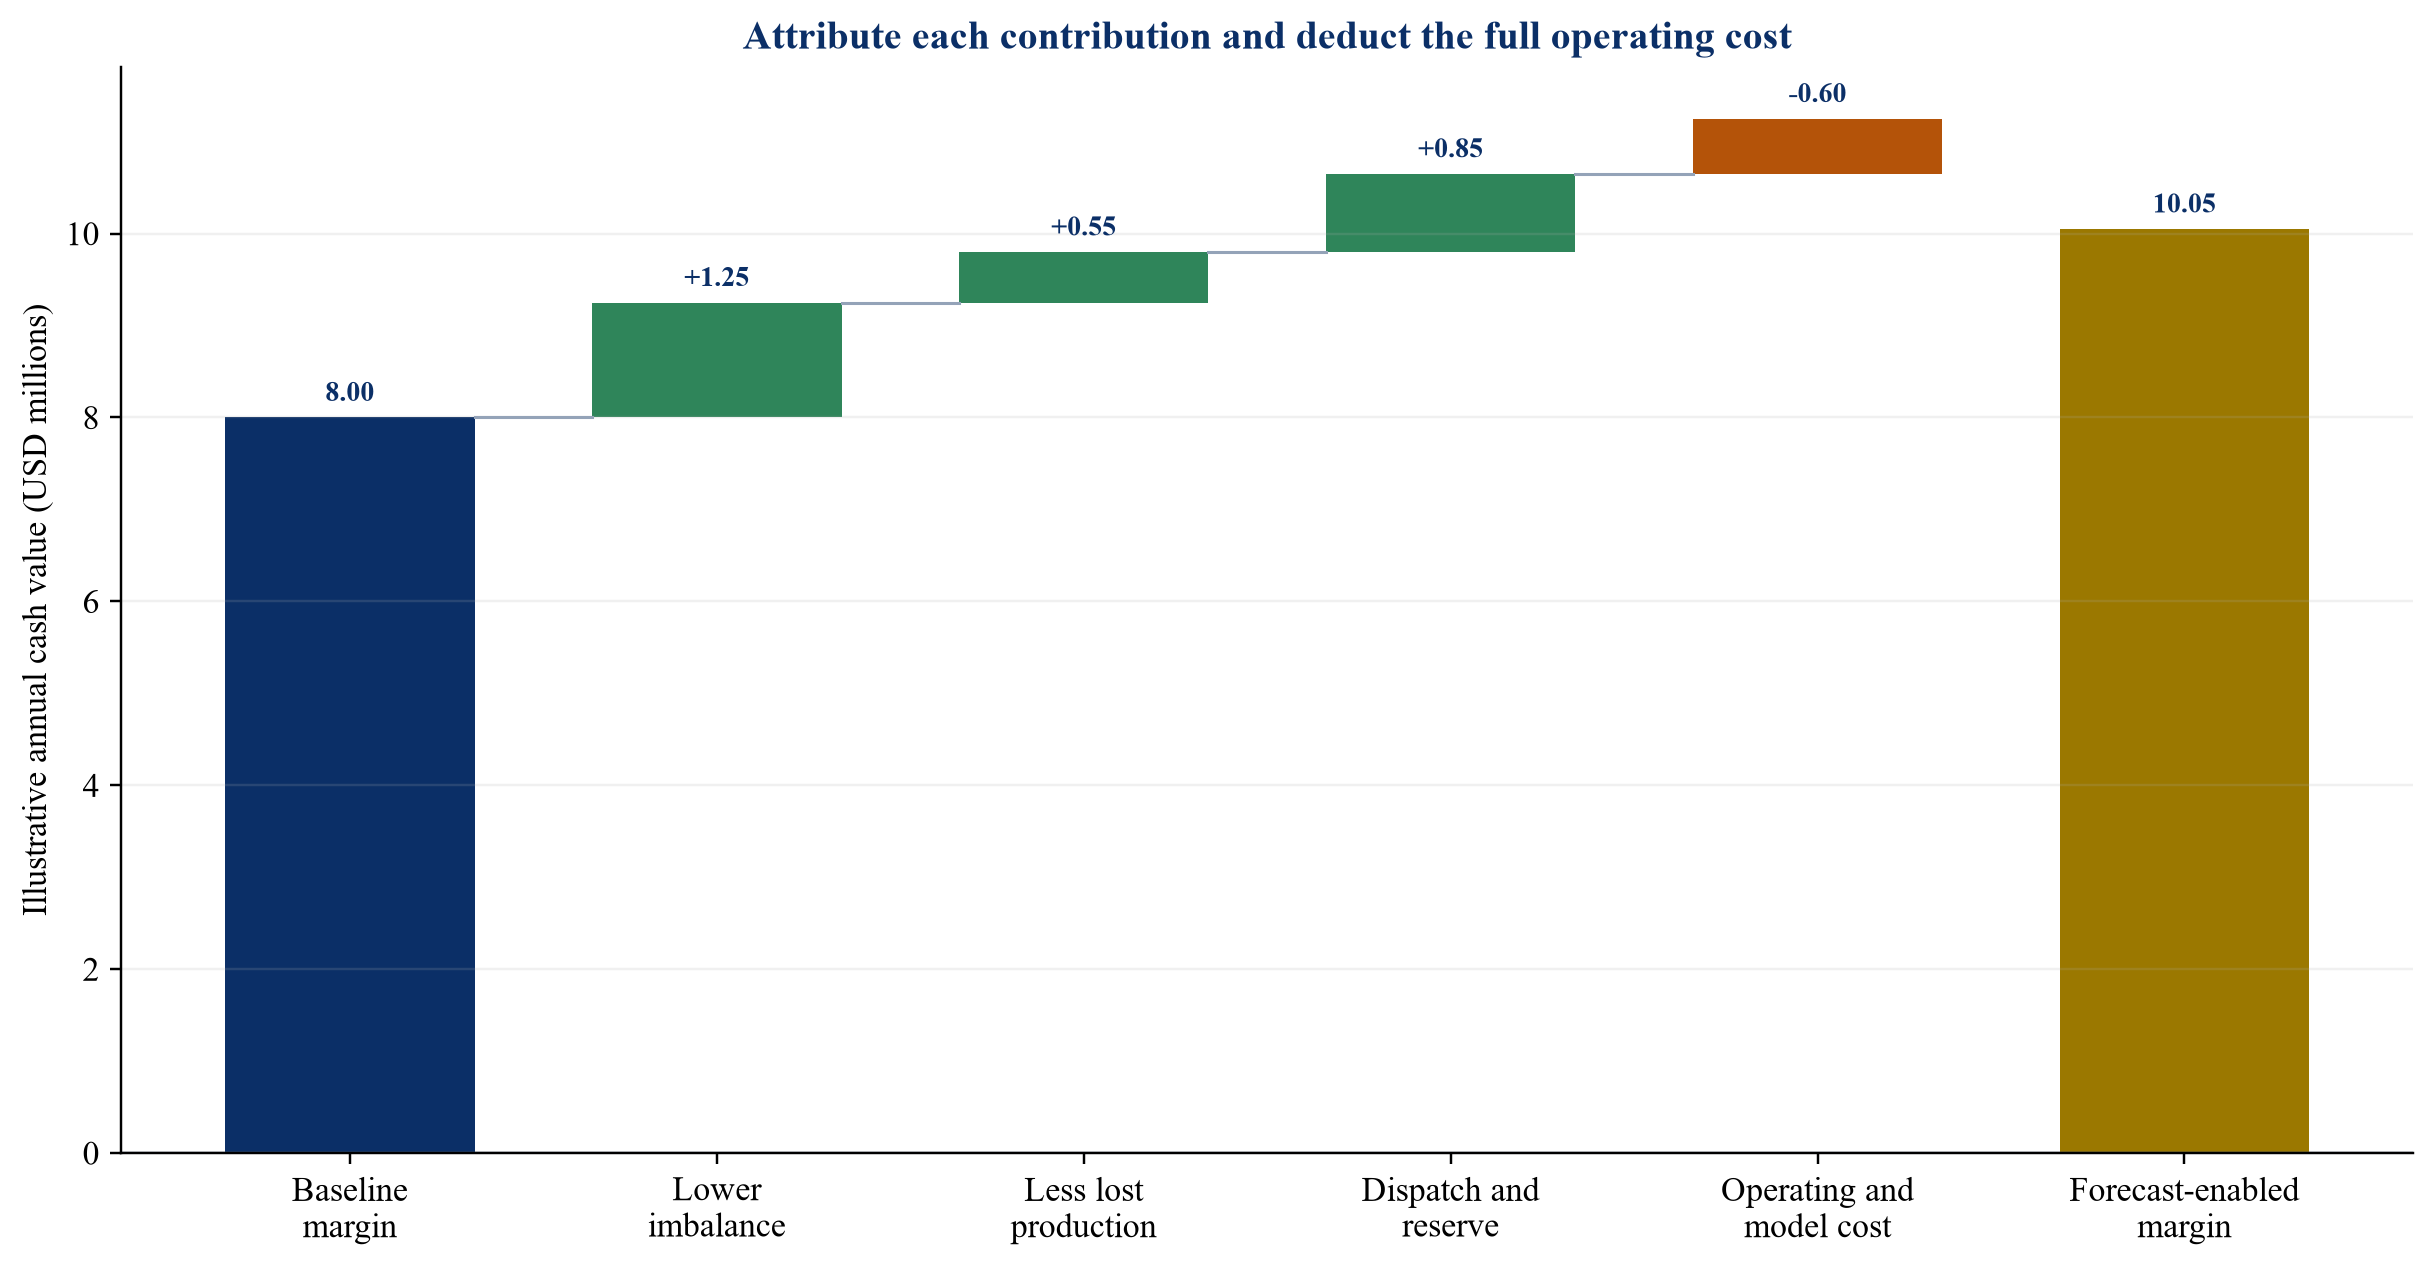
The values are author-developed illustrations for method demonstration. They do not represent a client, asset, market forecast or current quotation.
The bridge starts with the cash margin under the approved baseline. It adds measured reductions in imbalance cost, avoided lost production and incremental dispatch or reserve value. It deducts the full operating and model cost. The final amount represents forecast-enabled margin under the illustrative assumptions.
The bridge should be reconciled to finance records. Operational estimates can lead settlement and cash collection, so management should distinguish provisional and final values. Benefits that depend on the same megawatt-hour must be reconciled.
This method allows a board to assess scale. A statistically significant model improvement may be financially immaterial for a protected PPA. A modest error improvement can be valuable in a volatile merchant market when it affects the intervals with the highest exposure.
16 Link the case to revenue contracts
The PPA or route-to-market agreement allocates forecasting, nomination, imbalance, curtailment and settlement responsibility. The project company may retain these risks, transfer them to an offtaker or share them through bands, caps and service fees.
Contract review should identify data rights, forecast obligations, deemed energy, availability, dispatch, curtailment, imbalance pass-through, change in market rules and termination. A forecast benefit should be attributed to the party that bears the associated exposure and can execute the decision.
Service-provider contracts should define inputs, uptime, latency, version control, data ownership, security, performance measures, audit rights and exit assistance. A guarantee of accuracy is unsuitable without a precise dataset, horizon and scoring rule. Commercial terms can combine a base fee with carefully measured performance components while avoiding incentives to manipulate the baseline.
17 Translate operational evidence into debt sizing
Lenders size debt using contracted revenue, production assessment, operating cost, downside cases, reserves and covenants. Forecast-enabled operating value can support the case when it is observable, repeatable and allocated to the borrower. The evidence threshold should be higher than the threshold for a pilot.
Debt sizing should avoid capitalising a short back-test as permanent cash. The model should examine several weather and price regimes, degradation, outages, market-rule changes and service-provider failure. Benefits can be included through lower operating cost, improved net revenue or reduced volatility, with haircuts that reflect evidence quality.
The base case should identify whether benefits are committed, historical, contracted or management-estimated. Downside cases should remove or reduce forecast value and test liquidity, debt-service coverage and covenant headroom. The financing case becomes stronger when the project remains serviceable after a model failure and benefits create additional protection.
18 Strengthen liquidity and covenant planning
Forecast distributions can improve short-term cash forecasts when imbalance and merchant exposures are material. Finance teams can estimate settlement ranges, collateral calls, working-capital needs and covenant headroom across renewable and price scenarios.
The analysis should maintain a clear boundary between physical forecast uncertainty and price uncertainty. Correlation matters: low output can coincide with high replacement prices, while high renewable output can coincide with negative prices and curtailment. Independent shocks can understate liquidity risk.
The treasury policy can define triggers for liquidity reserves, hedge adjustment and lender communication. Forecasts support those decisions; contractual cure periods, permitted hedges and information undertakings determine what action is available.
19 Establish lender diligence tests
Table 3. Lender and investment-committee diligence for forecast-enabled value
| Diligence area | Core question | Strong evidence | Warning sign |
|---|---|---|---|
| Data | Can the full decision history be reconstructed? | Timestamped forecasts, telemetry, actions and settlement linked by immutable IDs | Retrospective files or missing availability data |
| Model | Is performance calibrated across relevant regimes? | Out-of-sample tests, quantile calibration, ramp metrics and drift monitoring | One average metric or repeated manual adjustment |
| Operations | Can approved decisions be executed reliably? | Defined authority, market access, tested controls, fallback and incident records | Advisory output with no accountable operator |
| Contracts | Does the borrower retain the value and relevant exposure? | Clear PPA, market and service-provider allocation | Benefit claimed by a party without the exposure |
| Economics | Is value measured net of complete cost? | Settlement reconciliation, transaction cost and full operating budget | Gross simulated value treated as cash |
| Resilience | Can the asset operate through model or data failure? | Fallback forecast, manual procedure, cyber controls and recovery tests | Single vendor or data source with no tested fallback |
| Financing | Does value survive conservative downside treatment? | Haircuts, removal case, liquidity test and covenant analysis | Debt sized to an unproven benefit |
The table is a commercial diligence framework. Transaction documents and jurisdiction-specific requirements control each financing.
The diligence package should match the materiality of the benefit. A forecast system that supports a small operating saving may require proportionate controls. A system used to support firm delivery, automated dispatch or debt sizing requires stronger validation, security and continuity evidence.
Independent technical advice can test data, model and physical integration. Market and legal advice can test settlement and contract allocation. The financial adviser should reconcile those findings to cash flow and risk allocation.
20 Govern model risk
The governing body should approve intended use, performance measures, limits, data, validation, deployment, monitoring, change control and fallback. Responsibility should be clear across the model owner, independent reviewer, operator, trader, finance team and technology provider.
Model risk includes conceptual error, bad data, overfitting, bias, drift, latency, integration failure and inappropriate use. AI adds explainability, retraining and third-party risks. The control standard should follow the consequence of a wrong decision rather than the novelty of the algorithm.
Overrides should be recorded with reason, user and outcome. A high override rate can indicate that the model lacks relevant information or that operators distrust it. A low override rate can still conceal automation bias. Periodic review should compare model, operator and combined performance.
21 Design cybersecurity and operational resilience
Forecast and dispatch systems connect external data, cloud services, market interfaces and operational technology. Compromise or failure can affect positions and physical controls. Cybersecurity should cover identity, access, segmentation, encryption, software supply chain, monitoring, incident response and recovery.
Fallback should be practical. It may use an alternative vendor, persistence, a system-operator forecast, a conservative schedule or manual control. Recovery tests should establish how long the asset can operate safely and commercially under degraded data or communications.
Critical decisions should remain within defined authority. Automated execution needs limits for volume, price, state of charge, ramp, availability and market exposure. Emergency stop and safe-state behaviour should be tested.
22 Procure the complete capability
Procurement should describe the decision service rather than a generic accuracy target. Requirements should state assets, horizons, issue times, intervals, probabilistic outputs, latency, interfaces, availability, validation, cybersecurity and evidence retention.
Vendors should demonstrate out-of-sample performance on representative data. A fair evaluation uses common inputs, timing and scoring. The buyer should assess implementation capacity, data dependencies, financial standing, subcontractors, intellectual property, service continuity and exit.
The commercial model should protect independent measurement. Performance fees should use an approved baseline and settlement methodology. Caps and floors can reduce disputes. Ownership of enriched data and trained models should be clear before implementation.
23 Use a staged investment case
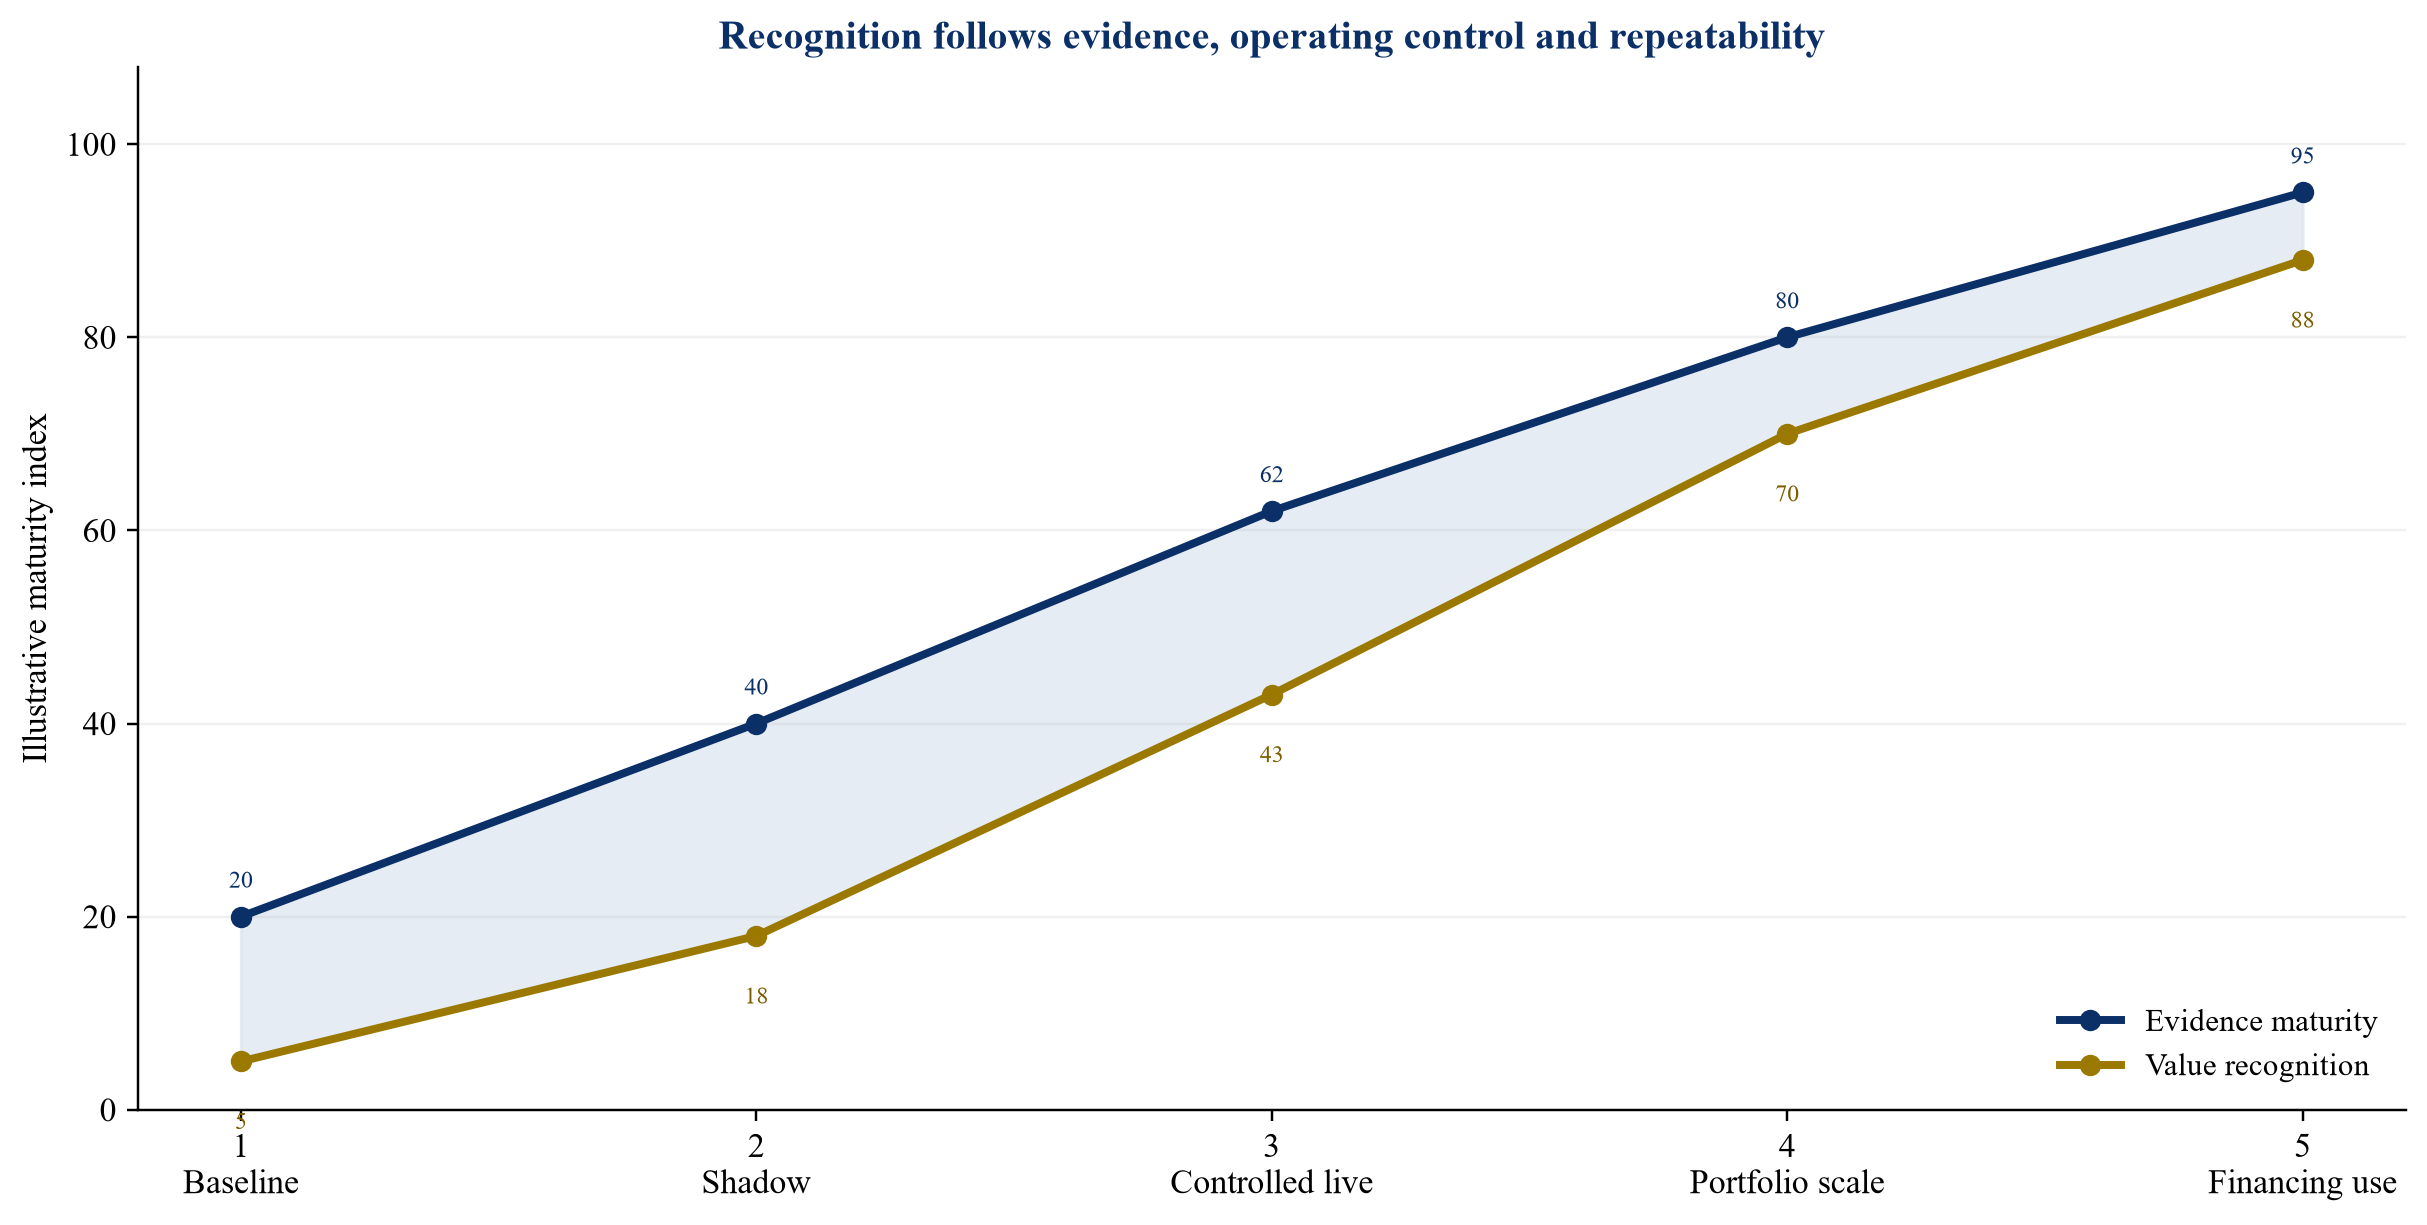
The maturity path is author-developed. Financing recognition depends on transaction evidence and lender judgement rather than a universal threshold.
Stage one creates the baseline, data controls and loss function. Stage two runs the system in shadow mode. Stage three allows controlled live use within limits. Stage four scales across assets and operating regimes. Stage five uses a verified history in liquidity, covenant or financing analysis.
Capital release should follow evidence. Early spending covers data preparation, integration and validation. Live control requires security, authority and fallback. Portfolio scale requires common architecture and governance. Financing recognition requires repeatable net cash evidence and conservative downside treatment.
The gap between capability maturity and financing recognition is intentional. Lenders and investment committees need time-series evidence across conditions. Management can still approve an operating investment before debt sizing reflects its full expected value.
24 Apply a clear approval scorecard
The approval scorecard should cover commercial materiality, data readiness, model performance, operational integration, contract allocation, cyber resilience, economics and financing treatment. Hard failures should be separate from weighted scores.
Examples of hard failures include unlawful data use, inability to operate safely, no authorised route to market, an untested automated control, missing settlement evidence or a contract that assigns the claimed benefit to another party. A high score elsewhere should not compensate for those conditions.
The scorecard should state the next decision. Options include prepare, pilot, controlled live use, scale, use for financing analysis, redesign or stop. Every approval should identify limits, monitoring and expiry conditions.
25 Stress the complete commercial model
Stress cases should combine renewable output, forecast performance, prices, curtailment, availability, storage degradation, market liquidity and contract conditions. The analysis should test both forecast failure and successful forecasting in an adverse market.
A forecast can be accurate while prices make the operating decision unattractive. A model can improve average cash while increasing tail loss. A battery can capture forecast value while degradation or warranty limits reduce lifecycle economics. These interactions belong in one model.
Reverse stress testing asks which combination removes covenant headroom or investment value. The answer informs limits, reserves, insurance, contract negotiation and fallback.
26 Treat geography and market design explicitly
Forecast value varies across centrally dispatched systems, bilateral PPA markets, organised wholesale markets and vertically integrated utilities. Gate closures, imbalance pricing, reserve products, curtailment rules, negative prices and data access differ.
The IEA notes that shorter dispatch intervals and trading closer to real time can reduce the impact of forecast errors. ENTSO-E's balancing framework and 2026 reporting show the continuing development of integrated balancing platforms and probabilistic capacity methods. California ISO market materials connect imbalance reserves to uncertainty between day-ahead forecasts and real-time outcomes. These examples illustrate how market design determines the decision opportunity.
A global portfolio should therefore use a common architecture with local market modules. Global model governance can coexist with local contracts, time zones, weather regimes and regulatory controls.
27 Create management and lender reporting
Monthly operating reporting should show forecast performance, calibrated uncertainty, high-impact events, overrides, incidents, execution and net value. Finance reporting should reconcile provisional operating value to settlement and cash.
Quarterly governance should review drift, vendor service, cybersecurity, market-rule changes and benefit concentration. The board or investment committee should receive material exceptions, realised return on investment and the case for further capital.
Lender reporting should follow financing documents. Where forecast-enabled value is material, the report can include availability, benefit attribution, downside performance, model incidents and fallback tests. Disclosure should avoid presenting an estimate as contracted revenue.
28 Design the first twelve months
Months one to three should define decisions, baseline, data ownership, market exposures and governance. Historical forecasts should be matched to availability, actions and settlement. Data gaps and timing problems should be resolved before model comparison.
Months four to six should run model trials and probabilistic calibration. The programme should complete a shadow back-test across representative seasons and price conditions. Operational and finance teams should agree the attribution method.
Months seven to nine should begin controlled live use within approved limits. The team should test integration, overrides, fallback, cybersecurity and settlement reconciliation. Months ten to twelve should review net realised value, operating incidents, scalability and the financing treatment. The next capital release should follow the evidence.
29 Translate the framework into transactions
The transaction structure may combine a forecast service, data licence, market-access agreement, optimisation software, battery-control interface and performance assurance. Each contract should align with the forecast-to-cash chain and avoid gaps between providers.
An acquisition or refinancing should diligence whether the forecast capability is transferable. Data rights, trained models, licences, cloud accounts, key personnel and change-of-control provisions can affect continuity. Historical claimed benefits should be reconciled to settlement and to the legal entity receiving cash.
A portfolio platform can create scale through shared weather data, model operations, validation and market connectivity. Local asset interfaces and contracts remain necessary. The platform valuation should distinguish recurring cash savings, growth options and costs required to maintain the capability.
30 Preserve accountability as automation increases
Automation can reduce latency and apply rules consistently. It also increases the importance of limits, testing and incident response. The accountable operating entity should know which model version, data and optimisation objective produced each action.
Human approval is appropriate where consequence, uncertainty or regulation requires it. Automated control is appropriate within tested limits where speed and repeatability matter. The boundary should be documented and reviewed when market products, assets or models change.
An explainable decision record does not require every algorithm to be simple. It requires sufficient evidence to show inputs, version, uncertainty, constraints, action and outcome. This record supports operators, boards, lenders and regulators.
Conclusion
Renewable forecasts create financial value through decisions. The relevant path runs from data to forecast, decision, execution, settlement and cash. Each link needs an owner, control, timestamp and evidence standard.
The Forecast-to-Cash Framework separates statistical improvement from realised commercial value. It maps horizons to binding decisions, uses probabilistic forecasts for asymmetric exposures, measures ramps and regime changes, and attributes imbalance, curtailment, storage, reserve and flexible-demand outcomes without double counting. It deducts complete implementation cost and reconciles benefits to settlement.
Financing recognition requires conservative treatment. Forecast-enabled cash should be observable, repeatable, contractually allocated to the borrower and resilient under model, market and asset stress. The base case should distinguish realised, contracted and management-estimated benefits. A downside case should remove the benefit and test debt service, liquidity and covenants.
The practical investment test is whether improved information changes an executable decision before the relevant deadline and produces verified net cash. When the answer is supported by settlement-grade evidence and governed operations, renewable AI becomes part of the asset's commercial and financing infrastructure.
References
- International Renewable Energy Agency, Digitalisation and AI for power system transformation: Perspectives for the G7, 2025. https://www.irena.org/Publications/2025/Oct/Digitalisation-and-AI-for-power-system-transformation-Perspectives-for-the-G7
- International Renewable Energy Agency, Artificial Intelligence and Big Data: Innovation Landscape Brief, 2019. https://www.irena.org/-/media/Files/IRENA/Agency/Publication/2019/Sep/IRENA_AI_Big_Data_2019.pdf
- International Renewable Energy Agency, From Prediction to Power: Applying Weather, Climate Forecasting, and AI in Renewable Energy, 2026. https://www.irena.org/Events/2026/Jan/Renewables-Talk-for-IRENA-Permanent-Representatives-From-Prediction-to-Power-Weather-Climate-AI-RE
- International Renewable Energy Agency, FlexTool. https://www.irena.org/Energy-Transition/Planning/Flextool
- International Energy Agency, Market and system operation: Introduction to System Integration of Renewables. https://www.iea.org/reports/introduction-to-system-integration-of-renewables/market-and-system-operation
- International Energy Agency, Harnessing Variable Renewables: A Guide to the Balancing Challenge, 2011. https://www.iea.org/reports/harnessing-variable-renewables
- National Renewable Energy Laboratory, Solar, Wind, and Load Forecasting, 2024. https://www.nrel.gov/docs/fy24osti/83828.pdf
- National Renewable Energy Laboratory, Solar Forecasting Requirements and Value. https://www.nrel.gov/docs/fy12osti/55432.pdf
- U.S. Department of Energy, AI for Energy. https://www.energy.gov/cet/articles/ai-energy
- U.S. Department of Energy, The Future of Resource Adequacy, 2024. https://www.energy.gov/sites/default/files/2024-04/2024%20The%20Future%20of%20Resource%20Adequacy%20Report.pdf
- U.S. Department of Energy, Keeping the Lights On: Essential Reliability Services. https://www.energy.gov/cmei/articles/keeping-lights-essential-reliability-services
- Advanced Research Projects Agency-Energy, Predicting Events to Enable Robust Renewable Grids. https://arpa-e.energy.gov/programs-and-initiatives/search-all-projects/predicting-events-enable-robust-renewable-grids
- California Independent System Operator, EDAM Training: Imbalance Reserve Requirements Data on OASIS, 2025. https://www.caiso.com/notices/edam-training-imbalance-reserve-requirements-data-on-oasis-on-12-9-25
- California Independent System Operator, Market Performance Report: March 2026. https://www.caiso.com/content/monthly-market-performance/mar-2026/executive-summary.html
- European Network of Transmission System Operators for Electricity, Balancing Report 2026. https://www.entsoe.eu/network_codes/eb/balancing-report/
- European Network of Transmission System Operators for Electricity, Market Report 2026. https://www.entsoe.eu/publications/market-reports/market-report-2026/
- European Network of Transmission System Operators for Electricity, ALPACA: Cross-Border Balancing Capacity Cooperation for aFRR. https://www.entsoe.eu/network_codes/eb/alpaca/
- European Network of Transmission System Operators for Electricity, Flexibility from Renewable Energy Sources, 2025. https://www.entsoe.eu/news/2025/11/18/entso-e-publishes-the-report-and-the-position-paper-on-flexibility-from-renewable-energy-sources-res/
- World Bank, Power Generation Module. https://ppp.worldbank.org/energy-and-power/power-generation-module
- World Bank, Project Bankability: Risk Allocation and Impact on PPA Prices, 2023. https://documents1.worldbank.org/curated/en/099120623171525006/pdf/P1742021cf52b60e6196b81854984124388.pdf
- World Bank and International Energy Agency, Scaling Up Private Finance for Clean Energy in Emerging and Developing Economies, 2023. https://documents1.worldbank.org/curated/en/099645409062314892/pdf/IDU0e6f91c9204b9e0428c09f050e8c815126f56.pdf
- World Bank, Making Greenfield Projects Bankable, 2021. https://blogs.worldbank.org/en/ppps/making-greenfield-projects-bankable
- World Bank, Sustainable Renewables Risk Mitigation Initiative. https://www.worldbank.org/en/topic/energy/brief/srmi
- World Bank, Appraisal of Small Renewable Energy Projects. https://documents1.worldbank.org/curated/en/149681468340483329/pdf/839260WP0Tanza0udy0382116B00PUBLIC0.pdf
- World Bank, Power Purchase Agreement between National Grid and Cape Wind: PPA Analysis. https://ppp.worldbank.org/library/power-purchase-agreement-between-massachusetts-electric-company-and-nantucket-electric-company-d-b-national-grid-buyer-and-cape-wind-associates-llc-seller-ppa-1
- Office of Gas and Electricity Markets, Electricity Balancing Significant Code Review: Initial Consultation. https://www.ofgem.gov.uk/sites/default/files/docs/2012/08/electricity-balancing-scr-initial-consultation.pdf
- International Finance Corporation, Utility-Scale Solar Photovoltaic Power Plants: A Project Developer's Guide. https://www.ifc.org/en/insights-reports/2015/utility-scale-solar-photovoltaic-power-plants
- International Finance Corporation, Scaling Solar. https://www.ifc.org/en/what-we-do/sector-expertise/infrastructure/scaling-solar
- International Electrotechnical Commission, IEC 61400-25: Communications for monitoring and control of wind power plants. https://www.iec.ch
- National Institute of Standards and Technology, Artificial Intelligence Risk Management Framework. https://www.nist.gov/itl/ai-risk-management-framework
- National Institute of Standards and Technology, Cybersecurity Framework 2.0. https://www.nist.gov/cyberframework
- European Union Agency for Cybersecurity, Cybersecurity in the energy sector. https://www.enisa.europa.eu/topics/cybersecurity-of-critical-sectors/energy
- International Organization for Standardization, ISO 31000 Risk management. https://www.iso.org/iso-31000-risk-management.html
- Basel Committee on Banking Supervision, Principles for the effective management and supervision of climate-related financial risks, 2022. https://www.bis.org/bcbs/publ/d532.htm
- Organisation for Economic Co-operation and Development, OECD Principles on Artificial Intelligence. https://oecd.ai/en/ai-principles
About the Author
Chennakeshav (CK) is a corporate finance and investment banking executive with 25+ years of global experience in deal origination, structuring and execution across M&A, growth capital and corporate strategy. He has led value-creation mandates for founders, corporates and funds — bridging the boardroom view to hands-on execution and close.
His career spans Morgan Stanley, HSBC, Lloyds Banking Group, EWEC, ADQ portfolio companies and Emirates Growth Fund, across TMT, real estate, fintech, deeptech, cleantech, infrastructure and energy. He has partnered with C-suite leaders, private equity and venture funds, sovereign wealth funds and family offices to finance complex fund raises and scale-up ventures, and has led M&A due diligence, post-merger integration and business-transformation initiatives to create value.
At Matchpoint Partners he is Managing Partner, leading the firm's corporate finance, M&A and capital-raising practice. He holds an MBA from London Business School, an engineering degree from VTU and a Master of Laws (LLM, in progress) from UCL London.
An active start-up mentor, CK mentors at Techstars, DIFC FinTech Hive, Startup Grind, Founder Institute and IN5, serves as Entrepreneur Mentor in Residence (EMiR) at London Business School, and judges the Entrepreneurship World Cup.
