

1. Define AI disruption as a change in customer economics
An AI roadmap should begin with the economic job a customer is trying to complete. A feature is only one possible mechanism. The customer may want to reduce cycle time, improve a decision, create an artefact, comply with a rule, coordinate people, operate infrastructure, win revenue or avoid loss. If a general-purpose model, embedded assistant, competing application, services firm or internal customer team can complete that job with acceptable quality and risk, the incumbent software can lose pricing power even when its feature set remains intact.
The board should distinguish five possible effects. AI can substitute the product by completing the same job through another route. It can compress value by making a formerly scarce capability inexpensive or bundled. It can disintermediate the user interface by placing a conversational or agentic layer between the customer and the application. It can complement the product by increasing usage, quality or reach. It can create a new category that changes the customer's process and budget entirely. One product may face several effects across different modules and customer segments.
The decision question is therefore broader than whether to add AI. Management must decide which customer outcomes remain valuable, which assets can support them, which product architecture can deliver them safely, which commercial model can capture value and which legacy commitments must be migrated or retired. The answer may include an AI-native product, an AI-enabled module, a partner integration, a protected deterministic workflow, a data service, a human-in-the-loop operating model or a controlled exit.
NIST's AI Risk Management Framework provides a useful operating discipline because it treats governance as cross-cutting and connects it to mapping, measurement and management across the lifecycle.[1] That structure supports a commercial roadmap when the board adds explicit revenue, customer, product and cash evidence. Risk and value are then governed together rather than as separate technology and compliance workstreams.
Table 1. Evidence states for an AI-disruption programme
| Evidence state | Minimum support | Permitted decision | Principal control |
|---|---|---|---|
| market and customer hypothesis | defined job, segment, alternative and stated uncertainty | prioritise discovery | disclose assumptions and excluded segments |
| approved experiment | owner, cohort, design, budget, safeguards and acceptance criteria | release limited resources | product, security, legal and finance approval |
| validated product result | repeated task performance, adoption and failure evidence | advance or redesign product | comparable baseline and monitored exceptions |
| validated commercial result | observed purchase, renewal, expansion or switching behaviour | change offer or pricing | contract, cohort and revenue reconciliation |
| realised economic result | recognised revenue, cost, cash and retained customer evidence | scale, migrate, partner or stop | accounting policy and cash reconciliation |
Product opportunity, approved investment, observed behaviour, accounting and cash remain separate evidence states.
2. Freeze the product, customer and revenue baseline
AI transformation is difficult to evaluate when the starting point moves. The company should freeze a baseline at product, module, customer, contract and cohort level before material investment. The baseline records recurring and non-recurring revenue, usage, active users, gross retention, net retention, support effort, infrastructure cost, professional-services effort, custom code, implementation time, security obligations, service credits, product debt and committed roadmap work. It should also record the customer's job and the evidence that the product contributes to it.
Revenue should be decomposed by what the customer is actually buying. A licence can include access, workflow, data, storage, integration, support, compliance, implementation, outcome assurance and switching protection. A single annual recurring revenue number can conceal a low-use module sustained by contractual friction, a high-value workflow underpriced within a bundle, or services effort subsidising a software margin. AI may affect each component differently.
The baseline also needs an architecture view. Management should locate model calls, proprietary algorithms, deterministic rules, data stores, integration dependencies, identity, observability, security controls and human review. Variable inference cost, latency, context size, model availability and quality variation can make an apparently small feature a different operating system. The baseline should show cost and reliability at the task level, including retries, fallbacks, human correction and support.
Customer concentration and contract timing determine the speed of exposure. A product with annual contracts may experience delayed revenue impact while usage or value deteriorates earlier. Renewal dates, termination rights, minimum commitments, price protections, data-portability obligations and service levels should be connected to the roadmap. This allows product choices to be sequenced around genuine commercial windows rather than a generic release calendar.
3. Map the revenue exposure before selecting features
The revenue-exposure map combines four dimensions. The first is substitutability: how easily an alternative can complete the customer job. The second is economic importance: revenue, contribution, strategic account value and expansion potential. The third is time to exposure: contract duration, customer readiness, competitor availability and internal procurement cycles. The fourth is defence capacity: proprietary data, workflow position, integration depth, trust, distribution, domain expertise and ability to migrate.
Exposure should be assessed by module and segment. A reporting feature for a small customer may be highly substitutable through general-purpose AI, while the same output for a regulated enterprise may depend on permissions, lineage, reconciliations and approvals that remain difficult to reproduce. A drafting tool may face rapid price compression for generic text and still gain pricing power for validated domain-specific work embedded in a controlled workflow.
The map should separate revenue at risk from revenue already lost. Declining usage, rising support tickets, discount requests, reduced seat expansion, procurement questions and customer-built workarounds are leading indicators. Churn and contraction are lagging indicators. Management should specify what evidence changes an exposure rating and how often it is refreshed. Anecdotes from sales or product teams should be preserved as hypotheses until connected to customer and contract evidence.
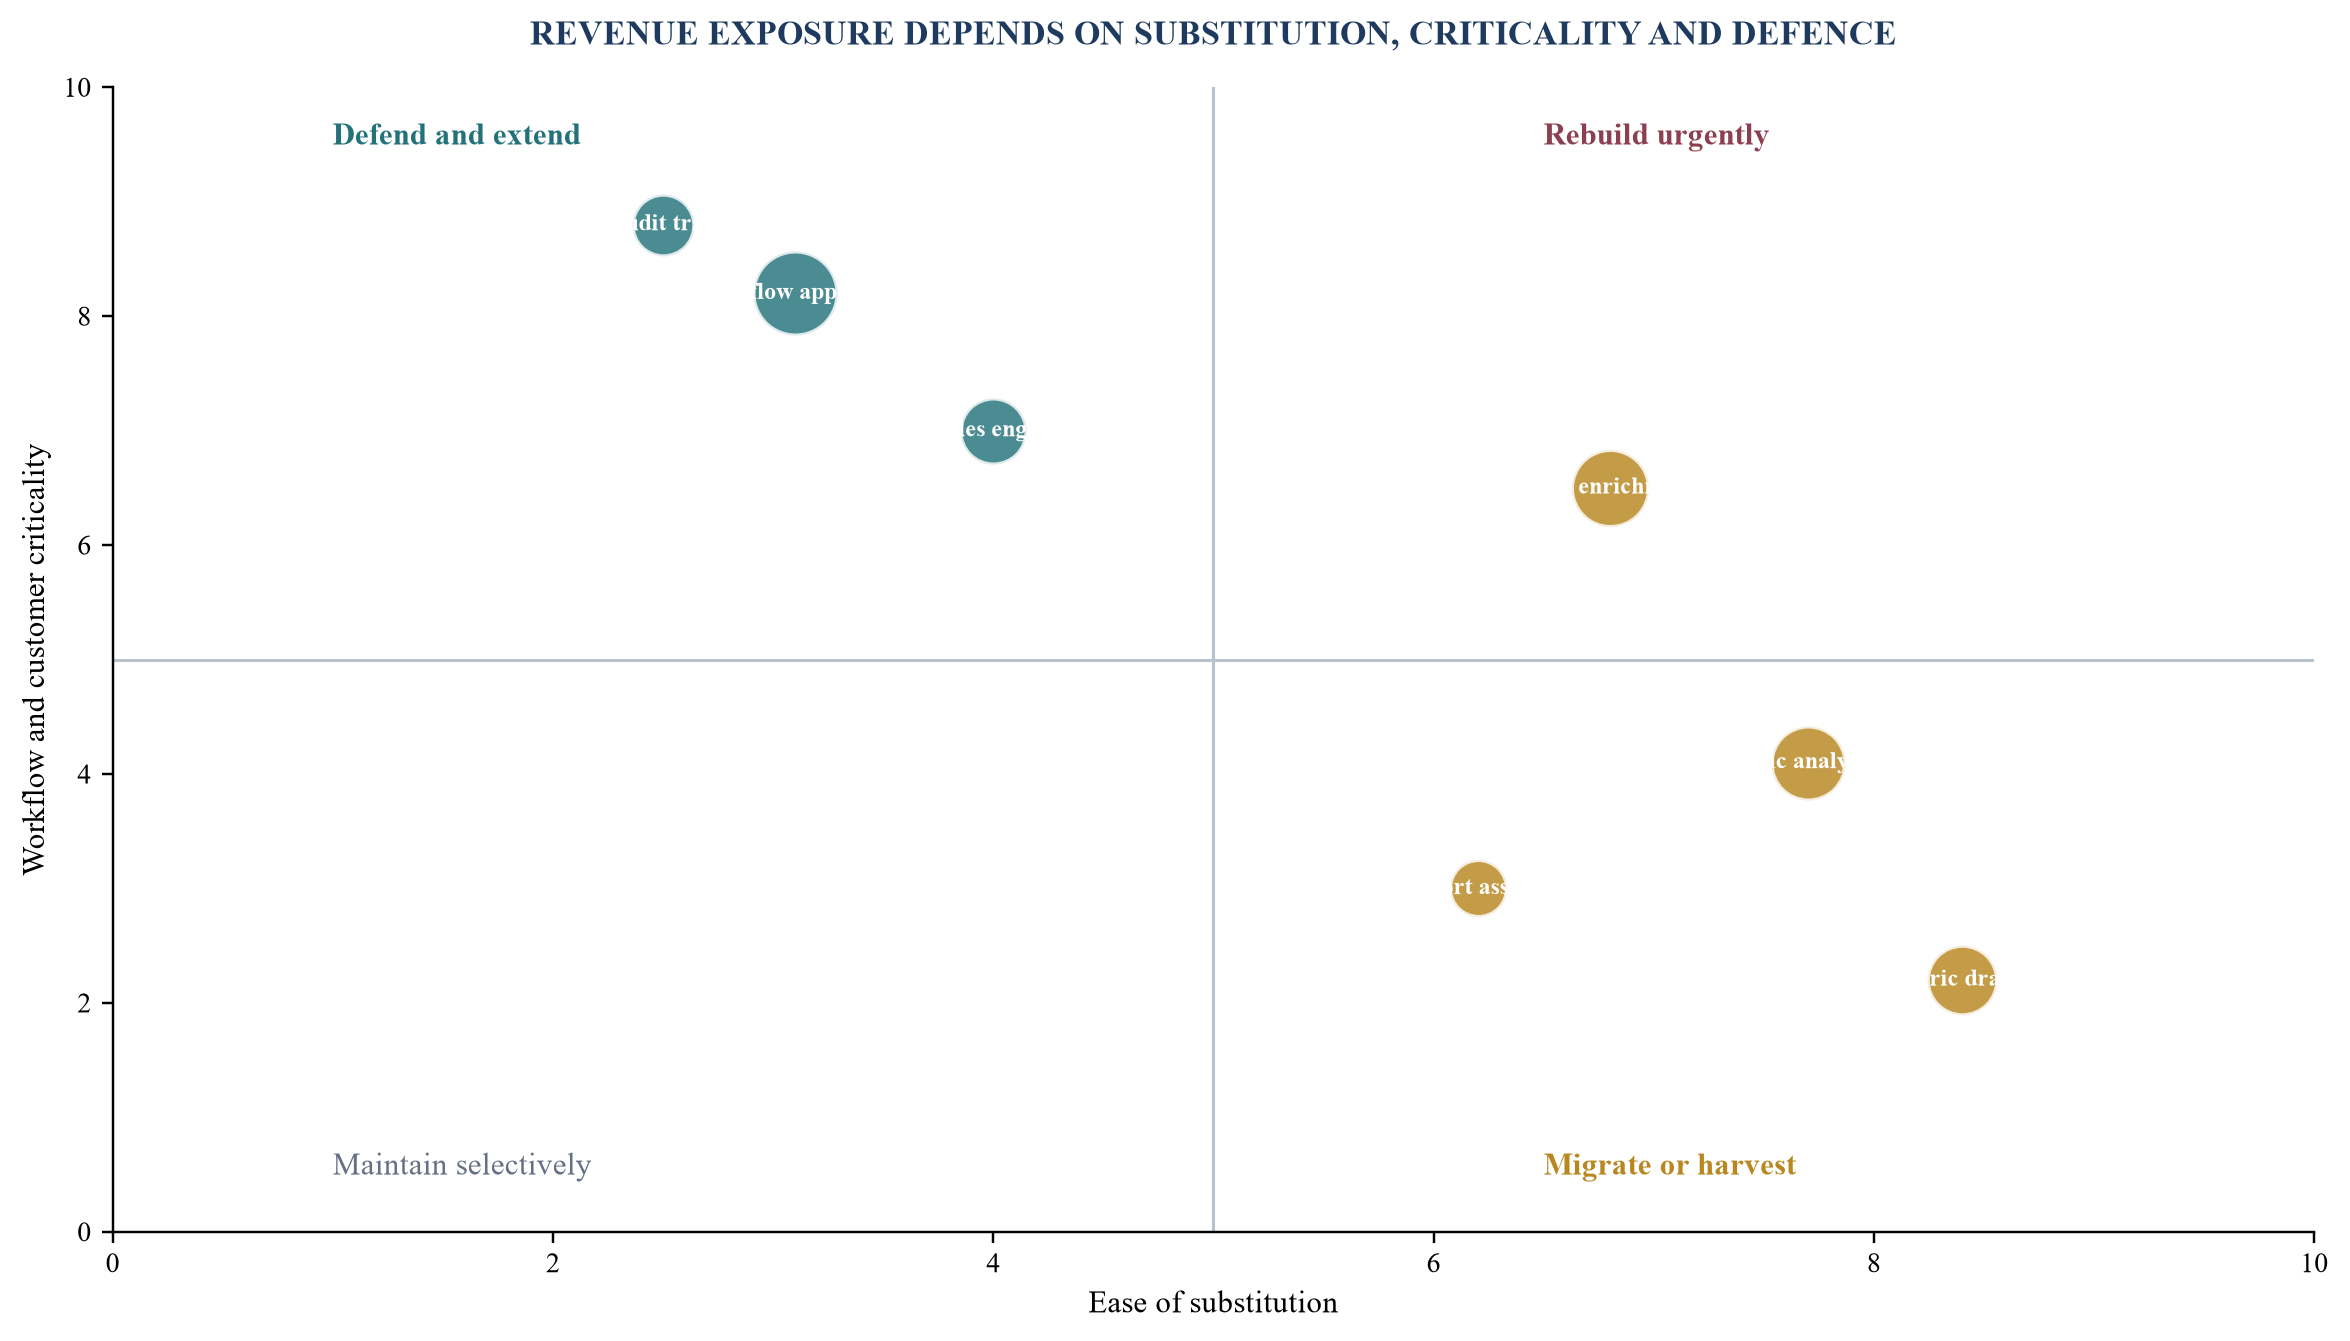
Bubble size represents hypothetical annual recurring revenue. Positions and values are illustrative and require customer-level evidence.
4. Decompose customer jobs into substitutable units
Product substitutability should be tested at the smallest unit that preserves customer value. A workflow can be decomposed into intent capture, data retrieval, reasoning, calculation, creation, validation, approval, execution, recordkeeping and monitoring. AI may substitute creation while increasing the value of validation and audit. It may improve retrieval while leaving execution within deterministic controls. Treating the entire workflow as one feature can hide where value is moving.
Each unit should be compared against credible alternatives. These include a general model used directly by the customer, an AI assistant embedded in an adjacent platform, a vertical competitor, open-source software, an internal build, a service provider and manual work. The test should specify required inputs, output quality, latency, reliability, explainability, permissions, data handling, integration, human effort and total cost. A demo that completes one task is not equivalent to an operating substitute.
The 2026 field publication on the jagged technological frontier reports uneven effects across tasks; AI assistance improved performance inside the measured frontier and could worsen performance outside it.[9] The implication for product design is direct. A roadmap needs task-specific performance evidence and fallback design. A single product-wide claim about AI capability can be misleading when adjacent tasks have materially different failure patterns.
Substitution can also occur through user-interface control. If a customer begins work in an assistant that can call multiple applications, the assistant can become the discovery, orchestration and data layer. The underlying product may retain functionality while losing direct engagement, brand salience and upsell opportunity. The roadmap should therefore measure who controls intent, context, action and result, not only whether an API call reaches the incumbent system.
Table 2. Product-substitution test by workflow unit
| Workflow unit | Substitute test | Defensibility evidence | Decision implication |
|---|---|---|---|
| intent and discovery | can another interface capture and route the job? | customer entry point, context and distribution | own, integrate or accept disintermediation |
| retrieval and context | can alternatives access sufficient current data? | permissions, lineage, freshness and semantic model | strengthen context layer and open controlled interfaces |
| generation or analysis | can another model meet quality, time and cost? | domain evaluation, proprietary method and repeatability | build, buy, tune, route or retain deterministic logic |
| validation and approval | can the output be trusted and authorised? | controls, evidence, human review and accountability | productise assurance and exception handling |
| execution and record | can alternatives act safely and preserve the audit trail? | integration depth, identity, policy and system of record | protect execution position and portability |
The matrix requires observed performance and operating evidence for each important customer segment.
5. Test customer willingness to pay through observed choices
Customer enthusiasm for AI is not a price. Interviews establish language, jobs, concerns and hypotheses. Willingness to pay requires choices with consequences. The company should test paid pilots, plan selection, upgrade acceptance, usage commitments, contract extensions, budget transfer, reduced discounting, expansion and retention. The design should distinguish value from novelty and compare AI-enabled outcomes with the existing product and credible alternatives.
The unit of value matters. Per-seat pricing may weaken when AI reduces the number of people required for a workflow. Usage pricing may align with activity while exposing the customer to uncertain bills and the vendor to model-cost volatility. Outcome pricing can connect to value while requiring attribution, measurement and risk-sharing. Platform pricing can protect economics when AI is one capability within a broader system. The company should test several architectures rather than attaching an AI surcharge to the legacy metric automatically.
Experiments need clean cohorts. Relevant variables include segment, role, use case, maturity, geography, contract type, incumbent usage, data readiness and risk tolerance. A paid design-partner cohort can provide rich evidence but may not represent the broader market. Free adoption can prove usability and still fail to prove budget. Sales incentives should reward evidence quality and retained economics rather than encouraging discounts that make every pilot appear successful.
Field research provides useful caution. Brynjolfsson, Li and Raymond studied a staggered deployment across 5,179 customer-support agents and reported average productivity improvement with substantial heterogeneity by experience.[8] The result demonstrates that value can depend on user group and operating context. It does not establish a universal productivity rate or a price for unrelated software. A company should reproduce the relevant task, baseline and economic chain in its own customer environment.
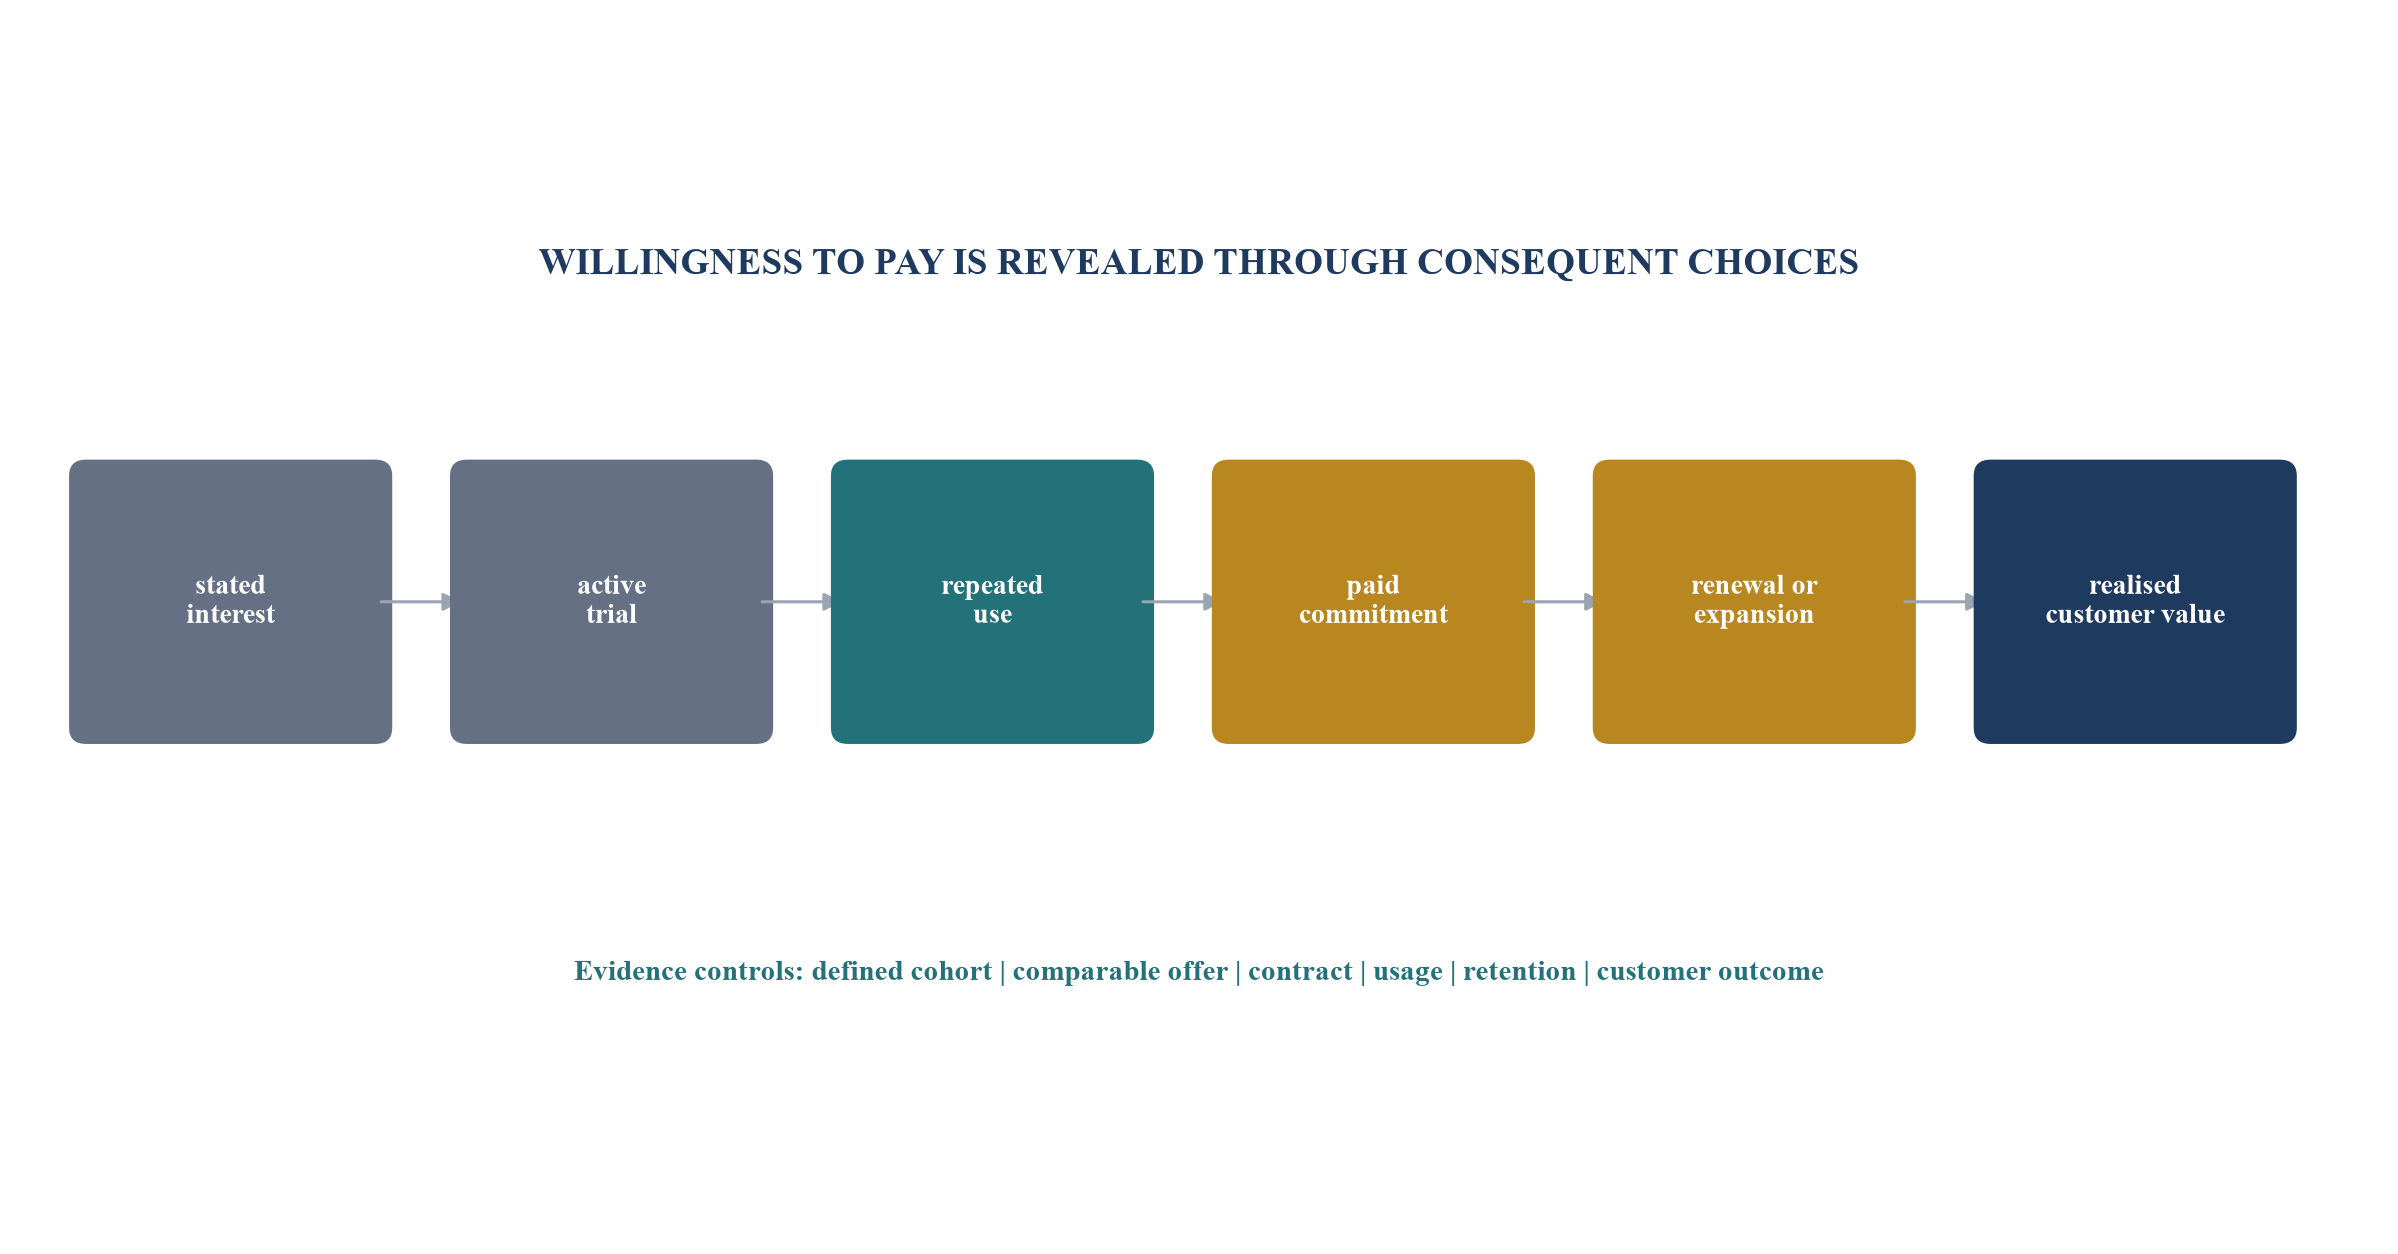
Movement to the next level requires observable evidence. Percentages are not implied.
6. Build a data advantage that survives scrutiny
Data volume alone is not a moat. The board should ask whether the company has lawful rights to use the data for the intended purpose; whether provenance and quality are known; whether data is sufficiently current and representative; whether it can be accessed at the point of decision; whether feedback can be attributed to outcomes; and whether the resulting improvement can be repeated faster or more reliably than competitors. Data that cannot be governed, joined or used can be a liability rather than an advantage.
A defensible data loop begins with workflow position. The product observes a customer action or state, captures structured context with permission, produces an output, records the action taken, measures the outcome and converts learning into a validated product change. Each link needs identifiers, time, access rules and quality controls. If the company sees only prompts and responses, it may lack the ground truth needed to improve. If it sees outcomes without the decision context, attribution can remain weak.
Rights and customer expectations constrain reuse. The EU AI Act establishes requirements that vary by role and risk classification, while the ICO's guidance addresses data-protection considerations for AI systems.[10][12] The EU Data Act includes provisions relevant to access, portability, switching and interoperability for covered services and markets.[11] Applicability and implementation depend on facts and jurisdiction. Product teams should translate legal conclusions into machine-readable data-purpose, retention, access and deletion controls rather than leaving them in policy documents.
The data score should therefore combine six dimensions: rights, provenance, quality, workflow exclusivity, outcome feedback and learning velocity. A high score requires evidence in all material dimensions. Averaging can be dangerous because a severe rights or quality failure cannot be offset by large volume. The board should use minimum thresholds for critical dimensions and a weighted score for prioritisation.
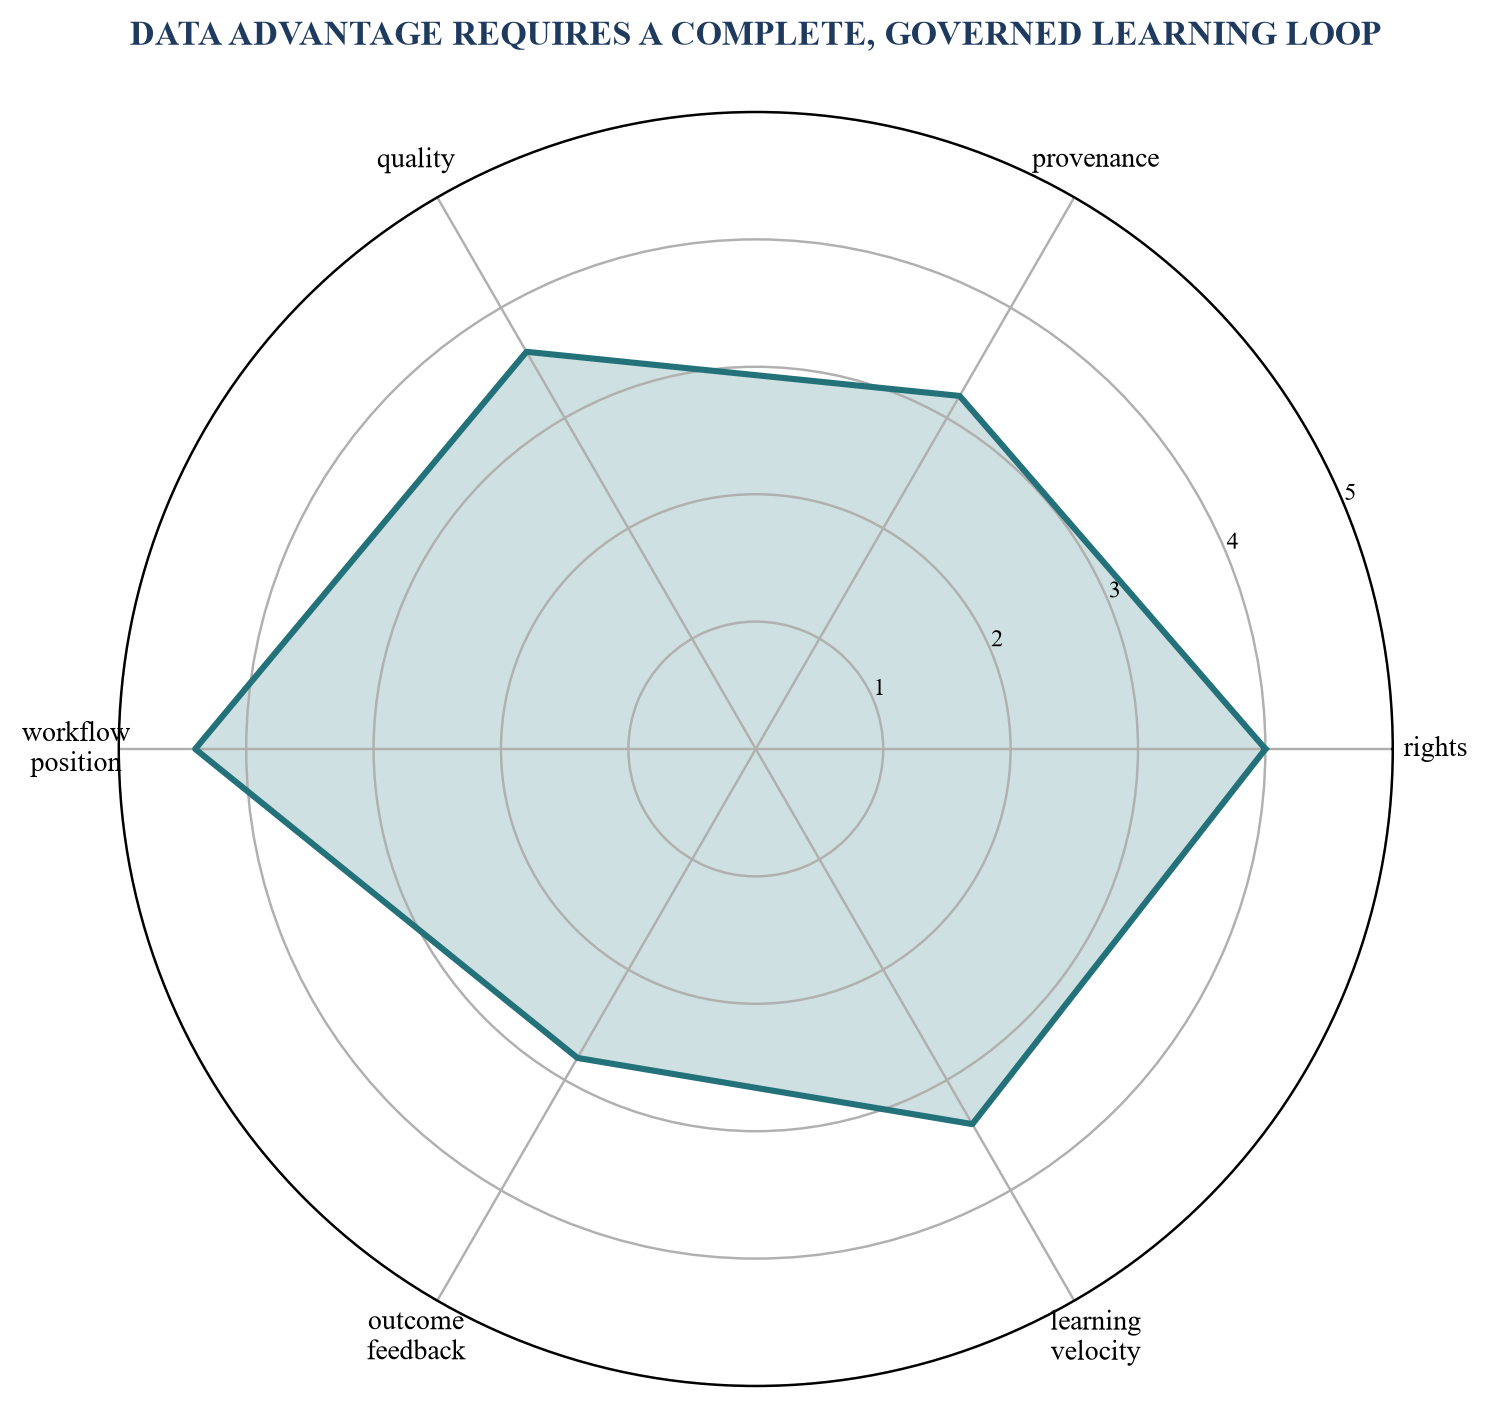
Scores are illustrative on a zero-to-five scale. A live score requires legal, technical and customer evidence.
Table 3. Data-advantage evidence register
| Dimension | Evidence required | Failure mode | Roadmap response |
|---|---|---|---|
| rights and purpose | contract, consent or lawful basis, permitted purpose and retention | unlawful or unexpected reuse | restrict, renegotiate, segregate or delete |
| provenance and lineage | source, transformations, ownership, timestamps and controls | untraceable model or product behaviour | instrument and reconstruct before scaling |
| quality and coverage | definitions, completeness, representativeness and error monitoring | unreliable or biased output | improve collection, evaluation and fallback |
| workflow position | repeated access at a decision or action point | data available equally to competitors | strengthen integration, service and context |
| outcome feedback | verified action and result linked to input and output | learning from proxies or engagement only | capture ground truth and delayed outcomes |
| learning velocity | controlled release, evaluation and customer-safe improvement cycle | volume without product improvement | invest in evaluation, operations and governance |
Critical rights, privacy and quality thresholds should be passed separately from any weighted score.
7. Choose the AI product architecture through evidence
The build, buy, partner and route decision should be made at component level. A company may buy a foundation-model service, use several providers through a routing layer, deploy an open-weight model, build retrieval and evaluation internally, retain deterministic calculation, and partner for domain data. The objective is a resilient product and economic system rather than technical purity.
Model capability should be evaluated on representative tasks and failure costs. Metrics can include task success, factual accuracy, completeness, groundedness, refusal behaviour, latency, cost, security, privacy, language, consistency and human correction. The evaluation set should include normal, difficult, adversarial and high-consequence cases. Release thresholds should be connected to the product promise and risk classification. A higher average score can still be unacceptable if critical failures increase.
Provider concentration creates commercial and operational exposure. The CMA's foundation-model review discusses access to critical inputs, the position of powerful incumbents and relationships across the value chain.[5] A software company should identify where it depends on model access, compute, cloud, data or distribution and what happens if price, terms, capability, geography or availability changes. Portability has cost; it should be designed and tested where the exposure justifies it.
NIST's SSDF provides practices for integrating security into the software development lifecycle, and SP 800-218A adds generative-AI considerations for model producers, AI system producers and acquirers.[3][4] These materials support a roadmap in which provenance, environments, requirements, verification and vulnerability response are planned components. Security work should appear in capacity, cost and release gates rather than as a late approval queue.
8. Rebuild the product roadmap around customer and control layers
An AI-disruption roadmap benefits from five layers. The experience layer controls how users express intent, inspect output, correct errors and grant authority. The workflow layer orchestrates tasks, approvals and exceptions. The intelligence layer contains models, retrieval, rules, tools and routing. The trust layer covers identity, permissions, data handling, security, evaluation, monitoring and audit. The economics layer measures price, usage, cost, support, retention and cash.
Roadmap items should state the customer job, target cohort, substitute being addressed, proposed value, key risks, evidence required and stop condition. A feature description such as "add copilot" provides little governance information. A decision statement such as "reduce first-response preparation time for the enterprise support cohort while maintaining approval, citation and data-boundary thresholds" can be tested and costed.
The roadmap must also fund migration. Customers need feature mapping, data movement, configuration conversion, integration changes, user training, coexistence, commercial transition, support and rollback. Internal teams need architecture migration, observability, evaluation, sales enablement and policy changes. These are product requirements because failure can damage retention and trust.
Capacity should be allocated across defend, extend, rebuild and retire. Defend preserves high-value workflows and service commitments. Extend adds AI where the current product and data create advantage. Rebuild creates a new architecture or commercial model where incremental change is insufficient. Retire removes low-value or unsafe complexity. The allocation should change as evidence arrives.
9. Calculate migration economics as a cash bridge
Migration economics begins with the protected revenue base and the cash needed to move it. The model should include customers by cohort, contract timing, expected migration rate, temporary coexistence, implementation effort, support, credits, discounting, sales compensation, cloud and inference costs, engineering, security, legal, data remediation, capitalised development and retirement savings. It should show both profit and cash timing.
AI can change gross margin through variable model cost, retrieval infrastructure, observability, human review, indemnities and support. Unit cost should be measured per completed customer job rather than per model call. Retries, long contexts, failed outputs, abandoned tasks and human correction can make token cost an incomplete measure. The cost register should connect task, customer, model route, quality outcome and billing unit.
Revenue transition can include cannibalisation. A new AI plan may increase customer value while reducing seats, services or usage in the legacy product. Management should model gross and net effects at customer level. Protecting every legacy revenue line can weaken adoption; accepting unmeasured cannibalisation can destroy value. The board should define an acceptable transition path and test whether the new economics compensate for the displaced contribution.
Accounting needs separate review. IAS 38 distinguishes research expenditure from development expenditure and sets recognition criteria for internally generated intangible assets.[13] IAS 36 addresses impairment indicators and recoverable amount.[14] IFRS 15 establishes principles for revenue from customer contracts, including performance obligations and transaction-price allocation.[15] Product approvals and cash forecasts do not determine accounting treatment. The company should document the applicable policy conclusion and keep management economics separate.
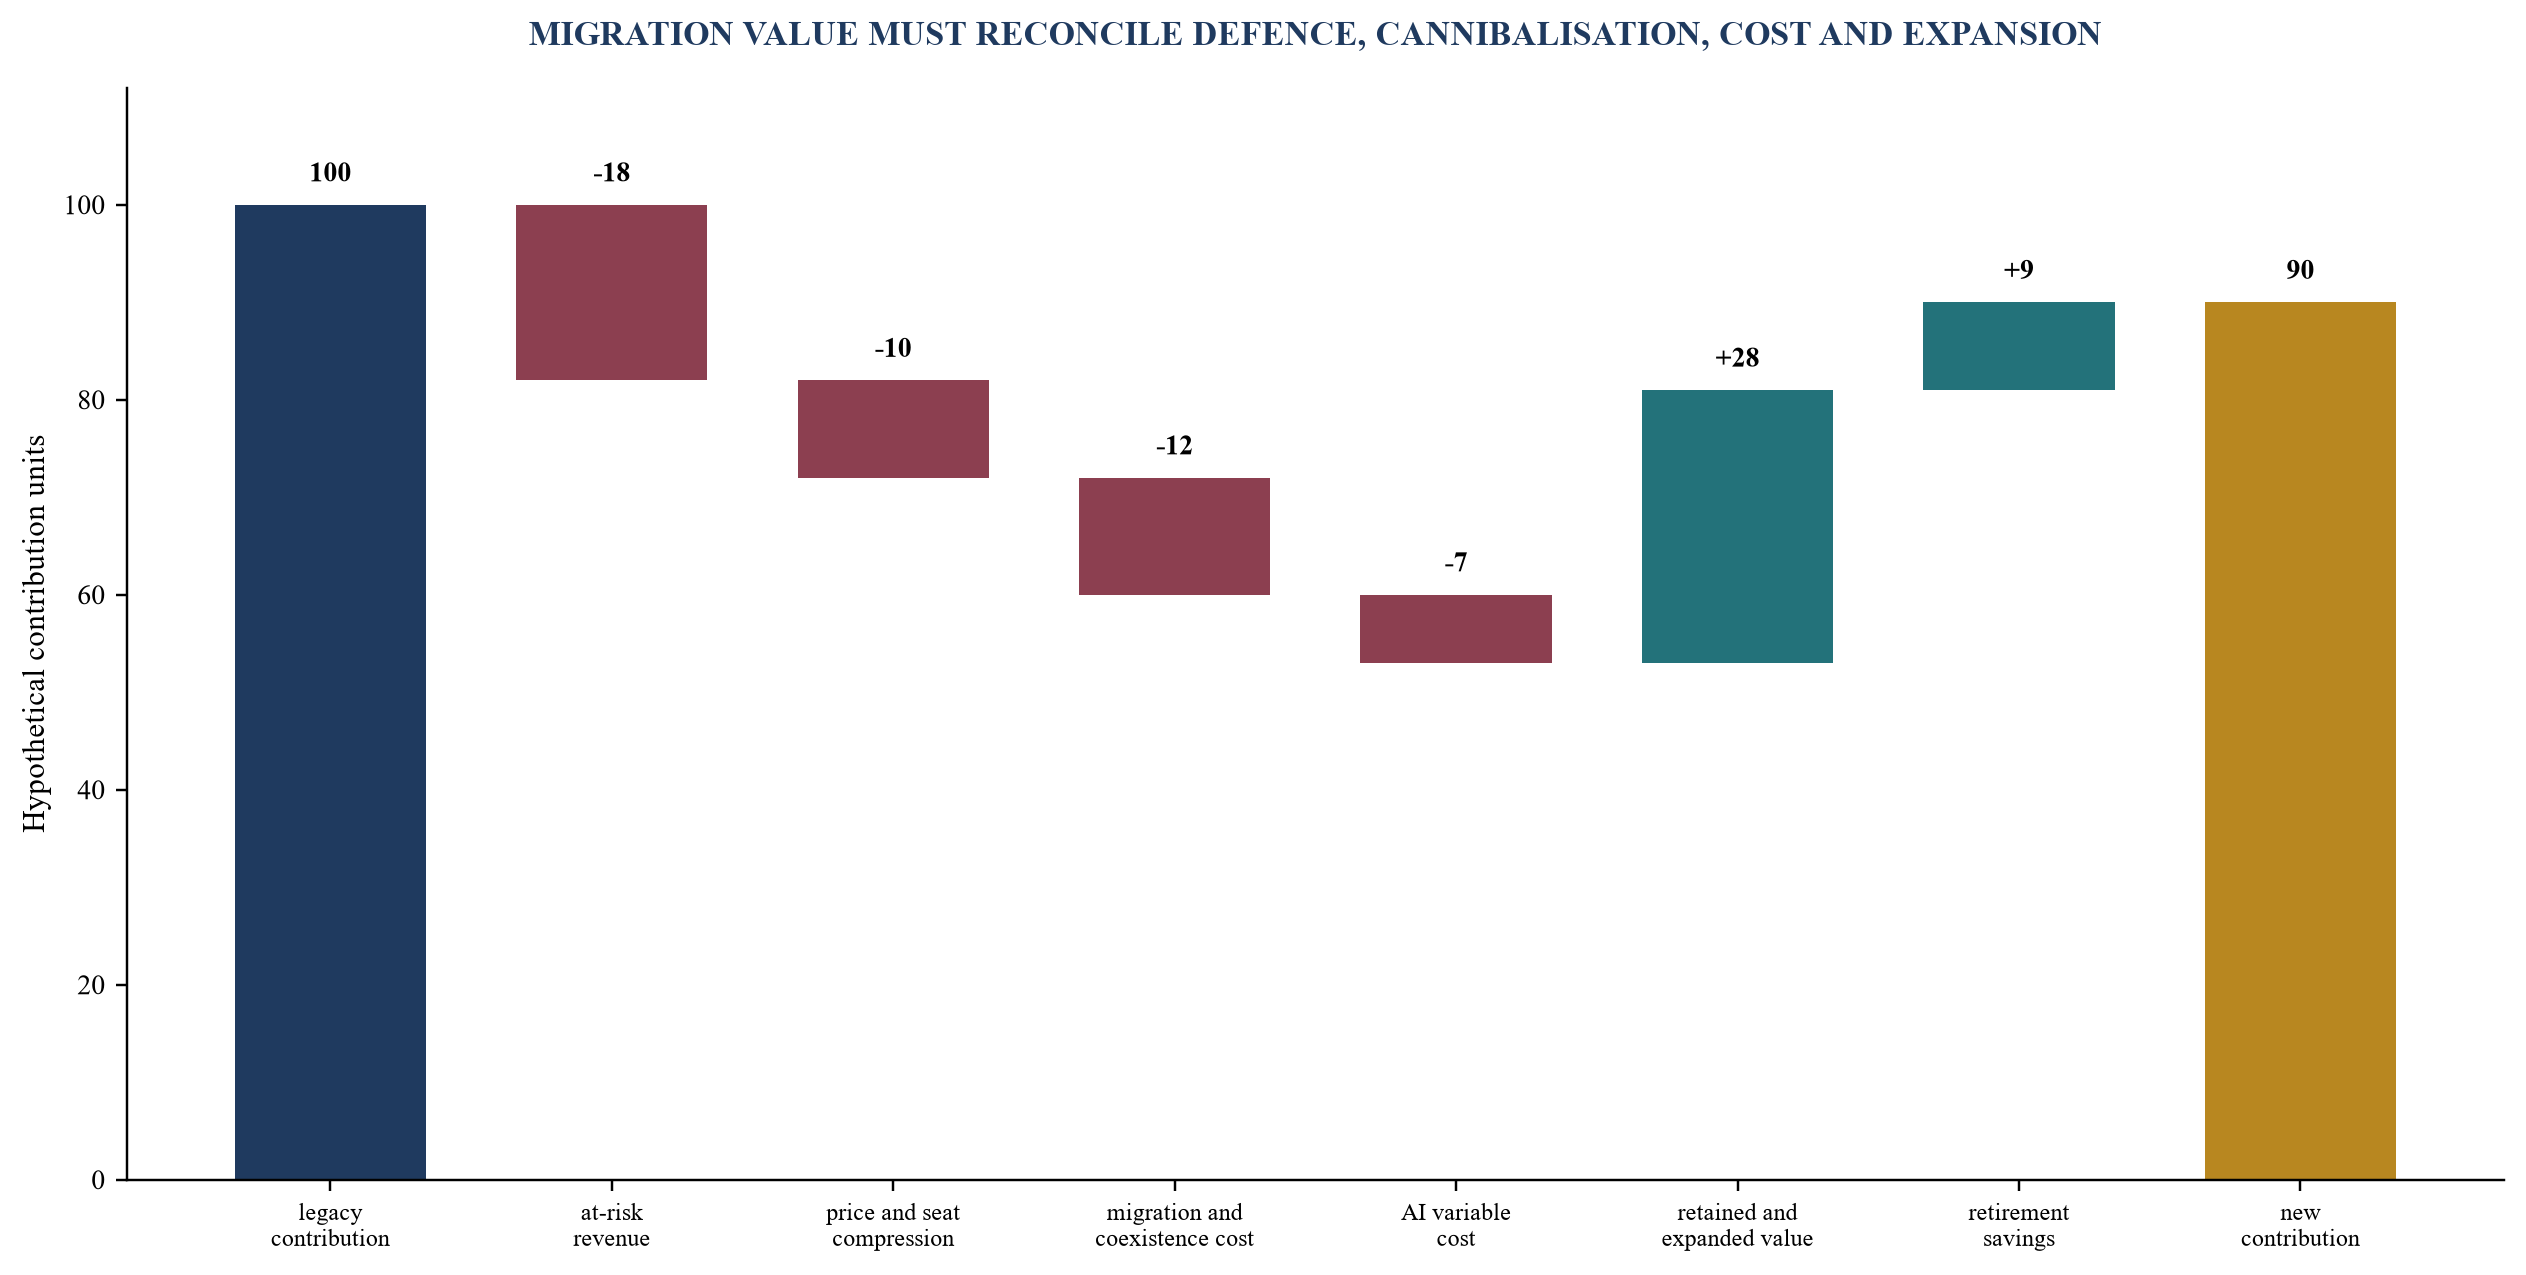
Values are hypothetical currency units. The bridge demonstrates method and is not a forecast.
Table 4. Migration-economics register
| Economic line | Required evidence | Timing question | Control |
|---|---|---|---|
| protected recurring revenue | contract, usage, renewal and cohort evidence | when is value exposed or renewed? | customer and contract reconciliation |
| cannibalisation and compression | seat, usage, package, discount and alternative | what legacy contribution is displaced? | compare customer-level old and new economics |
| build and control cost | delivery plan, capacity, architecture and assurance scope | when is cash committed and capability available? | milestone acceptance and accounting review |
| migration and coexistence | cohort plan, implementation, support and rollback | how long do dual systems operate? | customer acceptance and exit gates |
| variable AI cost | task volume, route, latency, retries and review | how does unit cost scale with adoption? | job-level cost telemetry and limits |
| retained, expanded and new value | paid commitment, renewal, outcome and cash | when is commercial evidence realised? | contract, ledger and bank reconciliation |
Management assumptions, accounting conclusions and realised cash should be reconciled separately.
10. Protect revenue through a segmented migration offer
Revenue protection is a customer programme. Each cohort needs a value proposition, product path, commercial treatment and risk plan. A strategic enterprise customer with extensive integrations may require coexistence, migration services and contractual assurance. A small self-service customer may value immediate access and simple packaging. A regulated customer may require evidence, controls and approval before activating the feature. One launch date can create avoidable churn or delay.
The company should define migration eligibility and readiness. Inputs include product usage, data quality, integration complexity, customer sponsor, procurement window, security approval, geography, contract terms and support capacity. Early cohorts should generate reusable evidence and tooling. Selection should avoid using only enthusiastic low-complexity customers if the target economics depend on difficult enterprise migrations.
Commercial treatment can include included capability, paid add-on, new tier, usage pool, outcome component, migration credit or contract extension. Each option should state the value metric, cost exposure, customer control and renewal path. Temporary incentives should be separated from permanent pricing. Sales teams need explicit authority and a record of why concessions are granted.
Customer trust can be revenue-producing when it reduces adoption friction and supports high-consequence use. The product should make system boundaries, data use, human review, sources, limitations and recourse understandable. Trust claims require operational evidence. NIST's generative-AI profile identifies risk-management actions across the lifecycle, while the EU AI Act and data-protection guidance create requirements for applicable systems and roles.[2][10][12]
11. Design the operating model for product, model and customer change
AI product management crosses functions that often operate on different cadences. Product defines customer outcomes. Engineering owns architecture and delivery. Data and machine-learning teams manage models, evaluation and data pipelines. Security, privacy and legal define controls and obligations. Finance tests economics and accounting. Sales and customer success provide commercial and adoption evidence. Operations and support manage exceptions. The operating model should make joint decisions without creating a committee for every release.
Decision rights should be explicit. A product owner can prioritise within an approved risk and economic envelope. A model or architecture owner can approve routes that meet defined thresholds. Security and privacy owners can block release for stated control failures. Finance can require economic or accounting evidence. A release authority confirms the combined gate. Escalation should be limited to material threshold breaches and unresolved trade-offs.
The evidence store should connect product requirements, evaluations, security findings, data rights, customer cohorts, incidents, costs and commercial results. A model card or technical report alone does not show customer value. A sales dashboard alone does not show product reliability. The board needs traceable links from investment thesis to observed task performance, customer behaviour and cash.
OECD research reports that AI adoption and productivity are associated with complementary assets such as digital capabilities, infrastructure, skills and management practices, and that adoption remains uneven across firm sizes and sectors.[6][7] A roadmap budget should therefore include operating-model and capability changes. Model access without workflow, data, skills and governance can create activity without durable value.
12. Govern roadmap capital through staged decision gates
Capital should be released in stages that match uncertainty. Gate zero confirms the customer job, exposure and strategic fit. Gate one approves discovery and evaluation. Gate two approves a controlled product experiment after architecture, data and risk design. Gate three approves a paid or contractually consequential pilot. Gate four approves migration scale after product, customer, cost and control thresholds. Gate five confirms realised economics and determines scale, redesign, partnership or exit.
Each gate should have entry evidence, decision authority, funding limit, acceptance criteria and stop conditions. The board should know which assumptions remain open and the cost of resolving them. A gate should prevent premature scale while allowing low-cost learning. It should not require full certainty before experimentation.
Stop conditions are essential. Examples include critical evaluation failure, inability to secure required data rights, unit cost above the approved ceiling, unacceptable latency, customer rejection, high correction burden, control failure or migration economics below the board threshold. A stop can lead to redesign or a different architecture rather than permanent cancellation. The decision record should preserve the evidence.
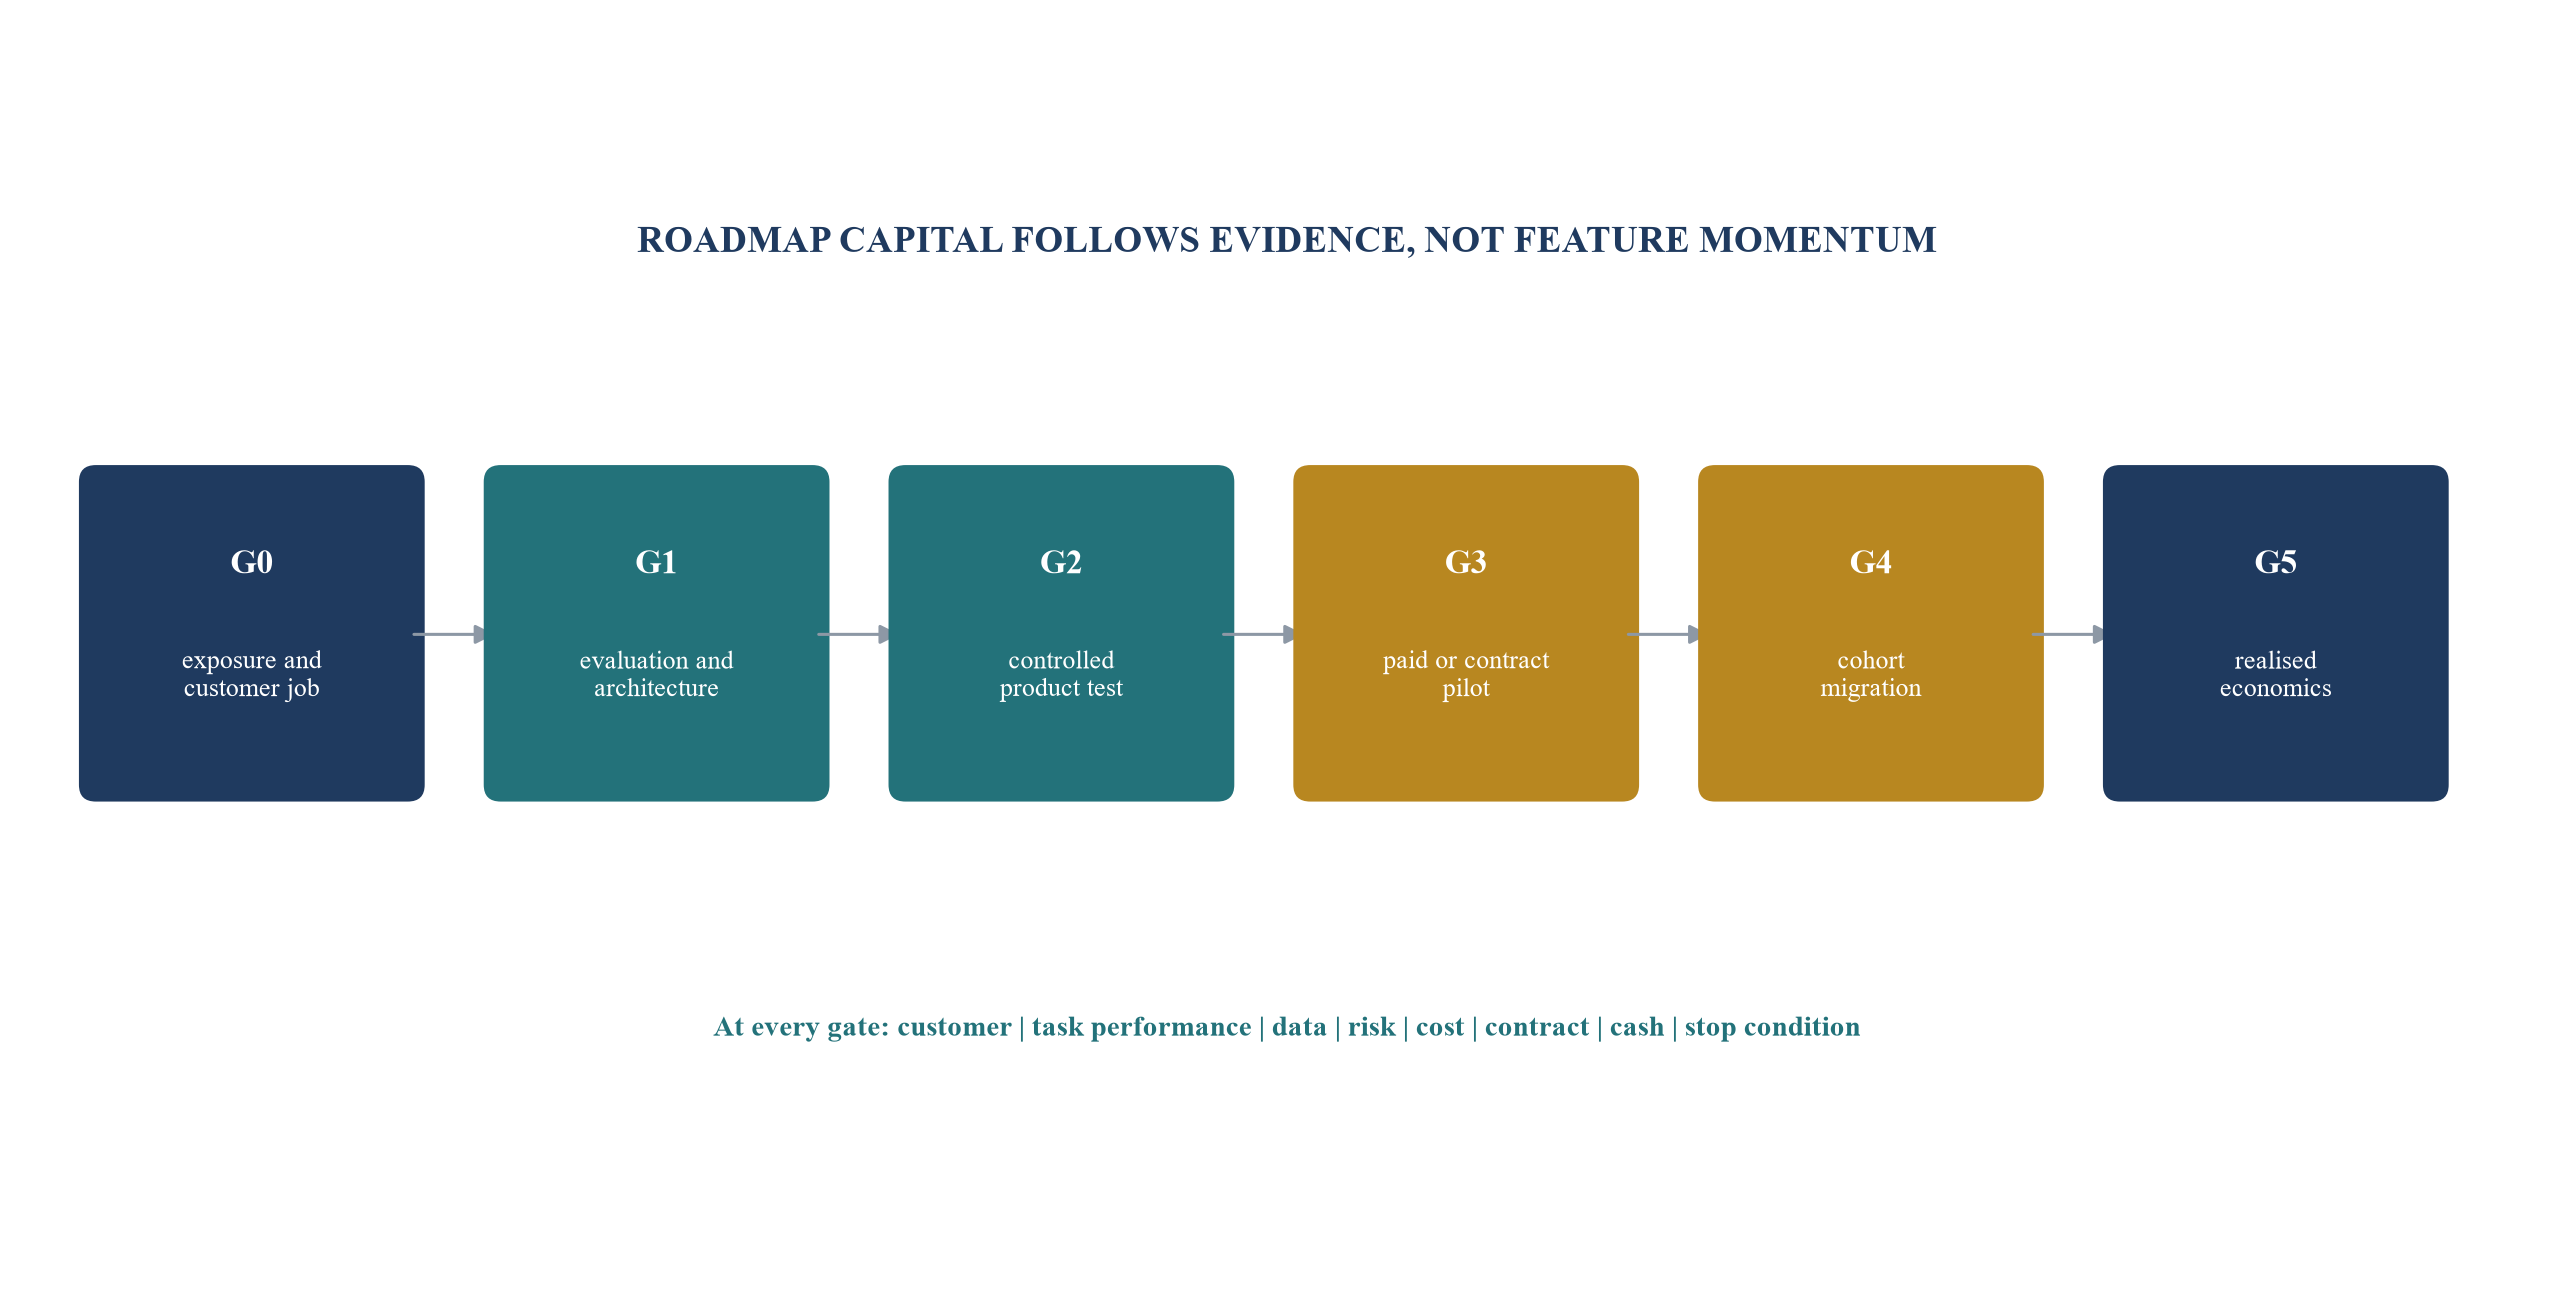
Each gate releases bounded capital. Gate criteria should be calibrated to product and customer risk.
Table 5. Board decision-gate register
| Gate | Evidence required | Board or delegated decision | Typical stop condition |
|---|---|---|---|
| exposure | module and cohort baseline, substitute and strategic fit | prioritise or defer discovery | customer job or material exposure cannot be established |
| evaluation | representative tasks, architecture options, rights and preliminary economics | approve controlled build | critical performance, data or security threshold fails |
| product test | functioning workflow, controls, telemetry and user cohort | approve paid pilot | correction, reliability, latency or cost outside limit |
| commercial pilot | contract, price, usage, customer outcome and support evidence | approve cohort migration | no consequential willingness-to-pay evidence |
| migration scale | repeatable tooling, retention, unit economics and operating capacity | scale, partner, redesign or harvest | customer or cash economics below threshold |
| realised value | ledger, cost, cash, retention and control evidence | continue allocation or exit | expected value does not reconcile to realised results |
Gate evidence should be proportionate to exposure and should retain explicit stop conditions.
13. Measure product performance and economic performance together
AI product metrics should describe the completed customer job. Technical measures such as model accuracy, groundedness, latency and cost are necessary inputs. Product measures include task completion, correction, abandonment, escalation, time saved, quality and user control. Commercial measures include activation, paid adoption, expansion, discount, retention and support. Economic measures include contribution per completed job, migration cost, cash collection and return on roadmap capital.
Metrics need denominators and cohorts. An adoption rate should specify eligible users, activated users, repeated users and time period. A quality rate should specify evaluation set, rubric, reviewer and severity. A time-saving claim should include the baseline task and any correction or review. A margin should include inference, infrastructure, human review, support and allocated service commitments where relevant.
Evaluation should detect regressions as models, prompts, retrieval, data and workflows change. The company should maintain versioned test sets and production monitoring, with safeguards for sensitive data and customer confidentiality. High-consequence tasks require stronger evidence and intervention. NIST's AI and secure-development frameworks support continuous lifecycle management rather than one-time approval.[1][2][3][4]
The board dashboard should show evidence movement rather than a large metric catalogue. For each material initiative, it should present the customer job, revenue exposed, current gate, key open assumption, latest product result, latest commercial result, unit economics, control status, capital committed and next decision date. This makes delay and unsupported momentum visible.
14. Treat reliability, security and compliance as product architecture
AI failure can arise from model behaviour, data, retrieval, prompts, tools, permissions, user input, integrations or human reliance. Controls should be placed at the point where they can prevent, detect, contain or recover. Examples include scoped permissions, input filtering, retrieval access controls, grounded output, deterministic calculations, policy checks, human approval, rate limits, audit records, incident response and customer recourse.
The level of control should follow the customer job and impact. A drafting suggestion can permit broader experimentation than an autonomous action affecting finance, employment, safety or regulated decisions. The roadmap should classify use cases and define permitted autonomy. A product can combine AI assistance with deterministic execution and explicit approval rather than choosing between full automation and no AI.
Secure development includes environments, component provenance, requirements, verification and vulnerability response. NIST SP 800-218 and SP 800-218A provide relevant practices for software and generative-AI development and acquisition.[3][4] The product roadmap should allocate capacity to these practices and record evidence. Third-party model use does not transfer all responsibility away from the software company.
Regulatory applicability requires legal analysis. The EU AI Act assigns obligations by role and classification and has phased application provisions.[10] Data-protection rules can apply to personal data used in training, retrieval, evaluation and operation.[12] Contract, sector and geography can create additional requirements. The board should require a jurisdiction and role map before scale and update it as the product and market change.
15. Use partnership and acquisition selectively
Partnership can accelerate capability, distribution, data access or implementation while creating dependency, margin sharing and control gaps. The thesis should state the asset being accessed, why partnership is superior, how economics and obligations are shared, what data moves and how the company exits.
Acquisition may be appropriate when a target has a validated product, scarce team, governed data, workflow access or distribution that cannot be reproduced economically. Diligence should test customer retention, task performance, architecture, dependencies, rights, security, provenance, cost, contracts and integration feasibility.
The CMA's analysis of foundation-model markets highlights the importance of access to critical inputs, incumbent positions and partnerships.[5] A software company should understand how its chosen provider or partner sits within the value chain and whether the arrangement narrows future access. Multi-provider design has costs, while unmanaged concentration can reduce negotiating and product flexibility.
Transaction economics should include the roadmap avoided, acquired revenue quality, integration, migration, retention, technical debt, remediation and opportunity cost. The internal-investment gates can be adapted for partnership and acquisition.
16. Sequence the first 180 days
The first thirty days should establish the baseline and decision system. Management identifies material customer jobs, revenue by module and cohort, contract windows, usage, cost, architecture, data rights and current AI initiatives. It appoints decision owners, freezes definitions and stops unsupported product-wide claims. The board selects a small number of exposure areas for evidence-led work.
Days thirty-one to sixty focus on substitution and customer evidence. Cross-functional teams decompose workflows, evaluate credible alternatives, interview customers, design consequential commercial tests and construct representative evaluation sets. Finance builds the migration and unit-economics model. Security, privacy and legal define required controls and applicability questions.
Days sixty-one to one hundred and twenty run bounded product and paid tests. The company instruments task performance, correction, cost, adoption, price and customer outcomes. It builds coexistence and rollback where legacy revenue is exposed. Gate reviews stop, redesign or advance initiatives. Sales and customer-success teams use approved offers and record concessions and objections consistently.
Days one hundred and twenty-one to one hundred and eighty prepare repeatable cohort migration for initiatives that passed. Product and engineering harden controls, evaluation and observability. Customer operations create migration playbooks. Finance reconciles expected and actual economics. The board reallocates capacity among defend, extend, rebuild and retire based on evidence.
Table 6. First 180-day execution cadence
| Period | Principal work | Required output | Decision |
|---|---|---|---|
| days 1-30 | freeze revenue, customer, product, architecture and cost baseline | exposure register and decision rights | select material customer jobs |
| days 31-60 | substitution tests, customer research, evaluation and economics | product-substitution matrix and test designs | approve bounded experiments |
| days 61-120 | controlled product and paid commercial tests | performance, willingness-to-pay, risk and cost evidence | stop, redesign or advance |
| days 121-180 | cohort migration tooling, controls and operating readiness | repeatable migration case and board dashboard | scale, partner, harvest or exit |
| continuous | incidents, regulation, provider terms and competitor evidence | refreshed assumptions and exception log | reallocate roadmap capital |
Timing is illustrative. Scope, risk and customer commitments determine the live cadence.
17. Questions the board should require management to answer
The board should ask which customer jobs create the revenue base, which have credible alternatives, where AI increases value, where it compresses price and where it changes the buying unit. Evidence should be presented by module, segment and contract window.
Management should show what customers have paid, renewed, expanded or replaced; distinguish stated interest from consequential choice; identify the value metric and cost scaling; and state where the new offer cannibalises legacy economics.
The board should ask why the company's data position is defensible and lawful. It should see rights, provenance, quality, feedback and learning velocity. It should ask which model, cloud, data and distribution dependencies can change economics or access. It should understand portability and the cost of exercising it.
Finally, the board should ask what evidence releases the next unit of capital and what stops the initiative. It should see migration cost, customer retention, unit economics, control status, accounting review and realised cash. The objective is disciplined speed: faster learning on material questions and slower scaling when evidence is incomplete.
18. Conclusion
AI disruption in software is a portfolio of changes in customer jobs, cost, interfaces, data, risk and market structure. A feature-led response can increase activity while leaving the revenue model exposed. A defensive response can preserve short-term contracts while customers move to a more useful workflow. The board needs a system that connects exposure, product design, customer choice, data advantage, migration and cash.
The control system in this paper begins with a frozen baseline, decomposes workflows into substitutable units, tests willingness to pay through consequential behaviour, scores the complete data loop, chooses architecture through representative evaluation, and calculates migration economics at customer and task level. It releases capital through staged gates and preserves the distinction between opportunity, product result, commercial result, accounting and realised cash.
The company can defend controlled workflows, extend products where proprietary context matters, rebuild where AI changes the architecture, partner where access is superior, and retire complexity that no longer earns customer value. Each choice needs explicit evidence, ownership, thresholds and stop conditions.
References
- National Institute of Standards and Technology. Artificial Intelligence Risk Management Framework (AI RMF 1.0). NIST AI 100-1, 2023. https://doi.org/10.6028/NIST.AI.100-1
- Autio, C., Schwartz, R., Dunietz, J., Jain, S., Stanley, M., Tabassi, E., Hall, P. and Roberts, K. Artificial Intelligence Risk Management Framework: Generative Artificial Intelligence Profile. NIST AI 600-1, 2024. https://doi.org/10.6028/NIST.AI.600-1
- Souppaya, M., Scarfone, K. and Dodson, D. Secure Software Development Framework (SSDF) Version 1.1. NIST SP 800-218, 2022. https://doi.org/10.6028/NIST.SP.800-218
- Booth, H., Souppaya, M., Vassilev, A., Ogata, M., Stanley, M. and Scarfone, K. Secure Software Development Practices for Generative AI and Dual-Use Foundation Models. NIST SP 800-218A, 2024. https://doi.org/10.6028/NIST.SP.800-218A
- Competition and Markets Authority. AI Foundation Models: Technical Update Report. 16 April 2024. https://assets.publishing.service.gov.uk/media/661e5a4c7469198185bd3d62/AI_Foundation_Models_technical_update_report.pdf
- OECD. Fostering an Inclusive Digital Transformation as AI Spreads among Firms. OECD Artificial Intelligence Papers, 2024. https://doi.org/10.1787/5876200c-en
- OECD, Boston Consulting Group and INSEAD. The Adoption of Artificial Intelligence in Firms: New Evidence for Policymaking. OECD Publishing, 2025. https://doi.org/10.1787/f9ef33c3-en
- Brynjolfsson, E., Li, D. and Raymond, L. R. Generative AI at Work. Quarterly Journal of Economics 140(2), 2025, 889-942. Working-paper record: https://doi.org/10.3386/w31161
- Dell'Acqua, F., McFowland, E. III, Mollick, E., Lifshitz, H., Kellogg, K. C., Rajendran, S., Krayer, L., Candelon, F. and Lakhani, K. R. Navigating the Jagged Technological Frontier. Organization Science, 2026. https://doi.org/10.1287/orsc.2025.21838
- European Union. Regulation (EU) 2024/1689 laying down harmonised rules on artificial intelligence. Official Journal, 12 July 2024. https://eur-lex.europa.eu/eli/reg/2024/1689/oj
- European Union. Regulation (EU) 2023/2854 on harmonised rules on fair access to and use of data. Official Journal, 22 December 2023. https://eur-lex.europa.eu/eli/reg/2023/2854/oj
- Information Commissioner's Office. Guidance on AI and Data Protection and AI and Data Protection Risk Toolkit. https://ico.org.uk/for-organisations/uk-gdpr-guidance-and-resources/artificial-intelligence/guidance-on-ai-and-data-protection/
- IFRS Foundation. IAS 38 Intangible Assets. 2022 issued standard. https://www.ifrs.org/content/dam/ifrs/publications/pdf-standards/english/2022/issued/part-a/ias-38-intangible-assets.pdf
- IFRS Foundation. IAS 36 Impairment of Assets. 2022 issued standard. https://www.ifrs.org/content/dam/ifrs/publications/pdf-standards/english/2022/issued/part-a/ias-36-impairment-of-assets.pdf
- IFRS Foundation. IFRS 15 Revenue from Contracts with Customers. 2022 issued standard. https://www.ifrs.org/content/dam/ifrs/publications/pdf-standards/english/2022/issued/part-a/ifrs-15-revenue-from-contracts-with-customers.pdf
