

1. Define the acquisition decision
The board decision is whether the buyer should acquire a multi-site retailer at a price and on terms supported by cash earnings that can be traced to stores, channels and contracts. Reported EBITDA is a starting point. The diligence task is to establish which locations generate cash, which locations consume capital, how quickly new units mature, which costs are recurring, which income belongs to the period, and what liabilities follow weak stores after closing.
The decision should be framed as a portfolio underwriting exercise. A retail estate contains different economic assets: mature core stores, young stores, remodels, relocations, seasonal sites, online fulfilment nodes, concession units and stores already impaired or selected for exit. Consolidated accounts can conceal the distribution because profitable stores subsidise weak ones and central allocations may not follow operational causation. A buyer needs a unit-level view before it chooses the perimeter, debt capacity or integration plan.
Approval should answer five questions. What is sustainable four-wall cash contribution by store and cohort? Which central costs and channel economics are required to earn that contribution? How much maintenance, remodel, inventory and closure cash is needed? How does the estate perform under demand, labour, occupancy and cannibalisation stresses? Which findings belong in price, conditions, indemnities, covenants or operating controls? These questions make EBITDA a decision variable that can be tested.
2. Use the Store-to-Ledger Retail Diligence Framework
The proposed framework has eight linked gates: estate perimeter; data integrity; store cohorts; four-wall economics; channel and catchment attribution; lease, inventory and capex obligations; enterprise-cost reconstruction; and transaction protection. Each gate produces an evidence pack and a value consequence. The team should not progress from reported results to valuation until the store population and ledger bridge reconcile.
Public filings show why a unit-level method is necessary. Sportsman's Warehouse disclosed four-wall Adjusted EBITDA losses and projected-cash-flow declines at certain stores, leading to USD 17.8 million of impairment charges for ten locations in fiscal 2025 [1]. Signet described store-level asset groups and impairment assessments based on real-estate decisions and performance over remaining lease terms [2]. These examples do not establish a benchmark for another retailer. They demonstrate that location economics, leases and cash-flow forecasts can determine recoverability even when consolidated reporting remains positive.
The framework requires a single controlled data model. Every store must have a stable identifier linked to point-of-sale records, payroll, rent, inventory, capex, lease terms, digital orders, customer geography and the general ledger. Every adjustment needs an owner, source, calculation, cash effect, recurrence assessment and audit trail. Unsupported normalisations remain outside the base case.
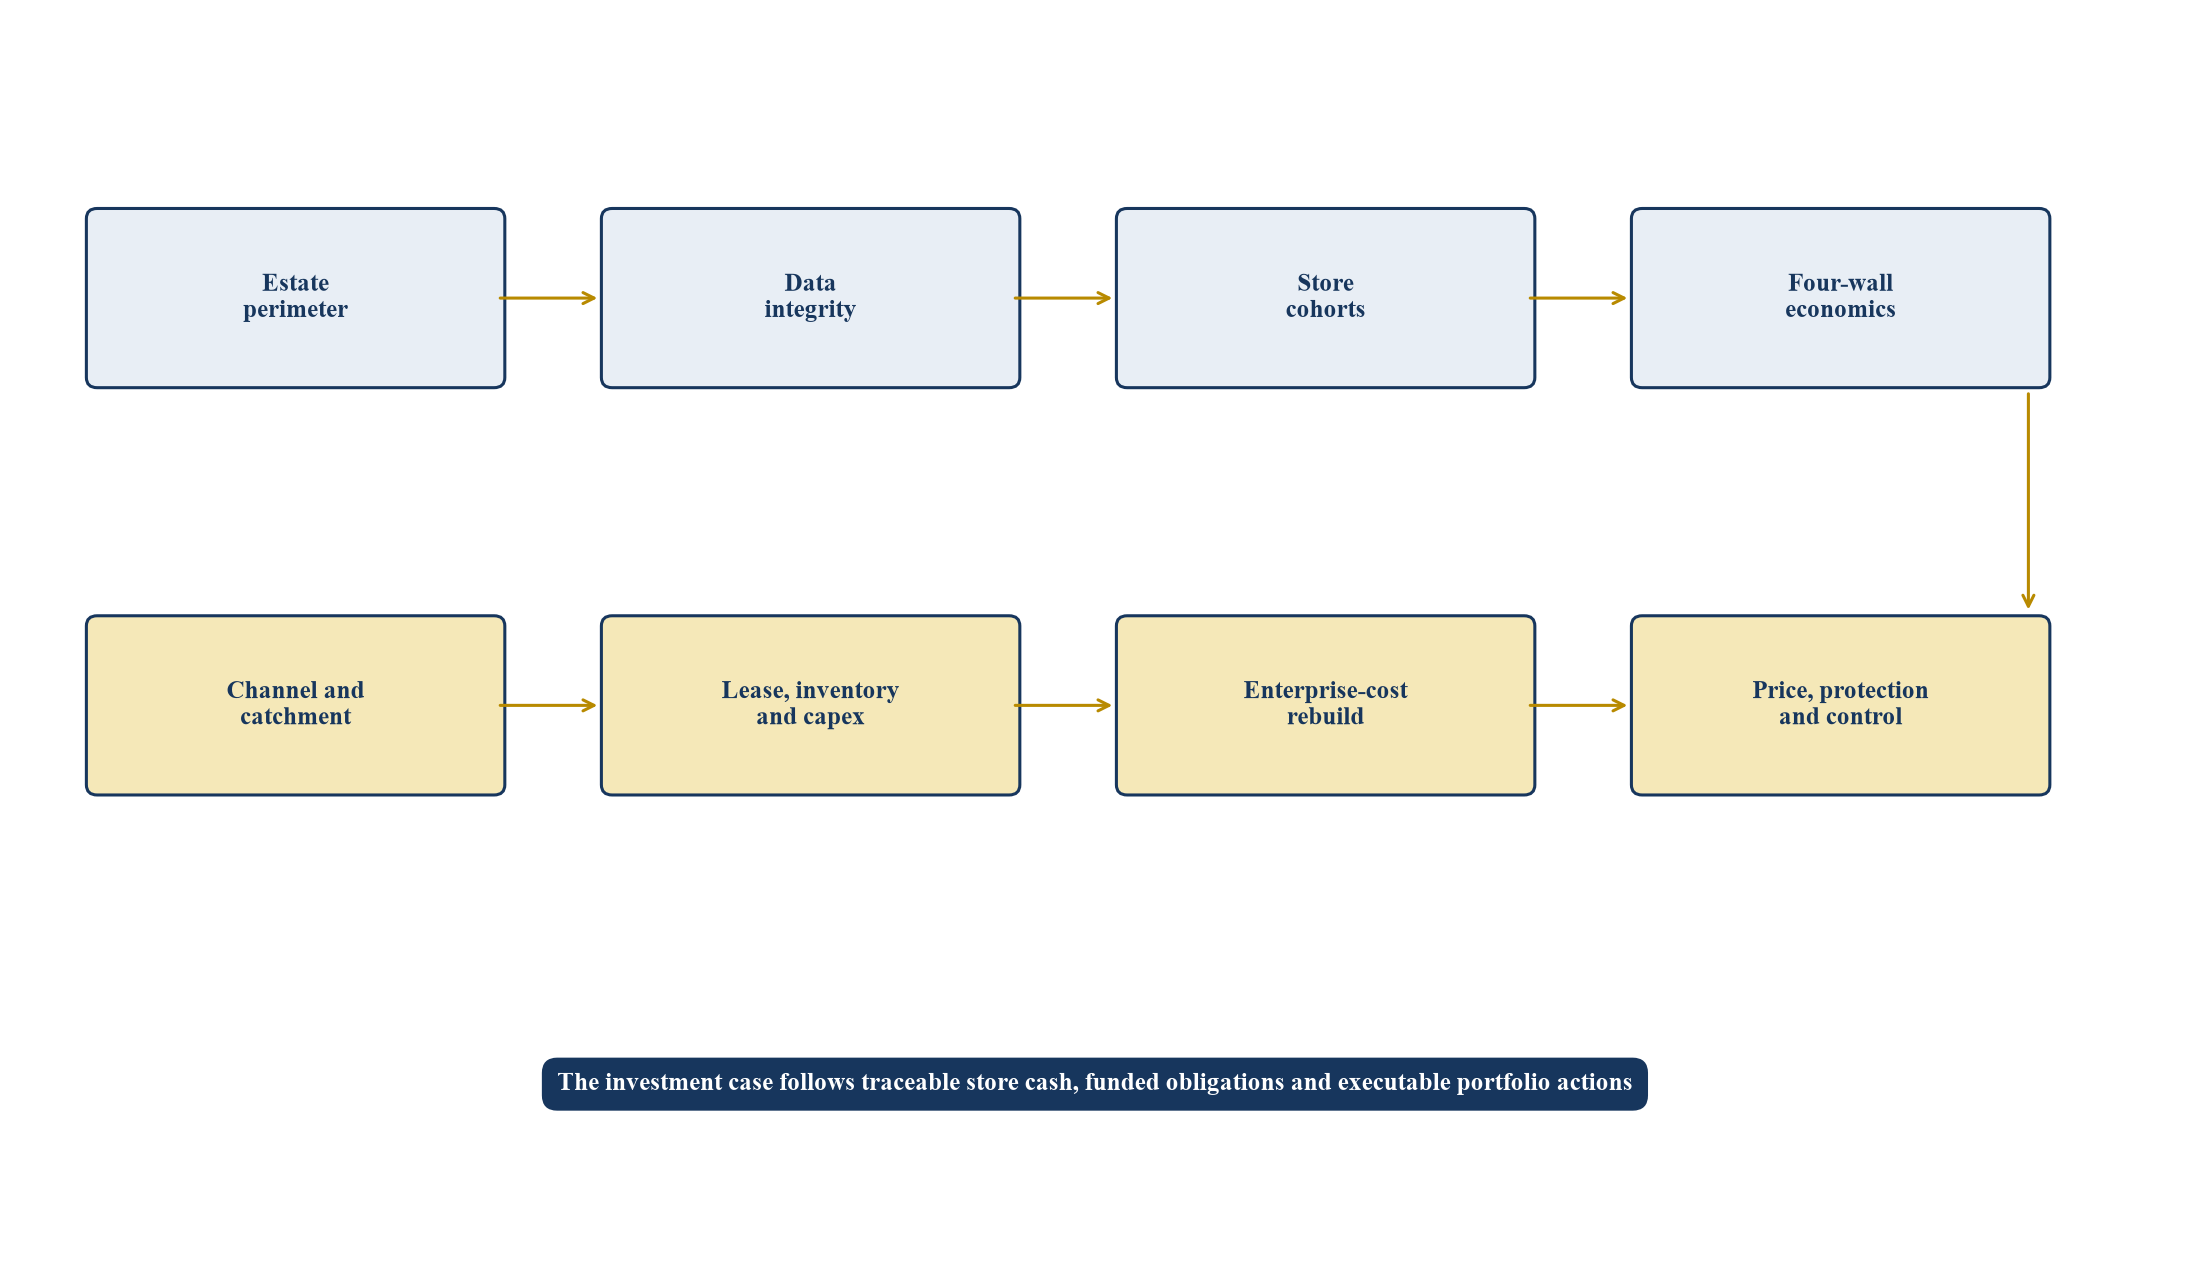
Each evidence gate must reconcile before the acquisition model relies on reconstructed EBITDA.
3. Freeze the estate perimeter
The first reconciliation is the store population. The buyer should obtain a master register listing store identifier, legal entity, banner, format, address, catchment, opening date, relocation history, remodel date, ownership or lease status, lease expiry, closure plan, floor area, trading status and channel roles. The register should reconcile to point-of-sale terminals, payroll locations, rent schedules, fixed assets, inventory systems, licences and public location lists.
Population differences frequently reveal material issues. A store can trade under one identifier while payroll and lease records use another. Temporary closures may remain in comparable-store measures. Concessions can appear as stores even though the host controls customer cash. Online fulfilment nodes can absorb labour and occupancy without receiving attributed revenue. Stores approved for closure may still contribute revenue while carrying future exit costs. Each difference should be resolved before averages are calculated.
The diligence team should prepare an opening-to-closing bridge for the review period. The bridge identifies openings, closures, relocations, transfers, format conversions and temporary outages. It also determines which stores were eligible for each management metric. Dollar General states that methods for calculating same-store sales vary across retail and disclosed 20,268 same stores for fiscal 2025 [3]. TJX likewise explains its own comparable-sales population and warns that industry measures may not be comparable [4]. The buyer should therefore reproduce the target's population rules rather than accept the label.
4. Create the minimum viable store dataset
The minimum dataset should combine daily sales, units, transactions, returns, discounts, tax, tender, product category, channel, fulfilment method, labour hours, wage cost, rent, service charges, utilities, local marketing, shrink, inventory, delivery cost, merchant fees, maintenance, store capex and cash collections. Monthly data can support a preliminary view. Daily or transaction-level data is needed for seasonality, promotions, closures, stock-outs and digital attribution.
Data quality tests should cover completeness, uniqueness, timing, currency, units and hierarchy. Daily sales should aggregate to monthly store reports and the ledger. Transaction counts should align with point-of-sale journals. Payroll hours and cost should reconcile to payroll providers. Rent should reconcile to executed leases and payments. Inventory movement should bridge opening stock, receipts, transfers, sales, markdowns, shrink and closing stock. Capex should trace to projects and fixed-asset records.
Every transformation should be reproducible. The team should preserve source files, hash key extracts, document filters and maintain a data dictionary. Store identifiers should not be overwritten during matching. Exceptions belong in a control table with an owner and disposition. A model that cannot be rerun after the latest trading period cannot support signing adjustments or post-close governance.
| Evidence layer | Core fields | Primary reconciliation | Decision use |
|---|---|---|---|
| Estate | Site, format, dates, catchment, status | Lease, payroll and fixed assets | Perimeter and cohort definition |
| Commercial | Sales, transactions, ticket, units, returns | Point of sale to revenue ledger | Demand and pricing quality |
| Labour | Hours, roles, rates, overtime, agency cost | Rosters and payroll to ledger | Sustainable staffing model |
| Occupancy | Base rent, turnover rent, service charges, term | Lease abstracts to payments | Fixed-cost and exit exposure |
| Inventory | Receipts, transfers, markdowns, shrink, stock | Subledger to balance sheet | Margin and working-capital quality |
| Capital | Maintenance, remodel, new-store and closure spend | Projects to fixed assets and cash | Recurring cash requirement |
| Channel | Origin, fulfilment, returns and delivery cost | Order system to store and ledger | Omnichannel contribution |
Each layer should reconcile to the store register and the general ledger before valuation use.
5. Reconcile sales from transaction to ledger
Sales diligence should begin with gross demand and end with recognised revenue and cash. The bridge should show ticket value, discounts, coupons, loyalty awards, returns, cancellations, sales tax, delivery income, gift-card redemptions, breakage, marketplace commissions and timing differences. Product and channel subtotals should reconcile to the store-level income statement and general ledger.
Traffic, conversion and basket should be separated. Dollar General attributed its fiscal 2025 same-store sales increase to both customer traffic and average transaction amount [3]. TJX distinguishes transactions, average ticket and average basket in its disclosures [4]. These drivers have different persistence. Price can raise ticket while volume weakens. Mix can lift average basket while visit frequency falls. A buyer should model the driver, not only the net percentage.
Returns require particular attention where purchases and returns cross stores or channels. A store can receive credit for the sale while another absorbs return handling and markdown. Digital sales may be recorded centrally even when store labour, inventory and occupancy fulfil the order. The diligence model should establish consistent rules for origination, fulfilment and return economics. Revenue should be accompanied by the cost and working-capital consequences needed to earn it.
6. Define comparable stores without hiding the portfolio
Comparable-store analysis should remove opening and closure noise while retaining the full estate view. The buyer should reproduce management's definition and create an independent definition based on complete trading periods, stable format and reliable data. Differences between the two populations should be quantified. New, relocated, remodelled, temporarily closed and materially resized stores should be identified rather than blended.
Public issuers use different seasoning periods. A recent public filing for a multi-site operator defined same-store sales using stores open for at least eighteen months and described average unit volume for the comparable base [5]. TJX generally includes stores and e-commerce sites beginning their third fiscal year [4]. Zumiez uses a different anniversary rule and explains treatment for relocations, size changes and temporary closures [6]. These differences show why peer percentages cannot be compared without definition alignment.
The investment case should present three views: reported comparable sales; independently standardised comparable sales; and total estate sales including openings and closures. The bridge should identify price, volume, mix, traffic, ticket, space, days traded and currency. A strong comparable-store percentage can coexist with value destruction if weak sites close, new sites cannibalise mature stores or capex rises faster than cash contribution.
7. Segment stores into decision cohorts
Cohorts should be defined by economic question rather than reporting convenience. Useful dimensions include opening vintage, format, geography, catchment, floor area, lease type, ownership, remodel status, maturity, sales density, margin, online fulfilment role and competitive intensity. The objective is to identify repeatable patterns and portfolio actions.
Opening cohorts reveal maturation. The buyer should calculate monthly sales, transactions, gross margin, labour productivity, occupancy leverage, capex and cash contribution from pre-opening through stabilisation. Stores that require longer to mature consume more liquidity and can make recent growth look stronger than its cash economics. A cohort should be considered mature only when operating behaviour stabilises under a stated test, not after an arbitrary anniversary.
Performance cohorts support intervention. Core stores may justify reinvestment; growth stores may require local marketing or labour; marginal stores may need lease action; structurally weak stores may need closure. The model should avoid using the best quartile as the template for all stores. Transferability depends on catchment, competition, format and operating capacity. The board should see the distribution of outcomes and the capital required to move stores between cohorts.
8. Rebuild four-wall contribution consistently
Four-wall contribution should measure the cash economics directly controlled or caused by a store. A consistent definition normally begins with net sales, deducts product cost, shrink, store labour, occupancy, merchant and delivery costs, local marketing, utilities, repairs and other store-operating expenses, then identifies maintenance capital separately. The definition should state treatment of online orders, returns, rebates, shared labour and regional supervision.
Store-level profit is often a non-GAAP or management measure. A public multi-site filing explicitly described Store-Level Profit and Store-Level Profit Margin as supplemental measures and reconciled them to GAAP measures [5]. Sportsman's Warehouse used four-wall Adjusted EBITDA in evaluating certain locations [1]. These disclosures show the operational usefulness of store metrics and the need for reconciliation. A buyer should not assume that similarly titled measures contain the same items.
The model should present contribution before and after maintenance capital. EBITDA can appear positive while a store requires recurring remodels, equipment replacement or leasehold expenditure. Cash contribution should also reflect inventory investment and seasonal working capital. The diligence conclusion should identify which measure supports valuation, which supports closure decisions and which supports debt service.
9. Test gross margin quality
Gross margin should be decomposed into initial mark-up, mix, permanent markdown, promotional markdown, supplier funding, freight, duty, shrink, obsolescence, returns and inventory accounting. A consolidated margin improvement can arise from temporary supplier income, reduced markdown provision, delayed freight recognition or favourable mix that may not recur. Store and category views should reconcile to purchase and inventory records.
Supplier income should be recognised only when the underlying performance conditions and period are supported. The buyer should inspect contracts, debit notes, accruals, cash receipts and post-period reversals. Concentrated or discretionary rebates deserve scenario treatment. Rebates used to reduce inventory cost affect the timing of margin recognition and should not be counted again as other income.
Markdown effectiveness should be tested through sell-through and terminal inventory, not the markdown percentage alone. A lower markdown rate can defer necessary clearance and inflate both margin and stock. The model should identify aged units, weeks of supply, seasonal exit dates and expected recovery. Gross margin that depends on selling obsolete stock at carrying value should be excluded from sustainable EBITDA.
10. Analyse inventory as both margin and cash
Inventory diligence should connect quantity, cost, age, location, ownership and demand. The buyer should reconstruct movements by SKU and store, identify negative stock, repeated transfers, slow-moving items, vendor returns, consignment, damaged goods and stock held outside the saleable estate. Physical-count results and shrink adjustments should reconcile to the ledger.
The quality-of-earnings model should test whether inventory provisions reflect actual clearance experience. It should separate temporary supply constraints from structural overbuying and identify stock accumulated to support unproven openings. Aged inventory can create a double effect: future markdown reduces earnings and the purchase price includes working capital that will not convert at book value.
Working-capital targets should use seasonally and strategically comparable periods. A closing target based on a low point can transfer replenishment funding to the buyer. A high point can transfer obsolete stock at full value. The agreement should define eligible inventory, valuation policy, reserve methodology, consignment, goods in transit, inter-store transfers and post-closing count procedures. Disputed categories should have specific mechanisms rather than a broad accounting-principles clause.
11. Reconstruct labour productivity
Labour analysis should separate fixed coverage, variable selling hours, management, overtime, agency, training, pre-opening and central support. Hours and rates should be reviewed by store, role, daypart and sales band. Payroll cost should reconcile to paid hours, accruals, bonuses, payroll taxes and benefits. Temporary vacancies and deferred hiring should not be treated as permanent savings without an operating test.
BLS reported that U.S. retail labour productivity increased 2.9 per cent in 2025 while sector output rose 2.5 per cent and hours worked declined 0.4 per cent [7]. The statistic provides economic context and does not determine a target's achievable productivity. The buyer should compare the target's labour curve with its own service proposition, transaction complexity, opening hours and compliance requirements.
A sustainable staffing model uses workload drivers. Transactions, deliveries, replenishment units, returns, fulfilment orders, fitting-room activity and security needs can explain labour better than sales alone. The diligence model should estimate minimum safe coverage and variable hours. Savings below the coverage floor may reduce conversion, increase shrink or create compliance risk. Labour synergy should therefore be linked to a redesigned process, technology or schedule rather than an unsupported percentage reduction.
12. Underwrite occupancy and lease exposure
Occupancy should include base rent, turnover rent, common-area charges, service charges, insurance, property taxes, utilities, maintenance and restoration obligations. The lease register should capture term, break, renewal, indexation, guarantees, co-tenancy, exclusivity, assignment, change of control, closure restrictions and landlord incentives. Payments and accruals should reconcile to executed documents.
IFRS 16 requires relevant information about how leases affect financial position, performance and cash flow [8]. Accounting presentation does not remove the commercial obligation. The acquisition model should show rent and lease cash separately, align enterprise value and debt treatment, and avoid mixing pre- and post-lease EBITDA multiples. The team should also identify leases held outside the target perimeter or supported by seller guarantees.
Weak-store decisions need lease economics. A negative four-wall store can still have a better keep-open value than immediate closure if the remaining unavoidable rent, exit payment and inventory liquidation are substantial. Caleres disclosed that store impairment analysis uses projected location cash flows, discount rates and current market lease rates, and noted that exiting leases may be difficult [9]. The buyer should model trade, renegotiate, assign, sublet and close alternatives for each material weak store.
13. Identify maintenance, remodel and growth capital
Capital expenditure should be classified by purpose and cash consequence. Maintenance preserves current sales and compliance. Remodel investment seeks a measurable uplift or protects the lease and brand. Growth capex opens stores or adds capacity. Technology and distribution projects may support both stores and channels. Closure capex funds reinstatement, debranding and asset disposal.
Reported EBITDA can rise while maintenance is deferred. The buyer should compare recent spend with store age, condition surveys, equipment lives, lease obligations and management's project pipeline. It should test whether repairs have been capitalised and whether remodel benefits have been credited before completion. A physical sample of stores should be selected from different cohorts, including strong and weak locations.
Each remodel should have a pre-investment baseline, spend, downtime, reopening date and post-investment performance. The model should distinguish sales transferred from nearby stores. Growth projects should include pre-opening expense, initial inventory, rent during fit-out, recruitment and working capital. The investment committee should receive EBITDA before and after recurring maintenance capital and a separate catch-up-capital schedule.
14. Measure cannibalisation and catchment overlap
Cannibalisation occurs when a new, relocated or enlarged store captures sales that would otherwise belong to an existing store or channel. The buyer should map customer postcodes, drive times, loyalty identifiers, transaction migration and local marketing. A pre- and post-opening analysis should control for seasonality, price, promotions and market growth.
The relevant metric is incremental portfolio contribution. A new store can meet its own sales target while reducing total catchment cash after duplicate labour, rent, inventory and capex. Conversely, a nearby opening can improve customer convenience and distribution efficiency. The model should calculate the portfolio result and show the allocation method.
Cannibalisation also affects comparable sales. A mature store may report decline because demand moved to a non-comparable opening. Total area performance can remain healthy while the reported comparable metric weakens. The diligence pack should therefore show store, catchment and total-estate views. Expansion forecasts should use observed transfer patterns from comparable openings, with a range where evidence is limited.
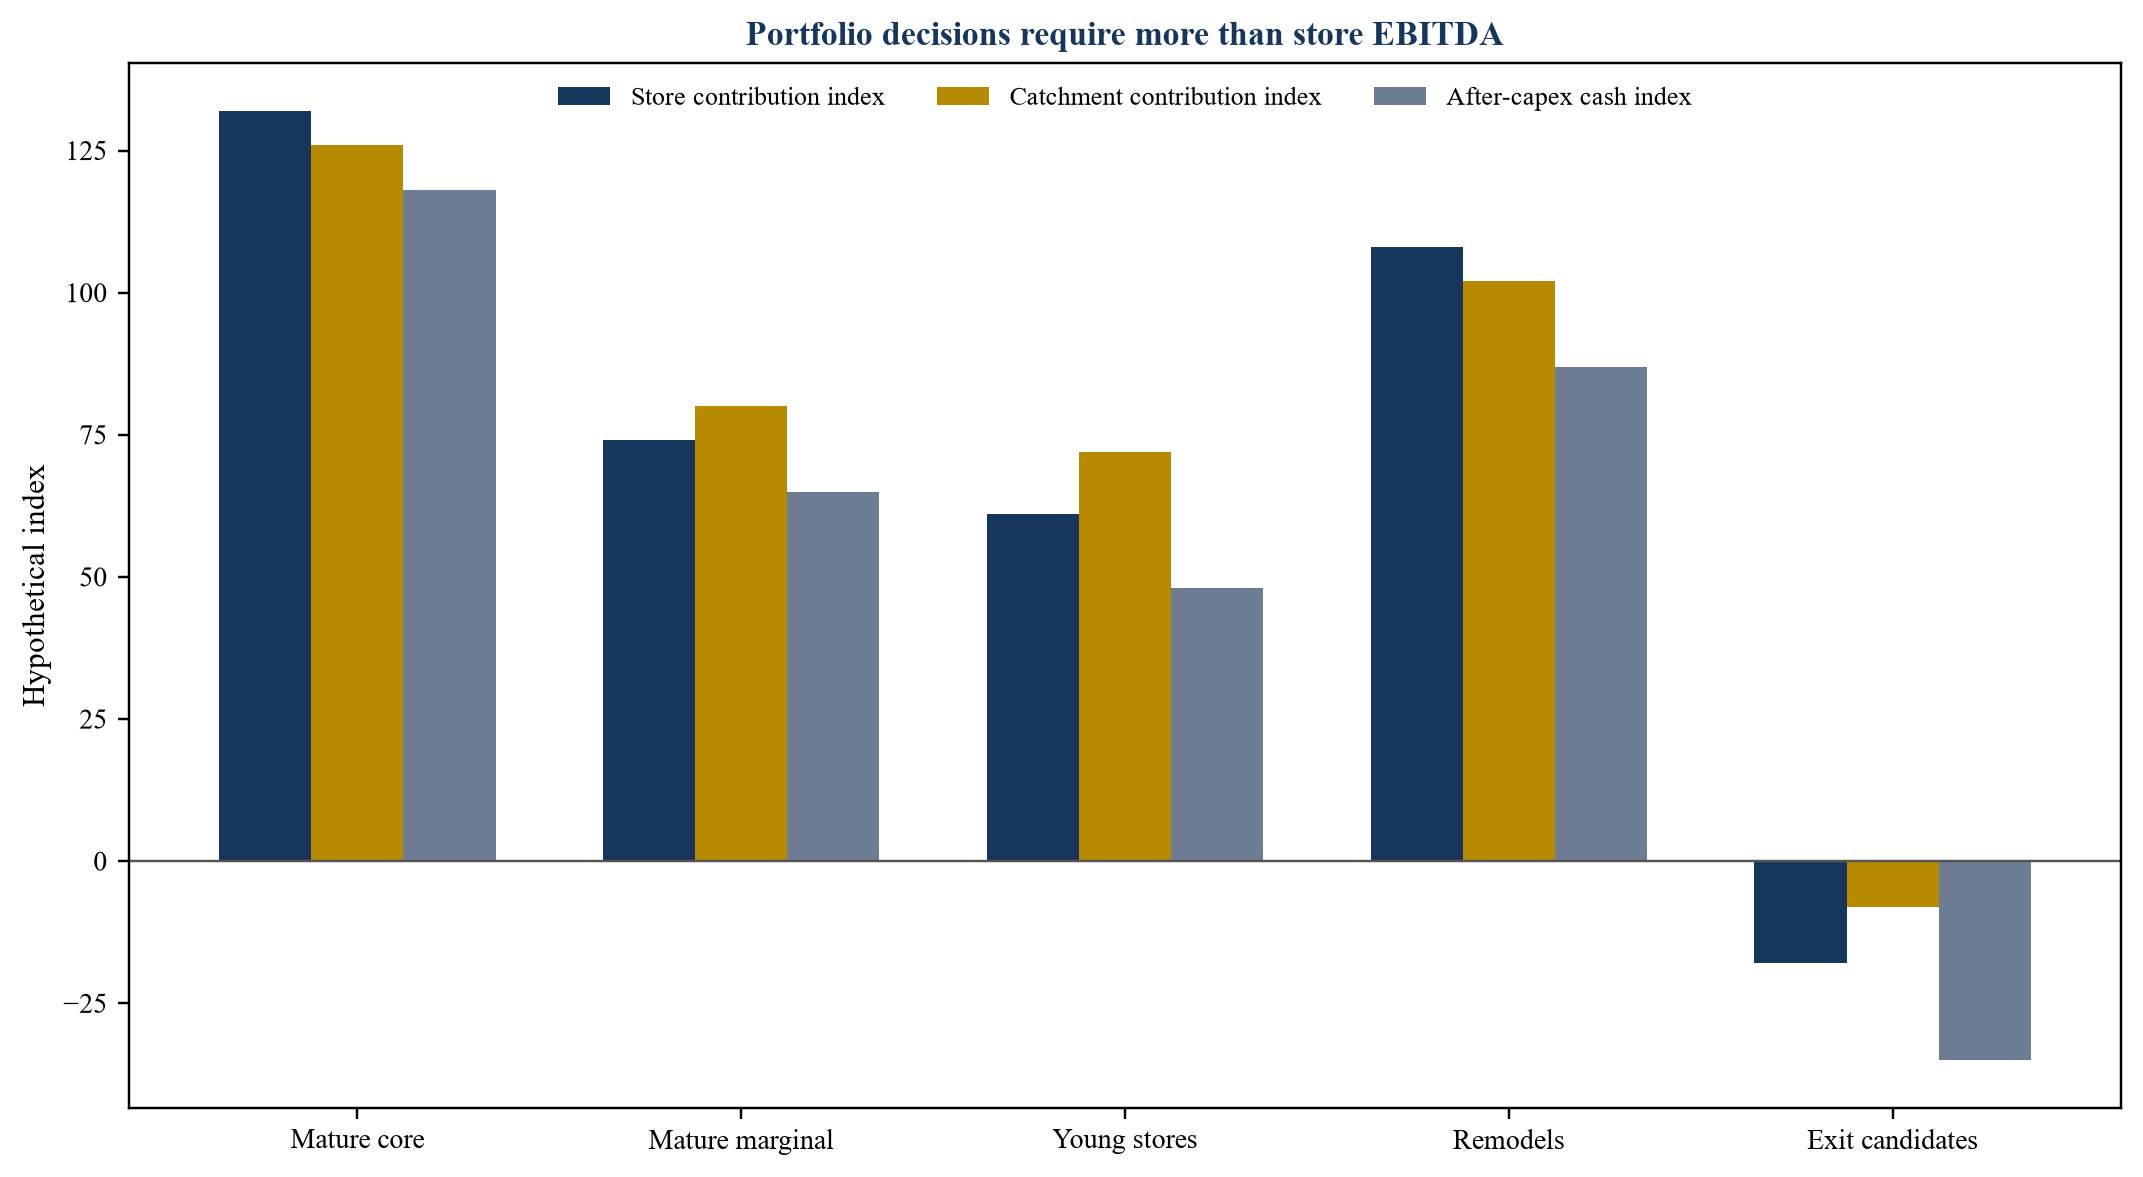
Hypothetical contribution indices show why store, cohort and catchment views must be reconciled.
15. Attribute omnichannel economics to the estate
Retail channels share customers, inventory and infrastructure. Target states that its stores fulfil the majority of digitally originated sales through shipping, pickup, drive-up and same-day delivery [10]. Zumiez describes interaction between stores and e-commerce [6]. A buyer should therefore avoid treating digital revenue as a stand-alone stream while leaving fulfilment cost in stores.
The attribution model should capture order origin, demand creation, fulfilment location, pick-and-pack labour, packaging, delivery, payment cost, return location, markdown and customer-service expense. It should also consider store inventory productivity and avoided distribution cost. At least two views are useful: operational contribution by fulfilment node and economic contribution by customer catchment.
Digital growth can improve sales while reducing margin if delivery subsidies, returns and labour rise. Store fulfilment can increase asset utilisation or disrupt selling activity. The team should test peak capacity, cut-off performance, substitution, cancellation and refund rates. Synergy claims from combining digital platforms should include migration cost, customer attrition, promotional intensity and duplicate technology. The base case should retain the cost required to operate the promised proposition.
16. Separate local, regional and central costs
Four-wall contribution is incomplete until the buyer rebuilds the operating platform. Regional management, merchandising, allocation, marketing, technology, distribution, finance, human resources, loss prevention, property and executive functions enable store cash. The model should identify which costs are variable, fixed, duplicative, transitional or stranded.
Allocation policy should follow causation where possible. Store-count allocations can distort formats with different complexity. Sales allocations can overburden high-volume stores. Transaction, shipment, labour-hour or space drivers may be more appropriate. The objective is not an accounting allocation for its own sake. The objective is to establish the cost base required to operate the acquired estate at the assumed service level.
The buyer should prepare stand-alone, buyer-owned and integration-period cost cases. Seller services that disappear require replacement cost. Duplicated functions may produce savings after systems and processes are integrated. Transitional service charges should be modelled by duration and exit dependency. A synergy should enter the base case only when the action, cost, owner, timing and operational effect are supported.
17. Test supplier income and commercial accruals
Supplier rebates, marketing support, volume incentives, listing fees and settlement income can be material to retail earnings. The diligence team should create a contract-level schedule showing basis, period, thresholds, claims, cash receipts, disputes and accounting treatment. Accrued income should reconcile to supplier confirmations or subsequent cash where available.
Volume-related income should be tested against the forecast purchase base. An acquisition can change banners, sourcing entities or purchasing terms. Integration can also disrupt thresholds. Non-recurring settlements and catch-up claims should be excluded from recurring EBITDA. Income linked to inventory should follow the related cost recognition and should not be duplicated in margin and other income.
The transaction agreement should address pre-close and post-close claims, returns, credits and audit rights. The working-capital mechanism should define accrued supplier income and related liabilities. If evidence is incomplete, the buyer can use escrow, a specific indemnity or deferred consideration. The model should present the cash timing because a recognised accrual may not fund near-term debt service.
18. Identify one-offs, run-rate items and temporary actions
Normalisation should use a symmetric rule. Genuine non-recurring costs may be added back; non-recurring income and temporary savings should be removed. The adjustment register should record the event, accounting line, store or function, period, cash effect, recurrence assessment, evidence and buyer conclusion.
Common proposed add-backs include restructuring, pre-opening, litigation, advisory cost, owner expense, technology implementation, duplicate labour and losses at stores selected for closure. Each requires a counterfactual. Pre-opening cost recurs if the plan assumes openings. Closure losses may be replaced by unavoidable rent and execution cost. Transformation spend may be necessary to deliver the forecast. Vacancies may reverse after closing.
Run-rate benefits require completion and evidence. A negotiated rent reduction can be included from its effective date. A proposed renegotiation remains scenario upside. Store closures should include lost contribution, residual occupancy, severance, inventory clearance and central-cost absorption. The bridge should separate accounting EBITDA, normalised EBITDA, stand-alone EBITDA, integration-period cash flow and steady-state EBITDA.
| Adjustment type | Minimum evidence | Base-case treatment | Transaction response |
|---|---|---|---|
| Accounting correction | Ledger, source document and policy | Correct historical EBITDA | Closing accounts or indemnity where relevant |
| Non-recurring cost | Event evidence, cash and recurrence test | Add back only the non-recurring portion | Confirm no replacement cost |
| Non-recurring income | Contract, cash and period evidence | Remove from recurring EBITDA | Price on sustainable earnings |
| Temporary saving | Vacancy, deferral or reduced activity record | Restore sustainable operating cost | Exclude unsupported benefit |
| Completed run-rate action | Executed contract and observed result | Include from effective date | Monitor delivery after close |
| Proposed synergy | Action, owner, cost and timing | Buyer upside or separately risked case | Use governance gates rather than seller value |
The classification determines whether an item belongs in historical correction, normalisation, synergy or scenario analysis.
19. Review closure liabilities and exit economics
Closing a store is a project with cash costs and portfolio effects. The model should include notice, rent, service charges, utilities, payroll, severance, inventory markdown, logistics, asset disposal, dilapidations, debranding, professional fees and customer obligations. It should also estimate sales transfer to nearby stores or digital channels and the central cost that remains.
Monro disclosed the closure of 145 underperforming stores in fiscal 2026, related costs, lease assignments, early terminations and sales of owned sites [11]. Grocery Outlet disclosed lease exits and operator-agreement terminations within an optimisation plan [12]. These are company-specific facts. They illustrate the range of cash and contractual items that can follow a closure decision.
The buyer should classify exit candidates by decision readiness. Some locations can close at lease expiry. Others require landlord negotiation, assignment or a funded payment. Stores with negative EBITDA may have positive short-term cash while inventory is cleared and fixed obligations remain. The purchase price should reflect the lower of an executable exit plan and a supportable trading plan, with separate liquidity for implementation.
20. Evaluate impairment signals without substituting accounting value
Impairment records can reveal weak locations, forecast changes and estate decisions. IAS 36 requires assets to be carried no higher than recoverable amount and applies to cash-generating units where assets do not generate independent cash flows [13]. IFRS 3 sets acquisition-date recognition and measurement requirements for identifiable assets and liabilities and goodwill [14]. These accounting requirements inform evidence analysis; they do not determine the investment price.
The buyer should review impairment models, trigger assessments, cash-generating-unit definitions, forecasts, discount rates, lease treatment and reversals. It should compare management assumptions with the transaction model and recent trading. Repeated near-threshold tests can indicate fragility. Stores with no impairment may still be unattractive if capital and working capital are omitted from the operating measure.
Purchase-price allocation should not be confused with quality of earnings. Fair-value adjustments can create future depreciation or amortisation but do not repair weak cash. Goodwill can reflect expected synergies that require investment and execution. The investment committee should see a separate bridge from accounting carrying values to store cash, closure exposure and transaction value.
21. Build a store-level cash conversion model
EBITDA should be converted to cash by store and enterprise. The model should deduct inventory investment, receivables, payables, lease cash, maintenance capital, remodel commitments, taxes, interest and closure expenditure. Seasonal peaks should be shown monthly because annual averages can conceal liquidity needs.
Cash collections should reconcile by tender. Card settlement delays, chargebacks, gift cards, marketplace receivables, cash shortages and loyalty liabilities affect conversion. Supplier terms may vary by category and entity. Rapid expansion can produce negative operating cash even when EBITDA rises because new stores require inventory, deposits and pre-opening expenditure.
The financing case should use cash available for debt service after recurring store and platform needs. Debt capacity should not rely on temporary working-capital release or delayed capex. The model should identify the lowest liquidity point under central and downside cases and assign committed funding. Cash trapped in subsidiaries, restricted accounts or merchant reserves should be excluded until accessible.
22. Stress demand, margin, labour and occupancy together
Retail downside often combines pressures. Lower traffic reduces sales; promotions and markdowns compress margin; minimum staffing limits labour flexibility; rent remains fixed; inventory conversion slows; and store closures consume cash. Single-variable sensitivities understate this interaction.
The diligence model should include central, adverse and severe scenarios by cohort. Drivers should include traffic, conversion, ticket, gross margin, shrink, labour rate, hours, rent, online mix, fulfilment cost, working capital and capex. Store status can change when cash contribution crosses intervention thresholds. The model should calculate which stores become marginal or loss-making in each case.
External statistics provide context rather than target forecasts. Census publishes retail and food-services sales by kind of business [15]. ONS publishes Great Britain retail sales in value and volume terms [16]. Eurostat publishes European retail-trade volume indicators [17]. The buyer should use the geography and category relevant to the target, then reconcile external movements with actual store data. Management scenarios should be labelled and independently approved.
23. Detect accounting and operational manipulation
Red-flag testing should focus on period end, store transfers and classification. The team should scan unusual late-period sales, returns after period end, manual journals, negative inventory, delayed markdowns, supplier accrual releases, capitalised repairs, payroll accrual changes, gift-card assumptions and revenue moved between stores or channels.
Operational metrics can also be managed. Stores may be temporarily closed to leave the comparable population, relocations may retain comparable status, or digital demand may be allocated to improve selected locations. Labour can be deferred before a sale. Inventory receipts can move across the closing date. The buyer should compare policy, system logic and actual records.
An exception does not establish misconduct. Each exception requires evidence and management response. The audit trail should preserve the query, population, threshold, result and disposition. Material unresolved exceptions should reduce reliance on the affected metric and influence price or closing conditions.
24. Validate management's growth plan
The growth plan should be rebuilt from catchments, sites, cohorts and capital. Each planned opening needs an address or search area, format, lease assumptions, capex, pre-opening cost, inventory, staffing, ramp curve, cannibalisation and hurdle rate. Pipeline stages should be distinguished from executed leases.
Recent openings provide the best internal evidence. The buyer should compare their actual monthly path with the plan used to approve them. It should identify selection bias where failed sites are excluded or mature stores serve as the template. O'Reilly reported separate contributions from comparable-store sales and newer stores in its 2026 interim filing [18]. The disclosure illustrates the need to separate estate growth from mature-store performance.
The base case should include only sites supported by capacity and capital. Lease negotiation, permitting, construction, recruitment, distribution and management bandwidth can constrain openings. A pipeline that accelerates before cohort evidence stabilises creates valuation risk. Deferred openings may preserve value when demand or capital is uncertain.
25. Convert store findings into the EBITDA bridge
The EBITDA bridge should begin with audited or reviewed reported EBITDA and proceed through traceable adjustments. Typical categories include perimeter corrections, store population, revenue cut-off, margin provisions, supplier income, labour vacancies, occupancy accruals, maintenance expense, central costs, closure economics and run-rate actions. Each adjustment should be classified as historical correction, normalisation, stand-alone cost, synergy or scenario.
The bridge should remain linked to stores. If closure losses are removed, the model must remove related sales and costs and include exit cash. If supplier income is reduced, the affected category margin and working capital should follow. If labour savings are added, staffing and service assumptions should change. This prevents disconnected spreadsheet adjustments.
The investment committee should receive a waterfall, an adjustment register and a store distribution. A single normalised number cannot show concentration. The buyer should know how much EBITDA is generated by the top decile, how many stores sit near zero and what portion depends on supplier accruals or channel allocations.
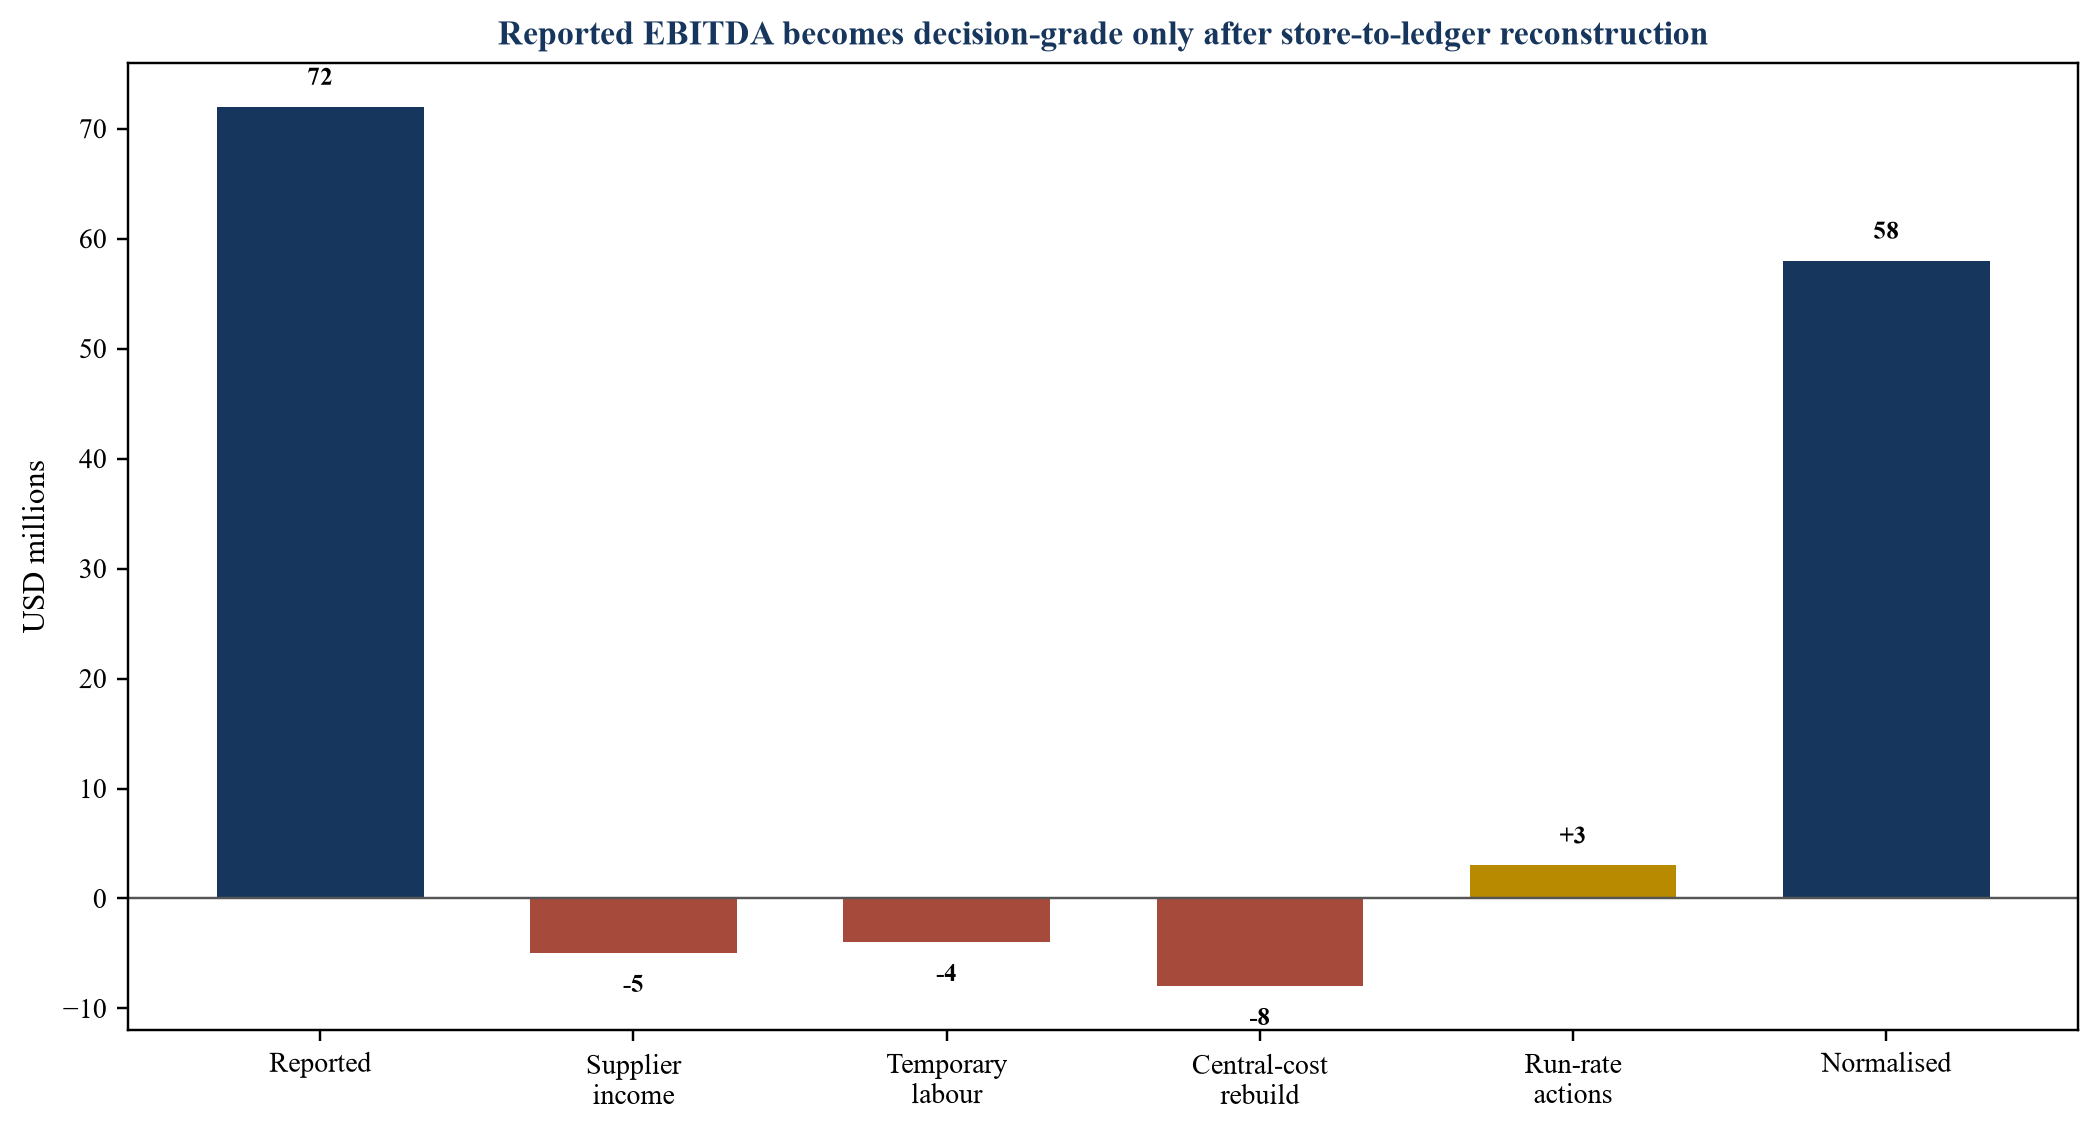
Illustrative USD millions; every adjustment is a management scenario and not observed company data.
26. Model central and downside acquisition cases
The hypothetical target operates 240 stores. Reported EBITDA is USD 72 million. The store-to-ledger review removes USD 5 million of unsupported or non-recurring supplier income, USD 4 million of temporary labour savings and USD 8 million of omitted stand-alone and central costs. It adds USD 3 million of completed run-rate benefits, producing central normalised EBITDA of USD 58 million.
The central case assumes stable traffic, modest price and mix growth, gross-margin recovery supported by inventory evidence, funded maintenance, and closure of twelve structurally weak stores. The buyer pays 8.5 times normalised EBITDA, or USD 493 million enterprise value, before customary net-debt and working-capital adjustments. It funds USD 28 million of catch-up, closure and integration cash.
The downside case assumes a four per cent sales decline, 120 basis points of gross-margin pressure, limited labour flexibility, weaker online contribution and slower lease exits. Normalised EBITDA falls to USD 39 million. At a hypothetical 7.5 times multiple, enterprise value is USD 293 million. The USD 200 million difference demonstrates the combined effect of operating leverage and valuation compression. All assumptions are illustrative and require replacement with target evidence.
| Measure | Central case | Downside case | Decision interpretation |
|---|---|---|---|
| Stores at signing | 240 | 240 | Common perimeter before actions |
| Reported EBITDA | 72 | 72 | Starting point only |
| Normalised EBITDA | 58 | 39 | Store-to-ledger and scenario result |
| Closure candidates | 12 | 24 | Portfolio action changes cash and cost absorption |
| Catch-up, closure and integration cash | 28 | 46 | Liquidity requirement outside headline EBITDA |
| Entry multiple | 8.5x | 7.5x | Illustrative risk-adjusted valuation |
| Enterprise value | 493 | 293 | Sensitivity to earnings and multiple |
| Maintenance capex | 14 | 16 | Recurring cash requirement |
| Minimum liquidity reserve | 22 | 40 | Protection through seasonal and execution stress |
All values are illustrative management scenarios; USD millions except stores, percentages and multiples.
27. Convert diligence into price and protections
Diligence findings should change the transaction. Unsupported earnings reduce the EBITDA base. Excess or obsolete inventory changes working capital or receives a specific valuation rule. Closure exposure can reduce price, remain with the seller or be funded through escrow. Missing leases, supplier contracts or data can become conditions precedent. Identified tax, employment or property liabilities can receive specific indemnities.
Representations should cover store lists, financial records, inventory, supplier income, leases, capex, closures, labour, gift cards, loyalty, customer data, systems, litigation and compliance. Interim covenants should restrict new leases, abnormal purchasing, promotions, supplier settlements, closures and capex changes without consent. The buyer should preserve ordinary trading while preventing window dressing.
Earn-outs require caution in an integrated retailer because the buyer controls allocation, promotions, openings, closures and central costs. If contingent consideration is used, the metric should be observable, reconciled and governed. Store-level cash contribution, sales from a fixed perimeter or completed lease exits may be more controllable than broad EBITDA. The agreement should state accounting policies, allocations, information rights and dispute procedures.
| Decision area | Required evidence | Price or protection | Stop condition |
|---|---|---|---|
| Estate perimeter | Reconciled store, lease and system registers | Perimeter adjustment and closing condition | Material population remains unresolved |
| Sustainable EBITDA | Store-to-ledger bridge and cohort distribution | Price from supported earnings | Cash contribution cannot be reproduced |
| Inventory | Quantity, age, cost and recovery evidence | Eligible-stock definition and reserve | Material stock cannot be verified |
| Lease and closures | Executed leases and exit cash model | Escrow, indemnity or price deduction | Unfunded obligations breach liquidity |
| Omnichannel | Origin, fulfilment, return and cost attribution | Conservative base case and information rights | Channel economics remain materially incomplete |
| Financing | Downside cash and monthly liquidity model | Lower leverage and committed reserve | Debt service depends on unsupported adjustments |
Thresholds should be tailored to the target, jurisdictions, formats and financing structure.
28. Size financing to sustainable cash
Acquisition debt should be sized from downside cash after rent, maintenance, working capital, taxes, closure costs and integration. Lenders should receive the store distribution, lease maturity profile, inventory borrowing base where relevant, seasonal liquidity and covenant sensitivities. Headline EBITDA should not substitute for cash available for debt service.
Covenants can include leverage, fixed-charge coverage, minimum liquidity, capex, store closures, borrowing-base availability and restrictions on additional leases. Definitions should align with the diligence bridge. Broad add-back baskets can recreate the same uncertainty the buyer removed during underwriting. Cure rights should be matched to the speed of retail deterioration.
Liquidity should support the lowest monthly point and the portfolio plan. A revolving facility can fund seasonal inventory; committed equity or a delayed-draw line can fund closures and remodels. Financing should also address merchant reserves, letters of credit, landlord guarantees and supply-chain obligations. A transaction that closes with maximum leverage and no operating reserve transfers execution risk directly to equity value.
29. Govern the first one hundred days
Day-one controls should preserve trading, cash and evidence. The buyer should confirm store, payroll, payment, inventory, lease, supplier, pricing, promotion, e-commerce and incident systems. Store managers need clear authority and escalation. Customer commitments, gift cards, returns and loyalty should continue without ambiguity.
Within thirty days, management should validate the store register, daily cash, stock, labour, supplier accruals, leases and capex. Within sixty days, it should approve cohort baselines and actions for core, improve, renegotiate and exit stores. By day one hundred, the board should receive a refreshed central and downside model using post-close data, with capital gates for openings, remodels and closures.
The operating dashboard should show sales drivers, gross margin, labour productivity, occupancy, inventory age, shrink, four-wall contribution, cash conversion, capex, lease events and closure milestones. Exceptions should have owners and deadlines. Integration savings should be reported after cost and operational effects. The dashboard should connect back to the acquisition model so that value creation remains measurable.
30. Conclude with evidence-led retail underwriting
Multi-site retail value is the aggregate of location cash flows, channel economics, platform costs and portfolio obligations. Consolidated EBITDA can obscure the distribution, cash timing and capital needed to sustain it. A store-to-ledger reconstruction makes the acquisition thesis testable.
The framework gives boards and transaction teams a disciplined sequence: freeze the estate; reconcile transactions to the ledger; define cohorts; rebuild four-wall contribution; attribute digital economics; test inventory, labour, leases and capex; restore required enterprise costs; stress the portfolio; and convert findings into price, protection, financing and operating control.
The result is a range rather than a cosmetic adjustment. It shows sustainable earnings, downside earnings, closure exposure, maintenance cash and the actions needed after closing. A buyer that can trace value from customer transaction to store cash and enterprise cost can negotiate with greater precision and govern the estate against the same evidence used to approve the deal.
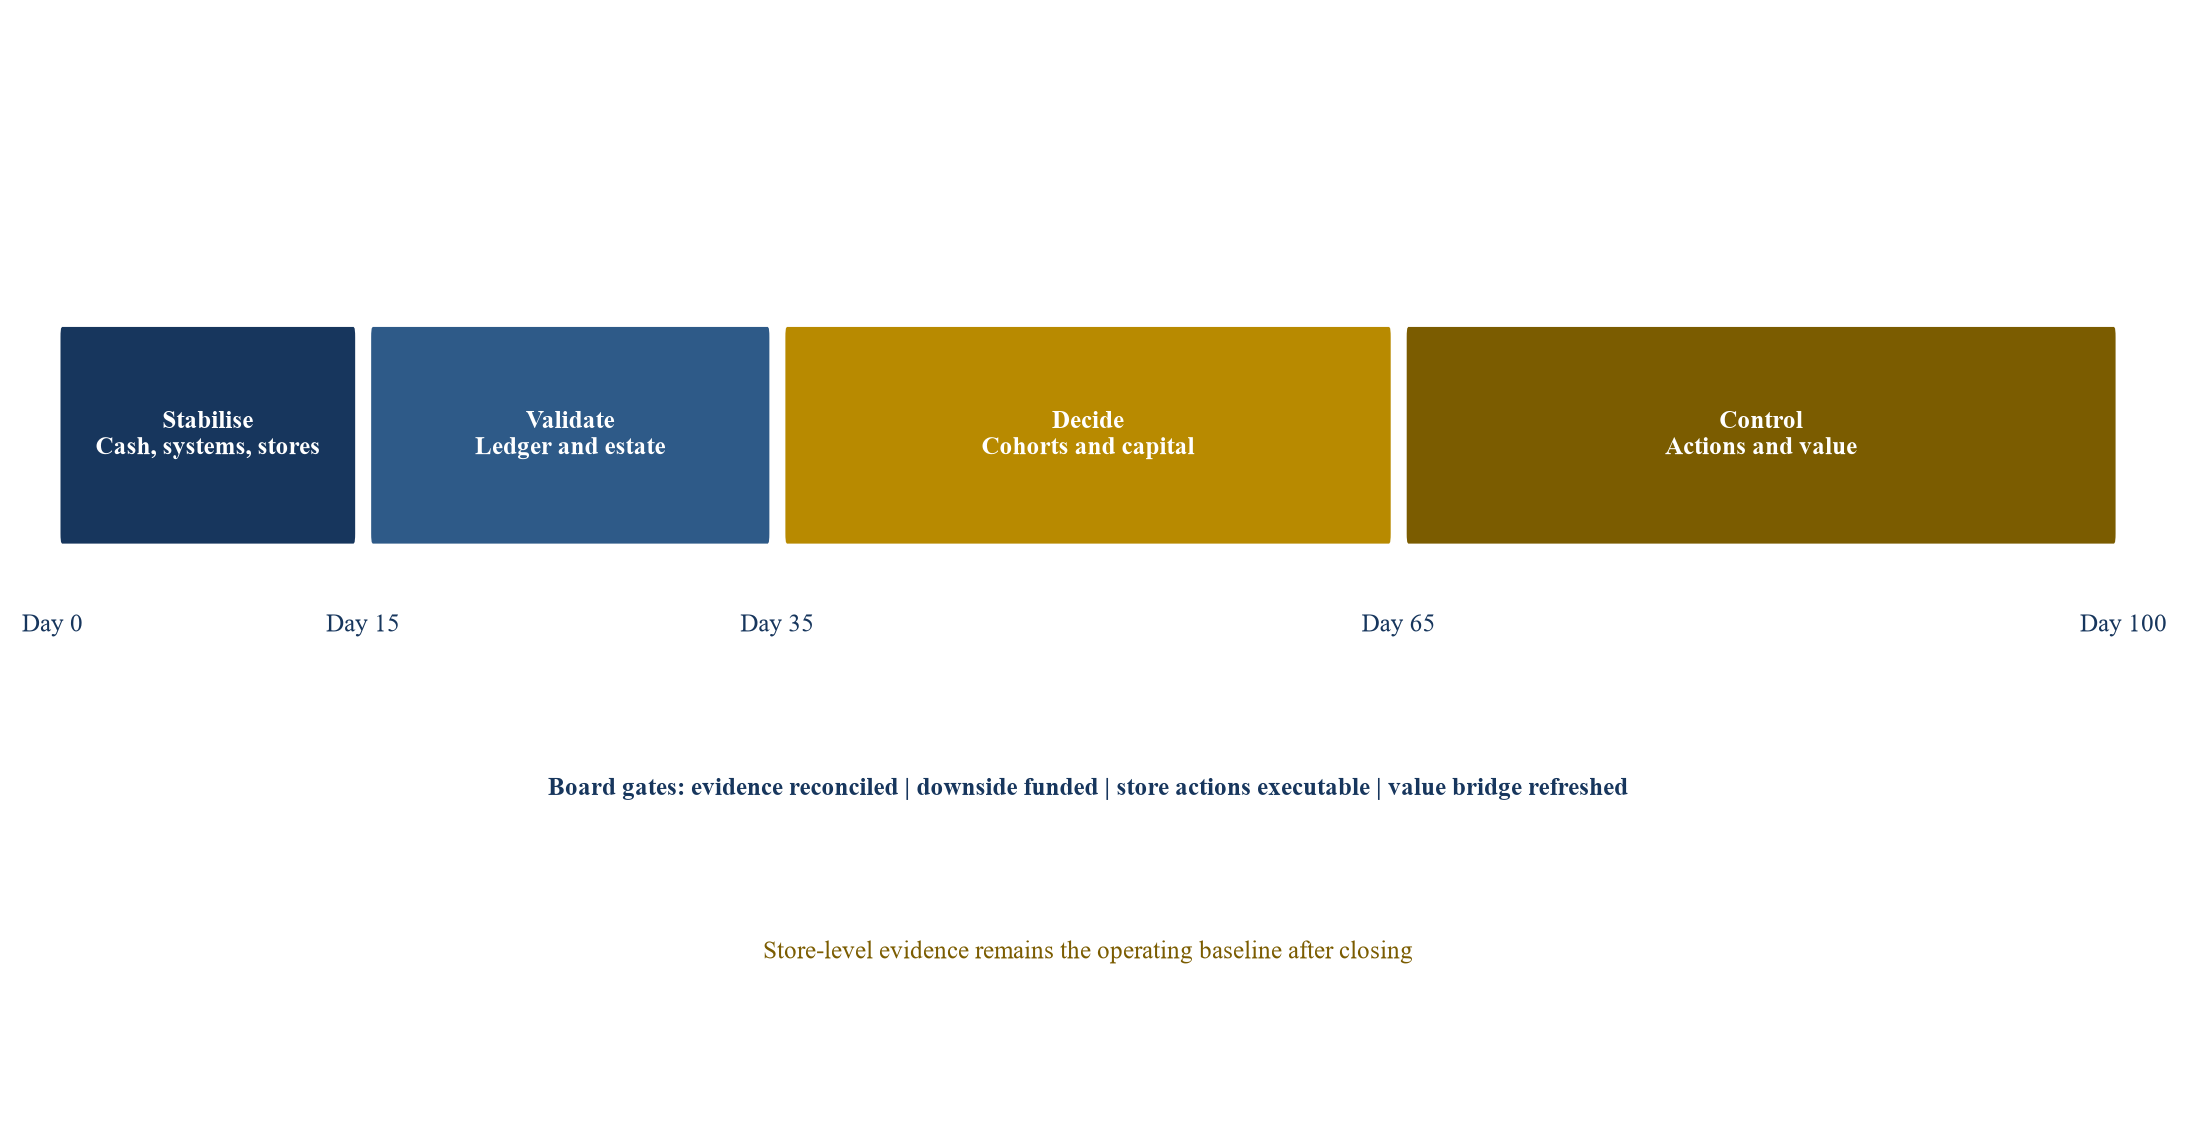
The roadmap converts transaction evidence into operating control and capital decisions.
Sources
- Sportsman's Warehouse Holdings, Inc. Annual Report on Form 10-K for the year ended 31 January 2026. Read the primary source
- Signet Jewelers Limited. Annual Report on Form 10-K for the year ended 31 January 2026. Read the primary source
- Dollar General Corporation. Annual Report on Form 10-K for the year ended 30 January 2026. Read the primary source
- The TJX Companies, Inc. Annual Report on Form 10-K for the year ended 31 January 2026. Read the primary source
- BRC Inc. Quarterly Report on Form 10-Q for the period ended 30 June 2026. Read the primary source
- Zumiez Inc. Annual Report on Form 10-K for the year ended 31 January 2026. Read the primary source
- U.S. Bureau of Labor Statistics. Productivity and Costs by Industry: Wholesale Trade and Retail Trade Industries, 2025. Read the primary source
- IFRS Foundation. IFRS 16 Leases. Read the primary source
- Caleres, Inc. Annual Report on Form 10-K for the year ended 31 January 2026. Read the primary source
- Target Corporation. Quarterly Report on Form 10-Q for the period ended 2 May 2026. Read the primary source
- Monro, Inc. Annual Report on Form 10-K for the year ended 28 March 2026. Read the primary source
- Grocery Outlet Holding Corp. Quarterly Report on Form 10-Q for the period ended 4 April 2026. Read the primary source
- IFRS Foundation. IAS 36 Impairment of Assets. Read the primary source
- IFRS Foundation. IFRS 3 Business Combinations. Read the primary source
- U.S. Census Bureau. Monthly Retail Trade. Read the primary source
- Office for National Statistics. Retail Sales Index time series. Read the primary source
- Eurostat. Retail trade volume indicators. Read the primary source
- O'Reilly Automotive, Inc. Quarterly Report on Form 10-Q for the period ended 30 June 2026. Read the primary source
- Burlington Stores, Inc. Annual Report on Form 10-K for the year ended 31 January 2026. Read the primary source
- Federal Trade Commission and U.S. Department of Justice. Merger Guidelines. Read the primary source
