

Introduction
Synthetic data is generated rather than directly observed. It can represent people, transactions, machines, environments, images, signals or events. Companies use it to develop models when real data is scarce, sensitive, expensive, dangerous to collect or poorly balanced. They also use it to test software, simulate edge cases, create digital twins, support research and build sandboxes in which new products can be evaluated.
Commercial interest does not settle valuation. The same vendor may sell software subscriptions, dataset licences, bespoke generation projects, validation services and access to a domain-specific data exchange. Each revenue stream depends on different assets and carries different margins, renewal risks and liabilities. A buyer that applies a single software multiple to all reported revenue can pay for consulting labour as if it were recurring intellectual property.
The technical proposition also contains competing objectives. Stronger privacy protection can reduce utility. Greater fidelity can preserve unwanted bias or make source records easier to infer. A generator can perform well on global statistical measures and fail the customer's actual task. A reproducible pipeline can consistently reproduce the wrong population. A customer may accept synthetic data for development and reject it for production validation or regulatory evidence.
NIST states that synthetic data without differential privacy can remain susceptible to privacy attacks and that utility challenges can affect subpopulations and downstream inference [9-12]. The ICO treats synthetic data as a privacy-enhancing technique whose risk and usefulness depend on implementation and context [13-15]. The EU AI Act refers to anonymised, synthetic and other non-personal data within the controlled conditions of regulatory sandboxes [18]. FDA and EMA materials show that regulatory acceptance is use-specific and evidence-specific [23-27].
This paper is designed for boards, corporate-development teams, private-equity and venture investors, founders, lenders, valuation specialists, customers and integration leaders. It provides a transaction decision system. It does not provide legal, regulatory, accounting, tax, clinical, technical-security or valuation advice. Applicable rules, product claims, customer contracts and technical evidence require target-specific professional review.
1 Define the company and its asset stack
A synthetic-data company should be decomposed before it is valued. The first asset may be a generator: statistical, simulation-based, agent-based, rules-based, generative or hybrid. The second may be a source-data estate used to calibrate the generator. The third may be an evaluation system that measures utility, privacy, fidelity, bias and reproducibility. Other assets can include domain ontologies, scenario libraries, rendering pipelines, digital-twin models, orchestration software, customer connectors, validation protocols and specialist workforce.
The asset map should identify what the target controls and what it merely accesses. A company may train on customer data under restricted terms, license a simulator from a third party, depend on an open-source foundation model or use cloud services whose economics and rights can change. The buyer should identify each dependency, its transferability, the effect of change of control and the cost of a credible substitute.
The unit of account should follow the customer proposition. A reusable platform serving many institutions can be analysed separately from a regulated healthcare module, an autonomous-driving scenario library or a financial-crime testing pack. These products can share code while differing in source rights, domain validation, sales cycles, liability and economic life. Combining them hides the reason customers pay.
An asset can create value without qualifying for separate recognition in financial statements. IAS 38 focuses on identifiability, control and future economic benefits, while IFRS 3 addresses identifiable assets acquired in a business combination [1-3]. Transaction value, purchase-price allocation and internal investment decisions therefore require related but distinct analyses.
| Asset component | Evidence to inspect | Economic role | Primary valuation question |
|---|---|---|---|
| generation engine | architecture versions training records licences and reproducible builds | creates synthetic observations or scenarios | does it outperform credible alternatives for the customer's task |
| source-data access | contracts notices permissions lineage retention and transfer terms | calibrates distributions dependencies and rare events | can the buyer continue lawful and technically sufficient access |
| evaluation system | metrics thresholds benchmark governance and independent results | demonstrates utility privacy and limitations | are the tests decision-relevant reproducible and resistant to gaming |
| domain models and ontologies | expert methodology validation history and version control | encodes relationships constraints and scenarios | how much advantage survives without the current specialists |
| workflow integration | connectors deployment controls documentation and support data | embeds the product in customer operations | what switching cost and recurring adoption does integration create |
| evidence and assurance system | audit trail approvals incidents model cards and reports | supports procurement risk and regulatory review | can evidence be refreshed as products data and rules change |
Proposed diligence record; specialists should determine the legal accounting privacy security and regulatory treatment of each asset.
2 Start with the customer decision and intended use
Utility has meaning only in relation to a task. NIST's work on utility metrics emphasises that no single measure establishes usefulness for every analysis [10-12]. A synthetic population suitable for teaching may be unsuitable for credit decisions. Data adequate for testing software interfaces may be unsuitable for estimating treatment effects. An autonomous-driving scenario that improves edge-case coverage may not represent real-world frequency.
The buyer should reconstruct the customer's job. It should identify the decision, model, test or simulation that consumes the data; the population and operating conditions; the performance threshold; the cost of a wrong conclusion; and the evidence needed for acceptance. The same synthetic dataset can have different value across customers because the consequence of error and the substitute options differ.
Utility testing should include descriptive statistics, multivariate relationships, task performance, subgroup performance, rare-event coverage and stability under realistic perturbation. The relevant test is often downstream. If a customer uses the data to train a classifier, the buyer should inspect performance on independent real-world holdout data. If the customer uses it to test a payment system, the buyer should inspect defect discovery and release outcomes. If the customer uses it for scenario simulation, the buyer should inspect whether critical states and transitions are represented.
The diligence team should also identify the customer's fallback. Utility has an economic price only when the synthetic product changes cost, speed, coverage, risk or revenue relative to an available alternative. A bank may compare a synthetic fraud corpus with masked production data, manual scenario design and a specialist test-data vendor. A medical-device developer may compare generated images with prospective collection, retrospective licensing and a narrower product claim. An industrial customer may compare a digital twin with physical testing and conservative operating limits. The transaction model should record which alternative is displaced, which costs remain and which benefits depend on customer adoption.
Acceptance evidence should be cohort-based. A vendor may show strong aggregate benchmark results while only a minority of customers reach production use. The buyer should reconcile every material pilot to its intended task, agreed threshold, validation result, production decision, time to acceptance and subsequent renewal. Failed pilots deserve the same attention because they reveal unsupported use cases, sales qualification weaknesses and hidden implementation cost. Evidence from one task or population should not be transferred to another without a documented bridge.
Customer acceptance records are more probative than a vendor's benchmark. The buyer should inspect pilots that progressed to production, documented reasons for rejection, procurement conditions, validation reports, usage logs, renewal evidence and the operational action taken from synthetic results. A contract signed for experimentation does not prove that the data entered a material workflow.
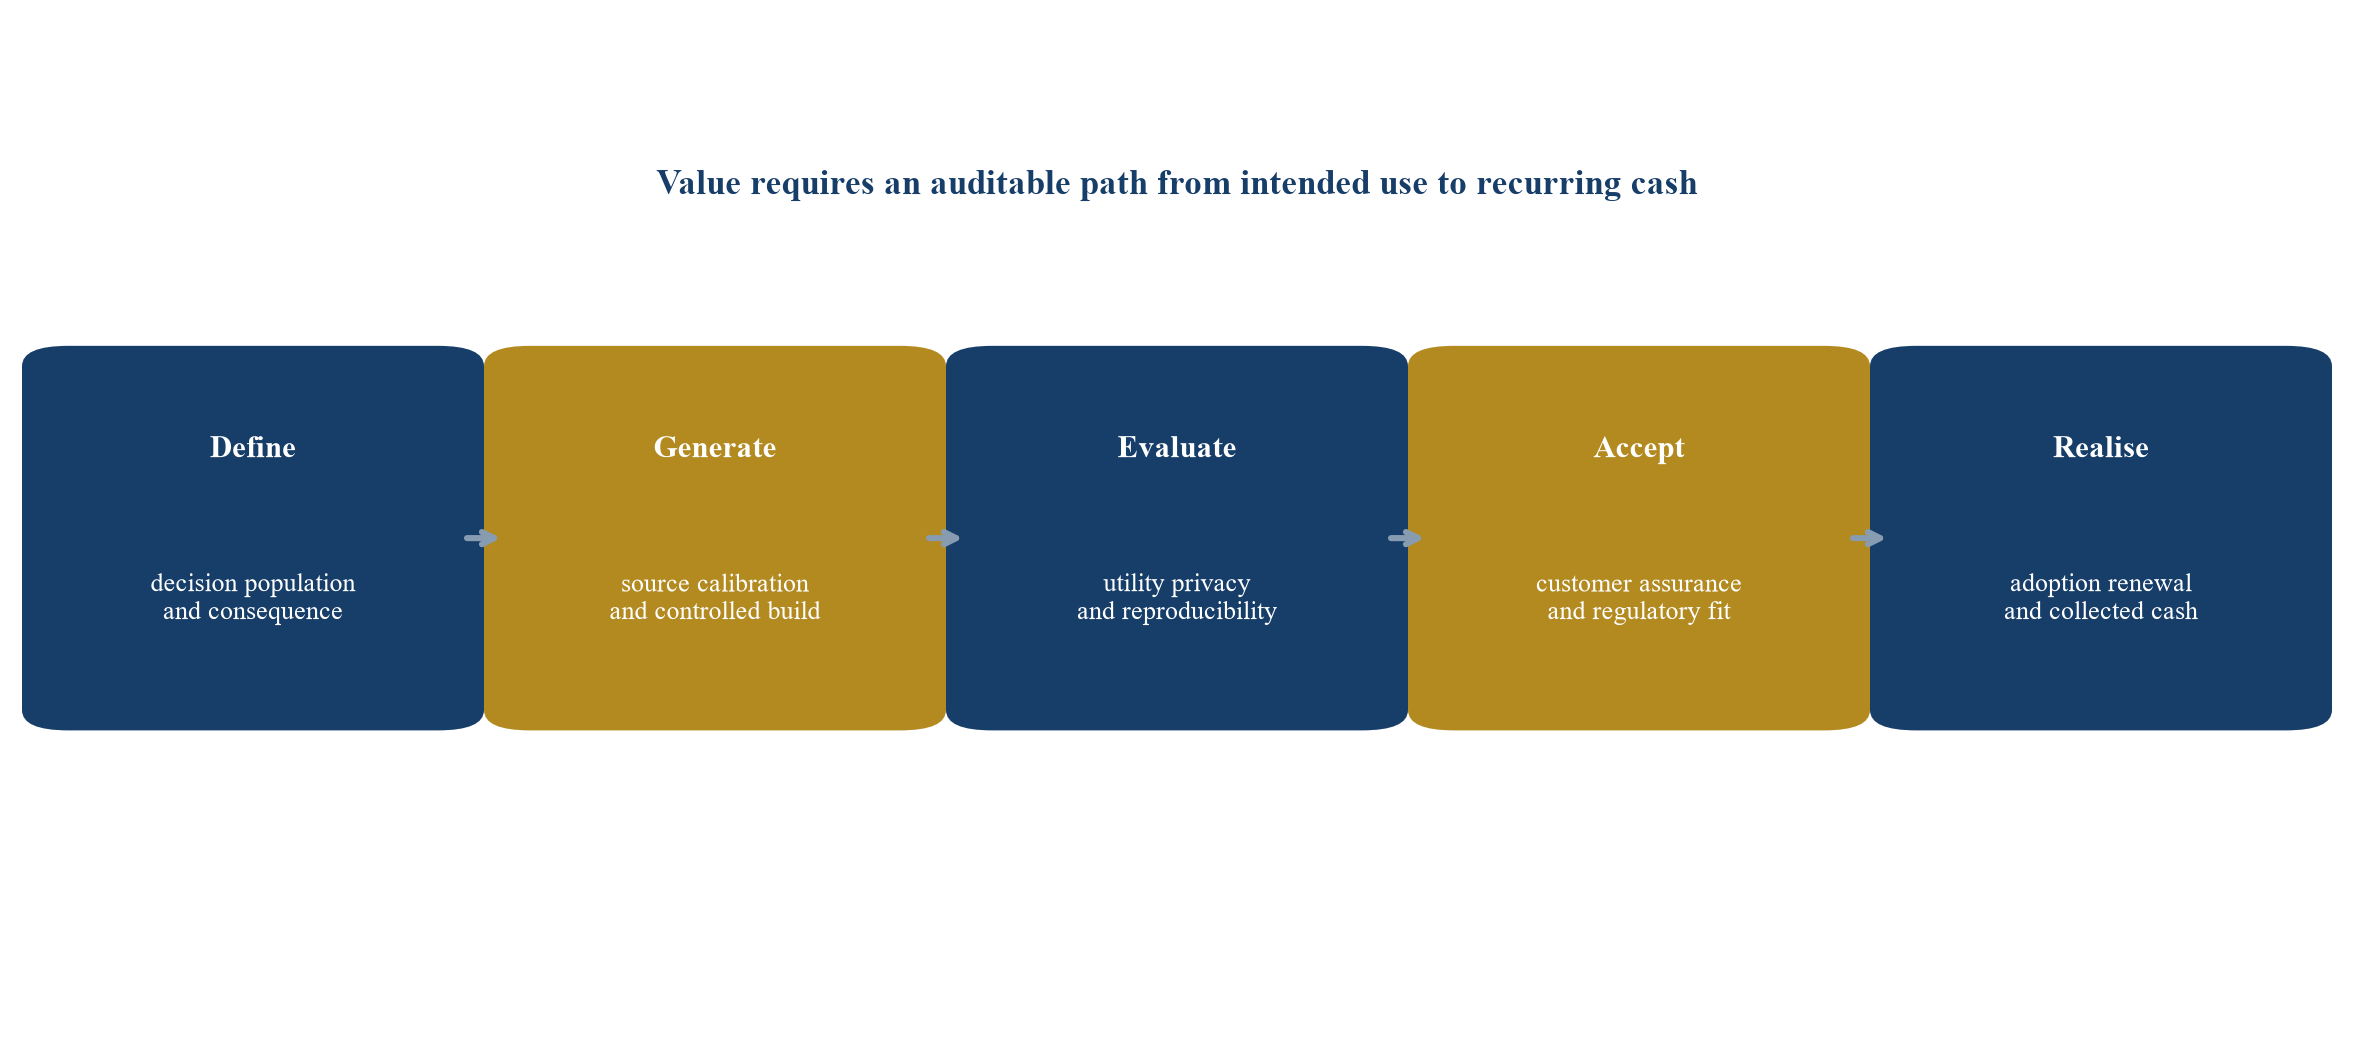
Proposed transaction framework; every arrow requires target-specific evidence.
3 Test privacy claims as engineering evidence
The word synthetic does not establish anonymity. A generator trained on personal or confidential data may reproduce source records, preserve rare combinations, reveal membership or make attributes inferable. Privacy risk depends on the source population, generator, access model, adversary capability, released fields, query interface and information available from other sources.
NIST SP 800-226 explains that synthetic-data methods without differential privacy generally provide informal guarantees and may remain vulnerable to privacy attacks [9]. Differential privacy provides a mathematical framework for bounding privacy loss, yet an implementation still requires examination of adjacency, privacy unit, epsilon, delta, composition, clipping, randomness, accounting and software behaviour. A marketing statement that a product is differentially private is incomplete without these details.
The buyer should inspect attack testing. Useful tests can include exact and approximate record matching, membership inference, attribute inference, nearest-neighbour analysis, canary exposure and reconstruction attempts. The design should reflect realistic adversaries and auxiliary information. Passing one attack test does not establish protection against every attack. Failed tests should have defined remediation, versioning and customer notification rules.
Privacy should be assessed across the product lifecycle. Source-data ingestion, temporary files, model checkpoints, logs, support tickets and customer exports can create exposure even when the final dataset passes a release test. The buyer should map where personal or confidential information enters, which systems retain it, who can access it, how long it persists and how deletion requests or contractual restrictions propagate. NIST's Privacy Framework and ENISA's data-protection engineering materials support treating privacy as a governed system rather than a final-output label [43-45].
Commercial terms should reflect the assurance actually delivered. A customer may receive a dataset, a hosted query environment or a managed service in which the vendor controls access and monitors use. These models create different attack surfaces and obligations. The diligence team should compare contractual promises with tested controls, insurance, incident procedures and technical limits. Broad claims such as anonymous, privacy-safe or risk-free should be traced to a precise method, tested release and approved customer use.
Privacy and utility should be evaluated together. A company that protects privacy by destroying decision-relevant information may create little economic value. A company that maximises fidelity can increase privacy exposure. The transaction model should use a frontier rather than a single score: what utility is achieved at each privacy setting, for which task, population and access mode?
| Claim | Evidence required | Failure mode | Transaction consequence |
|---|---|---|---|
| records are anonymous | threat model attack tests linkage analysis and release controls | identifiable or singling-out information remains | exclude affected revenue and require remediation or access restrictions |
| differential privacy is used | formal mechanism privacy unit budget accounting code and test results | parameter or composition choices weaken the guarantee | probability weight the claim and impose technical closing conditions |
| source data is minimised | field necessity retention access and deletion evidence | unnecessary sensitive attributes remain in training or logs | include remediation cost and customer consent risk |
| customers can safely share outputs | output policy query limits monitoring and contractual controls | repeated queries or joins increase disclosure | reduce scale assumptions and fund control infrastructure |
| privacy remains stable | regression tests incident history and change governance | a new model or source cohort changes exposure | shorten economic life and require continuing assurance expenditure |
Illustrative test design; privacy specialists and counsel should determine appropriate methods thresholds and legal conclusions.
4 Require reproducibility and provenance
Reproducibility is a commercial control. The buyer should be able to rebuild a material dataset from identified source versions, code, configuration, random seeds, environment, model weights and approval records. It should also understand which outputs are intentionally stochastic and the tolerance within which repeated runs are considered equivalent.
A reproducible pipeline supports customer assurance, incident investigation and product maintenance. It allows a company to explain why an updated dataset differs from the prior version. It also allows a buyer to test whether performance results depend on hidden manual intervention, a particular engineer or unavailable source data. Reproducibility does not require identical records in every run; it requires controlled variation and an auditable process.
Provenance should link each output cohort to source categories and transformations without exposing protected source records. The record should identify source period, population, exclusions, preprocessing, generator version, calibration settings, quality gates and release approval. When domain experts add rules or scenarios, those interventions should be documented and versioned.
The clean-room test should be designed before management selects its demonstration. A buyer-controlled team should choose a representative product and rebuild it from the target's preserved materials. It should record unavailable dependencies, manual steps, environment drift, runtime, cost and differences in output. Where stochastic variation is expected, the test should define acceptable distributional and task-performance ranges in advance. An unexplained requirement for a specific employee, undocumented prompt or inaccessible customer file is a transferability risk.
Reproducibility also affects the useful economic life of the asset. A product that can be rebuilt, retested and adapted to new source periods can support renewals and adjacent use cases. A product whose evidence is tied to an obsolete environment or one-off data snapshot may require substantial reinvestment. The valuation should therefore model maintenance and revalidation separately from ordinary software support, with explicit cash requirements when libraries, privacy settings, regulations or customer populations change.
The buyer should perform a clean-room rebuild of a representative product. The test should use controlled access and a team that did not operate the original pipeline. It should compare output characteristics, task performance, privacy results, runtime, compute cost and exceptions. A successful rebuild strengthens evidence for transferability. Failure may indicate undocumented know-how, missing artefacts or dependence on personnel who can leave after closing.
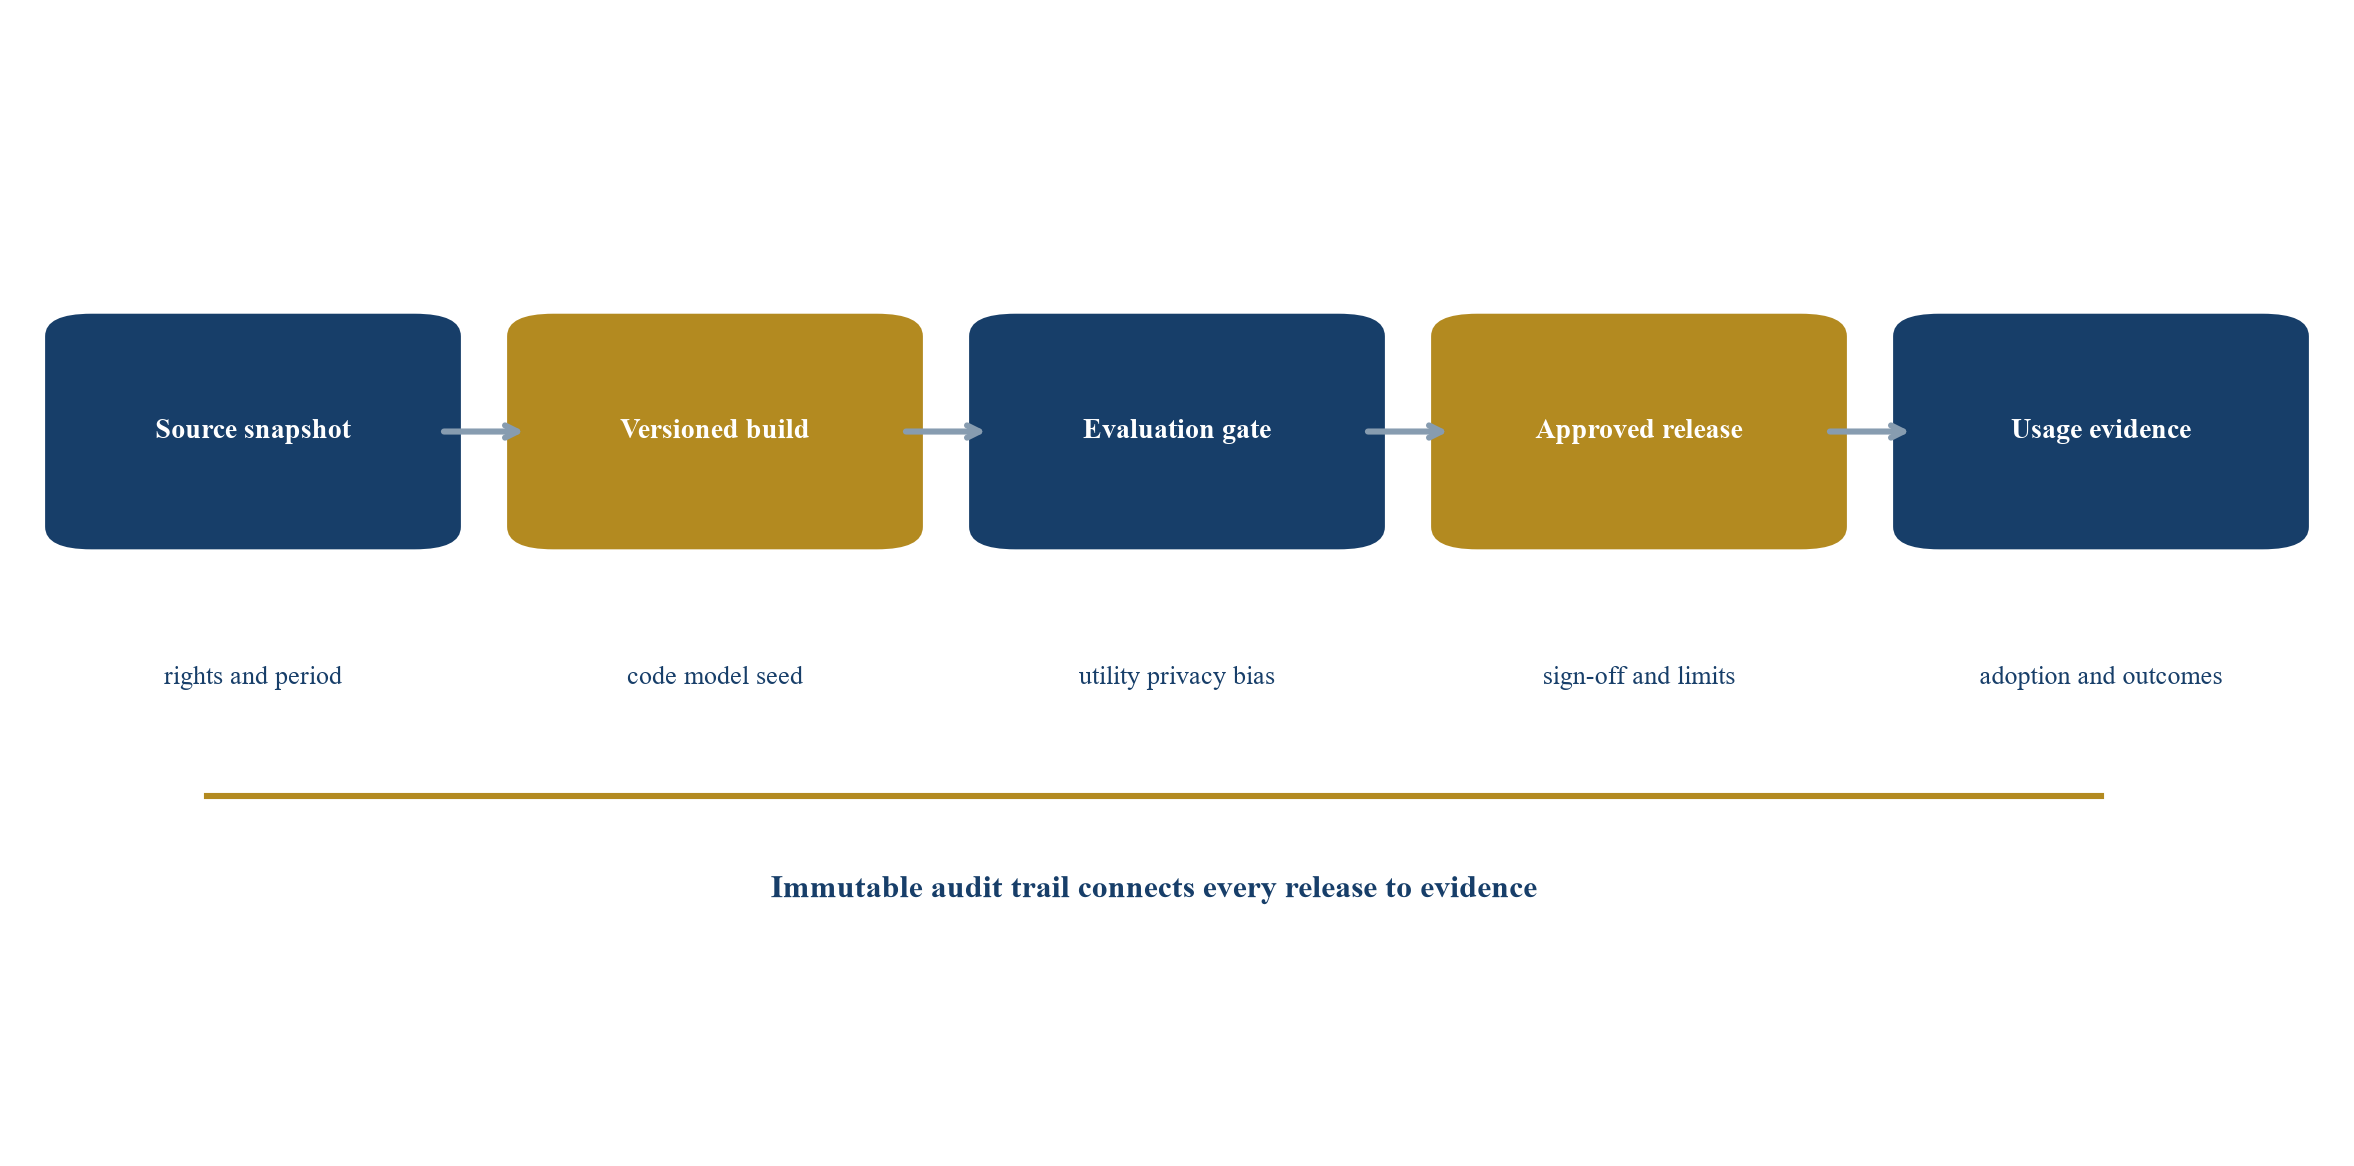
Proposed control architecture; implementation should reflect the target's technology and risk profile.
5 Measure fidelity representativeness and failure coverage
Fidelity describes how well synthetic data preserves characteristics relevant to the intended use. It is not a single property. Marginal distributions can match while dependencies fail. Aggregate accuracy can hide subgroup errors. A generator can produce plausible common cases and miss the rare events that drive customer value. Visual realism can coexist with incorrect physics or business logic.
The evaluation design should move from general to task-specific evidence. General measures may compare distributions, correlations, distances and classifier distinguishability. Domain measures can test clinical relationships, financial constraints, physical laws, sequence validity or causal structure. Task measures can test whether models trained on synthetic data perform on independent real data, whether software defects are found and whether simulations predict observed outcomes.
Representativeness should be assessed against the deployment population, not only the training sample. NIST's AI RMF Playbook links evaluation to context of use and disaggregated performance [28-30]. Synthetic generation can rebalance underrepresented groups, but it can also amplify errors when source data are sparse or biased. Rare-event synthesis therefore needs domain review and out-of-sample validation.
The buyer should inspect failure coverage. A product used to test fraud controls, industrial safety or autonomous systems may derive most of its value from realistic edge cases. The company should show how scenarios are selected, how plausibility is checked, how duplication is prevented and how findings compare with incidents or real observations. Scenario count alone is weak evidence.
| Test layer | Example evidence | What it can establish | What it cannot establish alone |
|---|---|---|---|
| schema and rules | types ranges referential integrity and domain constraints | structural usability | statistical or task fidelity |
| univariate fidelity | counts means quantiles categories and missingness | marginal similarity | relationships and rare-event behaviour |
| multivariate fidelity | correlations conditional distributions and dependence tests | preservation of selected relationships | causal validity or deployment performance |
| subgroup and rare events | disaggregated metrics scenario coverage and error rates | performance where aggregate scores may conceal weakness | full representativeness beyond tested cohorts |
| downstream task | train-synthetic-test-real or system test outcomes | usefulness for a defined model or workflow | usefulness for every other purpose |
| operational outcome | defects found cycle time acceptance and collected benefit | realised customer value | future durability without continued monitoring |
Proposed evidence hierarchy; thresholds should be defined by intended use and consequence of error.
6 Separate regulatory acceptance by use case
Regulatory acceptance should be treated as a pathway, not a label. A regulator may accept synthetic data for software testing, method development or supplementation while requiring real-world evidence for safety, effectiveness or market conduct. The product's value depends on the specific claim, decision and jurisdiction.
The EU AI Act establishes requirements for high-risk systems and creates regulatory sandboxes. Article 59 addresses further processing of personal data in certain public-interest sandbox use cases when requirements cannot be effectively fulfilled with anonymised, synthetic or other non-personal data [18]. This structure shows that synthetic data can be relevant evidence and that its adequacy remains contextual.
FDA materials distinguish analytical, clinical and software evidence. The agency's work on generative-AI-enabled devices asks how synthetic inputs should supplement real-patient data, how distribution differences should be handled and when a benchmark predicts safe and effective real-world behaviour [23-25]. EMA's 2026 to 2028 workplan includes review of synthetic data and digital twins as potential complements to established clinical data [26]. These materials support a diligence question; they do not establish pre-approval for any vendor.
Regulatory evidence should be represented as a use-case matrix. Rows can identify products, jurisdictions and customer decisions. Columns can identify the applicable authority, required evidence, current submission state, accepted limitations, monitoring obligations and responsible owner. This structure prevents an exploratory sandbox participation, a customer compliance review and a formal regulatory determination from being presented as equivalent. FCA and City of London sandbox materials similarly show that controlled experimentation provides access to data and testing support under defined conditions; participation does not itself establish market-wide approval [21-22].
The valuation model should release regulatory cash flows when evidenced milestones are met. A developmental module may receive probability-weighted value for a documented route to acceptance. A production module with repeat customer approval can receive greater weight. Revenue dependent on an untested expansion to a new jurisdiction, population or decision should remain a separate scenario. The model should include the cost of submissions, independent studies, monitoring, model changes and customer assurance rather than treating acceptance as a costless switch.
In financial services, the FCA's Digital Sandbox has used synthetic data to support experimentation, and public materials describe a synthetic-data tool for sanctions-screening testing [21-22]. Commercial value still depends on whether a customer's compliance, model-risk and audit teams accept the product for a defined control purpose.
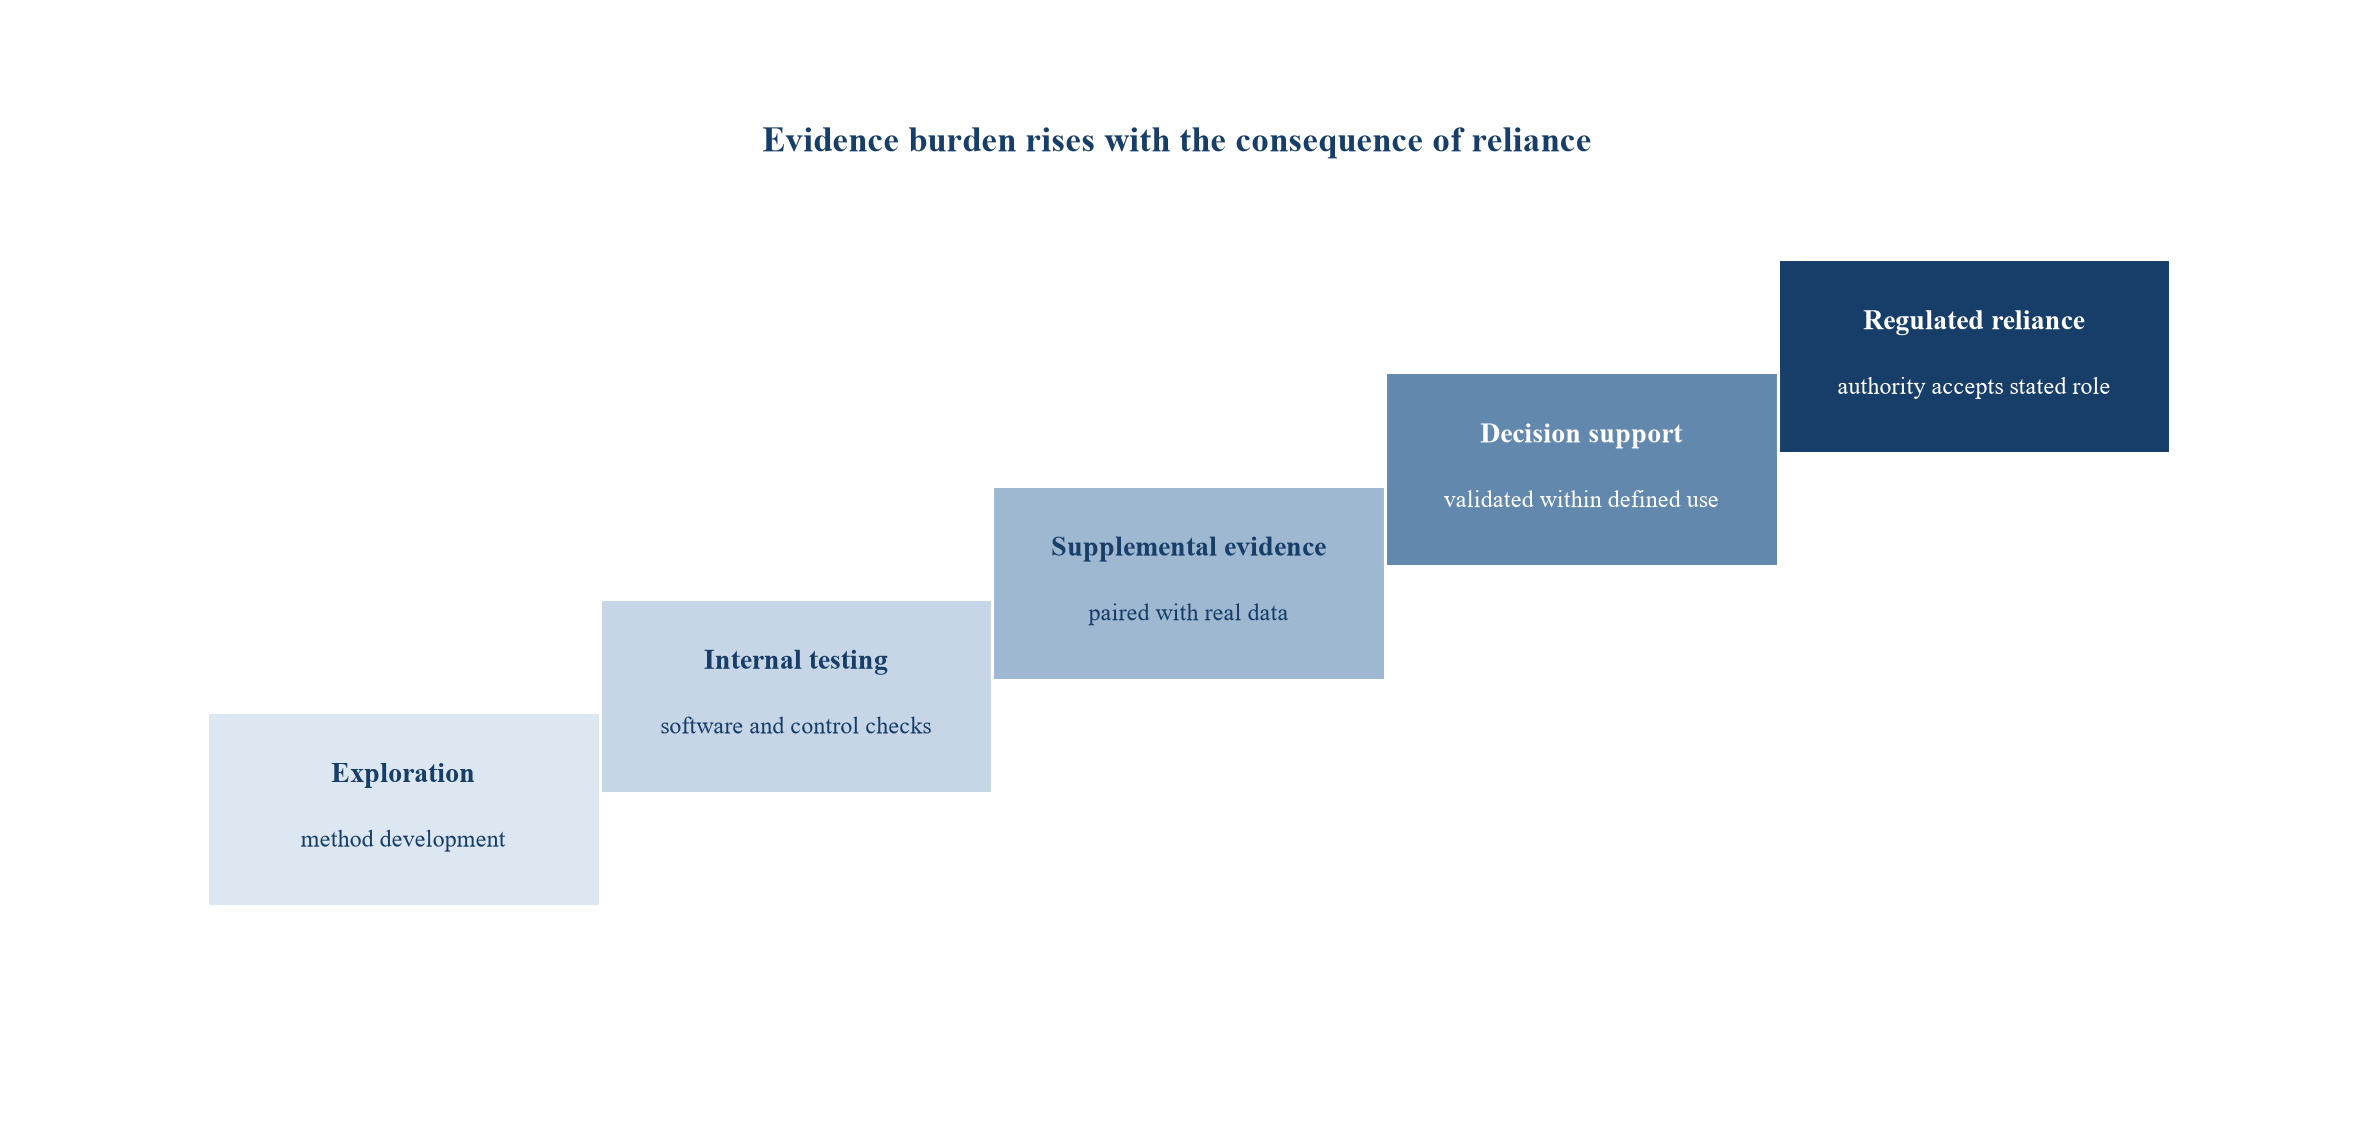
Illustrative pathway; competent authorities and specialist advisers determine actual evidence requirements.
7 Reconstruct revenue quality and sustainable earnings
The buyer should classify revenue by product, customer and evidence burden. Platform subscriptions can carry attractive gross margins when generation and evaluation are reusable. Dataset licences can be recurring or episodic. Bespoke projects can contain valuable learning and still behave like consulting. Managed validation services may produce recurring revenue with labour-intensive delivery.
Reported annual recurring revenue should be reconciled to executed contracts, billing, usage and renewal terms. The analysis should identify minimum commitments, variable compute, professional services, trial periods, termination rights, acceptance clauses and customer concentration. Revenue that depends on a one-off data build should not be valued as perpetual subscription revenue without evidence of renewal and continuing use.
Gross margin should include the full cost of generation and assurance: cloud compute, source-data licences, domain experts, privacy testing, quality review, customer-specific calibration, support and regulatory documentation. Capitalised development or shared research costs should be analysed separately. A high accounting gross margin can overstate economics when material technical work is recorded below the line.
Customer concentration should be examined by both revenue and product dependency. One customer can account for a modest share of revenue while supplying essential source access, validation expertise or a reference credential used in other sales. The buyer should identify rights that end with the contract, restrictions on derived artefacts and whether models trained or calibrated during the engagement can serve other customers. The renewal analysis should separate continuing product value from switching friction, grant funding, founder relationships and contractual notice periods.
Cash conversion requires a contract-level bridge. Milestone billing, acceptance rights, compute pass-throughs, service credits, data-retention obligations and delayed validation can make recognised revenue a weak indicator of collected cash. The model should compare bookings, recognised revenue, invoices, collections, deferred revenue, unbilled work and implementation labour. Forecasts should carry the working-capital and assurance burden associated with each use case, particularly where regulated customers retain payment until validation is complete.
Customer cohorts should be compared by intended use. Renewal in a low-stakes testing product may not predict renewal in a regulated module. A company that wins pilots through founder involvement may face scale constraints. The buyer should inspect time to acceptance, implementation effort, product usage, expansion, support load, churn reasons and cash collection.
| Revenue class | Evidence of recurrence | Cost to serve | Valuation treatment |
|---|---|---|---|
| core platform subscription | contracted term usage retention and standard deployment | compute support and continuing product assurance | recurring software cash flow if renewal and adoption are demonstrated |
| domain module licence | repeat use within a validated workflow and refreshed evidence | domain maintenance validation and source calibration | module cash flow with use-specific risk and economic life |
| dataset delivery | repeated purchases refresh schedule and transferable rights | generation review storage and distribution | recurring only when refresh demand and rights are durable |
| bespoke generation project | backlog milestone acceptance and conversion to reusable product | specialist labour customer-specific engineering and rework | project cash flow unless reuse and renewal are evidenced |
| validation and assurance service | contractual review cycle and standardised methods | privacy quality regulatory and domain staff | service cash flow with labour and utilisation constraints |
| sandbox or pilot | funded scope acceptance and production conversion | high support and pre-sales effort | option evidence rather than recurring revenue until converted |
Illustrative classification; amounts in the transaction model are management assumptions rather than market evidence.
8 Build a replacement-cost indication
The cost approach asks what a rational buyer would spend today to create an asset with equivalent utility. Historic development expenditure is a starting record and can include failed experiments, inefficient code, abandoned markets and learning that a new entrant would avoid. Replacement cost should therefore reconstruct the current work programme rather than capitalise every past expense.
The analysis should separate source acquisition, rights clearance, engineering, domain modelling, evaluation, privacy assurance, regulatory documentation, customer integration and time to commercial readiness. It should include the opportunity cost of delay when time affects market access or customer retention. It should deduct functional obsolescence when newer methods can reproduce the same outcome at lower cost.
Reproduction and replacement are different. Reproduction recreates the same platform and evidence. Replacement creates equivalent customer utility through the best available method. A buyer may substitute real data, simulation, open-source tools, a specialist vendor, customer-provided data or a smaller hybrid system. The cheapest credible route constrains value even when the target spent more.
An illustrative replacement build uses management assumptions. Engineering and model development cost USD 7.0 million. Source access and lawful calibration cost USD 4.0 million. Domain modelling costs USD 3.5 million. Utility, privacy and bias evaluation cost USD 3.0 million. Customer connectors and evidence packs cost USD 2.5 million. Programme management and failed iteration add USD 2.0 million. A two-year time adjustment adds USD 4.0 million, while avoidable legacy architecture and duplicated work reduce the indication by USD 2.0 million. The resulting replacement-cost indication is USD 24.0 million.
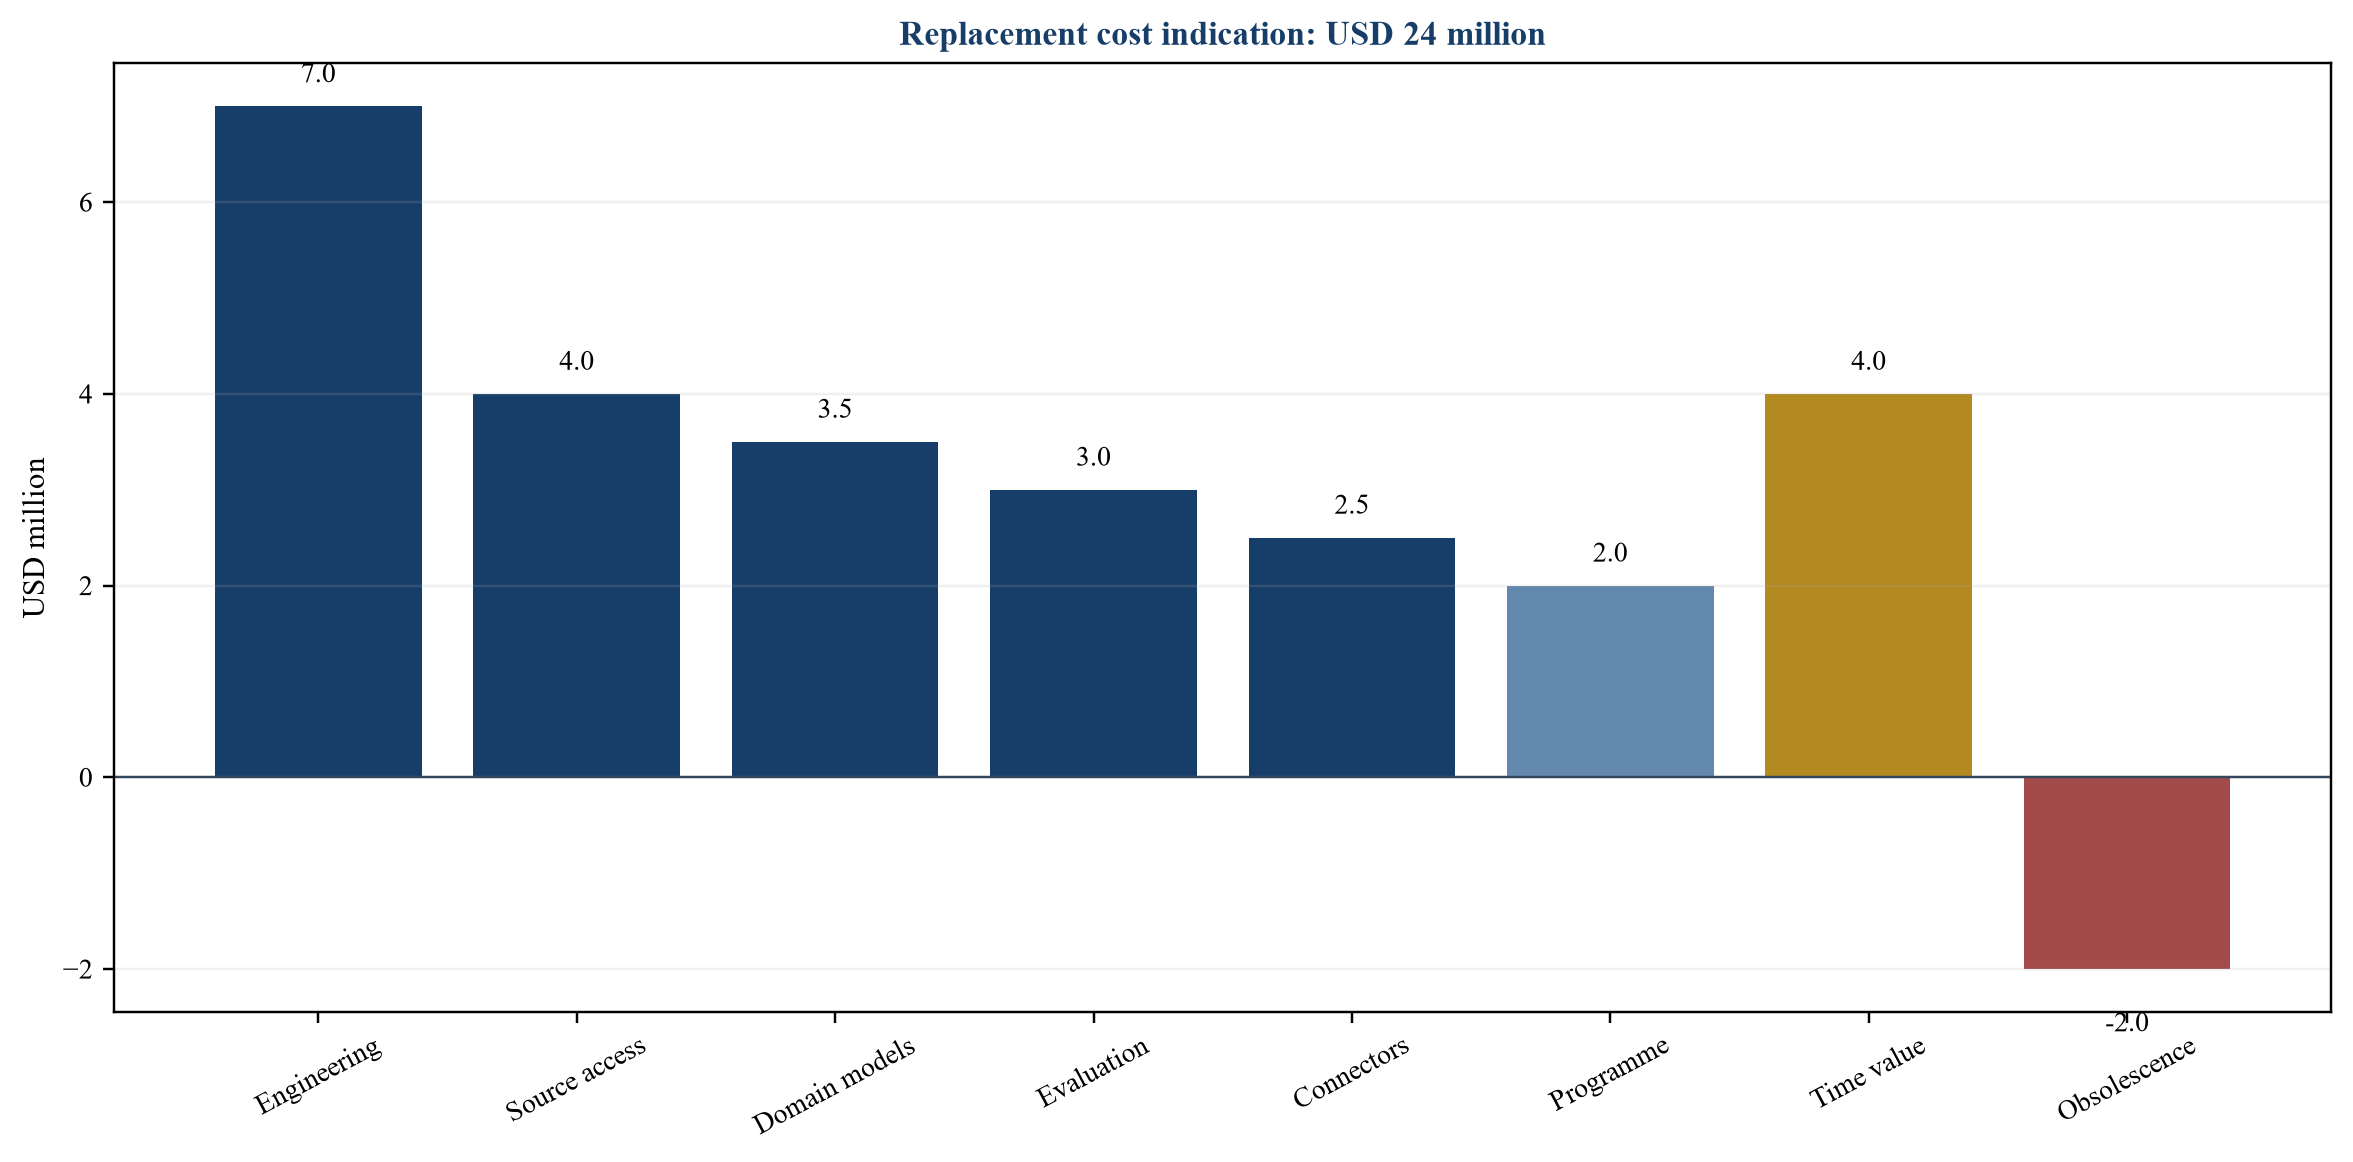
USD millions; every amount is a management assumption used only to demonstrate the method.
9 Build an income indication from accepted use
The income approach should begin with the cash flows that depend on the synthetic-data assets. It should avoid assigning the whole company's revenue to the generator. Customer relationships, sales capability, brand, cloud infrastructure, conventional software and workforce also contribute. Contributory-asset charges or an explicit with-and-without analysis can reduce double counting.
A with-and-without analysis compares the company's cash flow with the platform against a credible counterfactual. The counterfactual may involve buying real data, using a competing vendor, maintaining a customer-specific simulator or abandoning a product. The difference can include accelerated time to market, lower data-acquisition cost, higher model performance, better defect coverage, reduced privacy risk and access to customers whose governance requires the evidence system.
The forecast should model acceptance explicitly. A signed contract can contain a pilot, validation or production gate. Expected revenue therefore depends on technical success, customer approval, regulatory fit, implementation and renewal. Probability weights should be tied to evidence from comparable cohorts. A single blended discount rate cannot explain where risk enters the forecast.
The model should separate volume, price and evidence effects. Volume can reflect customers, datasets, simulations, queries or monitored deployments. Price may include a platform fee, usage charge, validation package and specialist service. Evidence affects conversion, time to production, renewal and the ability to sell adjacent modules. Separating these drivers makes it possible to test whether growth arises from reusable product economics or from adding delivery teams and bespoke work.
Terminal value requires particular discipline. Synthetic-data methods, privacy techniques, compute economics and regulatory expectations can change quickly. A perpetual-growth assumption should be supported by continuing source access, refresh capability, customer retention and a funded research programme. The model should include ongoing benchmark maintenance, independent assurance, security, domain review and revalidation. A shorter explicit economic life or higher reinvestment rate may be appropriate when the product depends on a narrow source population or rapidly changing technical stack.
Illustrative management assumptions produce a USD 51 million income indication. Addressable platform revenue is forecast from USD 29 million in year one to USD 53 million in year five. Accepted-use probability rises from 70 percent to 83 percent as the evidence system matures. Cash contribution after compute, source access, assurance, sales, support, tax and contributory-asset charges ranges from USD 5.2 million to USD 10.6 million. A six-year explicit period, a finite terminal component and risk-adjusted discounting are assumed. These figures demonstrate mechanics and are not a forecast for any company.
| Year | Addressable revenue | Accepted-use probability | Risk-adjusted revenue | Attributable cash contribution |
|---|---|---|---|---|
| 1 | 29.0 | 70% | 20.3 | 5.2 |
| 2 | 35.0 | 74% | 25.9 | 6.4 |
| 3 | 41.0 | 77% | 31.6 | 7.8 |
| 4 | 47.0 | 80% | 37.6 | 9.2 |
| 5 | 53.0 | 83% | 44.0 | 10.6 |
| indication | USD 51.0 million present value |
USD millions except percentages; all figures are management assumptions used only to demonstrate the framework.
10 Use market evidence with disciplined adjustment
Market evidence can include acquisitions, financing rounds, listed companies, software transactions, data licences and specialist-service businesses. Comparability is difficult because the label synthetic data covers different products. A computer-vision simulation company, a privacy-preserving tabular-data platform and a clinical digital-twin business have different economics and regulatory exposure.
Comparable analysis should adjust for revenue mix, growth, gross margin, retention, customer concentration, use-case risk, intellectual-property control, source-data dependence, evidence maturity and services intensity. Headline transaction value may include talent, strategic synergies or control premiums. Financing valuations can reflect preference terms and future options. Public-market multiples can include businesses with broader product portfolios.
The buyer should prefer operating comparables over narrative similarity. Useful evidence includes standard deployment time, gross retention, net retention, recurring gross margin, conversion from pilot to accepted use, revenue per assurance employee and frequency of product refresh. A target with lower growth and stronger regulatory acceptance may deserve a different risk profile from a rapidly growing experimentation tool.
In the illustrative case, adjusted software and data-platform evidence supports a corridor of USD 35 million to USD 60 million for the synthetic-data assets. The range remains broad because published transactions rarely disclose utility, privacy and reproducibility evidence. The range is used to test the cost and income indications, not to replace them.
| Comparison factor | Stronger evidence | Weaker evidence | Likely valuation effect |
|---|---|---|---|
| customer outcome | production use with measured benefit | experiment or unpaid pilot | stronger evidence supports higher expected cash |
| privacy assurance | formal guarantee and independent attack testing | broad anonymity claim | stronger evidence reduces remediation and liability risk |
| reproducibility | controlled rebuild and complete provenance | key-person or undocumented pipeline | reproducibility supports transferability |
| regulatory fit | accepted role in defined process | general regulatory narrative | accepted role supports probability of conversion and renewal |
| revenue quality | standard subscription with usage and retention | bespoke project and founder-led delivery | recurring product economics support a higher multiple |
| source dependence | durable lawful access and alternatives | revocable customer data or single supplier | dependence reduces economic life and bargaining power |
Proposed market-evidence discipline; transaction details and adjustments require independent verification.
11 Reconcile value through an evidence-weighted scorecard
Valuation should reconcile the approaches rather than average them mechanically. Replacement cost can be informative when technology and evidence can be rebuilt. Income evidence becomes stronger when accepted use, renewal and margins are observable. Market evidence becomes stronger when comparable products and transaction terms are transparent.
The illustrative reconciliation begins with USD 24 million of replacement cost, USD 51 million of income value and a USD 35 million to USD 60 million market corridor. Weighting is based on evidence maturity. The income approach receives the highest weight because the target has customer cohorts and usage data. Replacement cost constrains the conclusion where credible substitutes exist. Market evidence acts as a range check.
The conclusion is adjusted for five risks. Utility is demonstrated for common tasks but less certain for rare subgroups. Privacy testing exists, while some older releases lack formal differential-privacy accounting. Clean-room rebuilds cover the core platform but not every domain module. Healthcare acceptance remains developmental. Bespoke services still represent a material share of revenue. The resulting evidence-weighted indication is USD 43 million.
The scorecard should show how new evidence changes value. A successful independent privacy audit can reduce a discount. Production acceptance by a regulator or major customer can increase probability-weighted cash. Loss of source access, a reproducibility failure or a material incident can reduce economic life. This design makes valuation governable after closing.
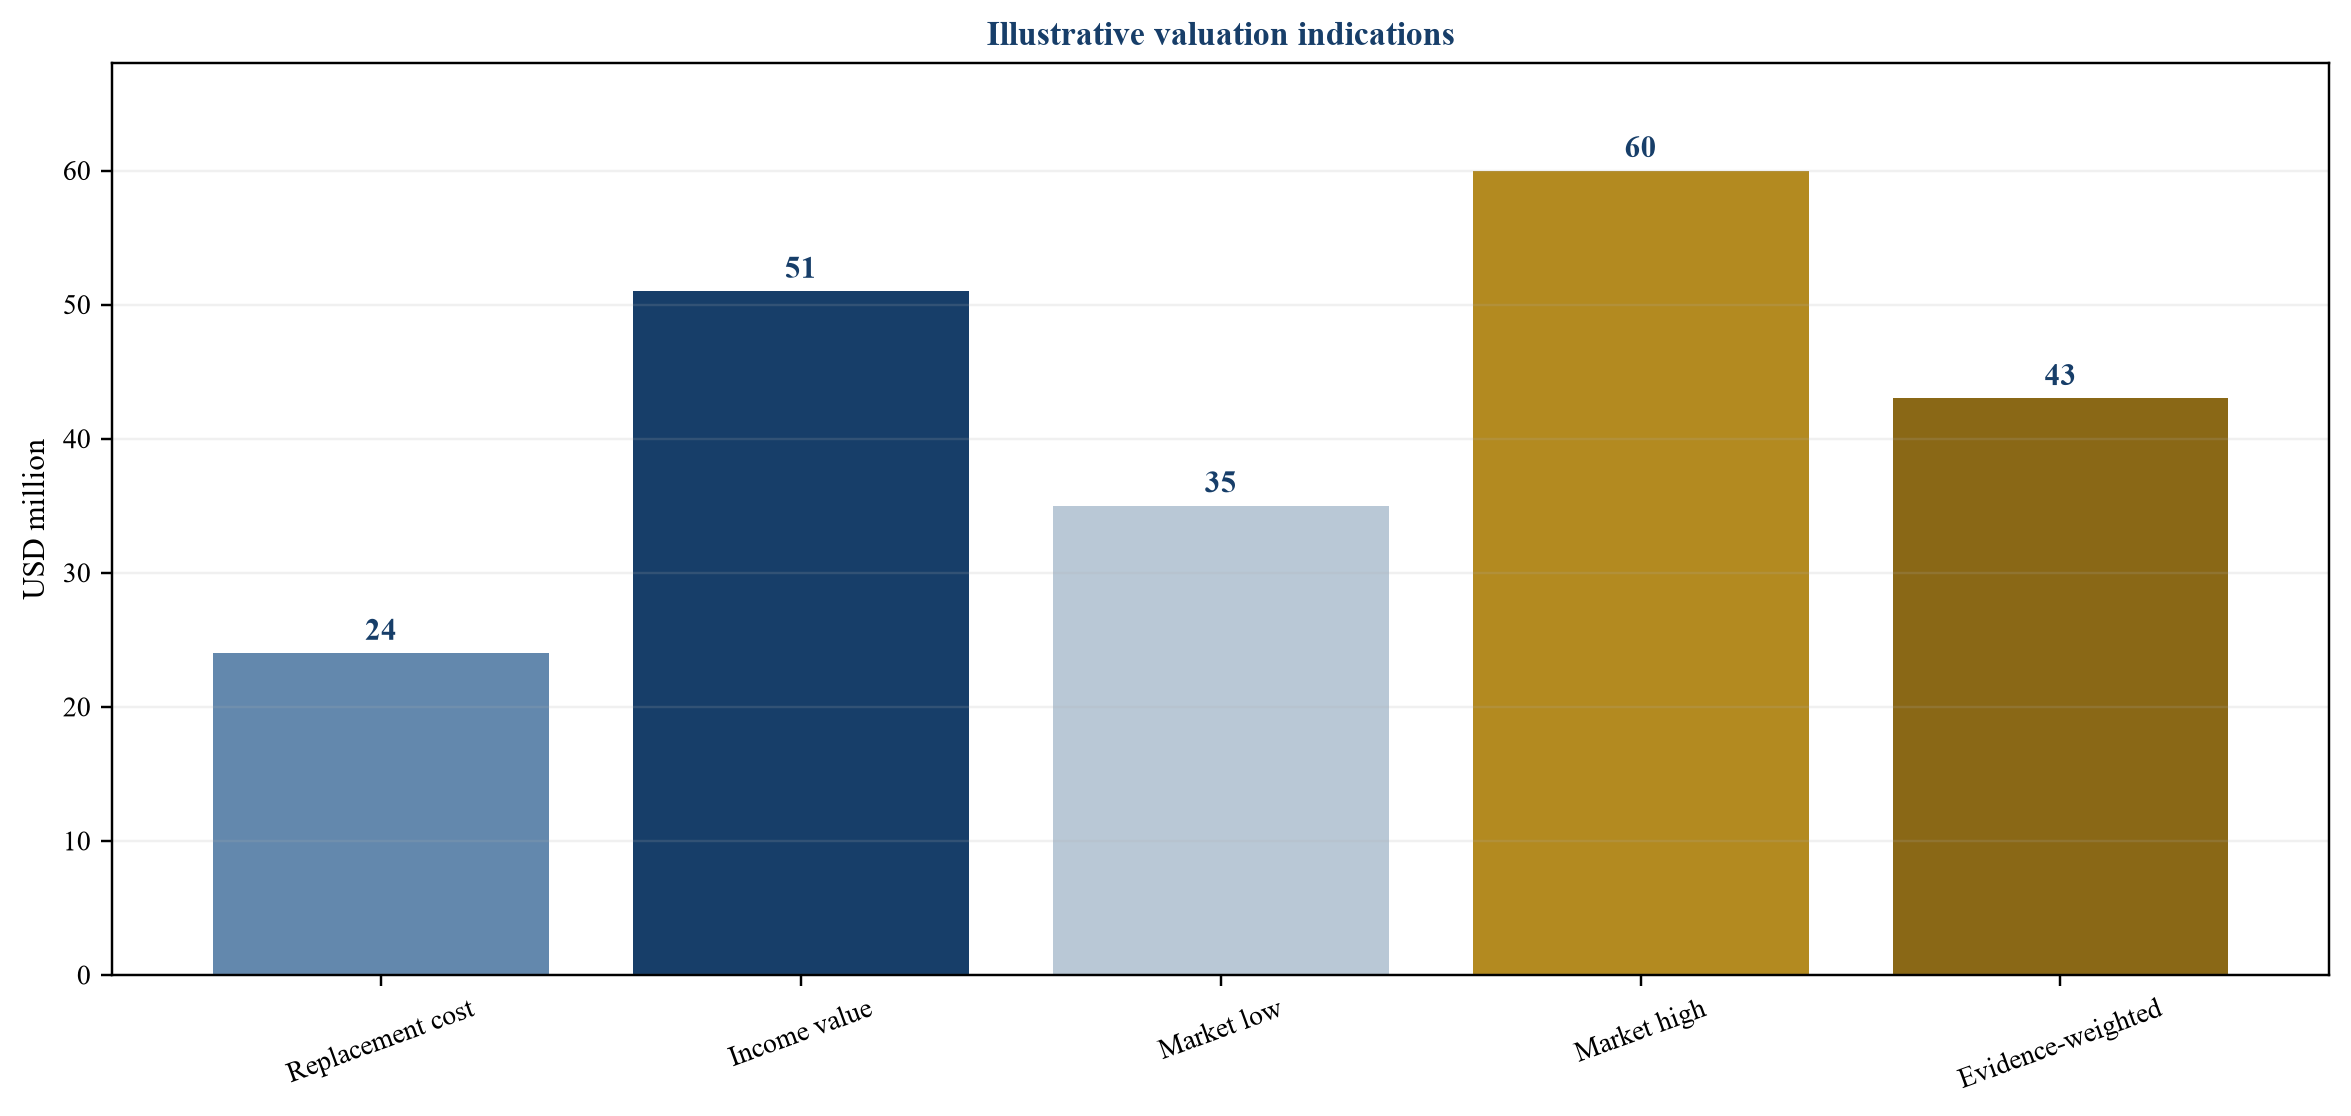
USD millions; illustrative management assumptions only.
12 Convert diligence findings into transaction terms
The diligence plan should be reproducible. Management presentations can explain the product; transaction decisions require inspectable records. The buyer should obtain the asset inventory, source rights, build manifests, evaluation methods, attack tests, benchmark governance, customer acceptance evidence, incident history, revenue bridge and cost-to-serve model.
Technical diligence should reproduce a representative dataset and selected evaluation results. Privacy specialists should challenge the threat model and test outputs. Domain experts should examine causal, physical or regulatory constraints. Commercial diligence should interview customers about use, acceptance, alternatives and renewal. Finance should reconcile contracts, invoices, usage, compute and labour to reported margins.
Findings should map to consideration and protection. Unresolved source rights can be excluded, remediated before closing or supported by indemnity and escrow. Uncertain regulatory acceptance can be placed in an earn-out tied to defined approvals or accepted production use. Key-person dependence can support retention arrangements and documentation conditions. Customer-specific project revenue can receive a lower multiple than standard platform revenue.
Earn-outs should use outcomes that both sides can observe and influence appropriately. Suitable measures can include defined production acceptance, collected recurring revenue from identified products, renewal by a specified cohort or completion of an agreed independent validation. Measures based only on model benchmarks can reward technical improvement without commercial acceptance. Measures based only on total revenue can be distorted by services, pricing changes or the buyer's distribution decisions. The agreement should define evidence, calculation, governance, dispute resolution and treatment of post-close product changes.
The board decision should retain a claim register. Each material valuation claim should identify its source, owner, evidence date, confidence, financial effect and transaction response. Examples include privacy performance, reproducibility, source transferability, customer acceptance and regulatory status. This register creates a direct line from diligence to price and integration. It also enables the buyer to revisit assumptions when evidence changes rather than discovering months later that a headline claim had no accountable owner.
| Finding | Closing evidence | Pricing response | Contractual protection |
|---|---|---|---|
| privacy guarantee incomplete | formal mechanism code review and independent test | discount or exclude affected product cash | remediation covenant escrow and specific indemnity |
| utility limited to certain tasks | validated task matrix and customer acceptance records | value only demonstrated use cases | earn-out tied to defined production adoption |
| domain module not reproducible | clean-room rebuild and artefact inventory | replacement cost or lower economic life | delivery condition retention and transition support |
| source access revocable | consent licence change-of-control and alternative-source plan | probability weight cash and add replacement cost | closing condition representation and termination protection |
| project services embedded in ARR | contract invoice usage and labour reconciliation | separate service and platform multiples | working-capital and revenue-quality adjustment |
| regulatory pathway uncertain | written advice submission history and authority interactions | staged value linked to milestones | contingent consideration with precise evidence definition |
Illustrative structure; transaction counsel tax advisers accountants and technical specialists should design actual terms.
13 Govern post-close integration and impairment signals
Integration should preserve evidence before platforms are combined. The buyer should freeze material code and data versions, retain build manifests, secure evaluation records and identify customer-specific restrictions. Migration can change provenance, privacy guarantees and reproducibility even when the output looks similar.
The first hundred days should establish a unified release register. Each synthetic-data product should have an owner, intended use, source classes, generator version, privacy setting, utility thresholds, known limitations, customer permissions, approval state and refresh schedule. High-risk modules should remain gated until their evidence is rebuilt in the buyer's environment.
Value creation can follow three routes. The buyer can standardise assurance work, reducing repeated project cost. It can extend validated modules to adjacent customers with comparable use. It can combine source access, domain models and distribution while preserving legal and technical boundaries. Each route should be measured against collected cash and customer outcomes.
Integration metrics should distinguish growth from evidence erosion. Useful measures include accepted-use revenue, pilot-to-production conversion, clean-room rebuild success, privacy-test exceptions, subgroup utility, release cycle time, source-access continuity, recurring assurance cost, gross margin after technical labour and cash collected. A rising number of generated records or datasets is an operating statistic; it does not establish value without customer acceptance and economic conversion.
The impairment watchlist should include loss of a source-data right, inability to reproduce a material release, failed independent privacy testing, customer rejection, adverse regulatory feedback, departure of indispensable personnel, deteriorating renewal and a sustained increase in compute or assurance cost. Each indicator should have an owner, threshold and response. Early detection allows the buyer to preserve evidence, narrow claims, remediate controls and update forecasts before a technical problem becomes a customer or liability event.
The board dashboard should connect technical and commercial evidence. Useful measures include accepted-use revenue, pilot conversion, gross retention, standard deployment time, compute per release, privacy-test failures, task utility, subgroup error, reproducible-build success, regulatory milestones, incidents and unresolved source rights. Targets should specify actions when thresholds fail.
Accounting teams should monitor indicators relevant to recognised intangible assets and goodwill under the applicable framework. A customer rejection, regulatory setback, material privacy incident, source loss, falling renewal or cheaper substitute may affect expected cash or economic life. Transaction valuation and subsequent impairment serve different purposes and require professional judgement.
Conclusion
Synthetic-data companies can create valuable infrastructure for AI development, software testing, simulation, research and regulated innovation. Their value arises when generated data performs a defined customer task, privacy claims withstand attack, releases can be reproduced, limitations are documented and customers accept the evidence in a recurring workflow.
A defensible valuation starts by decomposing the asset stack. It follows the customer decision, tests utility and privacy together, requires provenance and controlled builds, distinguishes regulatory pathways, reconstructs revenue quality and reconciles replacement cost, income and market evidence. It converts uncertainty into price, contingent consideration, escrow, indemnities, closing conditions and a governed integration plan.
This method protects both sides of a transaction. Buyers can avoid paying software multiples for bespoke delivery or untested claims. Sellers can improve readiness by documenting source access, evaluation, reproducibility, acceptance and cash conversion. The result is a valuation supported by evidence that survives technical challenge, customer scrutiny and post-close monitoring.
Sources
- IFRS Foundation. IAS 38 Intangible Assets. Read the primary source
- IFRS Foundation. IFRS 3 Business Combinations. Read the primary source
- IFRS Foundation. IFRS 13 Fair Value Measurement. Read the primary source
- World Intellectual Property Organization. Valuing intellectual property assets. Read the primary source
- World Intellectual Property Organization. Intellectual Property Valuation Basics for Technology Transfer Professionals. Read the primary source
- World Intellectual Property Organization. The income approach. Read the primary source
- International Valuation Standards Council. Perspectives Paper Value and Data. 2024. Read the primary source
- International Valuation Standards Council. Perspectives Paper Deciphering Technology. 2023. Read the primary source
- National Institute of Standards and Technology. Guidelines for Evaluating Differential Privacy Guarantees SP 800-226. 2025. Read the primary source
- National Institute of Standards and Technology. SDNist Synthetic Data Report Tool. Read the primary source
- National Institute of Standards and Technology. Differentially Private Synthetic Data. Read the primary source
- National Institute of Standards and Technology. Utility Metrics for Differential Privacy No One Size Fits All. 2021. Read the primary source
- United Kingdom Information Commissioner's Office. Privacy-enhancing technologies. Read the primary source
- United Kingdom Information Commissioner's Office. Guidance on AI and data protection. Read the primary source
- United Kingdom Information Commissioner's Office. Security and data minimisation in AI. Read the primary source
- European Union. Regulation EU 2016/679 General Data Protection Regulation. Read the primary source
- European Data Protection Board. Opinion 28/2024 on processing personal data in AI models. Read the primary source
- European Union. Regulation EU 2024/1689 laying down harmonised rules on artificial intelligence. Read the primary source
- European Commission. European Data Union Strategy. 2026. Read the primary source
- European Commission. Data Union in a nutshell. 2025. Read the primary source
- Financial Conduct Authority. Digital Sandbox. Read the primary source
- City of London Corporation. Digital Sandbox pilot. Read the primary source
- United States Food and Drug Administration. Medical Device Software Guidance Navigator. Read the primary source
- United States Food and Drug Administration. Use of Real-World Evidence to Support Regulatory Decision-Making for Medical Devices. 2025. Read the primary source
- United States Food and Drug Administration. Considerations for the Regulation of Generative AI-Enabled Medical Devices. 2026. Read the primary source
- European Medicines Agency. Data and AI in Medicines Regulation Network Data Steering Group Workplan 2026-2028. Read the primary source
- United States Food and Drug Administration. Overview of IVD Regulation. Read the primary source
- National Institute of Standards and Technology. Artificial Intelligence Risk Management Framework 1.0. 2023. Read the primary source
- National Institute of Standards and Technology. AI RMF Playbook Measure. Read the primary source
- National Institute of Standards and Technology. AI RMF Core. Read the primary source
- International Organization for Standardization. ISO IEC 5259-1 Artificial intelligence data quality for analytics and machine learning. 2024. Read the primary source
- International Organization for Standardization. ISO IEC 5259-2 Data quality measures. 2024. Read the primary source
- International Organization for Standardization. ISO IEC 5259-3 Data quality management requirements and guidelines. 2024. Read the primary source
- International Organization for Standardization. ISO IEC 5259-4 Data quality process framework. 2024. Read the primary source
- International Organization for Standardization. ISO IEC 42001 artificial intelligence management systems. Read the primary source
- International Organization for Standardization. ISO IEC 23894 artificial intelligence risk management. Read the primary source
- OECD. Privacy-enhancing technologies. Read the primary source
- OECD. Recommendation of the Council on Artificial Intelligence. Read the primary source
- OECD. OECD AI Principles. Read the primary source
- United Nations Economic Commission for Europe. Synthetic Data for National Statistical Organizations A Starter Guide. Read the primary source
- National Institute of Standards and Technology. HLG-MOS Synthetic Data Test Drive. Read the primary source
- United States Census Bureau. Disclosure Avoidance and the 2020 Census. Read the primary source
- European Union Agency for Cybersecurity. Data protection engineering. Read the primary source
- National Institute of Standards and Technology. Privacy Framework. Read the primary source
- National Institute of Standards and Technology. Cybersecurity Framework 2.0. 2024. Read the primary source
- Federal Trade Commission. Artificial intelligence and algorithmic tools. Read the primary source
- European Commission. AI regulatory sandboxes. Read the primary source
- European Commission. Common European data spaces. Read the primary source
- European Commission. Data Act explained. Read the primary source
- World Intellectual Property Organization. Technology Trends Artificial Intelligence. Read the primary source
