

1. Translate transition risk into conventional credit risk
A lender is repaid from cash flow, collateral, support or recovery. Transition risk matters when a change in policy, law, technology, market preference, resource price or operating requirement affects those repayment sources.
The transmission chain begins outside the financial statements. A carbon-related requirement can increase direct compliance cost, affect export competitiveness, change customer demand or require new equipment. A power shock can raise unit cost, reduce capacity utilisation or make a location less competitive. A water constraint can interrupt production, increase treatment cost, require recycling investment or impair an asset designed around an unavailable resource.
The chain then enters operating performance. Revenue can decline through lost volume, lower price or customer migration. Gross margin can compress through energy, water, raw-material, transport and compliance cost. Capital expenditure can rise through equipment replacement, efficiency, metering, treatment or process redesign. Working capital can lengthen as inventories, receivables or supplier terms adjust.
Those effects alter free cash flow, leverage and debt-service capacity. They can also affect collateral value, insurance availability, useful life, refinancing and recovery. The lender should identify the material channel and trace it to an existing risk category. A transition score without that bridge has limited decision value.
The Central Bank of the UAE's current regulation explicitly requires financial institutions within scope to connect climate-related risk drivers to traditional risk categories and incorporate them into credit, investment and underwriting processes at customer and portfolio levels.[1] The Basel Committee similarly frames climate-related drivers as sources of conventional financial risk requiring integration into governance, credit processes, monitoring and control.[4]
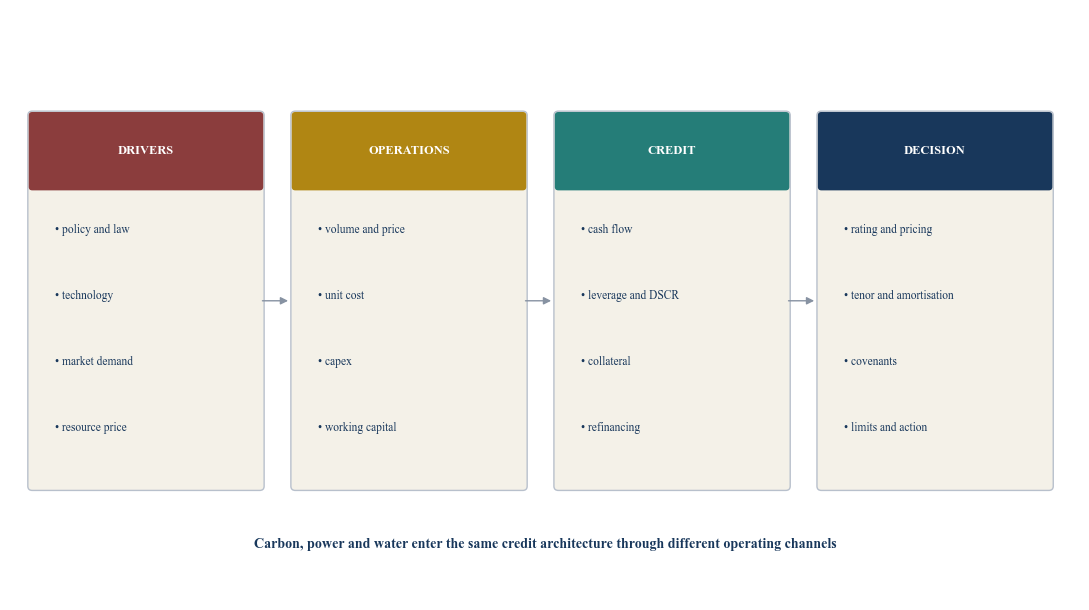
Author framework. Materiality and available controls depend on the borrower, facility, evidence and scenario.
2. Start from the current regulatory and policy perimeter
The current UAE regulatory position is material to banks and insurers. CBUAE Regulation C 8/2025 was issued on 14 October 2025 and is shown as in force in the CBUAE Rulebook. It applies to banks and insurance companies, subject to the detailed scope and proportionality provisions. Other licensed financial institutions can be brought within scope in due course.[1]
The regulation establishes minimum standards for climate-related financial-risk governance and risk management. It addresses identification, data, assessment, measurement, reporting, control, mitigation, credit and underwriting, capital and solvency. The requirements include comprehensive identification across short, medium and long horizons; data frameworks; metrics and indicators; timely board and senior-management reporting; risk-appetite limits; and integration at customer and portfolio levels.[1]
The UAE Sustainable Finance Working Group principles published in 2023 address oversight, strategy, responsibility, risk frameworks, monitoring, reporting, capital, liquidity and scenario analysis.[2] CBUAE's 2024 annual report states that UAE banks conducted a pilot transition-risk stress test on corporate lending to climate-risk-vulnerable sectors, focused on the twenty largest corporate borrowers in those sectors and used NGFS scenarios.[3]
International standards provide context. The Basel Committee's 2025 revised Principles for the Management of Credit Risk address the credit environment, granting process, administration, measurement, monitoring and controls.[5] Its climate-risk principles require banks to understand material impacts on credit profiles and incorporate them through the credit lifecycle.[4]
Climate policy and disclosure context also matters. The UAE's NDC 3.0 records the country's national contribution under the Paris Agreement.[8] Cabinet Resolution No. 67 of 2024 regulates the National Register for Carbon Credits and applies specified registration requirements to entities meeting its scope and threshold.[9] IFRS S2 addresses decision-useful disclosure of climate-related risks and opportunities that could affect cash flows, access to finance or cost of capital.[7]
None of these sources supplies one mandatory borrower carbon price or a universal credit adjustment. The lender must choose, document and govern the scenarios and decision rules appropriate to its perimeter.
3. Separate carbon, power and water exposures
Carbon, electricity and water are related, yet they are not interchangeable. Each exposure needs its own unit, source, contract, baseline, forward driver and control.
Carbon exposure can include direct emissions, purchased-energy emissions, value-chain emissions, product intensity, carbon-credit obligations, customer requirements and border measures. Its financial effect can arise through a tax, credit, compliance expenditure, customer discount, lost market, technology change or reputational response. The lender should identify the legally relevant entity, reporting boundary and emission scope before calculating intensity.
Power exposure includes consumption, peak demand, tariff slab, fuel adjustment, contracted price, grid connection, reliability, generation source, on-site generation, storage, efficiency and critical-load resilience. The credit question concerns total delivered cost and continuity, not a single tariff headline.
Water exposure includes intake, source, quality, tariff, treatment, recycling, discharge, scarcity, permit, emergency supply and process dependence. Volume alone can mislead. A high-volume user with closed-loop recycling and alternative supply can differ materially from a smaller user whose product fails when water quality or continuity changes.
The diagnostic preserves gross exposure, mitigation and residual exposure. A solar installation can reduce grid purchases while introducing capital, maintenance and operating assumptions. A water-recycling plant can reduce intake while creating treatment and energy needs. A carbon-reduction project can improve market access and require front-loaded expenditure.
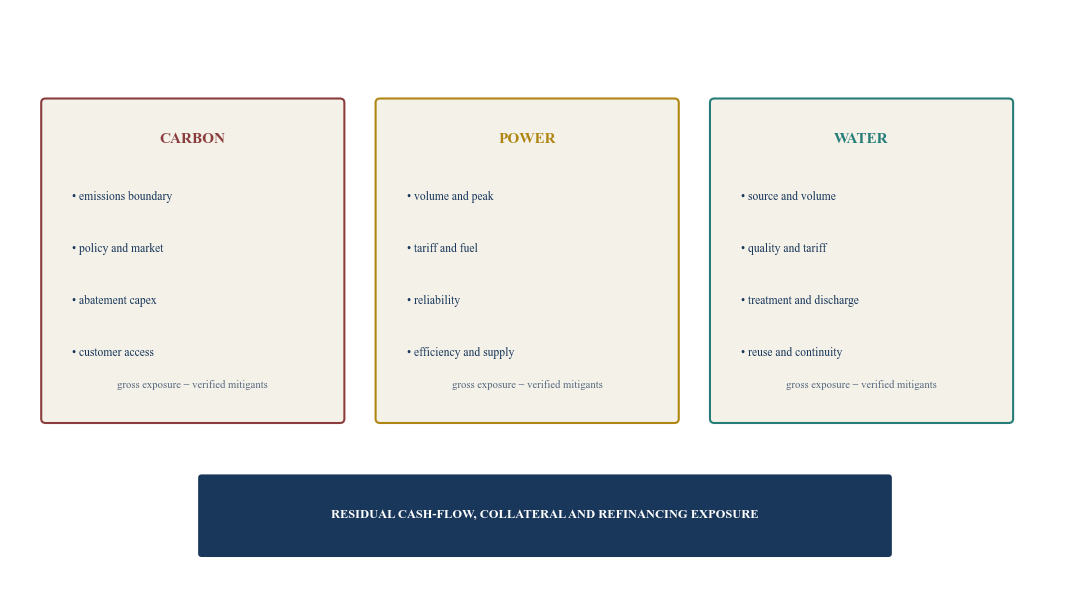
Author framework. Residual credit exposure follows evidence-based mitigants and dependencies.
4. Build a source-controlled evidence dictionary
Every material field should carry a definition, unit, entity, period, source, owner, quality status and use. Carbon tonnes, kilowatt-hours and cubic metres cannot enter one score without traceable transformations.
Evidence can come from audited financial statements, management accounts, utility bills, smart meters, equipment records, production systems, environmental reports, permits, supplier contracts, customer specifications, insurance, engineering studies and independently assured disclosures. The lender should record whether each datum is measured, invoiced, calculated, estimated or management-provided.
The time basis matters. A full-year carbon inventory and a monthly utility bill should not be compared without normalisation. Production intensity can change because the numerator changes, the denominator changes or both. A lower emissions-per-unit figure can coexist with higher absolute emissions and higher cash cost.
The lender should retain the original value and transformation. Currency, unit conversion, calorific value, emission factor, weather normalisation, production adjustment and consolidation changes need explicit version control. Where data is missing, a proxy or conservative assumption should be visible to the decision-maker.
Table 1. Evidence dictionary for carbon, power and water credit analysis
| Field | Unit and boundary | Preferred evidence | Credit use | Quality challenge |
|---|---|---|---|---|
| Scope 1 emissions | tCO2e by legal entity and site | assured inventory and source records | direct transition exposure | boundary or factor changes |
| Purchased-energy emissions | tCO2e and electricity source | utility and supplier evidence | power-related carbon exposure | contractual versus physical attributes |
| Product carbon intensity | tCO2e per defined output | reconciled emissions and production | customer and market sensitivity | denominator and product-mix shifts |
| Electricity consumption | kWh by site and period | meter and utility bill | operating cost and efficiency | missing sites or estimated reads |
| Peak demand and capacity | kW or MW | meter, contract and connection | cost, expansion and continuity | contracted and available capacity differ |
| Delivered electricity cost | AED per kWh and fixed charges | invoice and contract | cash-flow sensitivity | tariff, fuel, demand and VAT components |
| Water intake | m3 by source and site | meter, invoice and permit | cost and resource dependency | unmetered or shared supply |
| Water quality | agreed technical parameters | laboratory and process records | yield, treatment and continuity | sampling frequency and source change |
| Water reuse | m3 and percentage of process demand | plant meter and balance | mitigation and operating resilience | claimed capacity versus realised use |
| Transition capital plan | AED, timing and committed status | approved budget, contracts and milestones | liquidity and execution risk | unfunded or aspirational projects |
| Customer requirement | revenue share and specification | contracts, tenders and buyer correspondence | market-access risk | informal statements or uncertain timing |
| Residual value | asset, life and market | valuation and technical review | collateral and recovery | scenario and market liquidity |
Data availability, rights and reliability vary by borrower and jurisdiction.
5. Diagnose exposure at borrower and sector level
A sector label is a screening device. The credit decision requires borrower-level evidence. Two manufacturers in the same industry can use different processes, energy sources, water systems, customer markets and assets.
The diagnostic begins with the operating model: product, site, process, input, customer, route to market and critical equipment. It then maps carbon, electricity and water to the income statement, balance sheet and cash flow. Management actions are evaluated for authority, funding, timing, technology, suppliers and milestones.
The lender should identify thresholds and cliffs. A gradual energy-cost increase can compress margin over several years. A customer standard can remove revenue at one contract renewal. A grid-capacity constraint can prevent expansion. A water-quality failure can stop production immediately. A permit or equipment deadline can require concentrated capital expenditure.
Concentration matters within the borrower. One site can generate most EBITDA. One power connection can support several production lines. One water source can serve a complete facility. One export customer can impose a carbon requirement across the supplier's output.
Table 2. Borrower transition-risk diagnostic by operating archetype
| Operating archetype | Carbon question | Power question | Water question | Credit consequence to test |
|---|---|---|---|---|
| Export manufacturer | will buyer or border requirements affect price or volume? | can cost and reliability preserve delivered competitiveness? | does water affect process, quality or licence? | margin, capex, working capital and customer concentration |
| Logistics operator | how quickly can fleet and fuel mix change? | is charging or depot capacity available? | is washing or cooling material? | asset life, utilisation, capex and residual value |
| Food processor | what emissions sit in process and supply chain? | can refrigeration and heat cost be controlled? | how exposed are intake, hygiene and discharge? | continuity, yield, inventory and customer compliance |
| Real-estate owner | how do asset standards affect occupancy and value? | can systems meet efficiency and cooling needs? | can consumption and leakage be reduced? | net operating income, retrofit capex and valuation |
| Data-centre operator | how is power-source and customer carbon demand managed? | is capacity firm, redundant and economic? | what cooling system and water intensity apply? | utilisation, expansion, contracts and terminal value |
| Materials producer | what process route and abatement options exist? | can electrification or efficiency be delivered? | is water needed for process, cooling or dust control? | unit cost, plant life, capex and market access |
| Agricultural business | what energy and fertiliser drivers matter? | are pumps and cooling reliable? | what source, quality, permit and depletion risk apply? | yield, continuity, asset value and insurance |
| Hospitality asset | how do customer and brand standards change? | what is the cooling and efficiency profile? | how material are pools, landscaping and laundry? | occupancy, opex, refurbishment and value |
The table provides questions for diligence and does not assign a sector rating.
6. Establish present economics before applying scenarios
Scenario analysis needs a reconciled base case. The lender should begin with actual production, sales, operating costs, utility volumes, tariffs, cash flow, debt, collateral and approved capital plans.
Current power and water economics can be decomposed from bills. DEWA's official tariff page, for example, publishes consumption slabs and monthly fuel surcharges for its customer categories.[11] The July 2026 page shows progressive electricity and water slabs and identifies separate fuel surcharges. Those published values are time-specific and utility-specific. A borrower model should use the actual supplier, category, location, contract, bill and date.
Carbon economics can be direct or indirect. A facility within the scope of the UAE carbon-credit register resolution can have reporting and registration considerations.[9] Other borrowers can experience carbon economics through customers, products, procurement, finance, technology or overseas markets. The model should state which mechanism creates the assumed cash effect.
Water economics includes more than the tariff. Treatment chemicals, pumping, heating, cooling, wastewater, discharge, downtime, alternative supply and capital maintenance can exceed the invoice price. Official UAE policy describes water security as a national priority and includes demand-reduction and reuse objectives under the Water Security Strategy 2036.[10]
The base case reconciles physical volumes to expense and cash. Where figures do not reconcile, the lender opens an exception before applying a scenario.
7. Convert resource drivers into a cash-flow bridge
The transition bridge links an external scenario to borrower cash flow in transparent steps. Each step has a unit and formula.
A carbon-cost assumption can be multiplied by covered emissions after eligible free allocation, credits or other specified treatment. A power-cost assumption can combine volume, tariff, fuel surcharge, fixed charge, demand and contractual adjustments. A water-cost assumption can combine intake, tariff, treatment, discharge, recycling, alternative supply and downtime.
Revenue effects require an explicit commercial mechanism. Volume can decline when a customer requirement is unmet. Price can change when a product receives a premium or discount. Market access can depend on verification or product standards. The lender should avoid applying a generic revenue haircut without a defined transmission channel.
Capital expenditure and savings should be timed. A project can require construction cash before efficiency benefits emerge. Commissioning can be delayed. Savings can depend on utilisation, maintenance, resource price and operating performance. The model should include debt funding, equity funding, grants or internal cash only where support exists.
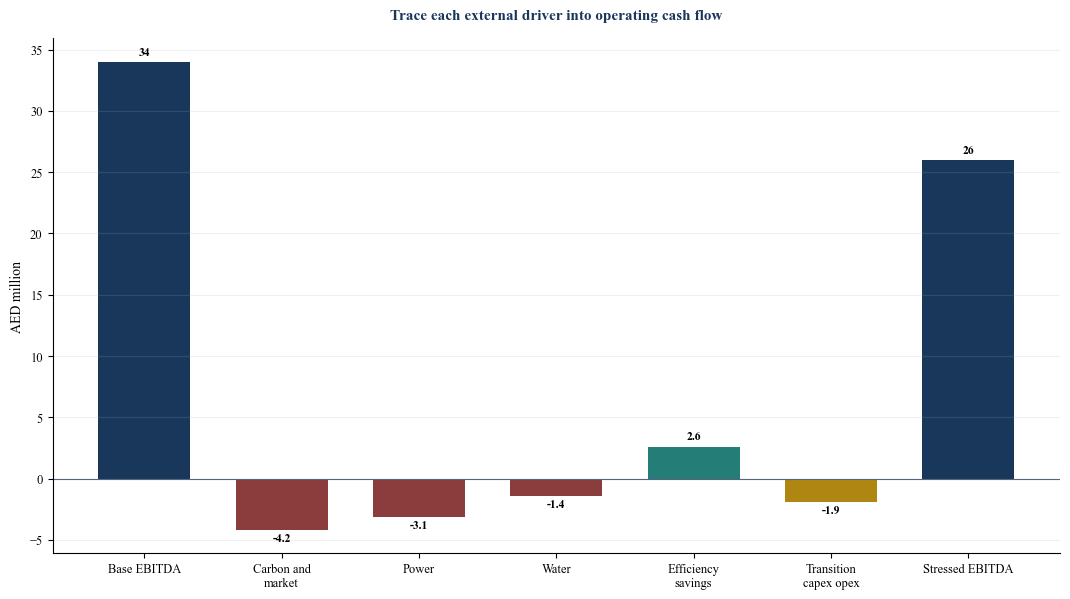
Every amount is an illustrative management assumption in AED millions.
8. Use scenarios as conditional pathways
A scenario describes a coherent pathway under stated assumptions. It is not a probability-weighted forecast unless the methodology explicitly supports probabilities.
The NGFS long-term scenarios combine transition and physical pathways under varying assumptions and highlight important limitations, including uncertainty and omitted effects.[6] A lender can use NGFS pathways as macro context and translate them into borrower-relevant variables. It should document the translation from global or regional variables to the borrower.
The scenario library can include an orderly pathway with earlier investment and gradual operating changes; a delayed pathway with later, sharper cost and capital effects; and a current-policy or higher-physical-risk pathway. The institution can add a short-horizon sensitivity for near-term tariffs, customer requirements, supply constraints or capital deadlines.
Carbon, power and water assumptions should remain internally coherent. An electrification strategy can lower direct emissions and raise electricity demand. Desalination and treatment can increase power use. Cooling choices can shift between electricity and water. Capital spending can reduce later operating exposure.
Every scenario should state source, date, horizon, units, variables, borrower mapping, management actions, limitations and decision use. The credit committee should see which assumptions drive the result and where data quality is weak.
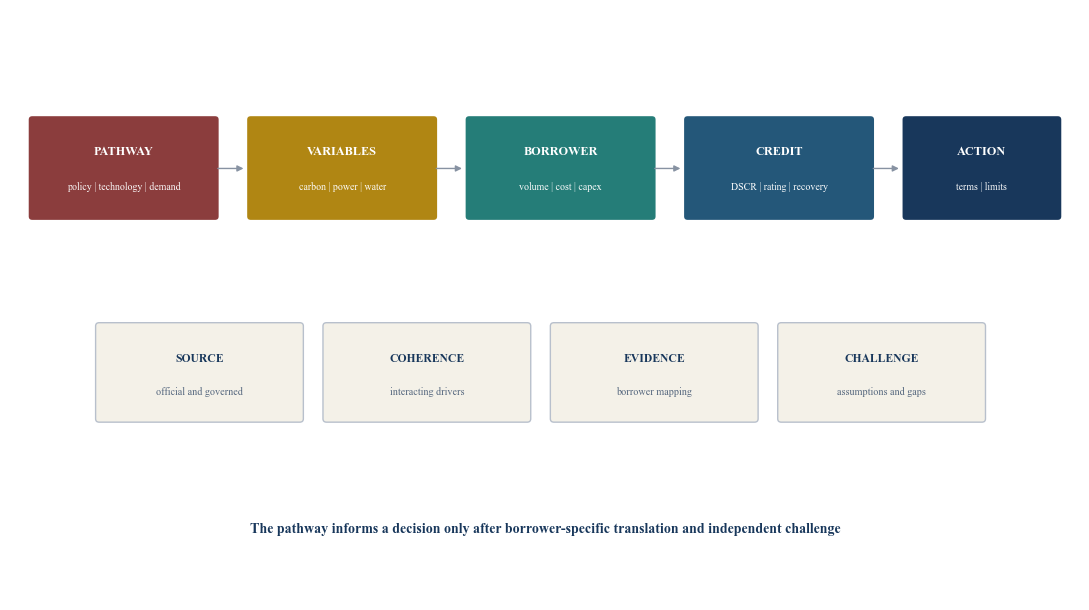
Author framework. Scenarios are conditional pathways and should preserve uncertainty.
9. Recalculate debt-service capacity and risk grade
The lender should run the transition bridge through its existing credit model. Revenue, EBITDA, working capital, tax, maintenance capital, transition capital, interest, amortisation and liquidity should reconcile to the normal underwriting case.
Debt-service coverage can deteriorate even when EBITDA remains positive. Front-loaded capital expenditure, higher inventory, customer losses or reduced refinancing capacity can create a cash deficit. A borrower with strong current coverage can face a maturity wall before the transition investment produces benefits.
Risk grading should reflect the institution's approved methodology. Transition results can affect the grade through expected cash flow, volatility, management capability, industry outlook, collateral, liquidity or support. The lender should avoid an ungoverned climate overlay that double counts risks already captured in the model.
Probability of default and loss given default require validation. A scenario-driven downgrade is not an observed default frequency. A collateral haircut is not an observed sale price. Where models are immature, the lender can use transparent sensitivities, qualitative factors, watch-list criteria and conservative structure while building evidence.
10. Connect the analysis to facility terms
A transition diagnostic creates value when it changes a credit decision. The response should be proportionate to materiality, evidence and controllability.
Pricing can reflect expected loss, capital, liquidity, tenor, complexity and monitoring cost under the institution's approved framework. A pricing premium cannot cure an unfinanceable business model or an unsupported repayment case.
Tenor and amortisation can align debt exposure with asset life, capital milestones and customer transitions. A revolving facility can include borrowing-base or availability controls where working capital is exposed. Project or equipment funding can release against verified expenditure and commissioning.
Covenants should have a clear credit mechanism. Examples include minimum debt-service coverage, leverage, liquidity, permitted capital expenditure, information delivery, resource-intensity reporting, customer-retention thresholds, project milestones, insurance and asset maintenance. A covenant should state definition, frequency, source, cure and consequence.
Table 3. Facility controls for material transition exposure
| Credit issue | Evidence | Potential control | Decision purpose |
|---|---|---|---|
| Margin sensitivity | reconciled volume, tariff, contract and cost bridge | pricing, cash sweep or minimum coverage | preserve debt-service capacity |
| Transition capital need | approved plan, contract, funding and milestones | capex reserve, equity first or staged draw | prevent underfunded execution |
| Customer access | contracts, tenders and transition requirements | reporting, retention trigger or concentration limit | detect revenue cliff early |
| Power continuity | connection, redundancy and outage record | contingency plan, insurance or reserve | protect production and cash flow |
| Water continuity | source, permit, quality, recycling and backup | operational milestone or liquidity buffer | manage interruption and capex risk |
| Asset obsolescence | engineering life, market and valuation | shorter tenor, amortisation or haircut | reduce terminal exposure |
| Data weakness | field inventory, quality and assurance | information undertaking and conservative assumption | make uncertainty visible and actionable |
| Project execution | contracts, supplier, schedule and commissioning | milestone testing and controlled disbursement | link funding to delivered mitigation |
| Scenario breach | approved scenario and trigger | review, limit, cure or stop-draw | prevent risk accumulation |
| Concentration | borrower, sector, technology and location aggregation | portfolio limit and senior escalation | contain common-driver exposure |
Terms depend on the borrower, facility documents, authority and applicable law.
11. Establish signal-to-action monitoring
Monitoring should focus on variables that can change the credit conclusion. A long indicator list can obscure the few signals that affect cash, collateral or control.
The borrower pack can include utility volumes and bills, production, emissions evidence, customer changes, capital-project progress, permits, asset performance, insurance, liquidity and covenant calculations. Frequency should match risk speed. Monthly power and water signals can matter more than an annual sustainability report.
Thresholds need verification and consequence. A power-intensity increase can arise from lower production rather than equipment deterioration. A missed capital milestone can reflect a supplier delay or a cancelled project. The credit team should establish cause before selecting an action.
Table 4. Transition-risk signal-to-action rules
| Signal | Verification | Credit question | Controlled action |
|---|---|---|---|
| Electricity cost per unit rises | reconcile volume, tariff, fuel, output and mix | structural cost or temporary variance? | refresh margin and coverage sensitivity |
| Water intake rises | inspect output, leakage, quality and process | does continuity or treatment risk increase? | engineering review, reserve or milestone |
| Carbon intensity misses plan | validate boundary, factors, output and project status | does market access or capex need change? | client plan, rating review or facility condition |
| Major customer adds requirement | obtain contract, tender and timing evidence | what revenue and capex are exposed? | downside case and concentration action |
| Transition project delayed | review supplier, permit, budget and critical path | can borrower meet cash and customer deadlines? | draw control, equity cure or revised structure |
| Grid capacity becomes constrained | confirm connection, allocation and expansion schedule | can production or growth continue? | cap expansion assumptions and reassess tenor |
| Permit or reporting scope changes | specialist confirmation and entity map | what cost, timing or disclosure follows? | policy update and borrower engagement |
| Asset valuation falls | independent technical and market evidence | is collateral protection impaired? | haircut, amortisation or additional security |
| Insurance narrows or reprices | broker and policy evidence | does residual operational or recovery risk rise? | coverage condition and loss review |
| Data submission fails | identify missing source and duration | can risk still be monitored reliably? | fallback evidence, escalation or draw stop |
Actions depend on verified facts, risk appetite, facility documents and authority.
12. Avoid double counting and false precision
Transition analysis combines uncertain pathways, incomplete data and evolving methods. Governance should make limitations visible.
Double counting can arise when energy cost appears in both the base forecast and the climate overlay. The same customer loss can appear in sector revenue and borrower concentration. Capital expenditure can appear in maintenance and transition plans. A collateral haircut can duplicate cash-flow deterioration already embedded in valuation.
False precision can arise when a global carbon pathway becomes a borrower price without a legal or commercial mechanism. A single emissions factor can conceal site and product differences. A probability can be assigned without data. A long-horizon result can be reported to two decimal places despite wide uncertainty.
The model inventory should identify owner, purpose, input, assumption, validation, limitation, override and version. Independent challenge should reproduce the bridge, test sensitivity, locate double counting and confirm that the output is used within its intended scope.
13. Analyse collateral and recovery under transition
Recovery can change before default. An asset can lose buyers, useful life, permits, insurance, spare parts or conversion economics. A more efficient or adaptable asset can retain value even when current borrower cash flow weakens.
The recovery analysis begins with the asset and its market. It identifies alternative users, relocation, conversion, dismantling, land value, environmental obligations, secured priority, enforcement time and sale cost. It separates going-concern and break-up outcomes.
Transition capital can increase or decrease value. A completed efficiency project with verified performance can reduce cost and support market access. An unfinished specialist plant can have limited alternative use and completion risk. The lender should avoid assuming that historical book value or replacement cost equals recovery.
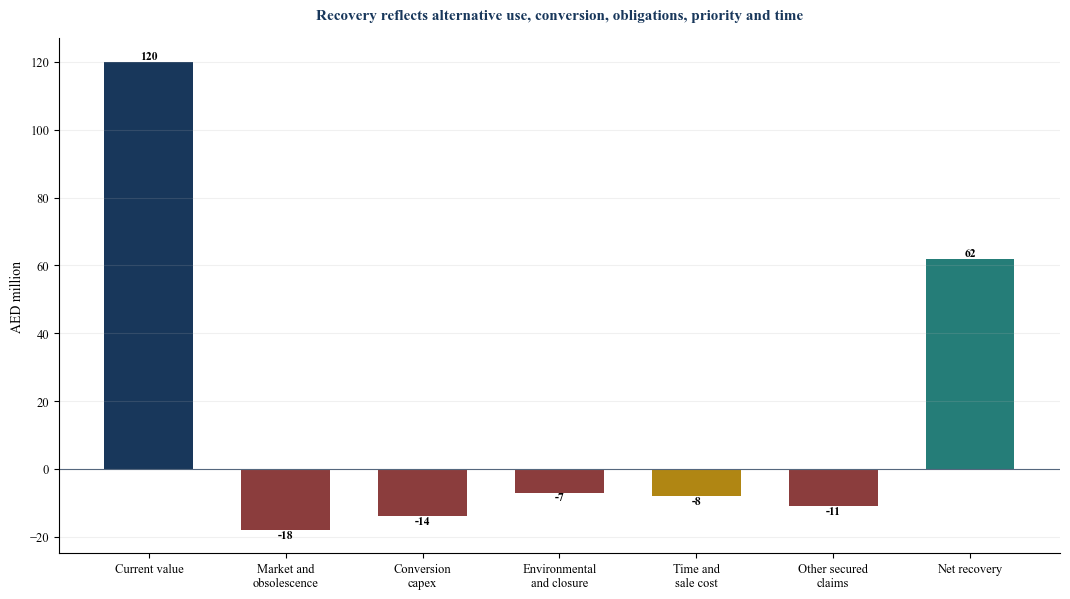
Every amount is an illustrative management assumption in AED millions.
14. Demonstrate the framework with a hypothetical borrower
Consider a hypothetical UAE industrial company seeking renewal of an AED 160 million term and revolving package. Every company, facility, amount, intensity, tariff, scenario, rating, recovery and outcome in this example is a management assumption created solely to demonstrate the framework. It does not describe a client, lender, transaction, market price or recommendation.
The assumed company generates AED 420 million of revenue and AED 34 million of EBITDA. It operates one main plant, serves regional and export customers, consumes 52 gigawatt-hours of electricity and 380,000 cubic metres of water each year, and reports 76,000 tCO2e across the boundary selected for the example.
The base case has AED 128 million of funded debt, AED 17 million of annual debt service and AED 15 million of cash. Management has proposed AED 24 million of efficiency, metering, process and water-reuse expenditure over three years. The example assumes that only AED 9 million has received final board approval and contracted support.
Under the illustrative downside, customer and carbon effects reduce EBITDA by AED 4.2 million, power by AED 3.1 million and water by AED 1.4 million. Efficiency adds AED 2.6 million and transition-project operating cost reduces EBITDA by AED 1.9 million. EBITDA becomes AED 26 million before the example's working-capital and capital-expenditure effects.
The scenario assumes debt-service coverage falls from 1.55 times to 1.10 times during peak investment. The lender does not assign a statistical default probability from this single scenario. It records the weaker headroom, unfinished capital plan, customer concentration and evidence gaps within its approved rating methodology.
The hypothetical committee renews the revolving tranche for twelve months and restructures the term component to align amortisation with verified project milestones. It requires equity funding before the final project draw, minimum liquidity, monthly utility and operating evidence, quarterly customer-transition reporting and independent technical confirmation of the water-reuse project. No executed facility or outcome is claimed.
Table 5. Hypothetical borrower transition-risk decision
| Measure | Assumed base | Illustrative downside | Credit interpretation |
|---|---|---|---|
| Revenue | AED 420m | AED 397m | customer and product exposure drives decline |
| EBITDA | AED 34m | AED 26m | carbon, power and water effects partly offset by efficiency |
| Funded debt | AED 128m | AED 132m peak | transition capex creates temporary funding need |
| Annual debt service | AED 17m | AED 18.5m | interest and amortisation reflect assumed structure |
| Debt-service coverage | 1.55x | 1.10x at trough | reduced covenant and liquidity headroom |
| Cash | AED 15m | AED 8m trough | execution timing creates liquidity pressure |
| Transition capital plan | AED 24m | AED 9m approved and supported | funding and execution gap remains |
| Electricity use | 52 GWh | 55 GWh before efficiency | production mix and delay affect exposure |
| Water intake | 380,000 m3 | 405,000 m3 before reuse | continuity and treatment need increase |
| Carbon boundary | 76,000 tCO2e | 72,000 tCO2e after actions | calculation remains scenario-specific |
| Collateral current value | AED 120m | AED 62m net recovery illustration | alternative use and conversion drive haircut |
| Outcome | renewal considered | controlled twelve-month structure | conditions and monitoring remain essential |
Every amount, ratio, assumption and outcome is illustrative management input.
15. Aggregate common drivers across the portfolio
Borrower analysis should roll into portfolio views without losing its evidence trail. The lender can aggregate by sector, location, activity, customer market, technology, utility, water source, asset type, maturity, collateral and transition pathway.
Concentrations can cross sectors. Several borrowers can depend on one grid connection, water system, logistics corridor, export market, equipment supplier or customer standard. A transition risk can correlate cash flow, collateral and refinancing across multiple facilities.
Portfolio reporting should show gross exposure, residual exposure after verified mitigants, data coverage, scenario sensitivity, rating migration, covenant headroom, maturity profile and management action. It should separate exposure amount from risk intensity.
Risk appetite can use limits, escalation thresholds and action plans. A limit should define numerator, denominator, perimeter, frequency, owner and breach response. Data gaps should be visible rather than treated as zero risk.
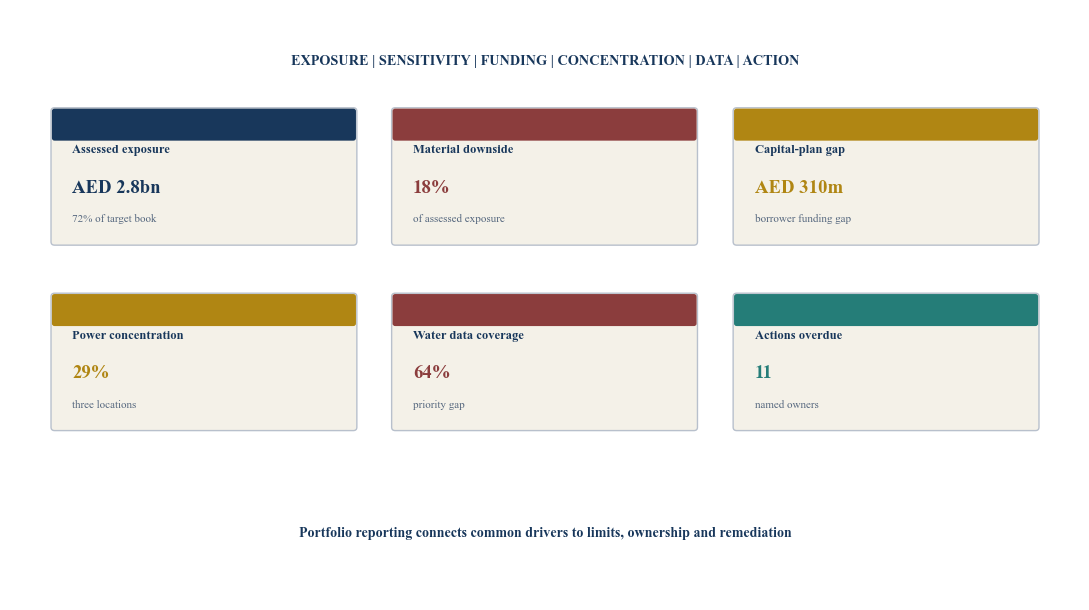
Every displayed value is an illustrative management assumption.
16. Govern model, judgement and client engagement
The board sets risk appetite and oversees the framework. Senior management assigns responsibilities, resources and escalation. Business, credit, risk, finance, sustainability, data, legal, compliance, valuation and internal audit have distinct roles.
The first line gathers borrower evidence, explains the operating model and proposes terms. Credit and risk challenge materiality, scenarios, assumptions, rating, structure and portfolio effects. Specialist teams validate emissions, engineering, legal or data questions within their remit. Internal audit assesses governance and control independently.
Client engagement should be specific. A generic climate questionnaire can create volume without decision evidence. The lender should ask for the fields, documents and management actions that connect to the identified credit channel.
Override governance is essential. A committee can accept a data gap or transition-plan delay within authority. The record should state the reason, compensating control, expiry, owner and follow-up. Silent model changes or informal exceptions undermine comparability.
17. Implement the framework in 100 days
Days one to fifteen establish sponsor, perimeter, policy mapping, portfolio scope, risk appetite and accountable owners. The team identifies the facilities and sectors for the pilot and confirms current regulatory requirements.
Days sixteen to thirty define the evidence dictionary, borrower operating-model template, carbon, electricity and water units, data-quality rules and source lineage. The team selects a small set of borrowers with material and diverse exposures.
Days thirty-one to fifty build the base-case reconciliation, cash-flow bridge, scenario library, collateral method and signal-to-action rules. Business and credit teams test whether every metric changes a decision.
Days fifty-one to seventy run borrower files in shadow mode. Analysts reproduce results, document gaps and compare outcomes with the existing rating process. Independent challenge tests double counting, sensitivity and limitations.
Days seventy-one to eighty-five aggregate portfolio drivers, define limits and prepare board reporting. Days eighty-six to one hundred approve policy, model use, controls, training, client engagement, exceptions and the review calendar before controlled release.
Table 6. One-hundred-day transition-risk credit programme
| Days | Workstream | Controlled deliverable | Gate |
|---|---|---|---|
| 1 to 10 | mandate | sponsor, perimeter, objectives, risk appetite and owners | governing body confirms scope and authority |
| 11 to 20 | regulation and policy | current obligation map and credit-policy change list | legal, compliance and risk accept perimeter |
| 21 to 30 | data | carbon, power and water dictionary with source lineage | every field has unit, owner and quality status |
| 31 to 40 | borrower diagnostic | operating model, dependency and evidence template | credit committee confirms decision relevance |
| 41 to 50 | scenarios | governed pathways, variables and translation rules | assumptions and limitations documented |
| 51 to 60 | credit model | cash-flow, rating, collateral and covenant bridge | double counting and reconciliation tested |
| 61 to 70 | shadow files | selected borrower reviews without term changes | independent reviewer reproduces results |
| 71 to 80 | portfolio | common-driver aggregation, data gaps and limits | risk appetite metrics receive owners |
| 81 to 90 | operating model | client engagement, monitoring, overrides and escalation | first and second lines accept responsibilities |
| 91 to 100 | controlled release | policy, training, reporting and review calendar | senior approval with material conditions closed |
Timing depends on institution, portfolio, data, models, governance and regulatory perimeter.
18. Limitations and conclusion
Transition-risk analysis is an evolving field with data, methodology and horizon limitations. The CBUAE regulation establishes current requirements for banks and insurers within scope and should be read with the wider UAE regulatory framework.[1] Its application to a specific institution, product or exposure requires current professional analysis.
The NGFS scenarios are reference pathways with stated assumptions and limitations.[6] They do not forecast a borrower's tariff, emissions cost, water availability, default or recovery. IFRS S2 is a disclosure standard and does not prescribe a lender's credit decision.[7] The UAE NDC and carbon-credit register resolution provide policy and regulatory context within their respective scopes.[8][9]
Current utility tariffs are location, category and date specific. The DEWA July 2026 values cited in this paper illustrate official tariff mechanics and should not be applied to another borrower, supplier, date or contract without verification.[11] Water-security objectives describe national policy and do not determine a borrower's resource entitlement or price.[10]
Every borrower, amount, intensity, price, project, scenario, ratio, rating, recovery and outcome in the worked example is an illustrative management assumption. No observed market default rate, client information, executed transaction or recommendation is claimed.
A disciplined transition-risk credit process starts with the borrower operating model and source-controlled evidence. It separates carbon, power and water. It reconciles physical exposure to current economics. It applies coherent conditional scenarios. It traces the result through cash flow, collateral and refinancing. It connects the result to rating, pricing, tenor, amortisation, covenants, monitoring and limits.
That approach turns a broad climate-risk concept into a conventional credit decision with explicit evidence, ownership, uncertainty and action.
References
- [1] Central Bank of the UAE, Climate-related Financial Risk Management Regulation, C 8/2025, issued 14 October 2025, status in force when accessed 13 August 2026. https://rulebook.centralbank.ae/en/rulebook/climate-related-financial-risk-management-regulation
- [2] UAE Sustainable Finance Working Group, Principles for the Effective Management of Climate-related Financial Risks, status in force in the CBUAE Rulebook when accessed 13 August 2026. https://rulebook.centralbank.ae/en/entiresection/5114
- [3] Central Bank of the UAE, Annual Report 2024, section on climate-related financial-risk stress testing. https://www.centralbank.ae/media/ymgnwy3x/2024-en-annualreport.pdf
- [4] Basel Committee on Banking Supervision, Principles for the Effective Management and Supervision of Climate-related Financial Risks, June 2022; consolidated framework chapter updated 26 February 2026. https://www.bis.org/bcbs/publ/d532.htm
- [5] Basel Committee on Banking Supervision, Principles for the Management of Credit Risk, 30 April 2025. https://www.bis.org/bcbs/publ/d595.htm
- [6] Network for Greening the Financial System, Phase V long-term climate macro-financial scenarios and published limitations, November 2024. https://www.ngfs.net/en/press-release/ngfs-publishes-latest-long-term-climate-macro-financial-scenarios-climate-risks-assessment
- [7] IFRS Foundation, IFRS S2 Climate-related Disclosures and implementation resources, current materials accessed 13 August 2026. https://www.ifrs.org/issued-standards/ifrs-sustainability-standards-navigator/ifrs-s2-climate-related-disclosures/
- [8] United Arab Emirates, Third Nationally Determined Contribution, submitted 6 November 2024. https://unfccc.int/node/642248
- [9] United Arab Emirates, Cabinet Resolution No. 67 of 2024 Concerning the National Register for Carbon Credits, official legislation portal. https://uaelegislation.gov.ae/en/legislations/2521
- [10] United Arab Emirates Ministry of Energy and Infrastructure, Water Security is a National Priority for the UAE, 23 March 2025. https://moei.gov.ae/en/media-center/news/23/3/2025/water-security-is-a-national-priority-for-the-uae
- [11] Dubai Electricity and Water Authority, Slab Tariff and Fuel Surcharge, July 2026 values, accessed 13 August 2026. https://www.dewa.gov.ae/en/consumer/billing/slab-tariff
About the Author
Chennakeshav Adya is an independent researcher and Managing Partner of Matchpoint Partners. His research focuses on investment strategy, capital formation, transaction execution, governance and operating-model design across the Gulf and international markets.
