

Introduction
Trapped-ion quantum computing combines atomic ions, electromagnetic confinement, ultra-high vacuum, laser or radio-frequency control, imaging, calibration, compilers, classical processors and error correction. The hardware can achieve strong fidelity and broad connectivity. Scale introduces transport, optical input-output, calibration, cooling, parallel-operation and manufacturing challenges. The commercial threshold depends on useful workload performance, repeatability, service reliability and total cost.
The practical decision is how much capital to commit today for evidence that may mature through several dependent milestones. The investor must distinguish a laboratory result from a repeatable device, a repeatable device from an integrated system, an integrated system from accepted customer use and accepted use from durable cash generation. Each transition has a different probability, timing, capital need and dilution effect.
This paper treats technical progress, commercial evidence and financing capacity as linked value drivers. It does not predict which firm will achieve useful quantum advantage or when. It provides a diligence and valuation method for boards, investors, lenders, corporate-development teams and technical advisers assessing trapped-ion quantum firms.
1 Define the valuation decision
The board should state the decision the valuation will support. A primary financing, secondary sale, strategic investment, acquisition, employee-equity grant and impairment test require different standards and control premiums. The analysis should identify the security, ownership rights, liquidation preferences, dilution, future funding obligations and decision horizon.
The valuation should identify the capability available today, the milestones required for the next value state and the counterfactual if progress is delayed. Management should separate achieved evidence from plans, signed customer value from pipeline, unrestricted cash from committed expenditure and core intellectual property from third-party rights. The model should show the capital required before the next independent financing decision.
Market-growth projections provide limited support for firm value. The valuation should rest on measurable technical progress, addressable workloads, customer acceptance, unit economics, capital intensity and probability of surviving to the next gate. The investment case should specify the evidence that would reduce or increase value at each milestone.
2 Separate physical scale from useful capability
Physical-ion count describes the number of implemented quantum elements under a defined architecture. Useful capability depends on one- and two-qubit error, state preparation and measurement, connectivity, transport error, motional heating, crosstalk, calibration stability, executable circuit depth, throughput, compiler performance and workload evidence. A larger register can increase engineering learning while providing limited customer value when transport, serial execution or operating burden prevents useful work.
The valuation should use a metric hierarchy. Device metrics support component quality. System metrics support operability. Logical metrics support an error-correction path. Workload metrics support useful computation. Customer metrics support willingness to pay. Financial metrics support survival and scaling. Evidence at a lower level cannot substitute for the next level, although it can improve the probability assigned to future states.
These layers interact. Better trap fabrication and vacuum packaging can improve stability. Electronic or integrated photonic control can reduce bulky optical input-output requirements. More interaction zones and reliable ion transport can increase parallelism without changing headline qubit count. Error correction can consume physical ions and classical decoding capacity to create more reliable logical qubits. The model should identify where each engineering gain converts into commercial capacity.
3 Value trapped-ion systems through their operating chain
Trapped-ion systems confine charged atoms with electromagnetic fields and manipulate internal states through optical or electronic control. Their economic system includes trap chips, vacuum packages, ion sources, lasers or radio-frequency electronics, imaging, beam delivery, transport waveforms, calibration, compilers, schedulers, decoders and classical compute. Some architectures keep ions in one chain. Quantum charge-coupled device architectures move ions between memory, interaction and measurement zones. Modular approaches can add photonic interconnects between units.
The valuation should map every critical layer to ownership, capacity, replacement time and technical performance. Proprietary trap-chip processes can shorten iteration cycles and protect know-how while increasing fixed cost. Commercial lasers and vacuum components can accelerate deployment while concentrating supplier risk. Electronic qubit control and integrated photonics may reduce the number of free-space optical channels; the investor should verify achieved performance, manufacturing yield and integration cost. A full-stack claim should be decomposed into components that are owned, licensed, contracted or still under development.
Public roadmaps and demonstrations describe direction; they do not establish reproducibility, scale, cost or commercial timing. The investor should connect each claimed advantage to the company's current product, test data, manufacturing records, customer use and funded plan. The comparison should use workload and evidence gates rather than a league table of physical qubits.
4 Build a capability map rather than a qubit league table
A qubit count can describe system size without describing useful performance. The buyer should map physical qubits, logical qubits, gate fidelity, connectivity, circuit depth, error-detection and correction, uptime, calibration burden, job throughput, latency, software compatibility and workload results. Each measure should state test conditions, date, version and independent verification.
The map should distinguish scientific demonstration, engineering prototype, available product and contracted service. A result obtained on a selected device under laboratory conditions may be strategically important. Its transaction value depends on whether the target can reproduce it across devices, maintain it over time and expose it through an operable service.
Peer comparison within trapped-ion systems still requires caution because device topology, gate sets, control methods, compiler choices and test conditions differ. The investor should use workload-level tests and resource estimates where possible. A conclusion should explain the trade-off rather than compress unlike systems into a single score.
5 Test the path to fault tolerance
Fault tolerance is a programme of architecture, codes, logical operations, decoding, transport, control and system engineering. The target should show how physical-ion performance converts into logical capability, which error model applies, what overhead is expected and which milestones have been demonstrated. The buyer should examine sensitivity to gate and measurement error, ion loss, motional heating, transport error, decoder latency, interaction-zone capacity and the duration of an error-correction cycle.
Company roadmaps can support diligence when reconciled with published results, internal test data and engineering plans. Quantinuum has published physical and logical performance data for its QCCD systems. IonQ has described its roadmap, all-to-all connectivity, electronic-control acquisition and fault-tolerant architecture. DARPA's Quantum Benchmarking Initiative evaluates whether proposed architectures can reach utility-scale operation whose computational value exceeds cost. The sources address different evidence categories and require separate treatment.
The valuation model should value achieved evidence separately from future milestones. A large portion of roadmap value may depend on a fault-tolerance claim that remains unproven at the required scale. Staged financing or contingent consideration can align capital with independently defined demonstrations.
6 Diligence the full hardware stack
The target's moat may sit outside the ion itself. Trap geometry, vacuum packaging, laser systems, electronic control, photonics, imaging, ion transport, calibration software, firmware, compilers, decoders, test methods and manufacturing recipes can determine performance and cost. The diligence team should identify each critical component, its owner, supplier, replacement time and qualification status.
The buyer should request a system bill of materials and dependency graph. It should identify single-source items, export-controlled components, custom tooling, university licences, foundry agreements and long-lead equipment. Supply agreements should be reviewed for change-of-control rights, volume commitments, price resets, exclusivity and access to failure analysis.
Capital expenditure should be linked to roadmap milestones. A target may need a trap fabrication line, cleanroom, vacuum-packaging capability, laser integration area, optical test capacity, cryogenic pumping where used or a new system assembly site before it can deliver the forecast system. The purchase price and integration budget should include that requirement rather than treating it as ordinary post-close growth investment.
7 Verify reproducibility and manufacturing evidence
The buyer should distinguish one high-performing device from a repeatable process. Evidence can include yield, variation, calibration time, failure modes, component life, rework, acceptance testing and performance distribution across systems. The diligence sample should cover multiple devices and production periods where available.
Manufacturing plans should identify which steps are internal, outsourced or shared with research institutions. Intellectual property may protect device design while manufacturing know-how remains concentrated in a small team. The buyer should assess whether process records, tooling, supplier relationships and quality systems can survive staff turnover or a site disruption.
Reproducibility can be made a closing or payment condition. An independent team can build or qualify a device using controlled documentation. The test should protect sensitive technology while demonstrating that the acquired capability is organisational rather than personal.
8 Diligence intellectual property by dependency
Patent counts do not show freedom to operate, enforceability or operational importance. The buyer should map patents, applications, trade secrets, copyrights, licences and know-how to the product architecture and roadmap. It should identify inventors, assignees, prosecution status, geographic scope, government support, university rights and encumbrances.
The map should show which claims protect the current system and which address future architectures. It should also identify design-around risk and blocking rights held by others. Where the moat depends on trade secrets, the buyer should examine access controls, employee agreements, laboratory records and the extent to which knowledge is documented.
Government-funded and university-originated work may carry licence, reporting, march-in or data-rights considerations depending on the instrument. Qualified counsel should confirm the applicable rights. The transaction should not value an asset as exclusive until ownership and third-party rights are clear.
9 Assess talent as a technical system
Quantum hardware companies can depend on a small number of physicists, device engineers, control specialists and application leaders. The buyer should identify who owns each critical decision, relationship and undocumented method. An organisation chart should be supplemented by a capability and succession map.
Retention design should reflect the work required after closing. Founders may be essential for architecture, but senior engineers, technicians, programme managers and customer scientists can carry equally important knowledge. Retention instruments should use service, transfer and milestone conditions that are achievable and consistent with employment law.
The buyer should evaluate cultural and scientific governance. A large corporate process can improve quality and scale while slowing experimentation. Integration should preserve protected research paths with accountable milestones, peer review and access to shared engineering resources.
10 Define customer access precisely
Customer access can mean a signed contract, cloud listing, reservation, funded research award, pilot, application partnership, reseller arrangement or informal relationship. Each category has different economics and transferability. The buyer should classify the portfolio and avoid treating all named counterparties as revenue customers.
For each material relationship, diligence should cover legal counterparty, product, term, committed and optional value, cancellation, acceptance, pricing, renewal, data rights, intellectual property, exclusivity, security, change of control and required personnel. Usage data should show jobs, reservations, support demand and movement from experimentation toward recurring workloads.
Customer access is valuable when it shortens the buyer's path to paid, repeatable use. A relationship that depends on the target's independent status, founder or modality may weaken after acquisition. The buyer should validate transfer through contract language and customer conversations conducted under an approved process.
11 Separate cloud distribution from customer ownership
Cloud platforms broaden access and reduce the need for customers to procure each provider directly. Amazon Braket publishes task, shot and reservation economics for supported quantum systems. Azure Quantum documents access and development workflows across multiple hardware providers. These channels can create discoverability, workflow integration and billing infrastructure.
A listing does not by itself create a defensible customer asset. The platform may control the billing relationship, usage data, placement and commercial terms. Customers can compare or switch providers. The target's value depends on contractual rights, differentiated performance, support relationships and the ability to convert platform usage into durable demand.
The buyer should map who owns customer identity, workload metadata, application code, results and support records. It should test whether the acquisition creates a conflict with a platform or other hardware participants. Channel continuity and equal-treatment provisions can matter to valuation.
12 Classify customer evidence by economic quality
Quantum customer evidence can include an announced collaboration, funded research award, government development contract, cloud-access agreement, reservation, system sale, acceptance milestone, recurring usage or renewal. Each category has different gross margin, cash timing, technical obligation and proof of willingness to pay. The valuation should classify each relationship before applying a revenue multiple or customer premium.
The contract schedule should state the legal counterparty, product, committed value, options, deliverables, acceptance tests, cancellation, pricing, collection, intellectual-property rights, data use, personnel dependency and change-of-control terms. A funded programme can validate technical relevance without establishing repeatable commercial demand. The model should distinguish development revenue from product, service and access revenue.
Customer value should follow executed rights, acceptance and observed use. Pipeline should remain outside contracted backlog until the customer is legally committed. Public-sector and research customers can provide credible technical validation; their budgets, procurement cycles, termination rights and concentration should be reflected in cash-flow scenarios.
13 Map public-funding, data and intellectual-property rights
Publicly funded work can create value and restrictions simultaneously. Technical data, software, reports, interfaces, patents and test results may be subject to grant terms, consortium agreements, procurement clauses, university rights or negotiated licences. The target may own foreground intellectual property while another participant or authority holds access, use or dissemination rights.
The diligence team should trace each material capability to its funding source and executed instrument. It should examine background rights, foreground ownership, access rights, publication obligations, exploitation commitments, location conditions, reporting, repositories, subcontractor flow-downs and change-of-control provisions. Inconsistent records can weaken the assumed exclusivity or transferability of an asset.
The buyer should identify rights needed to reproduce, improve and commercialise the technology. A public customer's or consortium partner's rights may facilitate alternative suppliers or constrain exclusivity. The resulting asset may remain valuable, with a different durability, pricing and integration path from wholly proprietary technology.
14 Analyse revenue quality and concentration
Quantum revenue can include hardware sales, cloud usage, reservations, consulting, development contracts, grants and milestone awards. The buyer should separate each stream by margin, cash conversion, recurrence, cancellation and technical dependency. Reported growth can be driven by a small number of awards or acquisitions.
IonQ's 2025 annual filing reports USD 130.0 million of revenue, including USD 69.9 million from quantum hardware and USD 60.1 million from platform, consulting and support services. It also reports USD 283.2 million of cash used in operating activities. Quantinuum's May 2026 registration statement reports USD 5.2 million of revenue and a USD 136.6 million net loss for the first quarter of 2026, compared with USD 19.1 million and USD 30.5 million respectively in the prior-year period. These disclosures show why revenue requires contract, margin, timing and cash-use analysis before it supports value.
The buyer should build customer cohorts and contract waterfalls. It should identify how much revenue depends on one agency, platform, research partner or application team. Concentration can be acceptable when the relationship creates technical learning and renewal evidence; it should still be reflected in scenario analysis and liquidity planning.
15 Test application evidence and willingness to pay
The transaction thesis should name the workloads that the combined system is expected to serve. Chemistry, materials, optimisation, machine learning and security are broad categories. The buyer should identify the problem instance, classical baseline, quantum resource requirement, accuracy, total workflow cost and decision value.
Scientific advantage, computational advantage and commercial value are separate tests. A benchmark can show performance beyond a classical method under defined conditions without establishing a paid workflow. An application pilot can show customer interest without establishing scalability or renewal.
Customer diligence should ask what decision changed, what classical method was displaced or complemented, which budget funded the work and what evidence would support expansion. Willingness to pay should be based on contracts and observed behaviour where available. Future application value should remain a scenario until supported.
16 Apply regulatory and accounting boundaries to value
Quantum firms can face export controls, foreign-investment screening, government-contract restrictions, public-funding conditions, cybersecurity, sanctions and research-security requirements. The perimeter depends on technology, ownership, customers, locations, end use and information access. Qualified counsel should confirm the current requirements for a specific investment or transaction.
Technology classification affects diligence access, customer eligibility, engineering collaboration, cloud environments and future sales. Accounting classification also matters. Development expenditure, acquired intellectual property, warrants, earn-outs, stock-based compensation and government awards can alter reported results without resolving technical value. The valuation bridge should reconcile enterprise value, net cash, derivative liabilities, preferences and fully diluted ownership.
Restrictions and mitigations should be converted into cost, delay, market-access and governance effects before the board approves value. The model should separate accounting presentation from cash use and should identify obligations that rank ahead of common equity.
17 Use market comparables as a reasonableness check
Public quantum companies provide observable market capitalisations, financial statements and disclosures. They differ materially by modality, stage, capital structure, government exposure, cash balance, revenue mix and technical evidence. A headline enterprise-value-to-revenue multiple can magnify small revenue denominators and hide the capital required to reach future products.
The comparable set should normalise unrestricted cash, debt, derivative and earn-out liabilities, preferred rights, stock-based compensation, dilution, acquisitions, revenue recognition and continuing research expenditure. Technical comparison should use evidenced fidelity, logical progress, system availability, manufacturing and customer acceptance. Management roadmaps should remain separate from achieved results.
Comparable companies can support a range or detect an inconsistent conclusion. They should not determine value without scenario and financing analysis. The investor should record the observation date, security prices, shares, options, warrants, cash and liabilities used so the calculation can be reproduced.
18 Design technical diligence around falsifiable tests
Technical diligence should begin with management's most consequential claims. Each claim should have a test, dataset, version, owner, acceptance threshold and failure implication. Examples include a reproducible fidelity level, logical-error trend, calibration time, job throughput, manufacturing yield or workload result.
The investor should use independent experts who can evaluate the architecture without disclosing restricted information improperly. Clean-room or staged access may be necessary. The diligence report should state what was observed, what was reproduced, what was reviewed only as documentation and what could not be verified.
Claims that cannot be tested before signing can move into transaction mechanics. Holdbacks, milestones, access rights and termination provisions can allocate the uncertainty. A generic warranty that all technology works as intended provides limited protection against roadmap risk.
19 Construct an evidence-adjusted valuation
Valuation should separate achieved assets from roadmap options. Achieved value can include functioning systems, patents, software, contracts, qualified facilities and reproducible know-how. Option value can include future fault-tolerance milestones, manufacturing scale, application breakthroughs and new markets. The discount rate or probability should reflect technical and commercial dependencies.
The model can use cost, income and market evidence selectively. Replacement cost may support specialised facilities and documented development, although it does not measure the probability of success. Income analysis can support contracts and customer relationships when cash flows are identifiable. Market transactions require careful normalisation because consideration, stage, architecture and strategic context differ.
The board should see a value bridge by capability. A single enterprise value can conceal whether management is paying for technology, talent, channel, contracts, strategic defence or market signalling. Each component should have evidence and a post-close owner.
20 Use milestone-based financing and valuation
Quantum roadmaps create a strong case for milestone-based financing when gates are objective, material and controllable. Technical milestones can include independently reproduced fidelity, an improving logical-error trend, manufacturing yield, continuous operation, system delivery or customer acceptance. Commercial milestones can include funded awards, product revenue, renewals, usage or gross-margin thresholds.
The financing plan should define the test environment, responsible evaluator, permitted changes, data access, timing and capital released at each gate. A milestone should be technically meaningful and should not be created solely to support the next financing. Investors should see the resources and dependencies required to achieve it.
Capital can combine ordinary equity, preferred equity, strategic funding, government awards, customer prepayments and asset finance. The model should distinguish operating cash from restricted programme funding and should incorporate dilution, preferences and transaction costs. Qualified advisers should confirm accounting, legal and tax treatment.
21 Protect the roadmap through capital-allocation governance
The company needs one accountable roadmap connecting technical evidence to capital. Research teams may retain protected experimentation, while shared cash, facilities, customers and engineering dependencies require explicit governance. The plan should identify which milestones unlock spending, which capabilities remain exploratory and which decisions require board review.
A technical-capital council can reconcile hardware, control, software, error correction, manufacturing and application priorities. It should own interfaces, resource conflicts, milestone evidence and capital gates. Commercial teams should not promise capabilities outside the approved roadmap.
Governance should preserve useful scientific independence while preventing open-ended capital commitments. Early closure of laboratories, toolchains or supplier relationships can destroy evidence and slow development. Funding sequence should follow technical dependencies and liquidity thresholds.
22 Convert customer evidence into valuation support
The investor should reconcile customer claims to executed contracts, invoices, acceptance records, usage, collections and renewals. Government and research counterparties may fund valuable development while retaining termination, security or data rights. Commercial partners may supply technical learning without committing production revenue.
The customer schedule should identify legal counterparty, workload, contract status, technical dependency, next decision and risk. It should separate committed backlog from options and pipeline. Pricing and renewal assumptions should follow observed acceptance and capability rather than the existence of a logo or memorandum.
Customer evidence can raise scenario probability, shorten commercial timing or support a separate contract value. The metric should use collected or contractually committed value, defined margin and a clear attribution period. Pilots and non-binding collaborations should not receive the same treatment as recurring paid workloads.
23 Govern security and controlled information
Quantum companies can hold controlled technology, government information, customer data, source code, fabrication records and sensitive research. The integration perimeter should classify repositories, identities, laboratories, devices and collaboration tools before broad access is granted.
The buyer should preserve least privilege, export-control restrictions, contractual access limits and incident evidence. Employees and contractors should be mapped by nationality, location, role and authorisation where legally relevant. Sensitive diligence material should not migrate automatically into ordinary integration systems.
The Day One plan should define security authority, incident escalation, key custody, logging and continuity. A transaction can create risk if two strong control environments are connected without a common design. Security integration should follow a documented architecture and regulatory advice.
24 Build the capital and liquidity plan
Current enterprise value is one part of the capital requirement. The company may need to fund facilities, equipment, foundry commitments, component inventory, research programmes, retention, customer support and operating losses. The model should show liquidity and dilution under technical delay and customer-conversion scenarios.
Equity can absorb roadmap risk. Debt may suit predictable assets or contracted cash flows when covenants recognise development volatility. Government awards and customer prepayments can support milestones, subject to restrictions and performance obligations. The financing mix should not force a premature technical claim to satisfy a near-term covenant.
The board should approve a runway reserve for technical and commercial remediation. It should identify conditions that trigger capital reallocation, partnership or programme closure. Strategic importance does not remove the need for portfolio discipline.
25 Define the first 100 days of valuation diligence
The first 100 days should establish evidence, ownership, customer quality and roadmap accountability. Day One priorities include the data request, security protocol, technical test plan, cash definition, fully diluted cap table and decision rights. The diligence team should preserve system and financial baselines before relying on management adjustments.
By Day 30, the team should reconcile the capability map, contracts, intellectual property, controlled information and capital plan. By Day 60, it should complete independent technical tests, customer sampling and scenario design. By Day 100, it should deliver a reproducible valuation range, milestone baseline, financing plan and board decision record.
The plan should include explicit limitations. A restricted data room, incomplete customer access or untested roadmap should appear as a valuation limitation rather than an assumed success. Delay can be a controlled decision when a near-term test can resolve uncertainty.
26 Monitor value through an evidence dashboard
The board dashboard should connect technical, commercial and financial evidence. Measures can include independently verified performance, system availability, job throughput, manufacturing yield, roadmap spend, critical retention, contract value, customer conversion, gross margin, government eligibility and integration risk.
Each measure should state baseline, target, owner, source and decision threshold. Metrics should remain comparable across periods and system versions. A technical improvement that increases cost or reduces availability should be visible as a trade-off.
The dashboard should separate observed results from management forecasts. It should also show scenario probability, financing need, dilution and liquidity exposure. The purpose is to support capital allocation and intervention rather than to present a favourable narrative.
27 Prepare downside and exit paths
The investor should plan for technical delay, architecture reprioritisation, customer loss, regulatory restrictions and key-person departure. The downside plan can include licence structures, asset sales, team carve-outs, partnerships, research discontinuation and preservation of transferable intellectual property.
Investment documents should secure reporting, inspection and governance rights proportionate to the risk. Financing tranches should adjust when milestones fail for defined reasons. Retention packages should avoid trapping capital in a programme that the board has rationally discontinued.
Exit value depends on clean ownership and separability. The asset map should record which rights, systems, facilities and contracts belong to each programme. Excessive technical entanglement can make a future sale, licence or partnership difficult.
28 Set the board decision agenda
The board should ask whether the valuation decision is defined, whether technical capability has been reproduced, whether logical progress is supported by data, whether the control stack and rights are owned, whether customers have accepted and paid, whether regulatory paths are viable and whether the roadmap can be funded. It should understand the portion of value attributable to achieved evidence, contracts, infrastructure, team and future options.
Approval conditions should include technical tests, intellectual-property confirmation, material contract consents, regulatory analysis, retention, security controls and a funded integration plan. The decision record should identify unresolved matters and the mechanism that prices or controls each one.
The final question is accountability. One executive should own the integrated technical roadmap, named leaders should own hardware, control, error correction and customer conversion, and one board process should reconcile capital with evidence. The governance system should state which experiments remain protected, which resources are shared and which evidence triggers concentration, additional funding or withdrawal.
Conclusion
A trapped-ion quantum company should be valued as an evidence-producing system. Physical-ion count is one input. Gate and measurement fidelity, ion transport, parallel interaction zones, calibration stability, logical performance, customer acceptance, intellectual-property ownership and funded runway determine whether the system can become a reliable product and an investable business.
The valuation should separate achieved evidence from future options. Achieved capability can support conventional asset, income and market analysis where evidence permits. Roadmap value requires explicit milestones, conditional probabilities, timing, follow-on capital and dilution. Customer evidence should distinguish paid acceptance from experimentation, grants and unsigned interest. Infrastructure should be valued through replacement cost, bottleneck value and utilisation rather than prestige.
Boards can use this framework to decide whether to invest, acquire, partner, finance or wait. The core discipline is traceability. Every material valuation component should point to an observed result, a contractual right, a controlled asset or a clearly identified management assumption. That discipline makes technical disagreement visible, concentrates diligence on value-moving questions and preserves the ability to revise the valuation as evidence changes.
Appendix A Trapped Ion metric hierarchy
The metric hierarchy starts with physical evidence: one- and two-qubit gate error, state preparation and measurement, ion loss, coherence, transport error, motional heating, crosstalk and stability across zones. These measures require test conditions, distributions and repeated results. A selected pair, zone or run cannot stand in for system performance.
The second level is system performance. It covers executable circuit depth, parallel operations, transport schedules, throughput, latency, uptime, queueing, calibration overhead, compiler performance and the control stack. The third level is logical progress: syndrome extraction, decoder performance, repeated correction cycles, logical gate fidelity and resource overhead. The fourth level is customer evidence: accepted deliverables, repeat usage, paid revenue and a credible path from experimental access to production economics.
Valuation should identify the highest level supported by evidence. A company with excellent devices and limited system reliability may have valuable technical assets while remaining distant from recurring commercial revenue. A company with customer-funded development may possess strong relationships while retaining technical delivery risk. The hierarchy prevents a single headline metric from obscuring those differences.
Appendix B Milestone probability and roadmap value
Each roadmap milestone should have a defined technical test, baseline date, responsible owner, required capital, decision date and consequence. Probability estimates should be conditional. The chance of a commercially relevant logical system depends on reproducible gate quality, reliable loading and transport, scalable control, real-time decoding, parallel operations, manufacturable trap packages and sufficient deployment capacity.
The model should avoid multiplying unsupported point estimates through a long chain. Use ranges, dependency maps and periodic reassessment. A financing round can be linked to a bounded evidence package. A strategic buyer can use contingent consideration or staged investment. A board can discontinue an option when the next evidence gate no longer justifies its capital requirement.
Roadmap value should reflect dilution and time. A technically successful programme that requires several large financings may create less value for current holders than a smaller but better funded programme. The model should therefore reconcile enterprise value, new capital, ownership dilution and liquidity under each scenario.
Appendix C Valuation data room
The valuation data room should contain raw and processed gate results, zone-level calibration histories, transport and ion-loss records, system availability, test protocols, failed runs, trap-chip lots, vacuum-package yield, laser or radio-frequency control specifications, imaging records, bills of materials, supplier agreements, firmware, software repositories, decoder evidence, patent schedules, invention records and third-party rights.
Commercial records should include executed customer contracts, acceptance criteria, usage logs, invoices, cash receipts, renewal or expansion evidence, cloud-provider arrangements, government awards and restrictions. Financial records should reconcile revenue recognition, backlog, remaining performance obligations, research funding, capital expenditure, commitments, cash, investments and monthly cash use.
The diligence report should state which claims were reproduced, which records were sampled and which information could not be reviewed. Sensitive technical material can be examined through clean teams, controlled repositories or independent experts. Any unresolved evidence gap should appear in the valuation, financing terms or approval conditions.
Appendix D Decision figures and tables
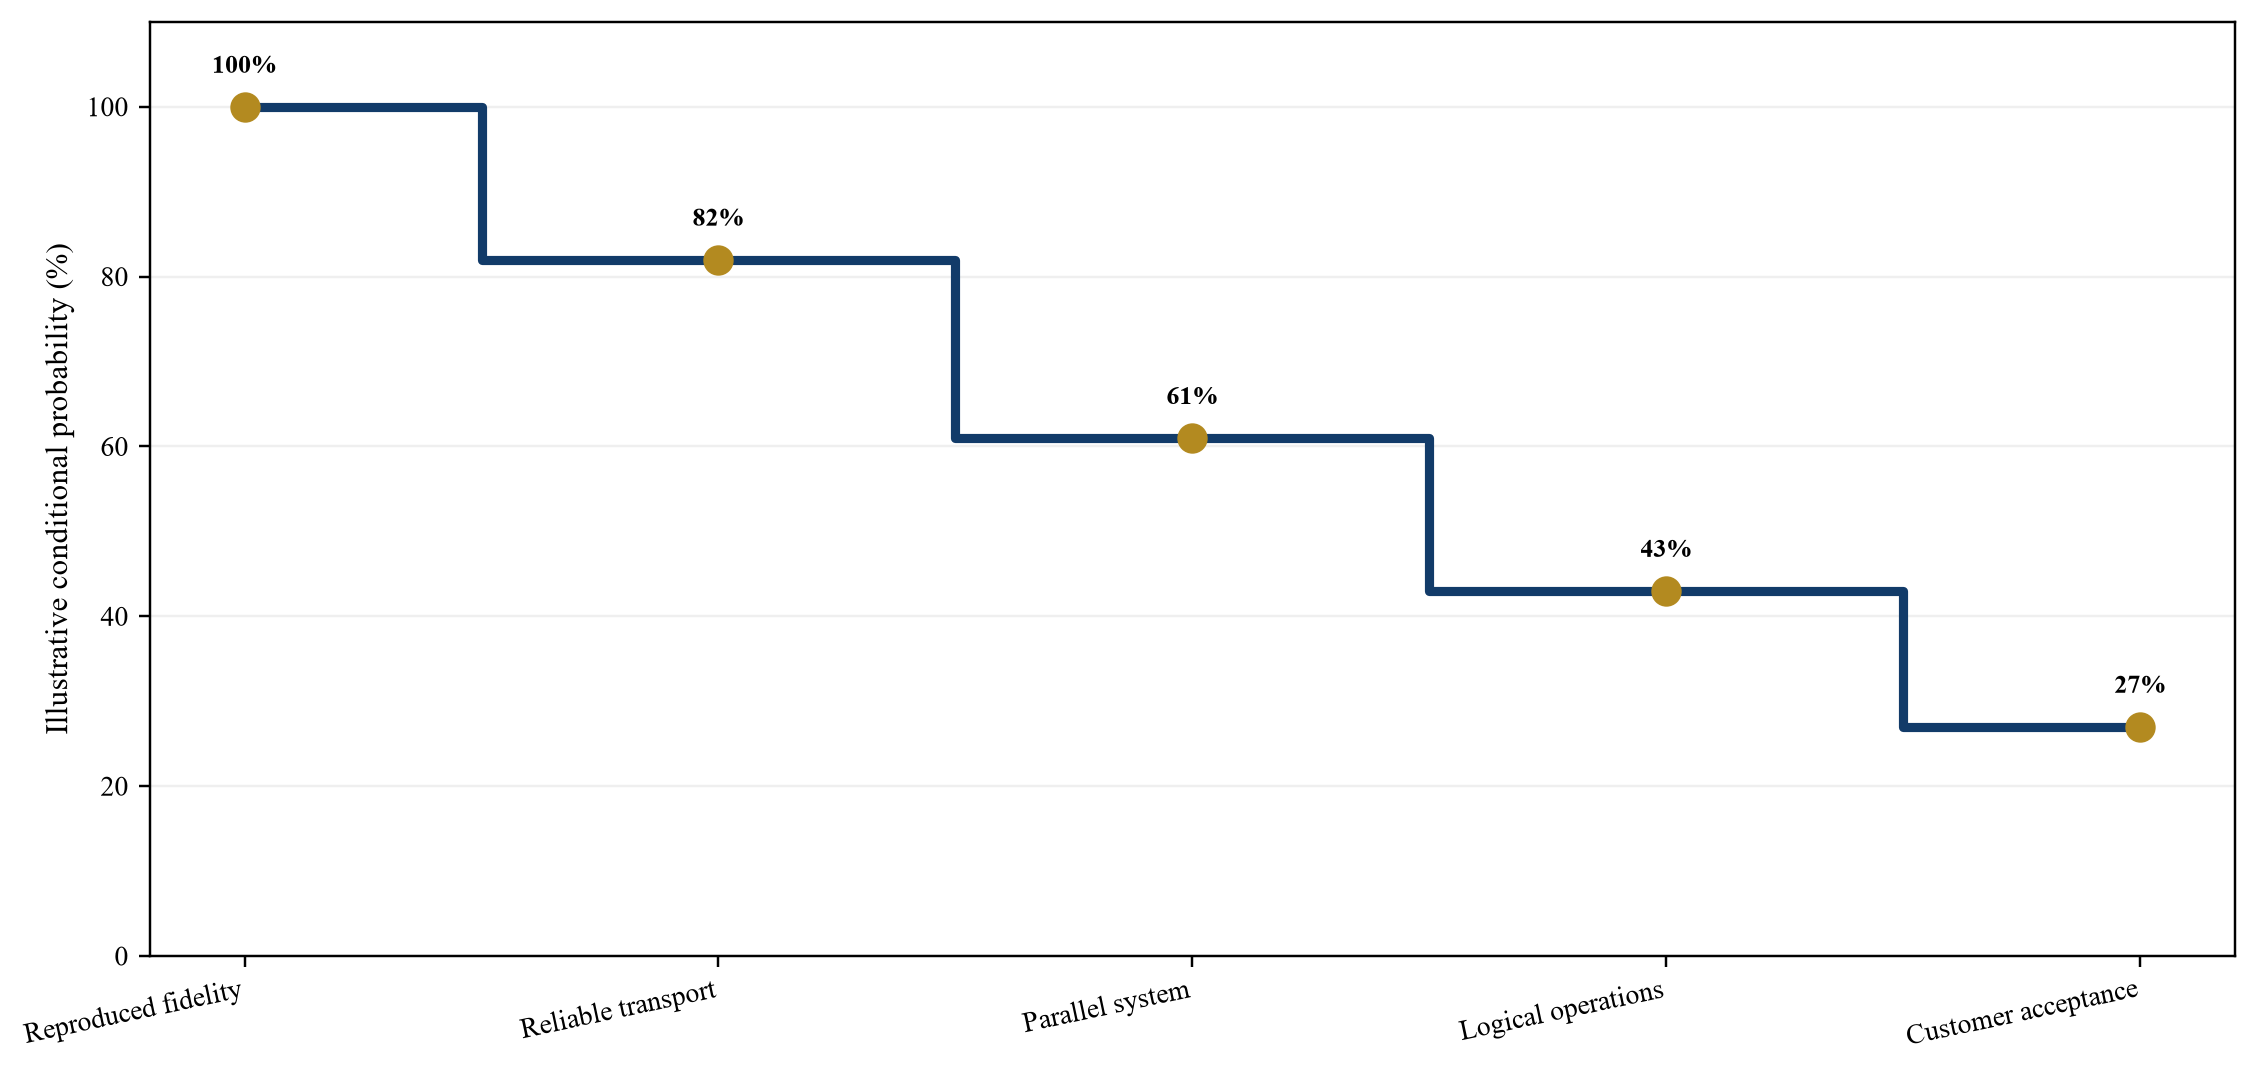
Proposed evidence sequence. Each branch requires a defined test before additional roadmap value is recognised.
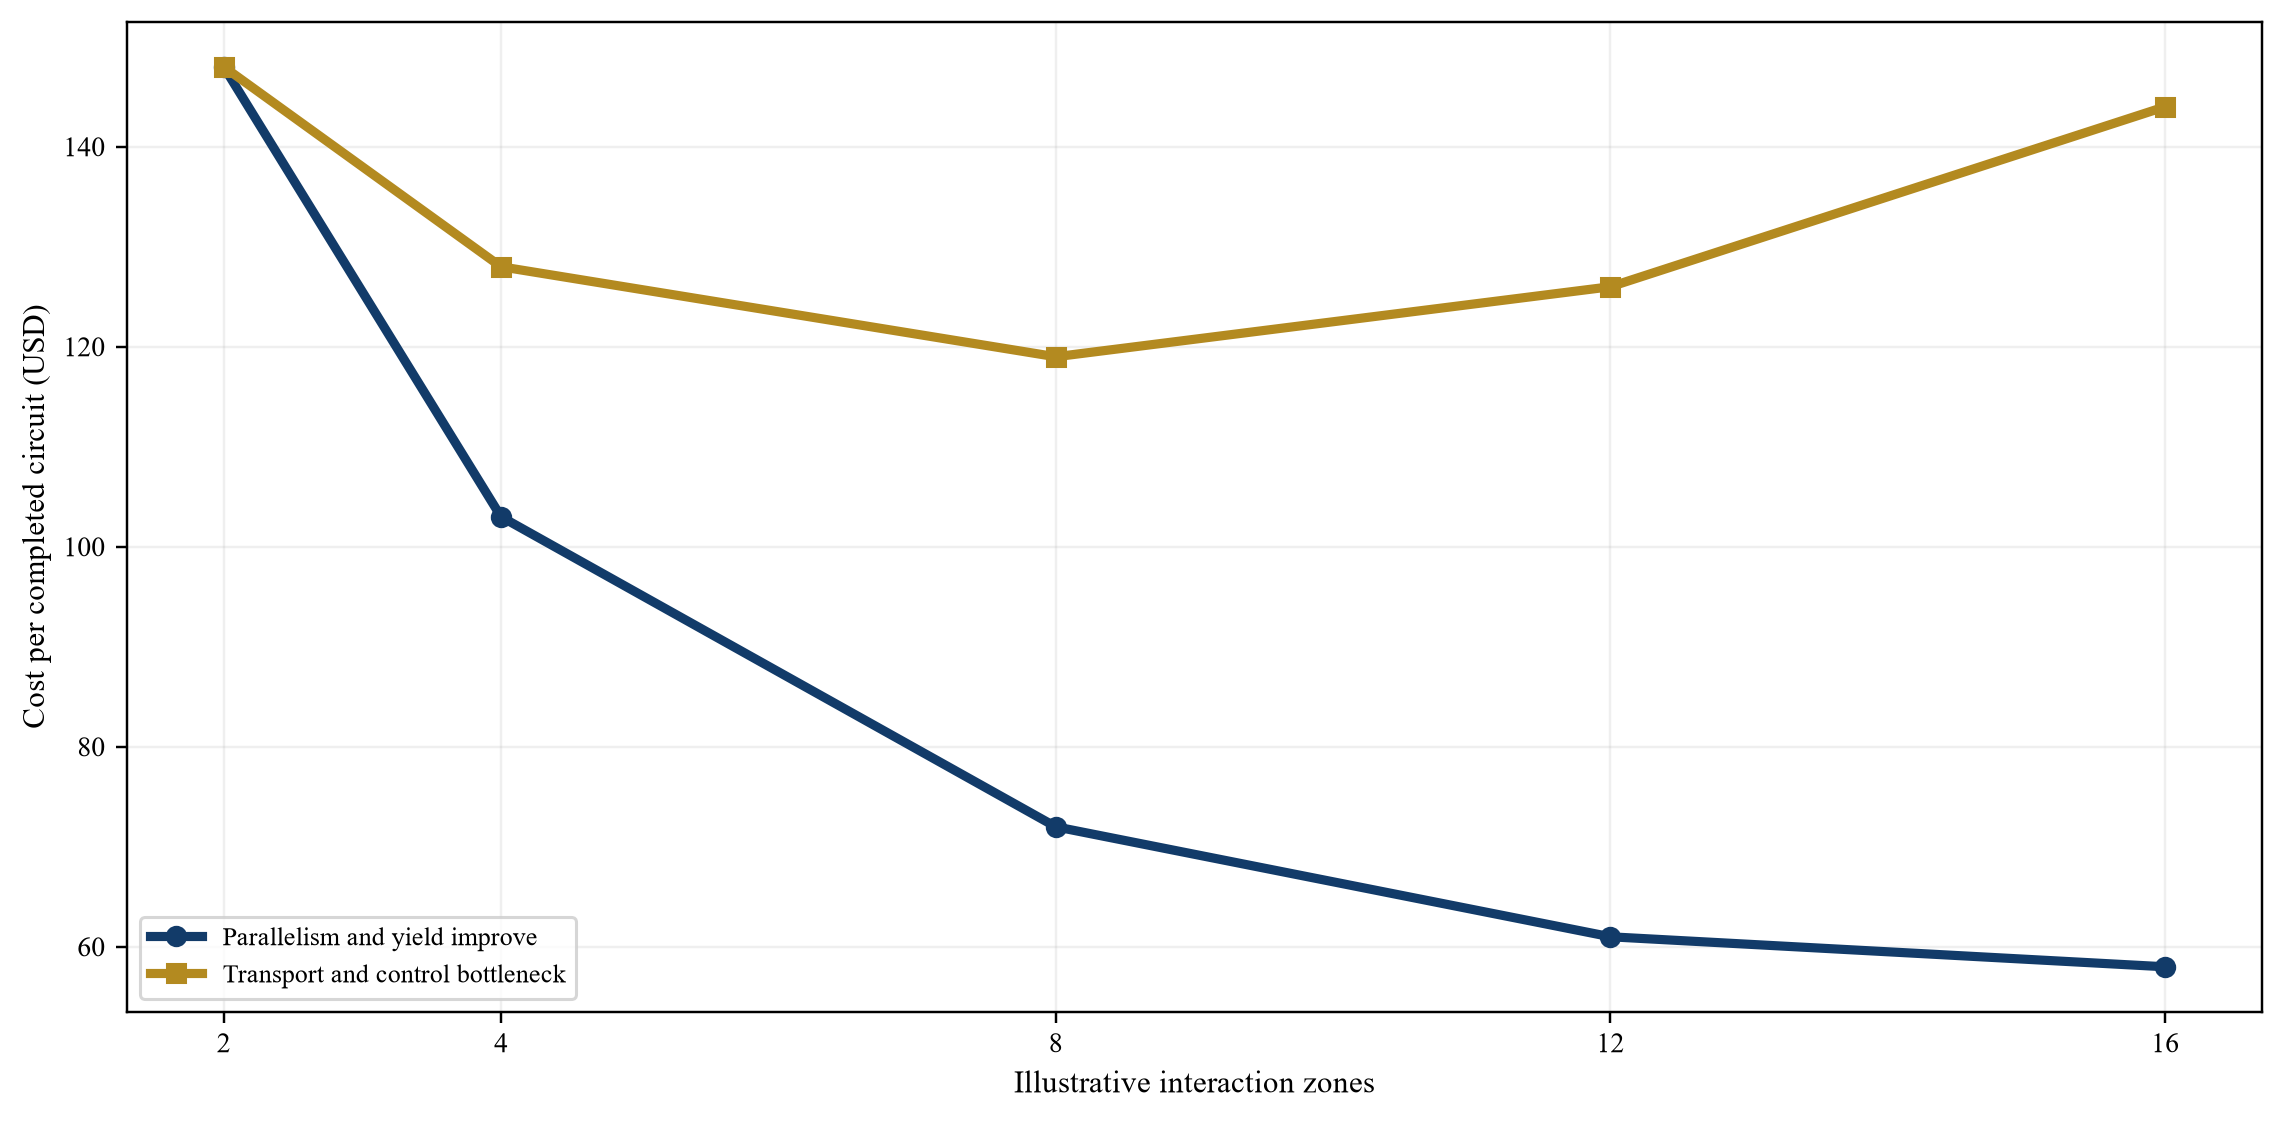
Wholly hypothetical management assumptions; USD per completed circuit at a defined workload.
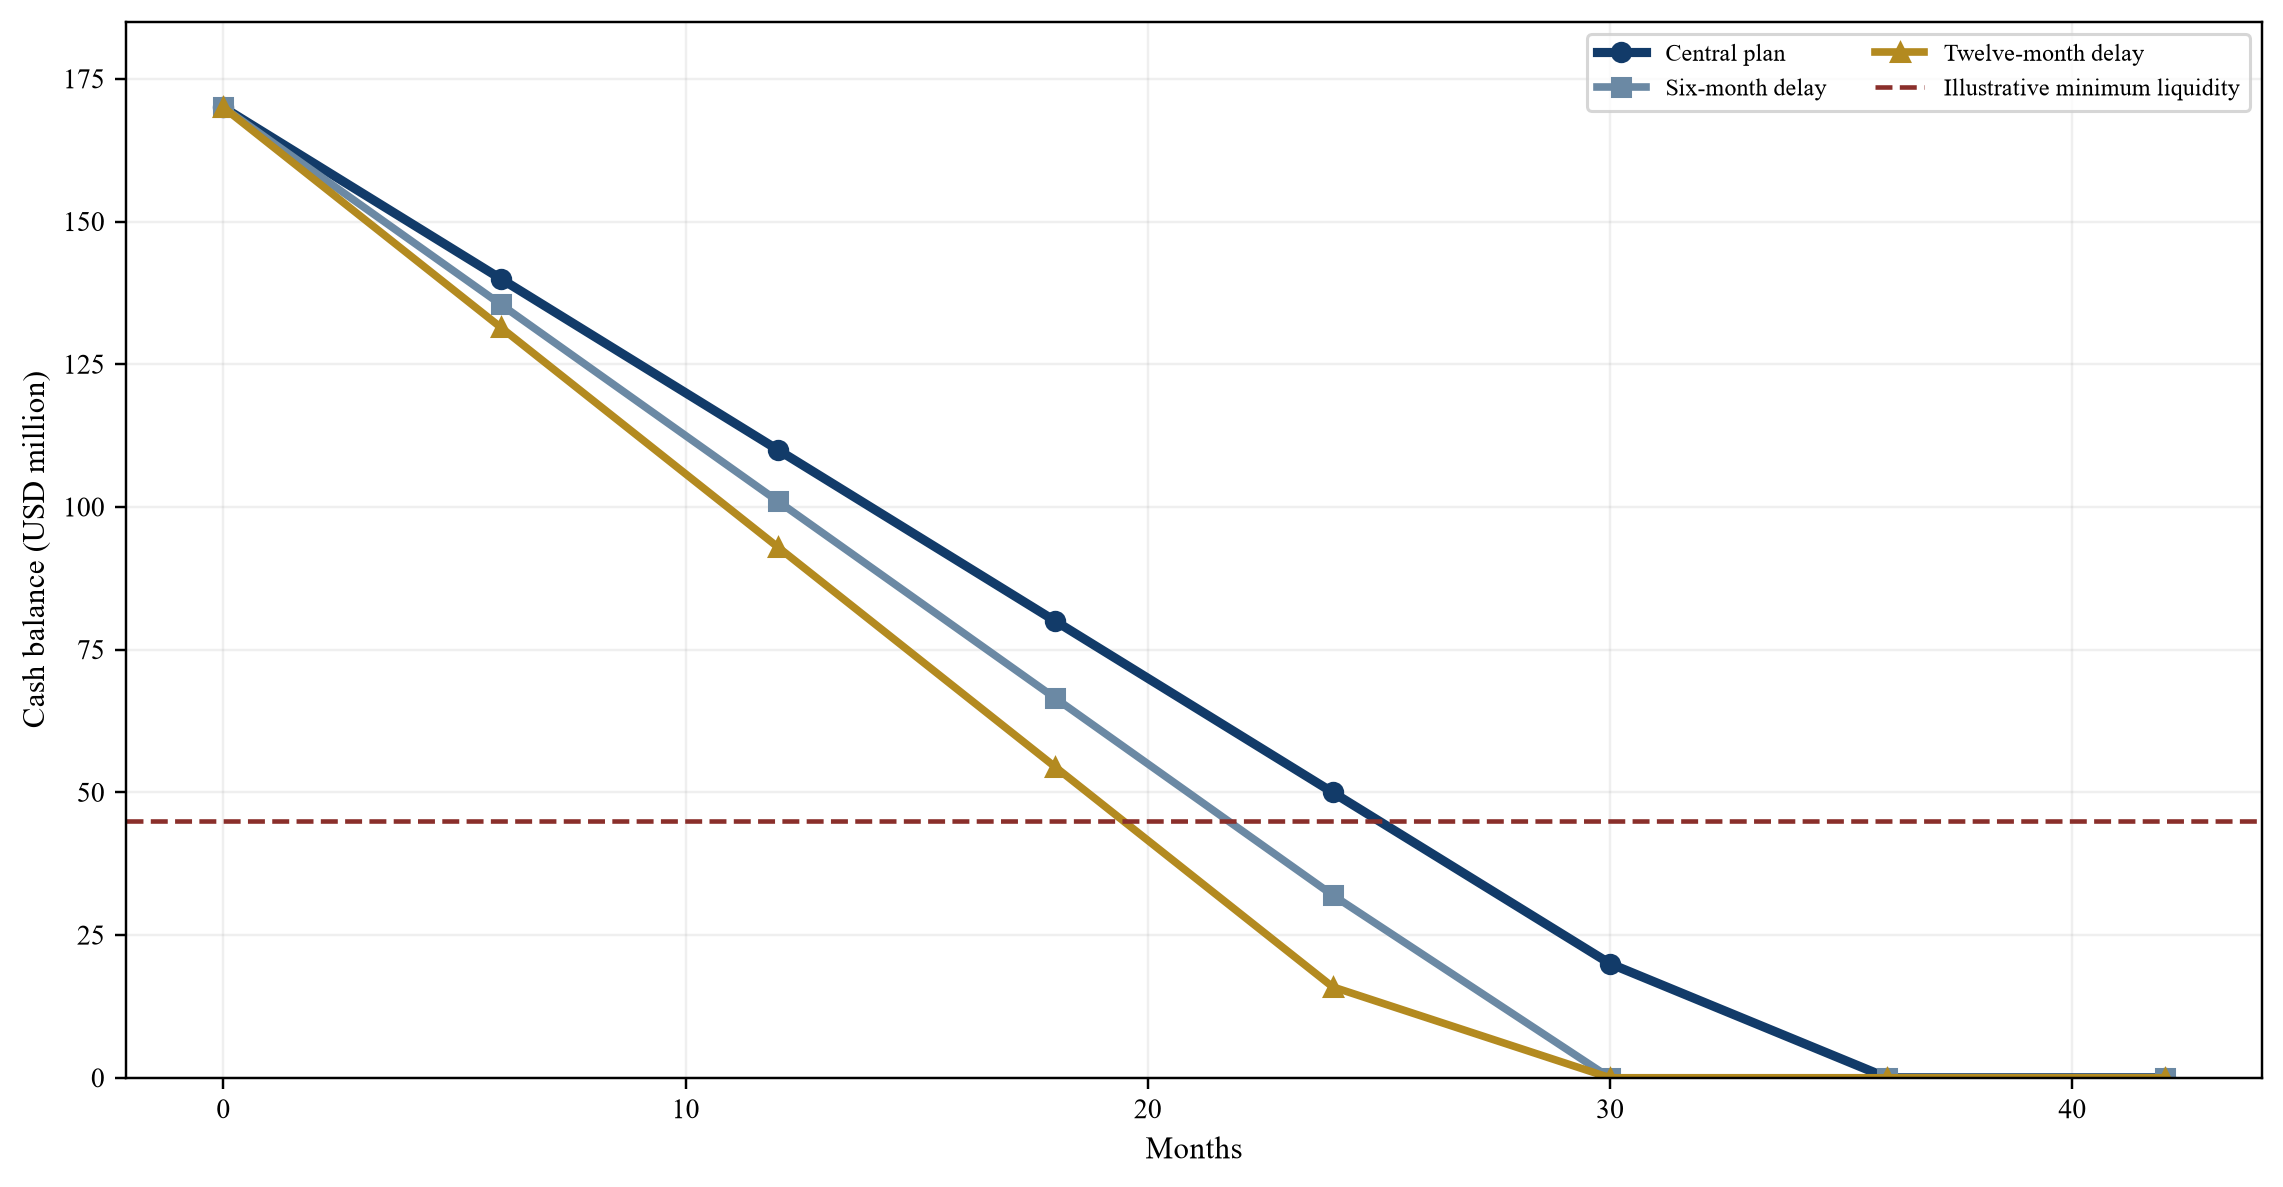
Hypothetical management assumptions; USD million. Financing proceeds are excluded.
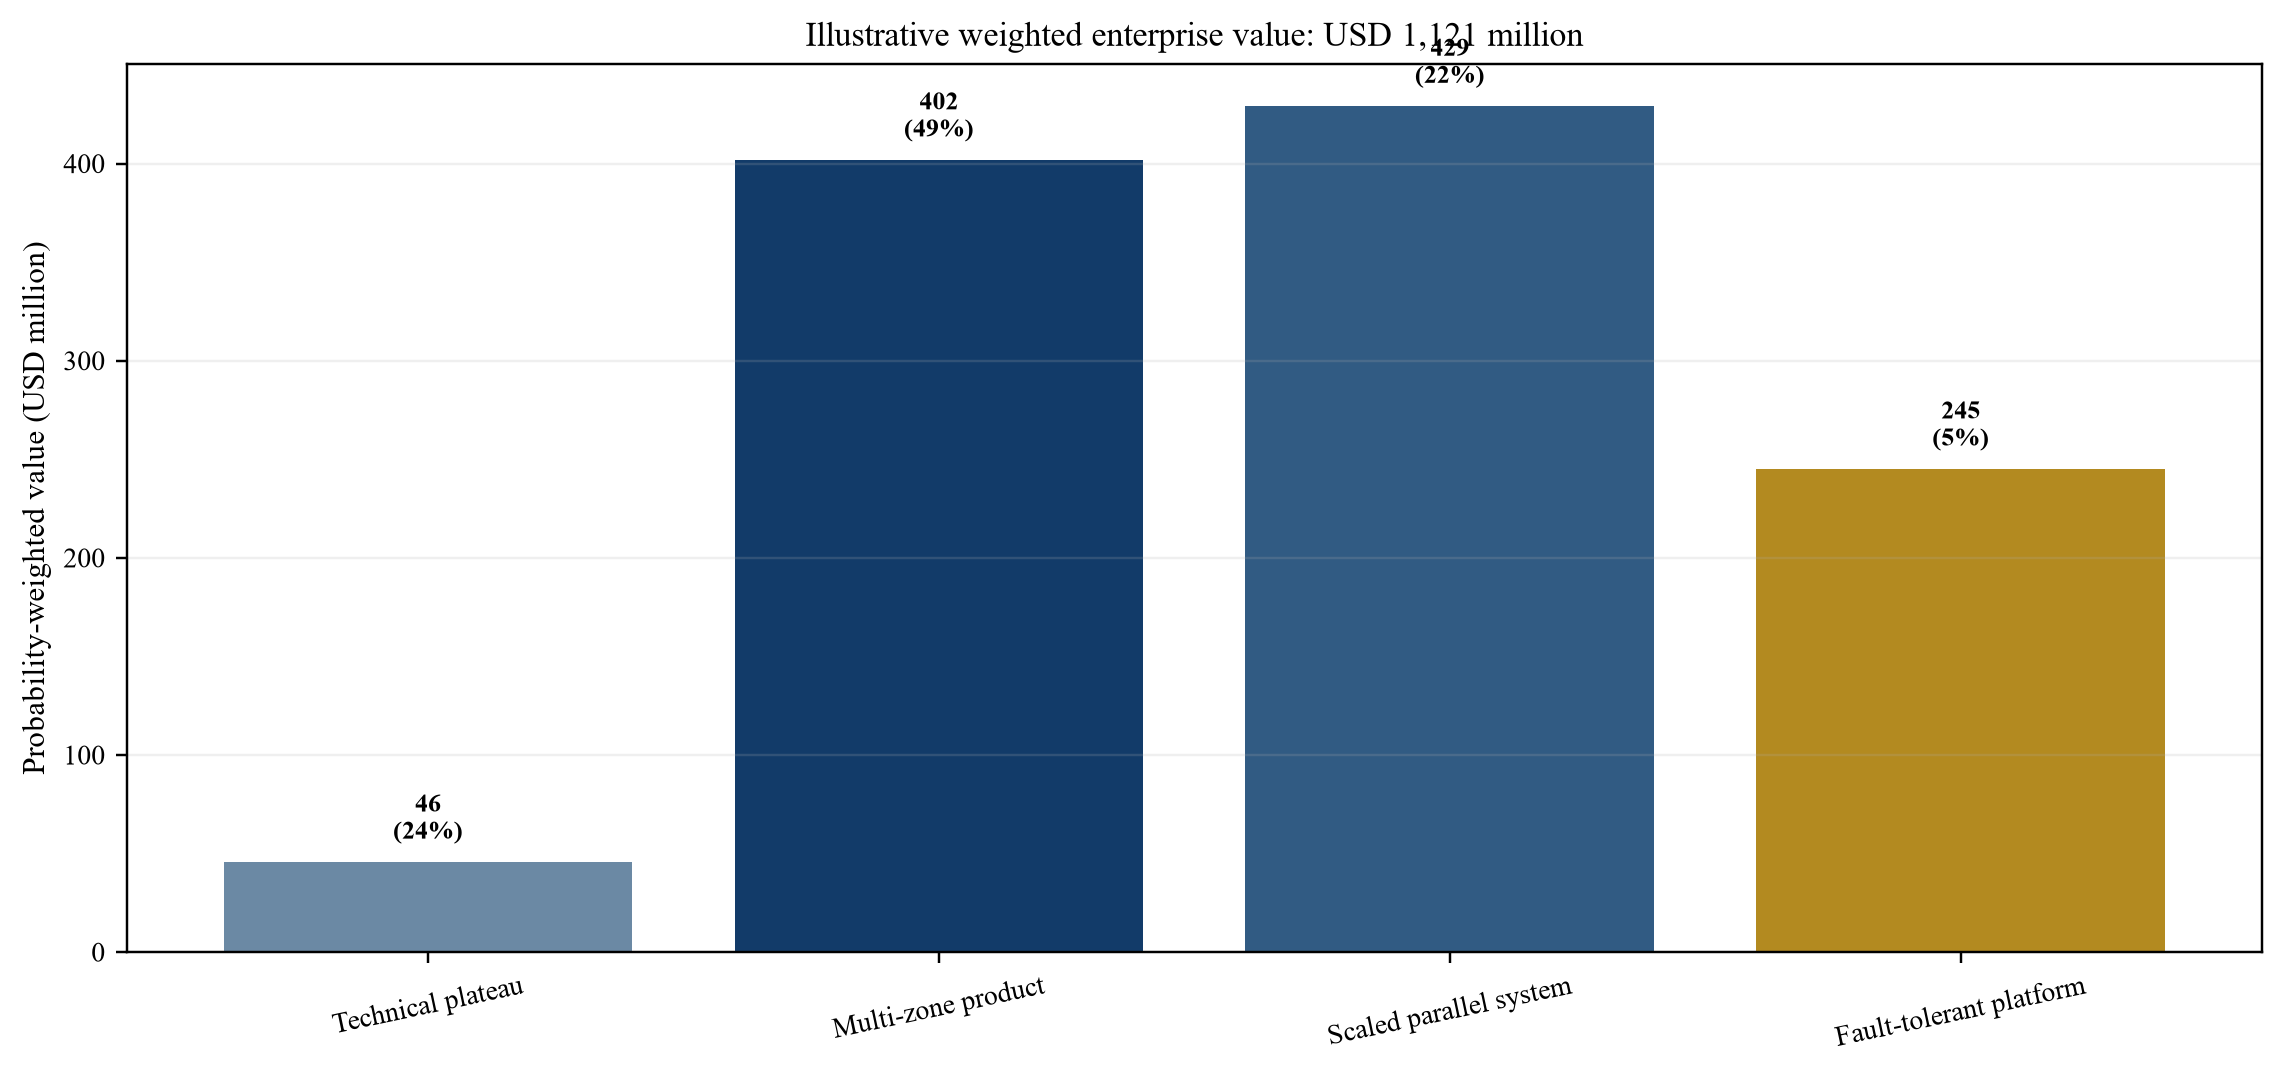
Wholly hypothetical management assumptions; USD million present value.
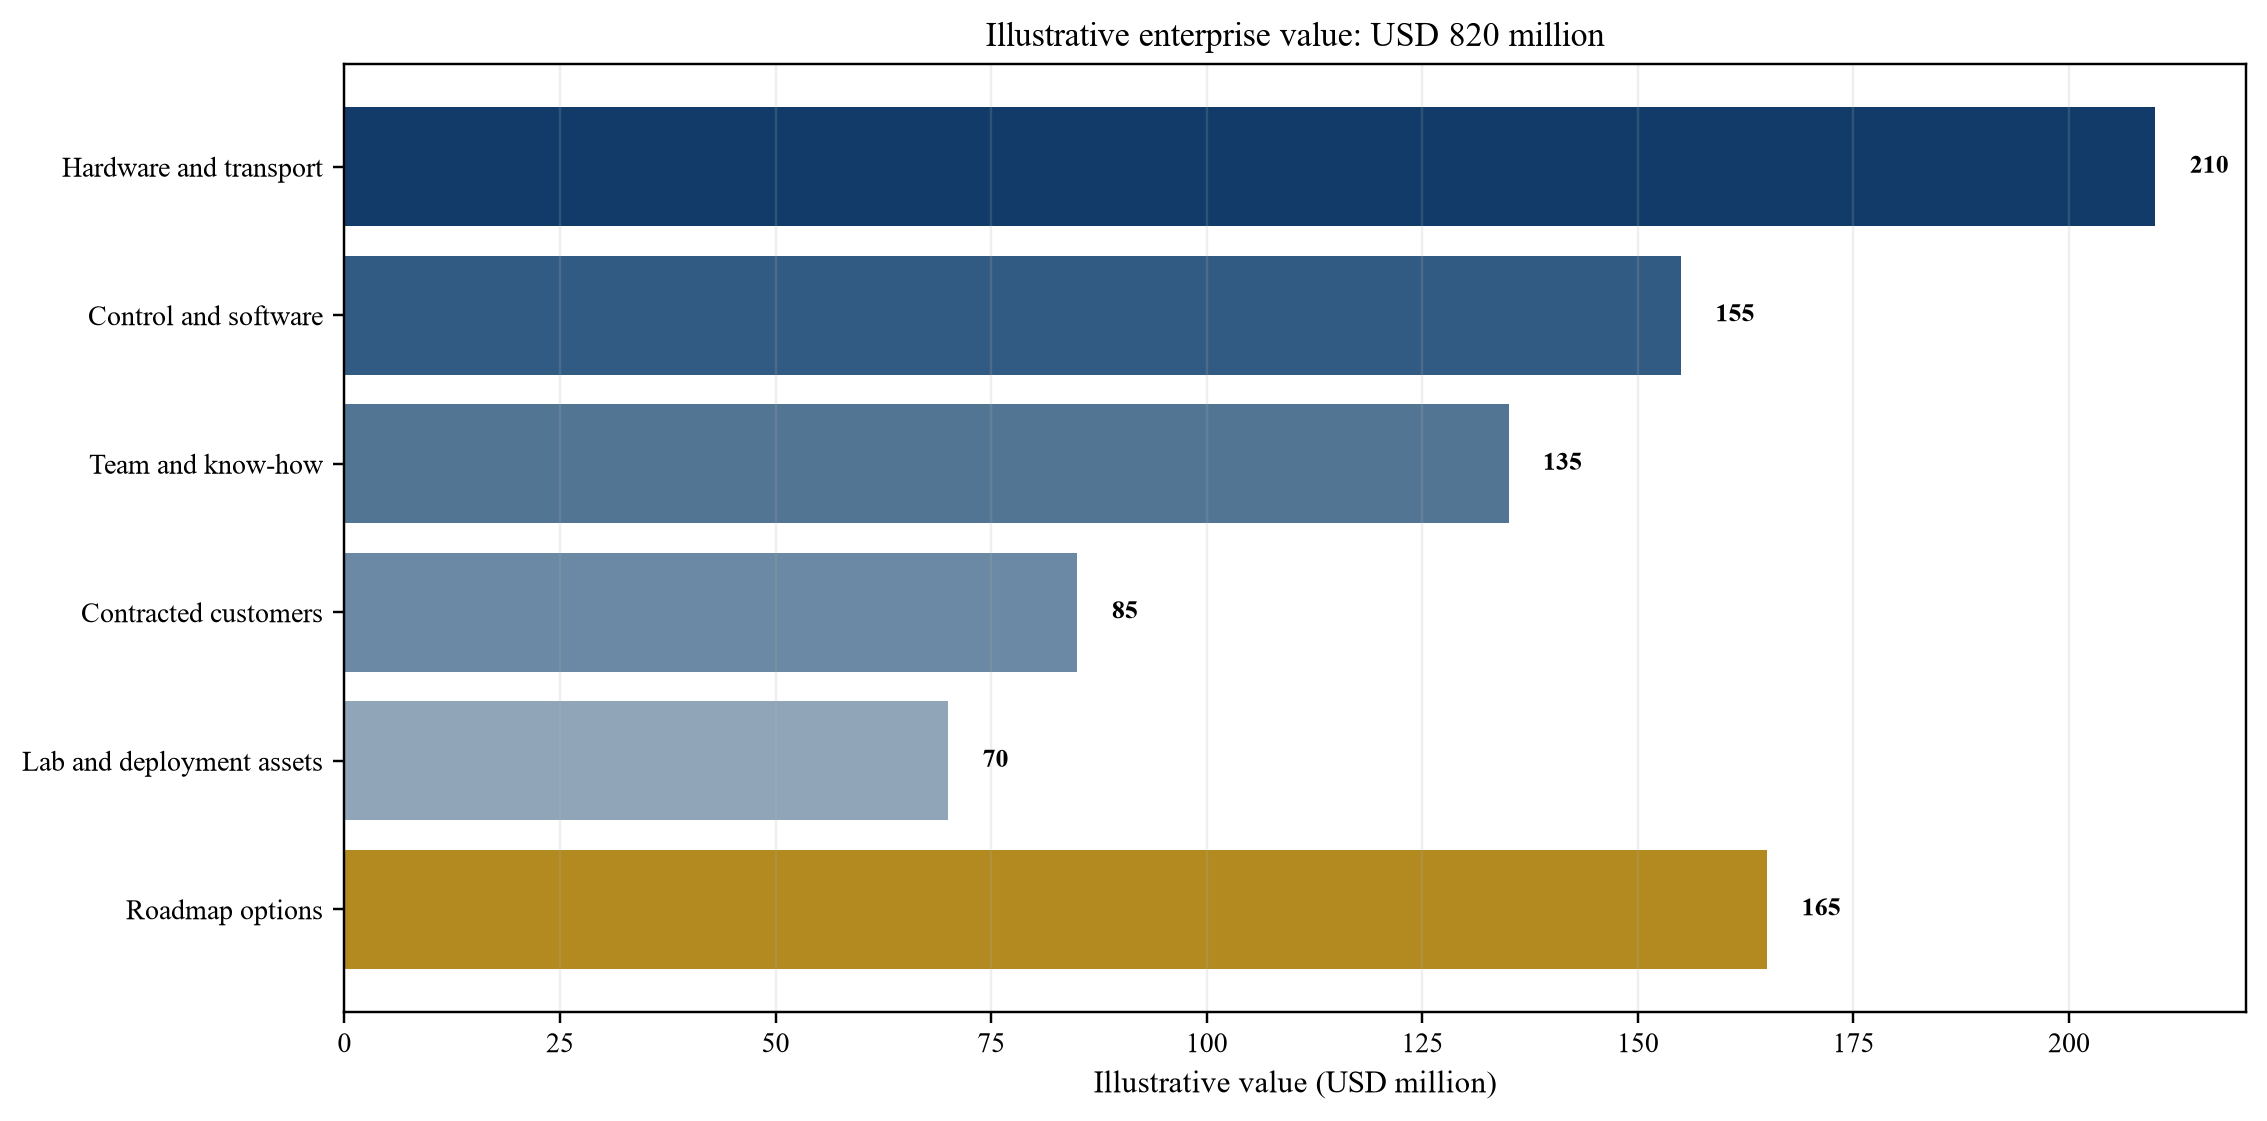
Wholly hypothetical management assumptions; USD million.
| Level | Evidence | Valuation question | Common failure |
|---|---|---|---|
| Physical | Gate and measurement error, ion loss and zone variation | Is performance repeatable across ions, pairs, zones and time? | Selected best pair presented as system performance |
| Transport | Loading, shuttling error, heating, junction passage and reorder time | Can ions move without erasing the fidelity advantage? | Static chain result extrapolated to a multi-zone machine |
| System | Parallel operations, circuit depth, throughput, uptime and calibration | Can the service complete useful work at acceptable cost? | Fidelity reported without runtime or operating burden |
| Logical | Syndrome cycles, decoder latency, logical gates and resource overhead | Does error correction improve the workload? | Encoded state extrapolated to universal operation |
| Commercial | Accepted deliverables, paid usage, renewal and expansion | Do customers pay for repeatable outcomes? | Collaboration or grant treated as recurring demand |
Proposed hierarchy; metrics require test conditions and distributions.
| Evidence stage | Minimum record | Independent check | Valuation treatment |
|---|---|---|---|
| Component | Trap, vacuum, control and measurement records | Re-run selected tests | Asset and know-how value |
| Integrated zone | Multi-ion results across repeated runs | Reproduce protocol on a held-out zone | Conditional system value |
| Multi-zone system | Transport, parallelism and availability distributions | Sample raw schedules and maintenance records | Reliability and scale adjustment |
| Logical experiment | Decoder, syndrome, logical-gate and overhead data | Verify end-to-end logical operation | Probability-weighted roadmap value |
| Customer acceptance | Contractual test and accepted output | Reconcile invoice, acceptance and cash | Contract and relationship value |
Proposed diligence sequence.
| Layer | Evidence | Dependency risk | Value implication |
|---|---|---|---|
| Trap and vacuum package | Drawings, process records, yield and lifetime tests | Fabrication, contamination and long lead times | Replacement cost and scale sensitivity |
| Optical or electronic control | Schematics, firmware, component rights and service records | Channel count, alignment, drift and scarce suppliers | Cost, uptime and manufacturability adjustment |
| Ion transport and calibration | Waveforms, logs, error distributions and recovery | Architecture-specific undocumented methods | Transferability and throughput adjustment |
| Compiler and scheduler | Benchmarks, licences, routing and customer use | Hidden transport and serialisation overhead | Margin and time-to-solution adjustment |
| Decoder and orchestration | Latency evidence, interfaces and rights | Unproven real-time performance at scale | Milestone option value |
Proposed minimum ownership review.
| Value component | Illustrative amount | Evidence gate | Downside treatment |
|---|---|---|---|
| Hardware and transport | USD 210 million | Reproduced fidelity, loading and multi-zone transport | Technical holdback |
| Control and software | USD 155 million | Rights, build, calibration and scheduler performance | Remediation reserve |
| Team and know-how | USD 135 million | Critical-role retention and documented transfer | Service-based retention |
| Contracted customers | USD 85 million | Acceptance, renewal, usage and cash evidence | Conversion adjustment |
| Laboratory and deployment assets | USD 70 million | Ownership, condition, capacity and utilisation | Replacement-cost cap |
| Roadmap options | USD 165 million | Funded scale and logical milestone tree | Staged capital and probability update |
Wholly hypothetical management assumptions; not observed company or transaction data.
| Evidence | What it proves | What it does not prove | Valuation use |
|---|---|---|---|
| Research collaboration | Access and joint activity | Recurring willingness to pay | Relationship evidence only |
| Government award | Funded scope and policy support | Commercial product-market fit | Contracted cash with restrictions |
| Paid pilot | Budget and defined experiment | Renewal or scalable gross margin | Probability-adjusted conversion value |
| Accepted delivery | Performance against contractual criteria | Long-term retention | Contract value with delivery history |
| Repeat paid use | Continuing budget and operational relevance | Fault-tolerant market scale | Stronger revenue and relationship evidence |
Proposed commercial diligence classification.
| Scenario | Starting cash | Annual cash use | Approximate runway | Valuation consequence |
|---|---|---|---|---|
| Central plan | USD 170 million | USD 60 million | 34 months | Fund next gate with moderate buffer |
| Six-month delay | USD 170 million | USD 69 million | 30 months | Earlier financing and dilution |
| Twelve-month delay | USD 170 million | USD 77 million | 26 months | Reduced negotiating leverage |
| Protected liquidity | USD 170 million | USD 60 million plus USD 45 million floor | 25 months to floor | Board intervention before cash exhaustion |
Wholly hypothetical management assumptions; financing proceeds are excluded.
| Decision area | Green evidence | Amber condition | Red condition |
|---|---|---|---|
| Technical | Reproduced fidelity, transport, parallelism and logical evidence | Limited multi-zone sample with funded validation | Selected pair or zone without raw evidence |
| Control stack | Rights, build process and accountable owners confirmed | Remediation plan with cost and date | Critical dependency unavailable or unowned |
| Customers | Paid acceptance and repeat demand | Funded pilot with clear acceptance | Unsigned interest treated as revenue |
| Runway | Next decisive gate funded with buffer | Financing required before gate | Liquidity shortfall with no credible plan |
| Valuation | Achieved value, scale cost and roadmap options separated | Probability range remains wide but bounded | Headline fidelity or qubit count drives price |
Proposed decision framework.
Sources
- US National Institute of Standards and Technology, Quantum Computing with Trapped Ions. Read the primary source
- Pino and collaborators, Demonstration of the trapped-ion quantum CCD computer architecture, Nature, 2021. Read the primary source
- Hensinger and collaborators, Penning micro-trap for quantum computing, Nature, 2024. Read the primary source
- Mehta and collaborators, High-fidelity trapped-ion qubit operations with scalable photonic modulators, npj Quantum Information, 2023. Read the primary source
- Quantinuum, Helios Product Data Sheet. Read the primary source
- Quantinuum, Helios system overview and performance. Read the primary source
- Quantinuum, Introducing Helios, 2025. Read the primary source
- Quantinuum, Hardware specification and benchmark data repository. Read the primary source
- Quantinuum, System Model H2. Read the primary source
- Quantinuum, Form S-1 filed 8 May 2026. Read the primary source
- Honeywell, Quantinuum USD 300 million round at USD 5 billion pre-money valuation, 16 January 2024. Read the primary source
- Honeywell, Third-quarter 2025 results and Quantinuum financing disclosure. Read the primary source
- IonQ, Annual Report on Form 10-K for the year ended 31 December 2025. Read the primary source
- IonQ, Quarterly Report on Form 10-Q for the quarter ended 30 September 2025. Read the primary source
- IonQ, Completion of Oxford Ionics acquisition, 17 September 2025. Read the primary source
- IonQ, Agreement to acquire Oxford Ionics, 9 June 2025. Read the primary source
- IonQ, Practical performance of IonQ Aria. Read the primary source
- IonQ, Best practices for using IonQ hardware. Read the primary source
- IonQ, Electronic control and reported two-qubit gate fidelity, 2025. Read the primary source
- IonQ, Walking Cat architecture for fault-tolerant trapped-ion computing, 2026. Read the primary source
- IonQ, Reconfigurable multicore quantum architecture. Read the primary source
- DARPA, Quantum Benchmarking Initiative Stage B selection, 2025. Read the primary source
- US Government, National Quantum Initiative. Read the primary source
- QED-C, Standards and Performance Metrics Technical Advisory Committee. Read the primary source
- QED-C, Application-Oriented Performance Benchmarks for Quantum Computing. Read the primary source
- ISO, ISO/IEC 4879:2024 Quantum Technologies; Vocabulary. Read the primary source
- Amazon Web Services, Amazon Braket Pricing. Read the primary source
- Microsoft Azure, Azure Quantum Documentation. Read the primary source
- IFRS Foundation, IFRS 3 Business Combinations. Read the primary source
- IFRS Foundation, IFRS 13 Fair Value Measurement. Read the primary source
- International Valuation Standards Council, International Valuation Standards. Read the primary source
- US Securities and Exchange Commission, Financial Reporting Manual. Read the primary source
