

1. Define the underwriting question
The transaction team should state the purchase price, leverage, hold period, minimum cash return, product strategy and acceptable technology risk. The required output is a signed software-LBO mandate. Use dated source data and link each material conclusion to retained customer, product, technical, financial and contractual evidence [1][2].
Translate the assumption into monthly revenue, gross profit, working capital, product investment, liquidity, debt and covenant effects. Identify the accountable owner, definition, measurement method, dependency, decision date and evidence threshold. Reconcile commercial systems, accounting records, product telemetry, infrastructure invoices and the financing model.
The principal risk is that the model can optimise leverage before the durable revenue and reinvestment perimeter is defined. Quantify the effect on sustainable free cash flow, revolving-credit availability, leverage, debt-service coverage, minimum liquidity, refinancing and equity value. Show base, retention-shock, compute-shock, platform-disruption and obsolescence cases with explicit management responses.
Retain the source, model version, reviewer, technical approval and investment committee response. Compare forecast retention, usage, cost, product performance and cash with realised outcomes; remove unsupported adjustments; and assign every exception an owner and deadline.
2. Reconstruct the legal perimeter
The transaction team should map entities, products, code repositories, licences, domains, data rights, customer contracts and cloud accounts. The required output is a verified legal-and-technology perimeter. Use dated source data and link each material conclusion to retained customer, product, technical, financial and contractual evidence [3][4].
Translate the assumption into monthly revenue, gross profit, working capital, product investment, liquidity, debt and covenant effects. Identify the accountable owner, definition, measurement method, dependency, decision date and evidence threshold. Reconcile commercial systems, accounting records, product telemetry, infrastructure invoices and the financing model.
The principal risk is that core intellectual property or operating dependencies can sit outside the acquired group. Quantify the effect on sustainable free cash flow, revolving-credit availability, leverage, debt-service coverage, minimum liquidity, refinancing and equity value. Show base, retention-shock, compute-shock, platform-disruption and obsolescence cases with explicit management responses.
Retain the source, model version, reviewer, technical approval and investment committee response. Compare forecast retention, usage, cost, product performance and cash with realised outcomes; remove unsupported adjustments; and assign every exception an owner and deadline.
3. Reconcile contracts to accounting revenue
The transaction team should connect executed orders, performance obligations, invoices, deferred revenue, recognised revenue and cash receipts. The required output is a contract-to-cash ledger. Use dated source data and link each material conclusion to retained customer, product, technical, financial and contractual evidence [5][6].
Translate the assumption into monthly revenue, gross profit, working capital, product investment, liquidity, debt and covenant effects. Identify the accountable owner, definition, measurement method, dependency, decision date and evidence threshold. Reconcile commercial systems, accounting records, product telemetry, infrastructure invoices and the financing model.
The principal risk is that commercial reporting can diverge from accounting revenue and collectible cash. Quantify the effect on sustainable free cash flow, revolving-credit availability, leverage, debt-service coverage, minimum liquidity, refinancing and equity value. Show base, retention-shock, compute-shock, platform-disruption and obsolescence cases with explicit management responses.
Retain the source, model version, reviewer, technical approval and investment committee response. Compare forecast retention, usage, cost, product performance and cash with realised outcomes; remove unsupported adjustments; and assign every exception an owner and deadline.
4. Define recurring revenue
The transaction team should document which contracts, licences, usage fees, maintenance, support and services enter each recurring metric. The required output is a governed recurring-revenue policy. Use dated source data and link each material conclusion to retained customer, product, technical, financial and contractual evidence [5][7].
Translate the assumption into monthly revenue, gross profit, working capital, product investment, liquidity, debt and covenant effects. Identify the accountable owner, definition, measurement method, dependency, decision date and evidence threshold. Reconcile commercial systems, accounting records, product telemetry, infrastructure invoices and the financing model.
The principal risk is that annualised labels can combine economically different revenue streams. Quantify the effect on sustainable free cash flow, revolving-credit availability, leverage, debt-service coverage, minimum liquidity, refinancing and equity value. Show base, retention-shock, compute-shock, platform-disruption and obsolescence cases with explicit management responses.
Retain the source, model version, reviewer, technical approval and investment committee response. Compare forecast retention, usage, cost, product performance and cash with realised outcomes; remove unsupported adjustments; and assign every exception an owner and deadline.
5. Reconcile ARR to the general ledger
The transaction team should bridge opening ARR, bookings, expansion, contraction, churn, currency and closing ARR to reported revenue. The required output is an ARR-to-revenue bridge. Use dated source data and link each material conclusion to retained customer, product, technical, financial and contractual evidence [5][7].
Translate the assumption into monthly revenue, gross profit, working capital, product investment, liquidity, debt and covenant effects. Identify the accountable owner, definition, measurement method, dependency, decision date and evidence threshold. Reconcile commercial systems, accounting records, product telemetry, infrastructure invoices and the financing model.
The principal risk is that non-standard metrics can grow while recognised revenue or cash weakens. Quantify the effect on sustainable free cash flow, revolving-credit availability, leverage, debt-service coverage, minimum liquidity, refinancing and equity value. Show base, retention-shock, compute-shock, platform-disruption and obsolescence cases with explicit management responses.
Retain the source, model version, reviewer, technical approval and investment committee response. Compare forecast retention, usage, cost, product performance and cash with realised outcomes; remove unsupported adjustments; and assign every exception an owner and deadline.
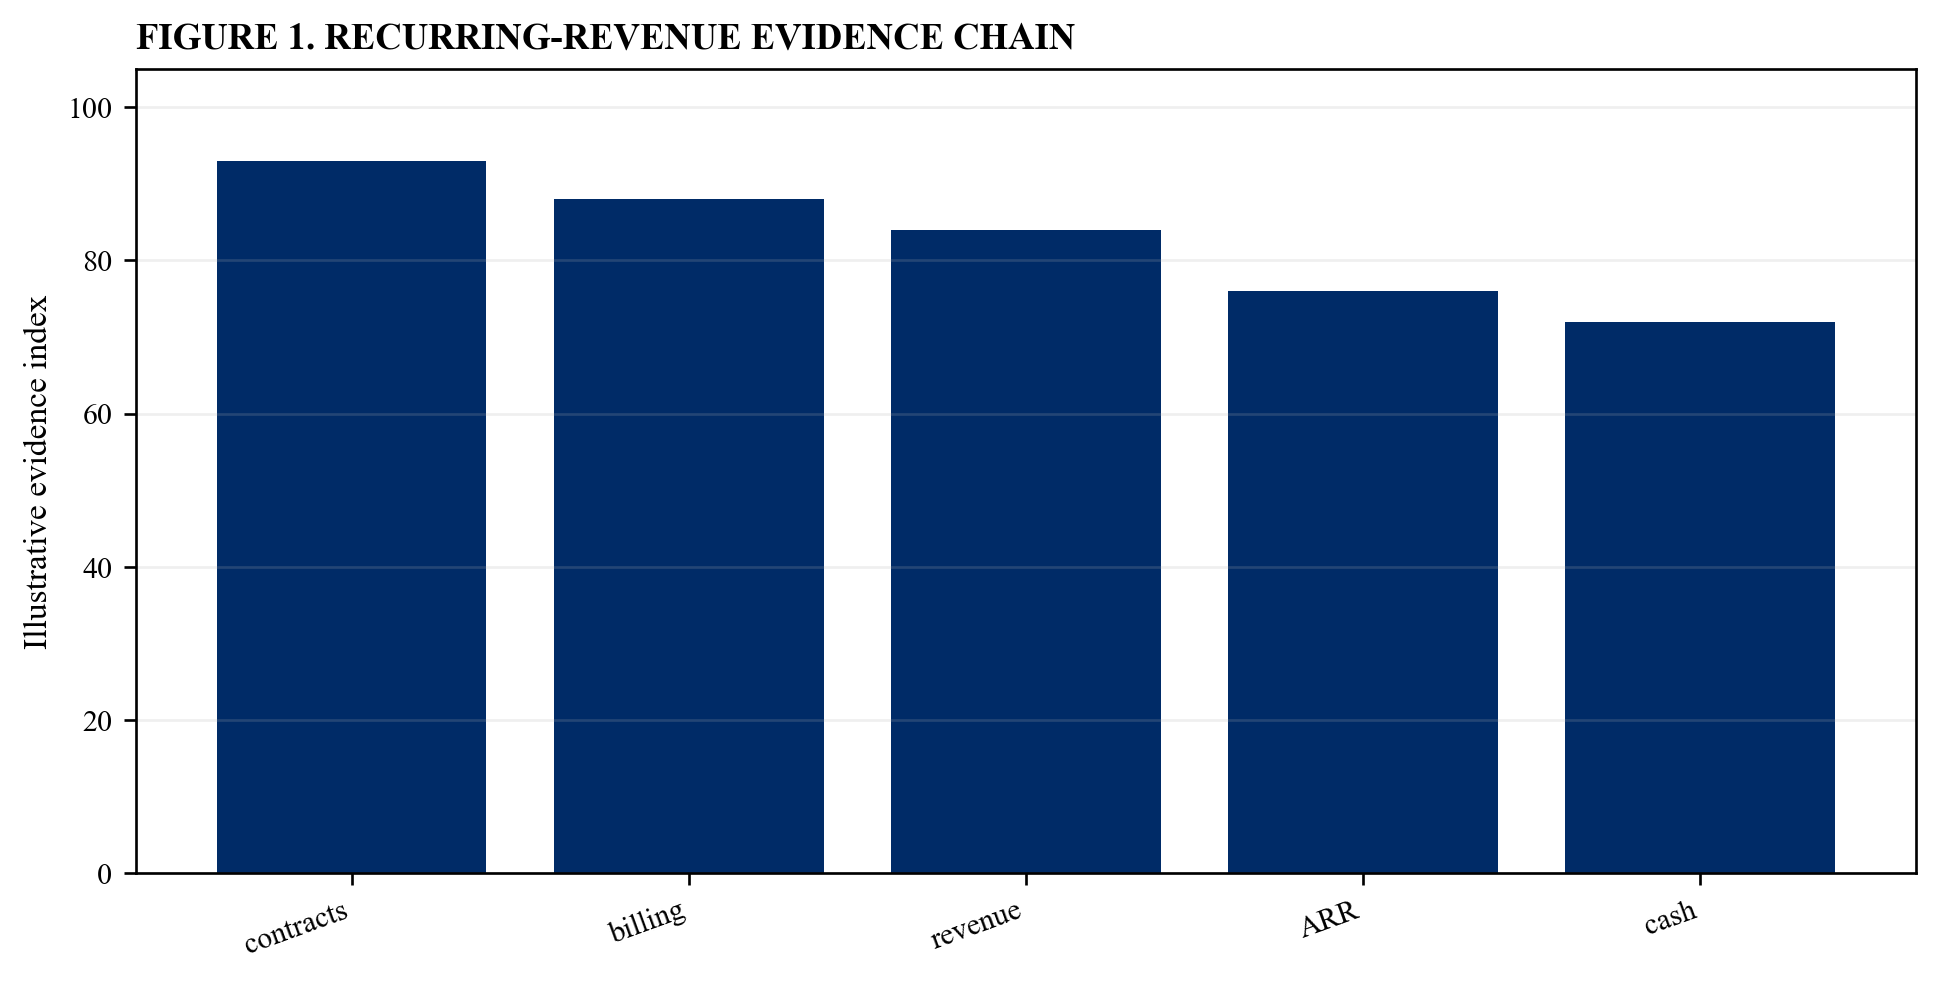
Illustrative analytical scenario; verified customer, product and transaction evidence should replace index values.
6. Verify customer identity and concentration
The transaction team should aggregate parents, affiliates, resellers, channels and end customers across products and geographies. The required output is a customer concentration register. Use dated source data and link each material conclusion to retained customer, product, technical, financial and contractual evidence [8][9].
Translate the assumption into monthly revenue, gross profit, working capital, product investment, liquidity, debt and covenant effects. Identify the accountable owner, definition, measurement method, dependency, decision date and evidence threshold. Reconcile commercial systems, accounting records, product telemetry, infrastructure invoices and the financing model.
The principal risk is that fragmented billing can disguise dependence on one economic buyer. Quantify the effect on sustainable free cash flow, revolving-credit availability, leverage, debt-service coverage, minimum liquidity, refinancing and equity value. Show base, retention-shock, compute-shock, platform-disruption and obsolescence cases with explicit management responses.
Retain the source, model version, reviewer, technical approval and investment committee response. Compare forecast retention, usage, cost, product performance and cash with realised outcomes; remove unsupported adjustments; and assign every exception an owner and deadline.
7. Build contract-level retention
The transaction team should measure renewal, cancellation, contraction, expansion, price and term changes for every eligible contract. The required output is a contract-retention ledger. Use dated source data and link each material conclusion to retained customer, product, technical, financial and contractual evidence [7][10].
Translate the assumption into monthly revenue, gross profit, working capital, product investment, liquidity, debt and covenant effects. Identify the accountable owner, definition, measurement method, dependency, decision date and evidence threshold. Reconcile commercial systems, accounting records, product telemetry, infrastructure invoices and the financing model.
The principal risk is that logo retention can remain high while revenue quality deteriorates. Quantify the effect on sustainable free cash flow, revolving-credit availability, leverage, debt-service coverage, minimum liquidity, refinancing and equity value. Show base, retention-shock, compute-shock, platform-disruption and obsolescence cases with explicit management responses.
Retain the source, model version, reviewer, technical approval and investment committee response. Compare forecast retention, usage, cost, product performance and cash with realised outcomes; remove unsupported adjustments; and assign every exception an owner and deadline.
8. Build cohort retention
The transaction team should group customers by start period, segment, product, channel and implementation model and track recurring value through time. The required output is a cohort retention matrix. Use dated source data and link each material conclusion to retained customer, product, technical, financial and contractual evidence [7][10].
Translate the assumption into monthly revenue, gross profit, working capital, product investment, liquidity, debt and covenant effects. Identify the accountable owner, definition, measurement method, dependency, decision date and evidence threshold. Reconcile commercial systems, accounting records, product telemetry, infrastructure invoices and the financing model.
The principal risk is that blended retention can be supported by new cohorts that have not seasoned. Quantify the effect on sustainable free cash flow, revolving-credit availability, leverage, debt-service coverage, minimum liquidity, refinancing and equity value. Show base, retention-shock, compute-shock, platform-disruption and obsolescence cases with explicit management responses.
Retain the source, model version, reviewer, technical approval and investment committee response. Compare forecast retention, usage, cost, product performance and cash with realised outcomes; remove unsupported adjustments; and assign every exception an owner and deadline.
Table 1. Recurring-revenue evidence matrix
| Measure | Minimum evidence | Core test |
|---|---|---|
| contracted value | executed terms | enforceable and current |
| accounting revenue | ledger and policy | recognition reconciled |
| ARR | governed calculation | opening to closing bridge |
| cash | invoice and receipt | collection verified |
Illustrative control framework; verified transaction evidence and executed documents govern.
9. Separate gross and net retention
The transaction team should calculate lost, contracted and expanded recurring value using consistent currency and acquisition rules. The required output is a retention waterfall. Use dated source data and link each material conclusion to retained customer, product, technical, financial and contractual evidence [7][11].
Translate the assumption into monthly revenue, gross profit, working capital, product investment, liquidity, debt and covenant effects. Identify the accountable owner, definition, measurement method, dependency, decision date and evidence threshold. Reconcile commercial systems, accounting records, product telemetry, infrastructure invoices and the financing model.
The principal risk is that expansion from a small set of customers can conceal broad contraction. Quantify the effect on sustainable free cash flow, revolving-credit availability, leverage, debt-service coverage, minimum liquidity, refinancing and equity value. Show base, retention-shock, compute-shock, platform-disruption and obsolescence cases with explicit management responses.
Retain the source, model version, reviewer, technical approval and investment committee response. Compare forecast retention, usage, cost, product performance and cash with realised outcomes; remove unsupported adjustments; and assign every exception an owner and deadline.
10. Test renewal evidence
The transaction team should review expiry dates, notice periods, auto-renewal, procurement steps, price protection and current customer communication. The required output is a renewal evidence calendar. Use dated source data and link each material conclusion to retained customer, product, technical, financial and contractual evidence [5][12].
Translate the assumption into monthly revenue, gross profit, working capital, product investment, liquidity, debt and covenant effects. Identify the accountable owner, definition, measurement method, dependency, decision date and evidence threshold. Reconcile commercial systems, accounting records, product telemetry, infrastructure invoices and the financing model.
The principal risk is that reported ARR can include contracts with weak or delayed renewal evidence. Quantify the effect on sustainable free cash flow, revolving-credit availability, leverage, debt-service coverage, minimum liquidity, refinancing and equity value. Show base, retention-shock, compute-shock, platform-disruption and obsolescence cases with explicit management responses.
Retain the source, model version, reviewer, technical approval and investment committee response. Compare forecast retention, usage, cost, product performance and cash with realised outcomes; remove unsupported adjustments; and assign every exception an owner and deadline.
11. Measure implementation dependency
The transaction team should map deployment time, integrations, data migration, configuration, training and customer operating change. The required output is an implementation-depth score. Use dated source data and link each material conclusion to retained customer, product, technical, financial and contractual evidence [13][14].
Translate the assumption into monthly revenue, gross profit, working capital, product investment, liquidity, debt and covenant effects. Identify the accountable owner, definition, measurement method, dependency, decision date and evidence threshold. Reconcile commercial systems, accounting records, product telemetry, infrastructure invoices and the financing model.
The principal risk is that high switching cost can reflect product value or unresolved implementation burden. Quantify the effect on sustainable free cash flow, revolving-credit availability, leverage, debt-service coverage, minimum liquidity, refinancing and equity value. Show base, retention-shock, compute-shock, platform-disruption and obsolescence cases with explicit management responses.
Retain the source, model version, reviewer, technical approval and investment committee response. Compare forecast retention, usage, cost, product performance and cash with realised outcomes; remove unsupported adjustments; and assign every exception an owner and deadline.
12. Measure product dependency
The transaction team should connect user activity, workflows, integrations, business criticality and replacement alternatives. The required output is a product-dependency map. Use dated source data and link each material conclusion to retained customer, product, technical, financial and contractual evidence [13][15].
Translate the assumption into monthly revenue, gross profit, working capital, product investment, liquidity, debt and covenant effects. Identify the accountable owner, definition, measurement method, dependency, decision date and evidence threshold. Reconcile commercial systems, accounting records, product telemetry, infrastructure invoices and the financing model.
The principal risk is that seat counts can remain stable while meaningful usage declines. Quantify the effect on sustainable free cash flow, revolving-credit availability, leverage, debt-service coverage, minimum liquidity, refinancing and equity value. Show base, retention-shock, compute-shock, platform-disruption and obsolescence cases with explicit management responses.
Retain the source, model version, reviewer, technical approval and investment committee response. Compare forecast retention, usage, cost, product performance and cash with realised outcomes; remove unsupported adjustments; and assign every exception an owner and deadline.
13. Test pricing durability
The transaction team should reconstruct list price, discount, uplift, credits, usage bands, minimum commitments and renewal negotiations. The required output is a price-realisation bridge. Use dated source data and link each material conclusion to retained customer, product, technical, financial and contractual evidence [5][10].
Translate the assumption into monthly revenue, gross profit, working capital, product investment, liquidity, debt and covenant effects. Identify the accountable owner, definition, measurement method, dependency, decision date and evidence threshold. Reconcile commercial systems, accounting records, product telemetry, infrastructure invoices and the financing model.
The principal risk is that nominal expansion can be purchased through discounting or unfunded service effort. Quantify the effect on sustainable free cash flow, revolving-credit availability, leverage, debt-service coverage, minimum liquidity, refinancing and equity value. Show base, retention-shock, compute-shock, platform-disruption and obsolescence cases with explicit management responses.
Retain the source, model version, reviewer, technical approval and investment committee response. Compare forecast retention, usage, cost, product performance and cash with realised outcomes; remove unsupported adjustments; and assign every exception an owner and deadline.
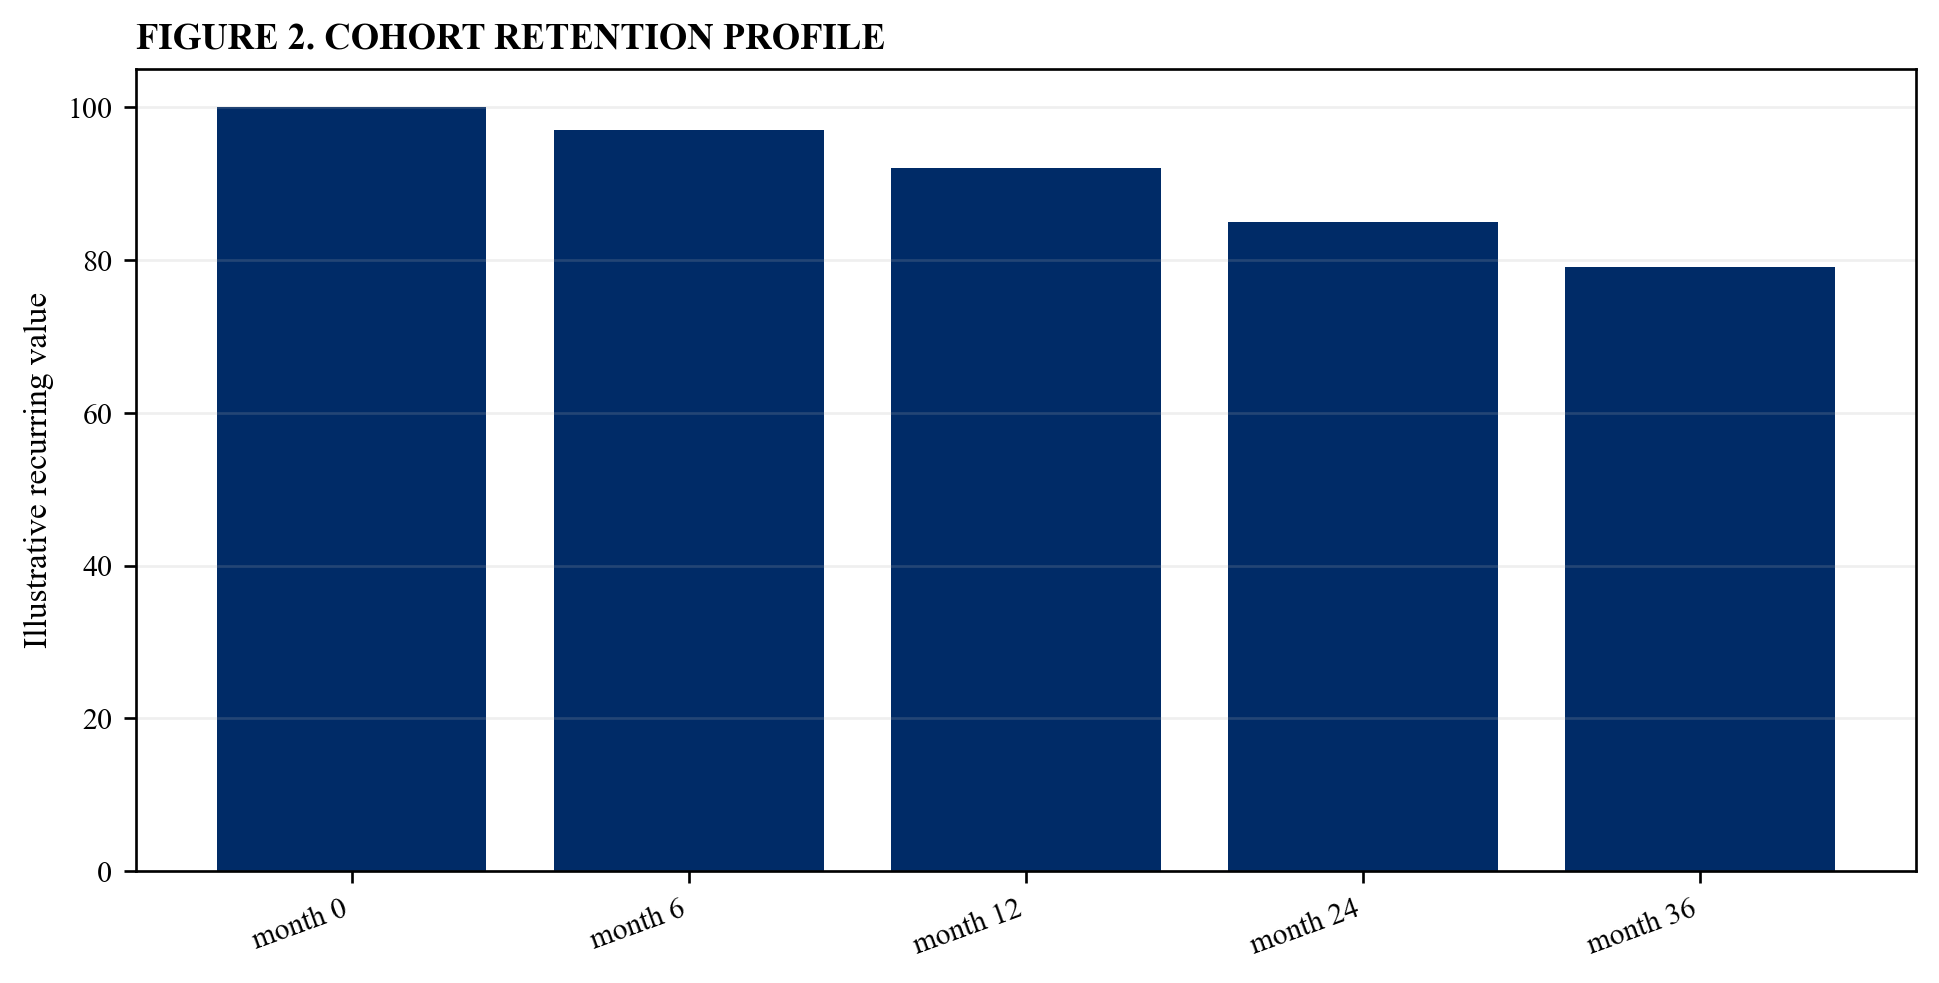
Illustrative analytical scenario; verified customer, product and transaction evidence should replace index values.
14. Allocate customer success cost
The transaction team should assign onboarding, support, solutions engineering, human review and retention incentives by customer and product. The required output is a retention-cost model. Use dated source data and link each material conclusion to retained customer, product, technical, financial and contractual evidence [6][16].
Translate the assumption into monthly revenue, gross profit, working capital, product investment, liquidity, debt and covenant effects. Identify the accountable owner, definition, measurement method, dependency, decision date and evidence threshold. Reconcile commercial systems, accounting records, product telemetry, infrastructure invoices and the financing model.
The principal risk is that retention can consume labour that is classified below gross margin. Quantify the effect on sustainable free cash flow, revolving-credit availability, leverage, debt-service coverage, minimum liquidity, refinancing and equity value. Show base, retention-shock, compute-shock, platform-disruption and obsolescence cases with explicit management responses.
Retain the source, model version, reviewer, technical approval and investment committee response. Compare forecast retention, usage, cost, product performance and cash with realised outcomes; remove unsupported adjustments; and assign every exception an owner and deadline.
15. Reconstruct cloud and compute spend
The transaction team should map providers, accounts, services, regions, reservations, credits and shared infrastructure to workloads. The required output is a cloud-cost ledger. Use dated source data and link each material conclusion to retained customer, product, technical, financial and contractual evidence [17][18].
Translate the assumption into monthly revenue, gross profit, working capital, product investment, liquidity, debt and covenant effects. Identify the accountable owner, definition, measurement method, dependency, decision date and evidence threshold. Reconcile commercial systems, accounting records, product telemetry, infrastructure invoices and the financing model.
The principal risk is that consolidated invoices can conceal product-level cash consumption. Quantify the effect on sustainable free cash flow, revolving-credit availability, leverage, debt-service coverage, minimum liquidity, refinancing and equity value. Show base, retention-shock, compute-shock, platform-disruption and obsolescence cases with explicit management responses.
Retain the source, model version, reviewer, technical approval and investment committee response. Compare forecast retention, usage, cost, product performance and cash with realised outcomes; remove unsupported adjustments; and assign every exception an owner and deadline.
16. Measure AI inference economics
The transaction team should calculate tokens, accelerator time, retrieval, storage, networking, observability and review cost per completed unit. The required output is an inference unit-cost model. Use dated source data and link each material conclusion to retained customer, product, technical, financial and contractual evidence [17][19].
Translate the assumption into monthly revenue, gross profit, working capital, product investment, liquidity, debt and covenant effects. Identify the accountable owner, definition, measurement method, dependency, decision date and evidence threshold. Reconcile commercial systems, accounting records, product telemetry, infrastructure invoices and the financing model.
The principal risk is that revenue can scale alongside variable compute and oversight cost. Quantify the effect on sustainable free cash flow, revolving-credit availability, leverage, debt-service coverage, minimum liquidity, refinancing and equity value. Show base, retention-shock, compute-shock, platform-disruption and obsolescence cases with explicit management responses.
Retain the source, model version, reviewer, technical approval and investment committee response. Compare forecast retention, usage, cost, product performance and cash with realised outcomes; remove unsupported adjustments; and assign every exception an owner and deadline.
Table 2. AI unit-economics bridge
| Cost layer | Allocation basis | Control |
|---|---|---|
| model | requests and tokens | provider invoice |
| infrastructure | workload usage | cloud ledger |
| data | storage and retrieval | dataset owner |
| human review | completed units | operations record |
Illustrative control framework; verified transaction evidence and executed documents govern.
17. Separate training and inference
The transaction team should identify model development, fine-tuning, evaluation, experimentation and production-serving costs. The required output is an AI cost taxonomy. Use dated source data and link each material conclusion to retained customer, product, technical, financial and contractual evidence [17][20].
Translate the assumption into monthly revenue, gross profit, working capital, product investment, liquidity, debt and covenant effects. Identify the accountable owner, definition, measurement method, dependency, decision date and evidence threshold. Reconcile commercial systems, accounting records, product telemetry, infrastructure invoices and the financing model.
The principal risk is that one-off development and recurring service costs can be mixed. Quantify the effect on sustainable free cash flow, revolving-credit availability, leverage, debt-service coverage, minimum liquidity, refinancing and equity value. Show base, retention-shock, compute-shock, platform-disruption and obsolescence cases with explicit management responses.
Retain the source, model version, reviewer, technical approval and investment committee response. Compare forecast retention, usage, cost, product performance and cash with realised outcomes; remove unsupported adjustments; and assign every exception an owner and deadline.
18. Normalise credits and commitments
The transaction team should restate cloud credits, promotional pricing, reserved capacity, take-or-pay commitments and minimum spend. The required output is a normalised compute forecast. Use dated source data and link each material conclusion to retained customer, product, technical, financial and contractual evidence [18][21].
Translate the assumption into monthly revenue, gross profit, working capital, product investment, liquidity, debt and covenant effects. Identify the accountable owner, definition, measurement method, dependency, decision date and evidence threshold. Reconcile commercial systems, accounting records, product telemetry, infrastructure invoices and the financing model.
The principal risk is that historical gross margin can benefit from support that expires after completion. Quantify the effect on sustainable free cash flow, revolving-credit availability, leverage, debt-service coverage, minimum liquidity, refinancing and equity value. Show base, retention-shock, compute-shock, platform-disruption and obsolescence cases with explicit management responses.
Retain the source, model version, reviewer, technical approval and investment committee response. Compare forecast retention, usage, cost, product performance and cash with realised outcomes; remove unsupported adjustments; and assign every exception an owner and deadline.
19. Test model-provider dependency
The transaction team should map proprietary and open models, contractual rights, rate limits, pricing, regions, portability and exit effort. The required output is a model-dependency register. Use dated source data and link each material conclusion to retained customer, product, technical, financial and contractual evidence [3][22].
Translate the assumption into monthly revenue, gross profit, working capital, product investment, liquidity, debt and covenant effects. Identify the accountable owner, definition, measurement method, dependency, decision date and evidence threshold. Reconcile commercial systems, accounting records, product telemetry, infrastructure invoices and the financing model.
The principal risk is that a provider change can alter product quality, cost or availability. Quantify the effect on sustainable free cash flow, revolving-credit availability, leverage, debt-service coverage, minimum liquidity, refinancing and equity value. Show base, retention-shock, compute-shock, platform-disruption and obsolescence cases with explicit management responses.
Retain the source, model version, reviewer, technical approval and investment committee response. Compare forecast retention, usage, cost, product performance and cash with realised outcomes; remove unsupported adjustments; and assign every exception an owner and deadline.
20. Test data rights and provenance
The transaction team should verify collection, licence, consent, restriction, residency, retention and deletion terms for material datasets. The required output is a data-rights schedule. Use dated source data and link each material conclusion to retained customer, product, technical, financial and contractual evidence [3][23].
Translate the assumption into monthly revenue, gross profit, working capital, product investment, liquidity, debt and covenant effects. Identify the accountable owner, definition, measurement method, dependency, decision date and evidence threshold. Reconcile commercial systems, accounting records, product telemetry, infrastructure invoices and the financing model.
The principal risk is that commercial performance can depend on data the company cannot lawfully reuse. Quantify the effect on sustainable free cash flow, revolving-credit availability, leverage, debt-service coverage, minimum liquidity, refinancing and equity value. Show base, retention-shock, compute-shock, platform-disruption and obsolescence cases with explicit management responses.
Retain the source, model version, reviewer, technical approval and investment committee response. Compare forecast retention, usage, cost, product performance and cash with realised outcomes; remove unsupported adjustments; and assign every exception an owner and deadline.
21. Verify intellectual property
The transaction team should reconcile employees, contractors, assignments, open-source components, patents, trade secrets and third-party licences. The required output is an IP chain-of-title file. Use dated source data and link each material conclusion to retained customer, product, technical, financial and contractual evidence [3][24].
Translate the assumption into monthly revenue, gross profit, working capital, product investment, liquidity, debt and covenant effects. Identify the accountable owner, definition, measurement method, dependency, decision date and evidence threshold. Reconcile commercial systems, accounting records, product telemetry, infrastructure invoices and the financing model.
The principal risk is that valuable code or models can carry ownership or licence defects. Quantify the effect on sustainable free cash flow, revolving-credit availability, leverage, debt-service coverage, minimum liquidity, refinancing and equity value. Show base, retention-shock, compute-shock, platform-disruption and obsolescence cases with explicit management responses.
Retain the source, model version, reviewer, technical approval and investment committee response. Compare forecast retention, usage, cost, product performance and cash with realised outcomes; remove unsupported adjustments; and assign every exception an owner and deadline.
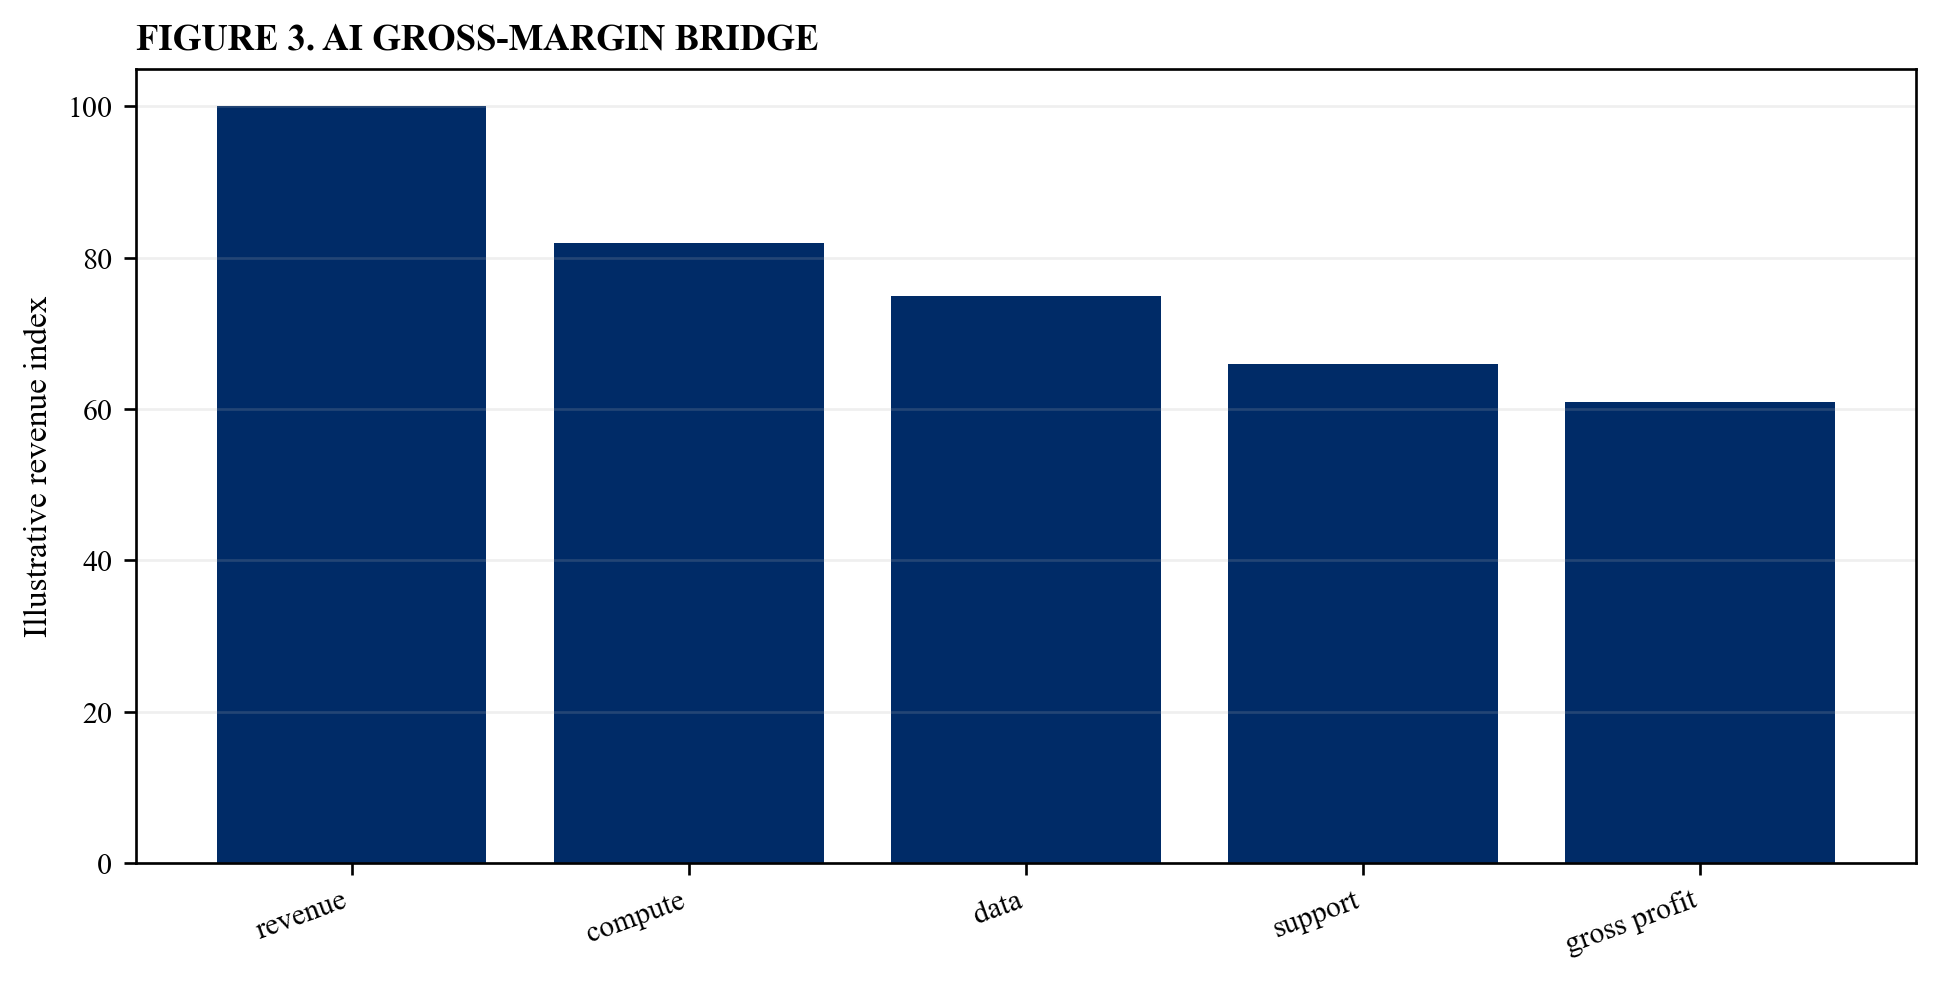
Illustrative analytical scenario; verified customer, product and transaction evidence should replace index values.
22. Assess software security
The transaction team should review secure development, vulnerability management, access, logging, incident history, recovery and supplier controls. The required output is a security-control assessment. Use dated source data and link each material conclusion to retained customer, product, technical, financial and contractual evidence [14][25].
Translate the assumption into monthly revenue, gross profit, working capital, product investment, liquidity, debt and covenant effects. Identify the accountable owner, definition, measurement method, dependency, decision date and evidence threshold. Reconcile commercial systems, accounting records, product telemetry, infrastructure invoices and the financing model.
The principal risk is that a breach or material vulnerability can damage retention, cash and financing capacity. Quantify the effect on sustainable free cash flow, revolving-credit availability, leverage, debt-service coverage, minimum liquidity, refinancing and equity value. Show base, retention-shock, compute-shock, platform-disruption and obsolescence cases with explicit management responses.
Retain the source, model version, reviewer, technical approval and investment committee response. Compare forecast retention, usage, cost, product performance and cash with realised outcomes; remove unsupported adjustments; and assign every exception an owner and deadline.
23. Assess AI trustworthiness
The transaction team should map validity, reliability, safety, security, transparency, privacy, bias and accountability controls to use cases. The required output is an AI risk register. Use dated source data and link each material conclusion to retained customer, product, technical, financial and contractual evidence [15][19].
Translate the assumption into monthly revenue, gross profit, working capital, product investment, liquidity, debt and covenant effects. Identify the accountable owner, definition, measurement method, dependency, decision date and evidence threshold. Reconcile commercial systems, accounting records, product telemetry, infrastructure invoices and the financing model.
The principal risk is that model performance can fail outside a narrow benchmark or controlled environment. Quantify the effect on sustainable free cash flow, revolving-credit availability, leverage, debt-service coverage, minimum liquidity, refinancing and equity value. Show base, retention-shock, compute-shock, platform-disruption and obsolescence cases with explicit management responses.
Retain the source, model version, reviewer, technical approval and investment committee response. Compare forecast retention, usage, cost, product performance and cash with realised outcomes; remove unsupported adjustments; and assign every exception an owner and deadline.
24. Map regulatory exposure
The transaction team should identify applicable AI, privacy, consumer, sector, export and operational-resilience obligations by product and geography. The required output is a regulatory implementation plan. Use dated source data and link each material conclusion to retained customer, product, technical, financial and contractual evidence [23][26].
Translate the assumption into monthly revenue, gross profit, working capital, product investment, liquidity, debt and covenant effects. Identify the accountable owner, definition, measurement method, dependency, decision date and evidence threshold. Reconcile commercial systems, accounting records, product telemetry, infrastructure invoices and the financing model.
The principal risk is that compliance work can require material product investment or constrain use cases. Quantify the effect on sustainable free cash flow, revolving-credit availability, leverage, debt-service coverage, minimum liquidity, refinancing and equity value. Show base, retention-shock, compute-shock, platform-disruption and obsolescence cases with explicit management responses.
Retain the source, model version, reviewer, technical approval and investment committee response. Compare forecast retention, usage, cost, product performance and cash with realised outcomes; remove unsupported adjustments; and assign every exception an owner and deadline.
Table 3. Technology-risk register
| Risk | Evidence | Decision |
|---|---|---|
| dependency | contract and architecture | portability funded |
| security | testing and incidents | exposure bounded |
| regulation | obligation map | roadmap funded |
| obsolescence | repeated benchmark | terminal case reset |
Illustrative control framework; verified transaction evidence and executed documents govern.
25. Benchmark product performance
The transaction team should retain dated evaluations, representative datasets, failure thresholds, human baselines and competitor comparisons. The required output is a reproducible benchmark pack. Use dated source data and link each material conclusion to retained customer, product, technical, financial and contractual evidence [15][19].
Translate the assumption into monthly revenue, gross profit, working capital, product investment, liquidity, debt and covenant effects. Identify the accountable owner, definition, measurement method, dependency, decision date and evidence threshold. Reconcile commercial systems, accounting records, product telemetry, infrastructure invoices and the financing model.
The principal risk is that marketing claims can remain static while market performance advances. Quantify the effect on sustainable free cash flow, revolving-credit availability, leverage, debt-service coverage, minimum liquidity, refinancing and equity value. Show base, retention-shock, compute-shock, platform-disruption and obsolescence cases with explicit management responses.
Retain the source, model version, reviewer, technical approval and investment committee response. Compare forecast retention, usage, cost, product performance and cash with realised outcomes; remove unsupported adjustments; and assign every exception an owner and deadline.
26. Measure benchmark decay
The transaction team should repeat evaluations after model, prompt, data, infrastructure and competitor changes. The required output is a performance-decay curve. Use dated source data and link each material conclusion to retained customer, product, technical, financial and contractual evidence [15][20].
Translate the assumption into monthly revenue, gross profit, working capital, product investment, liquidity, debt and covenant effects. Identify the accountable owner, definition, measurement method, dependency, decision date and evidence threshold. Reconcile commercial systems, accounting records, product telemetry, infrastructure invoices and the financing model.
The principal risk is that the product can lose differentiation within the debt hold period. Quantify the effect on sustainable free cash flow, revolving-credit availability, leverage, debt-service coverage, minimum liquidity, refinancing and equity value. Show base, retention-shock, compute-shock, platform-disruption and obsolescence cases with explicit management responses.
Retain the source, model version, reviewer, technical approval and investment committee response. Compare forecast retention, usage, cost, product performance and cash with realised outcomes; remove unsupported adjustments; and assign every exception an owner and deadline.
27. Map the product roadmap
The transaction team should link each committed feature to customer demand, technical dependency, cost, release evidence and commercial outcome. The required output is an evidence-led roadmap. Use dated source data and link each material conclusion to retained customer, product, technical, financial and contractual evidence [4][16].
Translate the assumption into monthly revenue, gross profit, working capital, product investment, liquidity, debt and covenant effects. Identify the accountable owner, definition, measurement method, dependency, decision date and evidence threshold. Reconcile commercial systems, accounting records, product telemetry, infrastructure invoices and the financing model.
The principal risk is that the acquisition case can assume features without funded delivery capacity. Quantify the effect on sustainable free cash flow, revolving-credit availability, leverage, debt-service coverage, minimum liquidity, refinancing and equity value. Show base, retention-shock, compute-shock, platform-disruption and obsolescence cases with explicit management responses.
Retain the source, model version, reviewer, technical approval and investment committee response. Compare forecast retention, usage, cost, product performance and cash with realised outcomes; remove unsupported adjustments; and assign every exception an owner and deadline.
28. Quantify continuing reinvestment
The transaction team should forecast engineering, data, compute, security, compliance and migration cash needed to preserve competitiveness. The required output is a sustaining-product-investment bridge. Use dated source data and link each material conclusion to retained customer, product, technical, financial and contractual evidence [4][20].
Translate the assumption into monthly revenue, gross profit, working capital, product investment, liquidity, debt and covenant effects. Identify the accountable owner, definition, measurement method, dependency, decision date and evidence threshold. Reconcile commercial systems, accounting records, product telemetry, infrastructure invoices and the financing model.
The principal risk is that asset-light accounting can conceal economically mandatory reinvestment. Quantify the effect on sustainable free cash flow, revolving-credit availability, leverage, debt-service coverage, minimum liquidity, refinancing and equity value. Show base, retention-shock, compute-shock, platform-disruption and obsolescence cases with explicit management responses.
Retain the source, model version, reviewer, technical approval and investment committee response. Compare forecast retention, usage, cost, product performance and cash with realised outcomes; remove unsupported adjustments; and assign every exception an owner and deadline.
29. Build the base case
The transaction team should combine verified retention, pricing, usage, compute, support, reinvestment and working capital. The required output is a customer-and-product-led forecast. Use dated source data and link each material conclusion to retained customer, product, technical, financial and contractual evidence [2][7].
Translate the assumption into monthly revenue, gross profit, working capital, product investment, liquidity, debt and covenant effects. Identify the accountable owner, definition, measurement method, dependency, decision date and evidence threshold. Reconcile commercial systems, accounting records, product telemetry, infrastructure invoices and the financing model.
The principal risk is that management forecasts can extrapolate headline ARR without operating drivers. Quantify the effect on sustainable free cash flow, revolving-credit availability, leverage, debt-service coverage, minimum liquidity, refinancing and equity value. Show base, retention-shock, compute-shock, platform-disruption and obsolescence cases with explicit management responses.
Retain the source, model version, reviewer, technical approval and investment committee response. Compare forecast retention, usage, cost, product performance and cash with realised outcomes; remove unsupported adjustments; and assign every exception an owner and deadline.
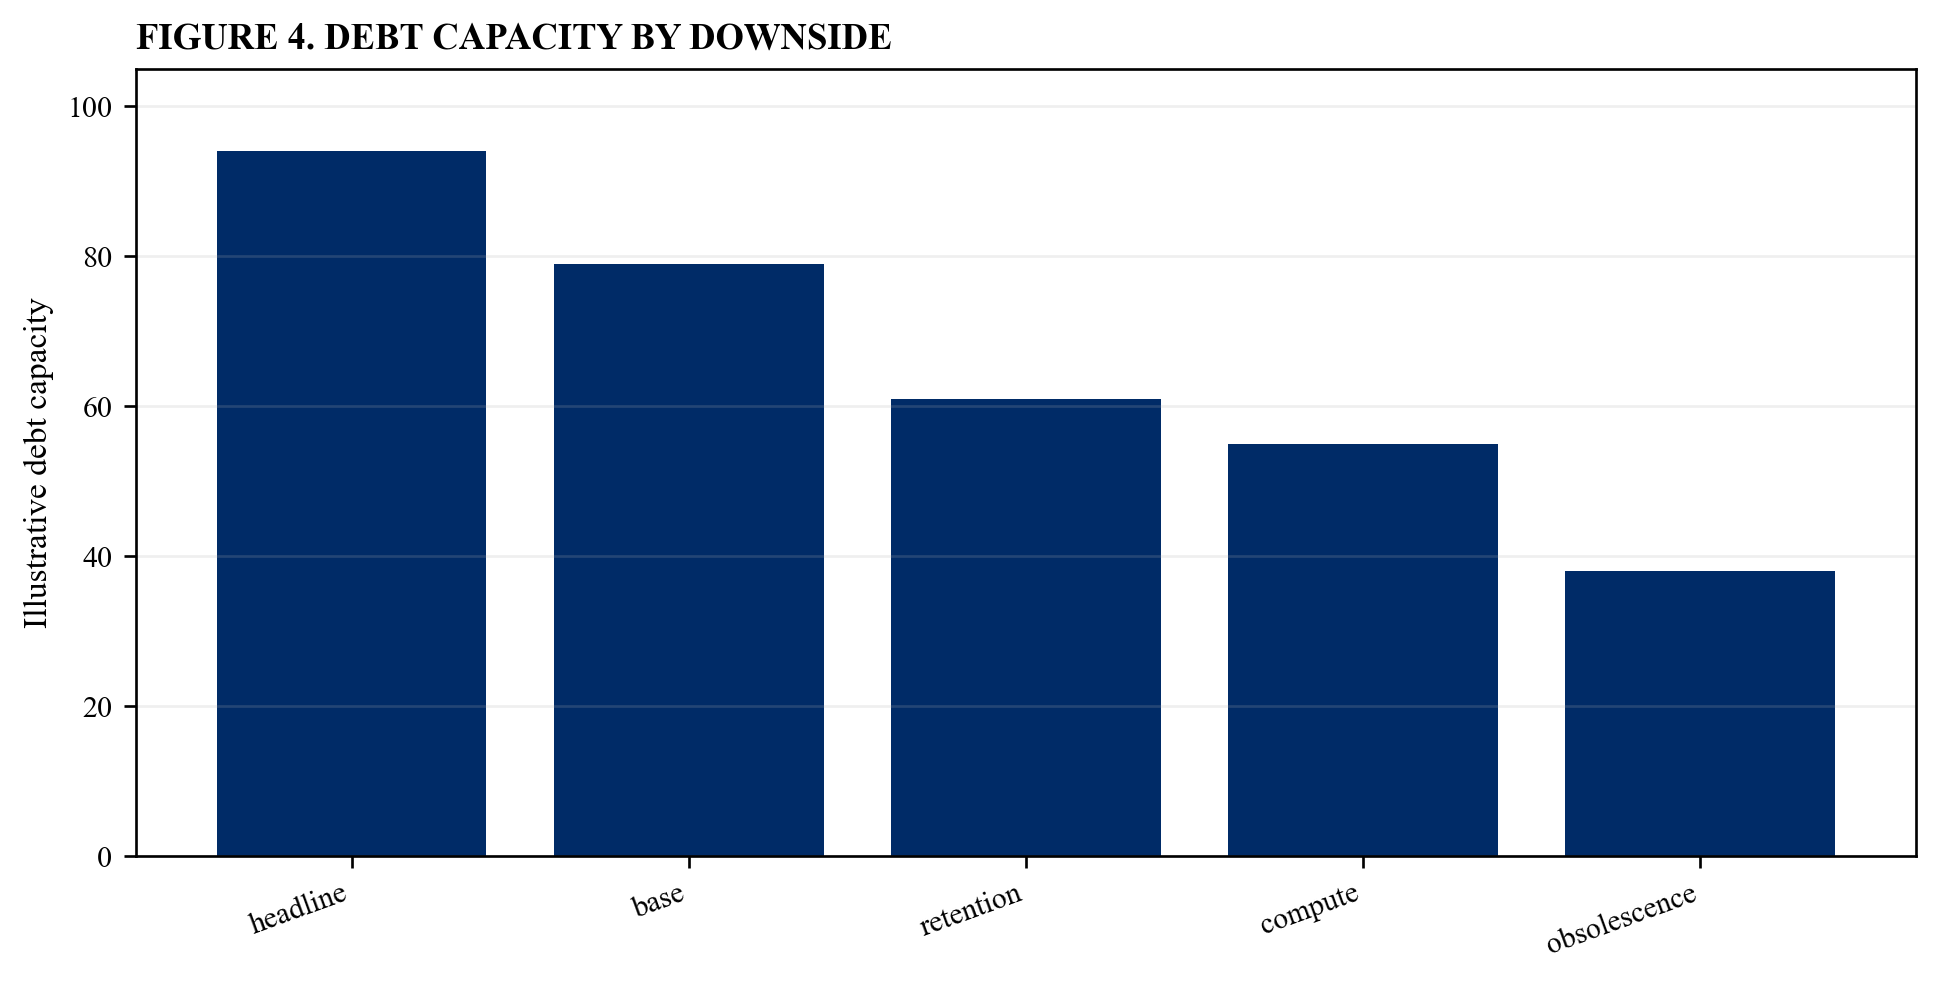
Illustrative analytical scenario; verified customer, product and transaction evidence should replace index values.
30. Build the retention-shock case
The transaction team should apply churn, contraction, delayed renewal, weaker expansion and customer concentration events. The required output is a retention downside. Use dated source data and link each material conclusion to retained customer, product, technical, financial and contractual evidence [7][11].
Translate the assumption into monthly revenue, gross profit, working capital, product investment, liquidity, debt and covenant effects. Identify the accountable owner, definition, measurement method, dependency, decision date and evidence threshold. Reconcile commercial systems, accounting records, product telemetry, infrastructure invoices and the financing model.
The principal risk is that cash can decline faster than reported annualised metrics. Quantify the effect on sustainable free cash flow, revolving-credit availability, leverage, debt-service coverage, minimum liquidity, refinancing and equity value. Show base, retention-shock, compute-shock, platform-disruption and obsolescence cases with explicit management responses.
Retain the source, model version, reviewer, technical approval and investment committee response. Compare forecast retention, usage, cost, product performance and cash with realised outcomes; remove unsupported adjustments; and assign every exception an owner and deadline.
31. Build the compute-shock case
The transaction team should apply provider repricing, higher usage, model migration, capacity constraints and credit expiry. The required output is a compute downside. Use dated source data and link each material conclusion to retained customer, product, technical, financial and contractual evidence [17][21].
Translate the assumption into monthly revenue, gross profit, working capital, product investment, liquidity, debt and covenant effects. Identify the accountable owner, definition, measurement method, dependency, decision date and evidence threshold. Reconcile commercial systems, accounting records, product telemetry, infrastructure invoices and the financing model.
The principal risk is that gross margin can compress before pricing or architecture can respond. Quantify the effect on sustainable free cash flow, revolving-credit availability, leverage, debt-service coverage, minimum liquidity, refinancing and equity value. Show base, retention-shock, compute-shock, platform-disruption and obsolescence cases with explicit management responses.
Retain the source, model version, reviewer, technical approval and investment committee response. Compare forecast retention, usage, cost, product performance and cash with realised outcomes; remove unsupported adjustments; and assign every exception an owner and deadline.
32. Build the platform-disruption case
The transaction team should model provider withdrawal, API restriction, region loss, open-source substitution and forced migration. The required output is a platform-contingency case. Use dated source data and link each material conclusion to retained customer, product, technical, financial and contractual evidence [22][25].
Translate the assumption into monthly revenue, gross profit, working capital, product investment, liquidity, debt and covenant effects. Identify the accountable owner, definition, measurement method, dependency, decision date and evidence threshold. Reconcile commercial systems, accounting records, product telemetry, infrastructure invoices and the financing model.
The principal risk is that the product can lose a critical dependency or price advantage. Quantify the effect on sustainable free cash flow, revolving-credit availability, leverage, debt-service coverage, minimum liquidity, refinancing and equity value. Show base, retention-shock, compute-shock, platform-disruption and obsolescence cases with explicit management responses.
Retain the source, model version, reviewer, technical approval and investment committee response. Compare forecast retention, usage, cost, product performance and cash with realised outcomes; remove unsupported adjustments; and assign every exception an owner and deadline.
Table 4. Downside architecture
| Case | Primary pressure | Decision use |
|---|---|---|
| retention | churn and contraction | revenue resilience |
| compute | unit-cost increase | margin resilience |
| platform | forced migration | liquidity reserve |
| obsolescence | lower terminal value | equity protection |
Illustrative control framework; verified transaction evidence and executed documents govern.
33. Build the obsolescence case
The transaction team should model benchmark convergence, customer insourcing, new architecture, regulation and declining willingness to pay. The required output is an obsolescence case. Use dated source data and link each material conclusion to retained customer, product, technical, financial and contractual evidence [15][20].
Translate the assumption into monthly revenue, gross profit, working capital, product investment, liquidity, debt and covenant effects. Identify the accountable owner, definition, measurement method, dependency, decision date and evidence threshold. Reconcile commercial systems, accounting records, product telemetry, infrastructure invoices and the financing model.
The principal risk is that terminal value can fall while reinvestment rises. Quantify the effect on sustainable free cash flow, revolving-credit availability, leverage, debt-service coverage, minimum liquidity, refinancing and equity value. Show base, retention-shock, compute-shock, platform-disruption and obsolescence cases with explicit management responses.
Retain the source, model version, reviewer, technical approval and investment committee response. Compare forecast retention, usage, cost, product performance and cash with realised outcomes; remove unsupported adjustments; and assign every exception an owner and deadline.
34. Calculate sustainable free cash flow
The transaction team should deduct cash tax, working capital, compute, customer success, security, compliance and product reinvestment. The required output is a sustainable cash bridge. Use dated source data and link each material conclusion to retained customer, product, technical, financial and contractual evidence [2][6].
Translate the assumption into monthly revenue, gross profit, working capital, product investment, liquidity, debt and covenant effects. Identify the accountable owner, definition, measurement method, dependency, decision date and evidence threshold. Reconcile commercial systems, accounting records, product telemetry, infrastructure invoices and the financing model.
The principal risk is that reported EBITDA can overstate distributable cash. Quantify the effect on sustainable free cash flow, revolving-credit availability, leverage, debt-service coverage, minimum liquidity, refinancing and equity value. Show base, retention-shock, compute-shock, platform-disruption and obsolescence cases with explicit management responses.
Retain the source, model version, reviewer, technical approval and investment committee response. Compare forecast retention, usage, cost, product performance and cash with realised outcomes; remove unsupported adjustments; and assign every exception an owner and deadline.
35. Size sustainable leverage
The transaction team should test interest, amortisation, covenant headroom and minimum liquidity under every operating case. The required output is an evidence-led debt-capacity model. Use dated source data and link each material conclusion to retained customer, product, technical, financial and contractual evidence [1][2].
Translate the assumption into monthly revenue, gross profit, working capital, product investment, liquidity, debt and covenant effects. Identify the accountable owner, definition, measurement method, dependency, decision date and evidence threshold. Reconcile commercial systems, accounting records, product telemetry, infrastructure invoices and the financing model.
The principal risk is that leverage can rely on retention and margin assumptions with no measurable control. Quantify the effect on sustainable free cash flow, revolving-credit availability, leverage, debt-service coverage, minimum liquidity, refinancing and equity value. Show base, retention-shock, compute-shock, platform-disruption and obsolescence cases with explicit management responses.
Retain the source, model version, reviewer, technical approval and investment committee response. Compare forecast retention, usage, cost, product performance and cash with realised outcomes; remove unsupported adjustments; and assign every exception an owner and deadline.
36. Recalculate entry valuation
The transaction team should compare enterprise value with accounting earnings, recurring gross profit and sustainable free cash flow. The required output is a valuation reconciliation. Use dated source data and link each material conclusion to retained customer, product, technical, financial and contractual evidence [6][7].
Translate the assumption into monthly revenue, gross profit, working capital, product investment, liquidity, debt and covenant effects. Identify the accountable owner, definition, measurement method, dependency, decision date and evidence threshold. Reconcile commercial systems, accounting records, product telemetry, infrastructure invoices and the financing model.
The principal risk is that a premium software multiple can persist after software economics have weakened. Quantify the effect on sustainable free cash flow, revolving-credit availability, leverage, debt-service coverage, minimum liquidity, refinancing and equity value. Show base, retention-shock, compute-shock, platform-disruption and obsolescence cases with explicit management responses.
Retain the source, model version, reviewer, technical approval and investment committee response. Compare forecast retention, usage, cost, product performance and cash with realised outcomes; remove unsupported adjustments; and assign every exception an owner and deadline.
37. Recalculate equity returns
The transaction team should integrate debt paydown, reinvestment, dilution, refinancing, exit retention and exit technology position. The required output is a technology-adjusted equity case. Use dated source data and link each material conclusion to retained customer, product, technical, financial and contractual evidence [1][4].
Translate the assumption into monthly revenue, gross profit, working capital, product investment, liquidity, debt and covenant effects. Identify the accountable owner, definition, measurement method, dependency, decision date and evidence threshold. Reconcile commercial systems, accounting records, product telemetry, infrastructure invoices and the financing model.
The principal risk is that returns can depend on multiple persistence rather than cash delivery. Quantify the effect on sustainable free cash flow, revolving-credit availability, leverage, debt-service coverage, minimum liquidity, refinancing and equity value. Show base, retention-shock, compute-shock, platform-disruption and obsolescence cases with explicit management responses.
Retain the source, model version, reviewer, technical approval and investment committee response. Compare forecast retention, usage, cost, product performance and cash with realised outcomes; remove unsupported adjustments; and assign every exception an owner and deadline.
38. Negotiate transaction protection
The transaction team should translate diligence findings into price, earn-out, rollover, escrow, warranty, indemnity, covenant and funding terms. The required output is a technology-risk negotiation map. Use dated source data and link each material conclusion to retained customer, product, technical, financial and contractual evidence [3][25].
Translate the assumption into monthly revenue, gross profit, working capital, product investment, liquidity, debt and covenant effects. Identify the accountable owner, definition, measurement method, dependency, decision date and evidence threshold. Reconcile commercial systems, accounting records, product telemetry, infrastructure invoices and the financing model.
The principal risk is that technical findings can remain descriptive and fail to change transaction economics. Quantify the effect on sustainable free cash flow, revolving-credit availability, leverage, debt-service coverage, minimum liquidity, refinancing and equity value. Show base, retention-shock, compute-shock, platform-disruption and obsolescence cases with explicit management responses.
Retain the source, model version, reviewer, technical approval and investment committee response. Compare forecast retention, usage, cost, product performance and cash with realised outcomes; remove unsupported adjustments; and assign every exception an owner and deadline.
39. Build the monthly control system
The transaction team should track retention, bookings, usage, compute, support, benchmark, incidents, roadmap and cash against the underwriting case. The required output is an integrated operating dashboard. Use dated source data and link each material conclusion to retained customer, product, technical, financial and contractual evidence [14][16].
Translate the assumption into monthly revenue, gross profit, working capital, product investment, liquidity, debt and covenant effects. Identify the accountable owner, definition, measurement method, dependency, decision date and evidence threshold. Reconcile commercial systems, accounting records, product telemetry, infrastructure invoices and the financing model.
The principal risk is that financial deterioration can appear after customer or product evidence has already changed. Quantify the effect on sustainable free cash flow, revolving-credit availability, leverage, debt-service coverage, minimum liquidity, refinancing and equity value. Show base, retention-shock, compute-shock, platform-disruption and obsolescence cases with explicit management responses.
Retain the source, model version, reviewer, technical approval and investment committee response. Compare forecast retention, usage, cost, product performance and cash with realised outcomes; remove unsupported adjustments; and assign every exception an owner and deadline.
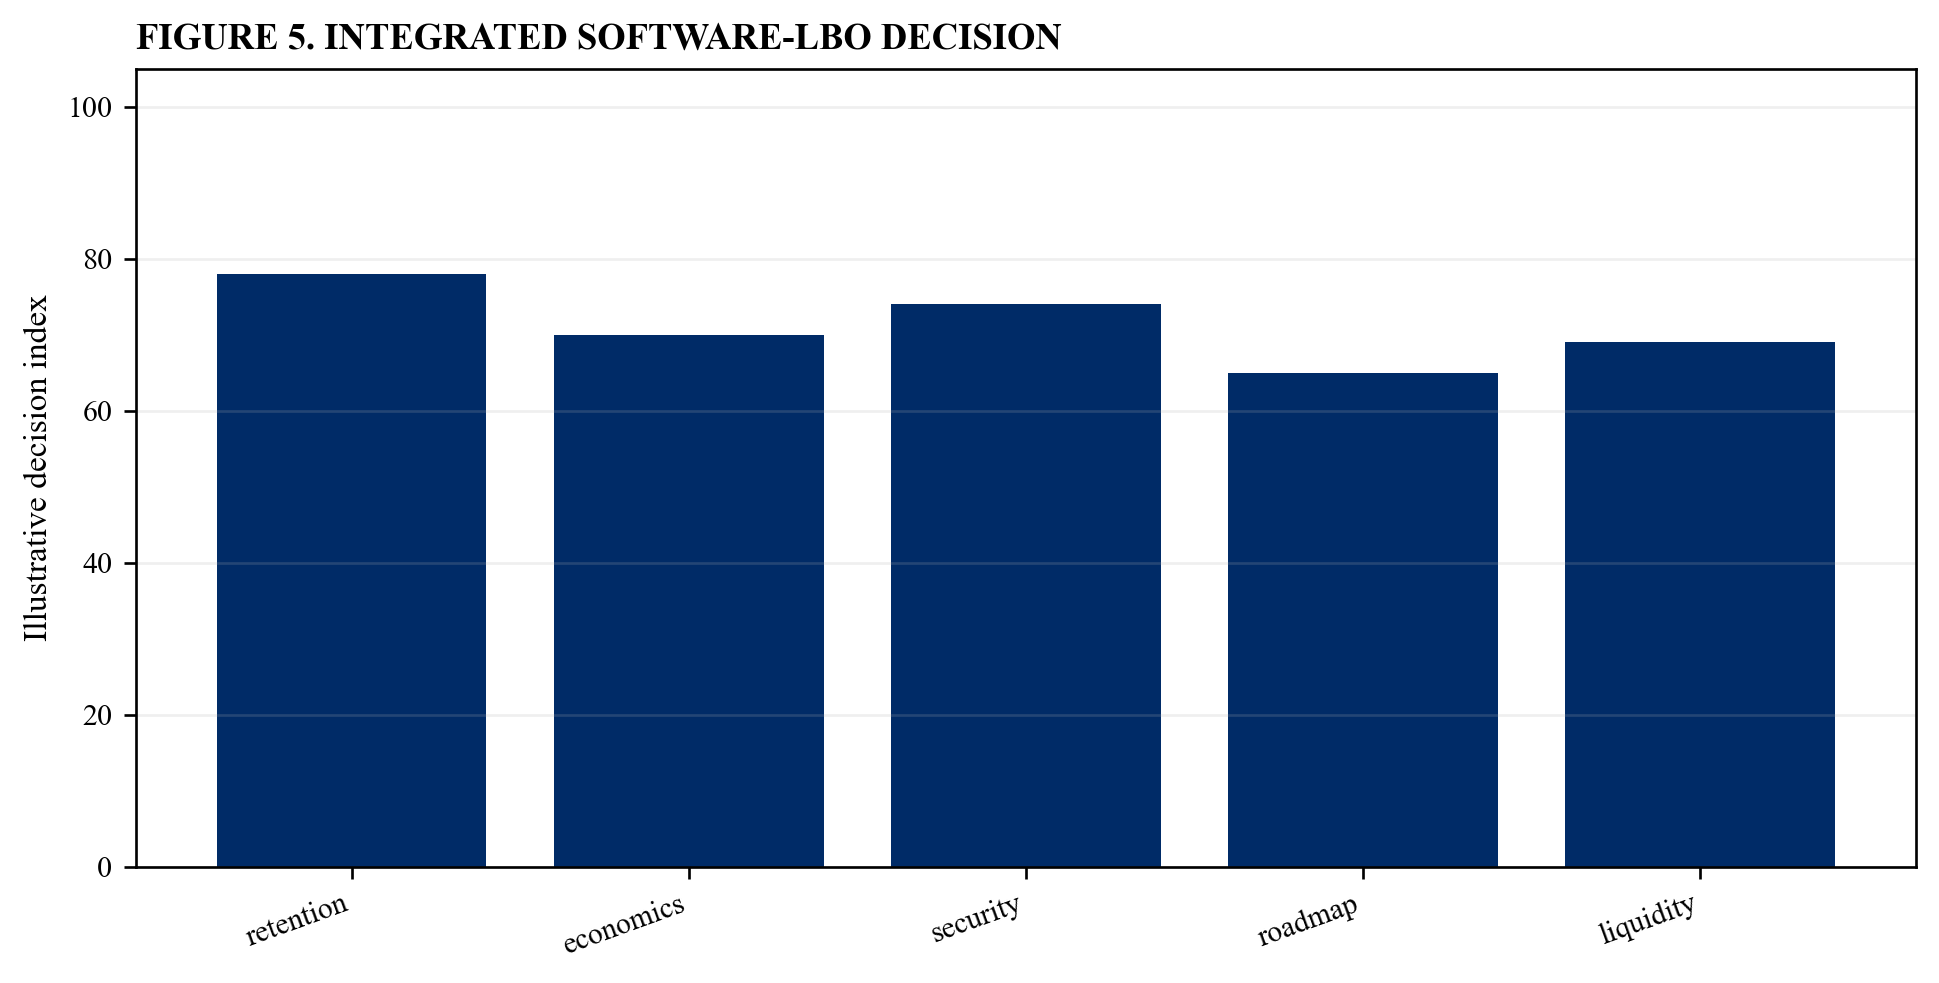
Illustrative analytical scenario; verified customer, product and transaction evidence should replace index values.
40. Issue the investment committee certificate
The transaction team should approve revenue evidence, retention quality, compute economics, product resilience, liquidity, leverage and exit assumptions. The required output is a retained underwriting certificate. Use dated source data and link each material conclusion to retained customer, product, technical, financial and contractual evidence [1][2].
Translate the assumption into monthly revenue, gross profit, working capital, product investment, liquidity, debt and covenant effects. Identify the accountable owner, definition, measurement method, dependency, decision date and evidence threshold. Reconcile commercial systems, accounting records, product telemetry, infrastructure invoices and the financing model.
The principal risk is that the committee can approve debt against metrics that have no common definition or reproducible evidence. Quantify the effect on sustainable free cash flow, revolving-credit availability, leverage, debt-service coverage, minimum liquidity, refinancing and equity value. Show base, retention-shock, compute-shock, platform-disruption and obsolescence cases with explicit management responses.
Retain the source, model version, reviewer, technical approval and investment committee response. Compare forecast retention, usage, cost, product performance and cash with realised outcomes; remove unsupported adjustments; and assign every exception an owner and deadline.
Table 5. Investment committee certificate
| Conclusion | Evidence | Approval test |
|---|---|---|
| revenue quality | contract-to-cash bridge | reproducible |
| unit economics | customer and product cost | cash positive |
| technology | benchmark and roadmap | durable |
| debt capacity | downside cash flow | repayment credible |
Illustrative control framework; verified transaction evidence and executed documents govern.
References
- European Central Bank, Guidance on leveraged transactions, https://www.bankingsupervision.europa.eu/ecb/pub/pdf/ssm.leveraged_transactions_guidance_201705.en.pdf
- European Banking Authority, Guidelines on leveraged transactions, https://www.eba.europa.eu/sites/default/files/documents/10180/1696305/1dba7657-6ccb-462a-b9f8-8df8686b9807/Final%20Guidelines%20on%20Leveraged%20Transactions.pdf
- UK Competition and Markets Authority, Merger assessment guidelines, https://www.gov.uk/government/publications/merger-assessment-guidelines
- International Valuation Standards Council, International Valuation Standards, https://www.ivsc.org/standards/
- IFRS Foundation, IFRS 15 Revenue from Contracts with Customers, https://www.ifrs.org/issued-standards/list-of-standards/ifrs-15-revenue-from-contracts-with-customers/
- IFRS Foundation, IAS 7 Statement of Cash Flows, https://www.ifrs.org/issued-standards/list-of-standards/ias-7-statement-of-cash-flows/
- US Securities and Exchange Commission, Non-GAAP financial measures compliance and disclosure interpretations, https://www.sec.gov/corpfin/non-gaap-financial-measures.htm
- IFRS Foundation, IFRS 8 Operating Segments, https://www.ifrs.org/issued-standards/list-of-standards/ifrs-8-operating-segments/
- IFRS Foundation, IFRS 12 Disclosure of Interests in Other Entities, https://www.ifrs.org/issued-standards/list-of-standards/ifrs-12-disclosure-of-interests-in-other-entities/
- IFRS Foundation, IFRS 15 post-implementation review, https://www.ifrs.org/projects/completed-projects/2024/pir-ifrs-15/
- IFRS Foundation, IFRS 9 Financial Instruments, https://www.ifrs.org/issued-standards/list-of-standards/ifrs-9-financial-instruments/
- UK Financial Conduct Authority, Consumer Duty, https://www.fca.org.uk/firms/consumer-duty
- UK Government, Digital Markets Competition and Consumers Act 2024, https://www.legislation.gov.uk/ukpga/2024/13/contents
- National Institute of Standards and Technology, Secure Software Development Framework, https://csrc.nist.gov/pubs/sp/800/218/final
- National Institute of Standards and Technology, Artificial Intelligence Risk Management Framework, https://www.nist.gov/itl/ai-risk-management-framework
- OECD, G20 OECD Principles of Corporate Governance 2023, https://www.oecd.org/corporate/principles-corporate-governance/
- FinOps Foundation, FinOps Framework, https://www.finops.org/framework/
- UK Competition and Markets Authority, Cloud services market investigation, https://www.gov.uk/cma-cases/cloud-services-market-investigation
- National Institute of Standards and Technology, Generative AI Profile NIST AI 600-1, https://nvlpubs.nist.gov/nistpubs/ai/NIST.AI.600-1.pdf
- IFRS Foundation, IAS 38 Intangible Assets, https://www.ifrs.org/issued-standards/list-of-standards/ias-38-intangible-assets/
- IFRS Foundation, IAS 37 Provisions Contingent Liabilities and Contingent Assets, https://www.ifrs.org/issued-standards/list-of-standards/ias-37-provisions-contingent-liabilities-and-contingent-assets/
- US National Institute of Standards and Technology, AI RMF Playbook, https://www.nist.gov/itl/ai-risk-management-framework/nist-ai-rmf-playbook
- European Commission, AI Act regulatory framework, https://digital-strategy.ec.europa.eu/en/policies/regulatory-framework-ai
- World Intellectual Property Organization, WIPO Guide to Trade Secrets and Innovation, https://www.wipo.int/publications/en/details.jsp?id=4661
- US Cybersecurity and Infrastructure Security Agency, Secure by Design, https://www.cisa.gov/securebydesign
- UK Information Commissioner's Office, Guidance on AI and data protection, https://ico.org.uk/for-organisations/uk-gdpr-guidance-and-resources/artificial-intelligence/
