

1. Make scarcity an explicit portfolio condition
A utility capital plan becomes a portfolio when decision makers can compare competing uses of money, delivery capacity and institutional attention. The starting point is a quantified constraint. The constraint may be an approved annual capital envelope, a regulated allowed-revenue profile, a government appropriation, committed financing, borrowing capacity, skilled-resource availability, supply-chain capacity or a combination of these factors. Without an explicit constraint, prioritisation becomes a list of desirable projects rather than a choice among feasible programmes.
The volume of infrastructure demand makes this discipline increasingly important. The International Energy Agency reports that more than 2,500 gigawatts of renewable generation, large-load and storage projects are stalled in grid queues worldwide. It estimates that annual grid investment must rise by roughly 50 per cent by 2030 from around USD 400 billion today.[1] The IEA's 2026 investment outlook projects grid spending approaching USD 550 billion during the year and describes wider electricity supply and infrastructure investment approaching USD 1.6 trillion.[2] These are global estimates. They establish the scale of system pressure and cannot determine the needs or affordability of an individual utility.
Delivery time also creates scarcity. The IEA reports that grid projects can take five to fifteen years, while many renewable projects, data centres and electric-vehicle charging facilities can be developed more quickly. It also notes that prices for key grid components have nearly doubled over five years.[1] A portfolio cannot assume that nominal budget approval immediately creates a deliverable asset. The sequence of design, permits, land, connection, procurement, manufacture, construction, commissioning and operational integration needs to be reflected in both prioritisation and cash flow.
Water utilities face a similar combination of service need, asset condition, environmental obligations and affordability. Ofwat's final determinations for 2025-2030 set a total investment programme of about GBP 104 billion for England and Wales, including around GBP 44 billion for new infrastructure and resources.[12] The regulator connects funding to service outcomes, performance commitments and delivery controls.[13][14] Those arrangements are jurisdiction-specific. Their wider lesson is that capital authority, customer outcomes, affordability and accountability need to remain connected.
The capital programme office should therefore publish three constraints at the beginning of each planning cycle: available funding by year and source; scarce delivery resources by discipline; and the service, safety, legal or environmental obligations that cannot be treated as ordinary discretionary choices. These constraints form the boundary within which portfolio optimisation can operate.
2. Give the programme office a clear mandate
The utility capital programme office owns the decision system from need identification through portfolio approval, delivery oversight and benefits realisation. It does not replace the asset owner, project sponsor, engineering authority, procurement function, finance team or executive committee. It integrates their evidence, maintains the controlled portfolio record and ensures that decisions follow approved gates and delegations.
The office should maintain one project register across grid and water programmes. Each record needs a stable identifier, sponsoring service, problem statement, legal or regulatory basis, demand or condition evidence, options considered, preferred scope, capital and operating cost, schedule, dependencies, delivery route, risks, benefits, funding source and decision history. Material changes need version control. A project that changes scope, cost or delivery date should not retain an unchanged priority score without review.
Decision rights should be explicit. The utility board or governing authority approves the capital envelope, policy weights, mandatory-obligation rules and major commitments. An investment committee approves portfolio entries, stage-gate advancement and material exceptions within delegated limits. The programme office prepares the comparative analysis and records decisions. Asset owners define the service need and own benefit delivery. Engineering validates technical scope and estimate maturity. Finance validates affordability, economic and financial analysis, funding and covenant effects. Procurement validates market strategy. Risk, legal and environmental functions certify compliance and unresolved exposure.
The office also needs authority to return incomplete submissions. A project sponsor should not be able to secure a place in the funded portfolio through an attractive narrative, an unchallenged urgency label or sunk design effort. The project must satisfy the same evidence standard as competing proposals, subject to controlled treatment for emergencies and mandatory obligations.
Table 1. Capital programme mandate and decision rights
| Decision or artefact | Accountable owner | Programme office role | Minimum approval evidence |
|---|---|---|---|
| capital envelope and policy weights | board or governing authority | prepare scenarios and trade-offs | funding capacity, obligations, strategic outcomes and sensitivity tests |
| project need and service outcome | asset or service owner | challenge definition and evidence | demand, condition, service, safety or compliance record |
| technical option and scope | engineering authority | enforce common option record | option analysis, concept design, interfaces and estimate basis |
| affordability and funding | chief financial officer | reconcile annual cash, revenue and financing | funding source, headroom, cash profile, covenants and downside |
| portfolio entry and sequencing | investment committee | score, compare and document decision | gate result, portfolio impact, dependencies and exception record |
| procurement release | authorised procurement and project executives | confirm readiness gate | approved scope, route, budget, permits, land and market evidence |
| delivery exception | delegated executive or committee | maintain exception and recovery log | quantified impact, decision deadline, owner and recovery action |
| benefits close-out | service owner and finance | reconcile outcomes to approval case | commissioned scope, final cost, service performance and lessons |
The table provides a model governance allocation; actual delegations should follow the utility's legal and organisational framework.
3. Separate mandatory obligations from discretionary ranking
The first portfolio gate should identify obligations that have a binding service, safety, legal, environmental or emergency basis. Examples may include imminent public-safety risks, failure of a critical asset, enforceable permit conditions, statutory water-quality requirements, court or regulator directions and work required to keep an essential service operating. These items deserve explicit treatment because a weighted score should not allow a high-return discretionary project to displace a binding duty.
Mandatory status still requires discipline. The sponsor must state the exact obligation, deadline, consequence of non-compliance, minimum compliant scope and accountable authority. The programme office should test whether the proposed project is the least-cost credible response, whether an interim measure is available and whether the timing is genuinely fixed. Mandatory classification should not become a route around option appraisal, cost challenge or delivery readiness.
Projects that pass the obligation gate can follow one of three routes. A minimum intervention may be reserved within the portfolio because the duty is unavoidable. A larger enhancement can be split into mandatory and discretionary components. An emergency project can enter through an expedited gate with retrospective documentation and independent review. Each route should preserve a visible impact on the capital envelope so that decision makers understand which discretionary projects are crowded out.
The residual portfolio is then ranked. Service criticality remains a major criterion for discretionary projects, but it is evaluated alongside readiness, affordability, delivery risk and financeability. This separation creates a cleaner discussion. Executives can debate the minimum cost of obligations first, then choose the strongest remaining programme within the residual constraint.
4. Establish a minimum project data standard
Comparable decisions require comparable information. The programme office should publish a minimum project data standard with definitions, evidence owners and maturity labels. Each submission should explain the service problem before proposing an asset. It should identify affected customers, service area, asset condition, demand forecast, operating constraint and consequence of inaction. The source date and confidence of each input should be visible.
The World Bank Infrastructure Prioritization Framework combines financial-economic and social-environmental dimensions under a budget constraint and makes the weights, ranking and sensitivity process transparent.[5] The World Bank's Project Screening and Analytics Tool adds preliminary screening of project readiness, fiscal suitability and climate considerations, while stating that it does not replace a feasibility study and remains dependent on input quality.[6] These principles support a minimum standard without implying that early screening provides final investment assurance.
Cost data should distinguish base estimate, escalation, risk allowance, contingency, financing costs where relevant, operating expenditure and decommissioning or residual value. The estimate class, price date, currency, tax basis and excluded items should be stated. A single unqualified capital number prevents meaningful comparison because projects at concept and tender stage carry different levels of uncertainty.
Benefits need similar discipline. Grid projects may improve reliability, capacity, losses, connection capability, resilience or safety. Water projects may improve supply security, quality, environmental performance, leakage, treatment capacity, customer service or energy efficiency. The submission should define the baseline, measurement unit, timing, accountable owner and method of verification. Benefits that cannot be monetised can remain visible through service-criticality and outcome measures rather than being assigned unsupported monetary values.
Table 2. Minimum project data standard
| Data field | Required content | Evidence owner | Maturity test |
|---|---|---|---|
| need and baseline | service problem, affected population or load, asset condition and consequence of inaction | service owner | current source, defined boundary and quantified baseline |
| obligation | law, permit, safety, service or policy basis and deadline | legal, regulatory or asset authority | cited instrument and accountable interpretation |
| options | do minimum, demand or operational response, refurbishment and new asset choices | engineering and service owner | common assumptions and reasons for rejection |
| scope and interfaces | physical scope, network boundaries, land, utilities, systems and dependencies | engineering authority | concept or design package matched to gate |
| cost and cash | base cost, risk, contingency, escalation, operating cost and annual cash profile | project controls and finance | estimate basis, price date, range and independent challenge |
| schedule | approvals, land, procurement, construction, commissioning and service date | project director | logic-linked milestones and critical dependencies |
| outcomes | service, safety, environmental, customer and financial measures | service owner and finance | baseline, target, measurement method and owner |
| funding | budget, tariff, grant, debt, equity or other source and conditions | finance | source status, timing, restrictions and downside |
| risks | quantified threats, opportunities, allocation and mitigations | project and enterprise risk | named owner, exposure and decision deadline |
Evidence depth should increase at each gate; an early concept may use ranges, while procurement release requires approved and traceable inputs.
5. Use five decision lenses
The proposed scoring model uses five lenses. Service criticality measures the value and urgency of the need. Readiness measures whether the project has enough definition and control to advance. Affordability measures its fit with annual funding and customer or fiscal constraints. Delivery risk measures the likelihood and consequence of cost, time, scope and performance failure. Financeability measures whether suitable capital can be committed on acceptable terms.
Each lens answers a different question. Service criticality asks what happens if the project is delayed. Readiness asks whether the current proposal is mature enough for the next decision. Affordability asks when cash is required and whether the utility can absorb it. Delivery risk asks what can go wrong and how exposure is controlled. Financeability asks who can fund the project, on what basis and with what conditions.
A common scale can run from one to five, with anchored definitions. A score of five in service criticality might require severe, near-term and widely evidenced service consequences. A five in readiness might require approved design, land and permits, a market-tested procurement route and a traceable estimate. Higher delivery-risk exposure should reduce the composite result; the model can express risk as a positive control score or a negative penalty. The selected convention must remain consistent.
Weights should reflect approved policy and be tested rather than treated as objective facts. In the worked example, service criticality receives 30 per cent, readiness 20 per cent, affordability 20 per cent, delivery-risk control 15 per cent and financeability 15 per cent. These percentages are hypothetical modelling assumptions. The committee should view the result under alternative weights and identify projects whose position changes materially.
Red-line rules sit above the weighted score. A project cannot enter procurement if a required land right is absent, a statutory approval path is undefined, the funding source is unavailable or a critical safety hazard remains unmanaged. A project can be ranked for development funding while failing the procurement gate. This distinction avoids confusing strategic importance with readiness to commit major capital.
6. Build the portfolio prioritisation matrix
The portfolio matrix places strategic need on one axis and execution confidence on the other. Strategic need combines service criticality and the consequence of deferral. Execution confidence combines readiness, affordability, delivery-risk control and financeability. The matrix guides the action rather than producing an automatic verdict.
High-need, high-confidence projects are candidates for funded delivery. High-need, low-confidence projects deserve targeted development, risk retirement or a minimum safe intervention. Low-need, high-confidence projects may be retained as flexible substitutes, funded through a ring-fenced source or deferred if they crowd out more important work. Low-need, low-confidence projects should generally be redesigned, paused or removed from the active programme.
The matrix should preserve mandatory projects as a separate layer. It should also display cost, annual cash peak and a readiness gate so that a small, advanced project is not visually equivalent to a large, immature programme. Bubble size can represent capital cost and colour can represent the decision route. Labels should remain stable across committee cycles.
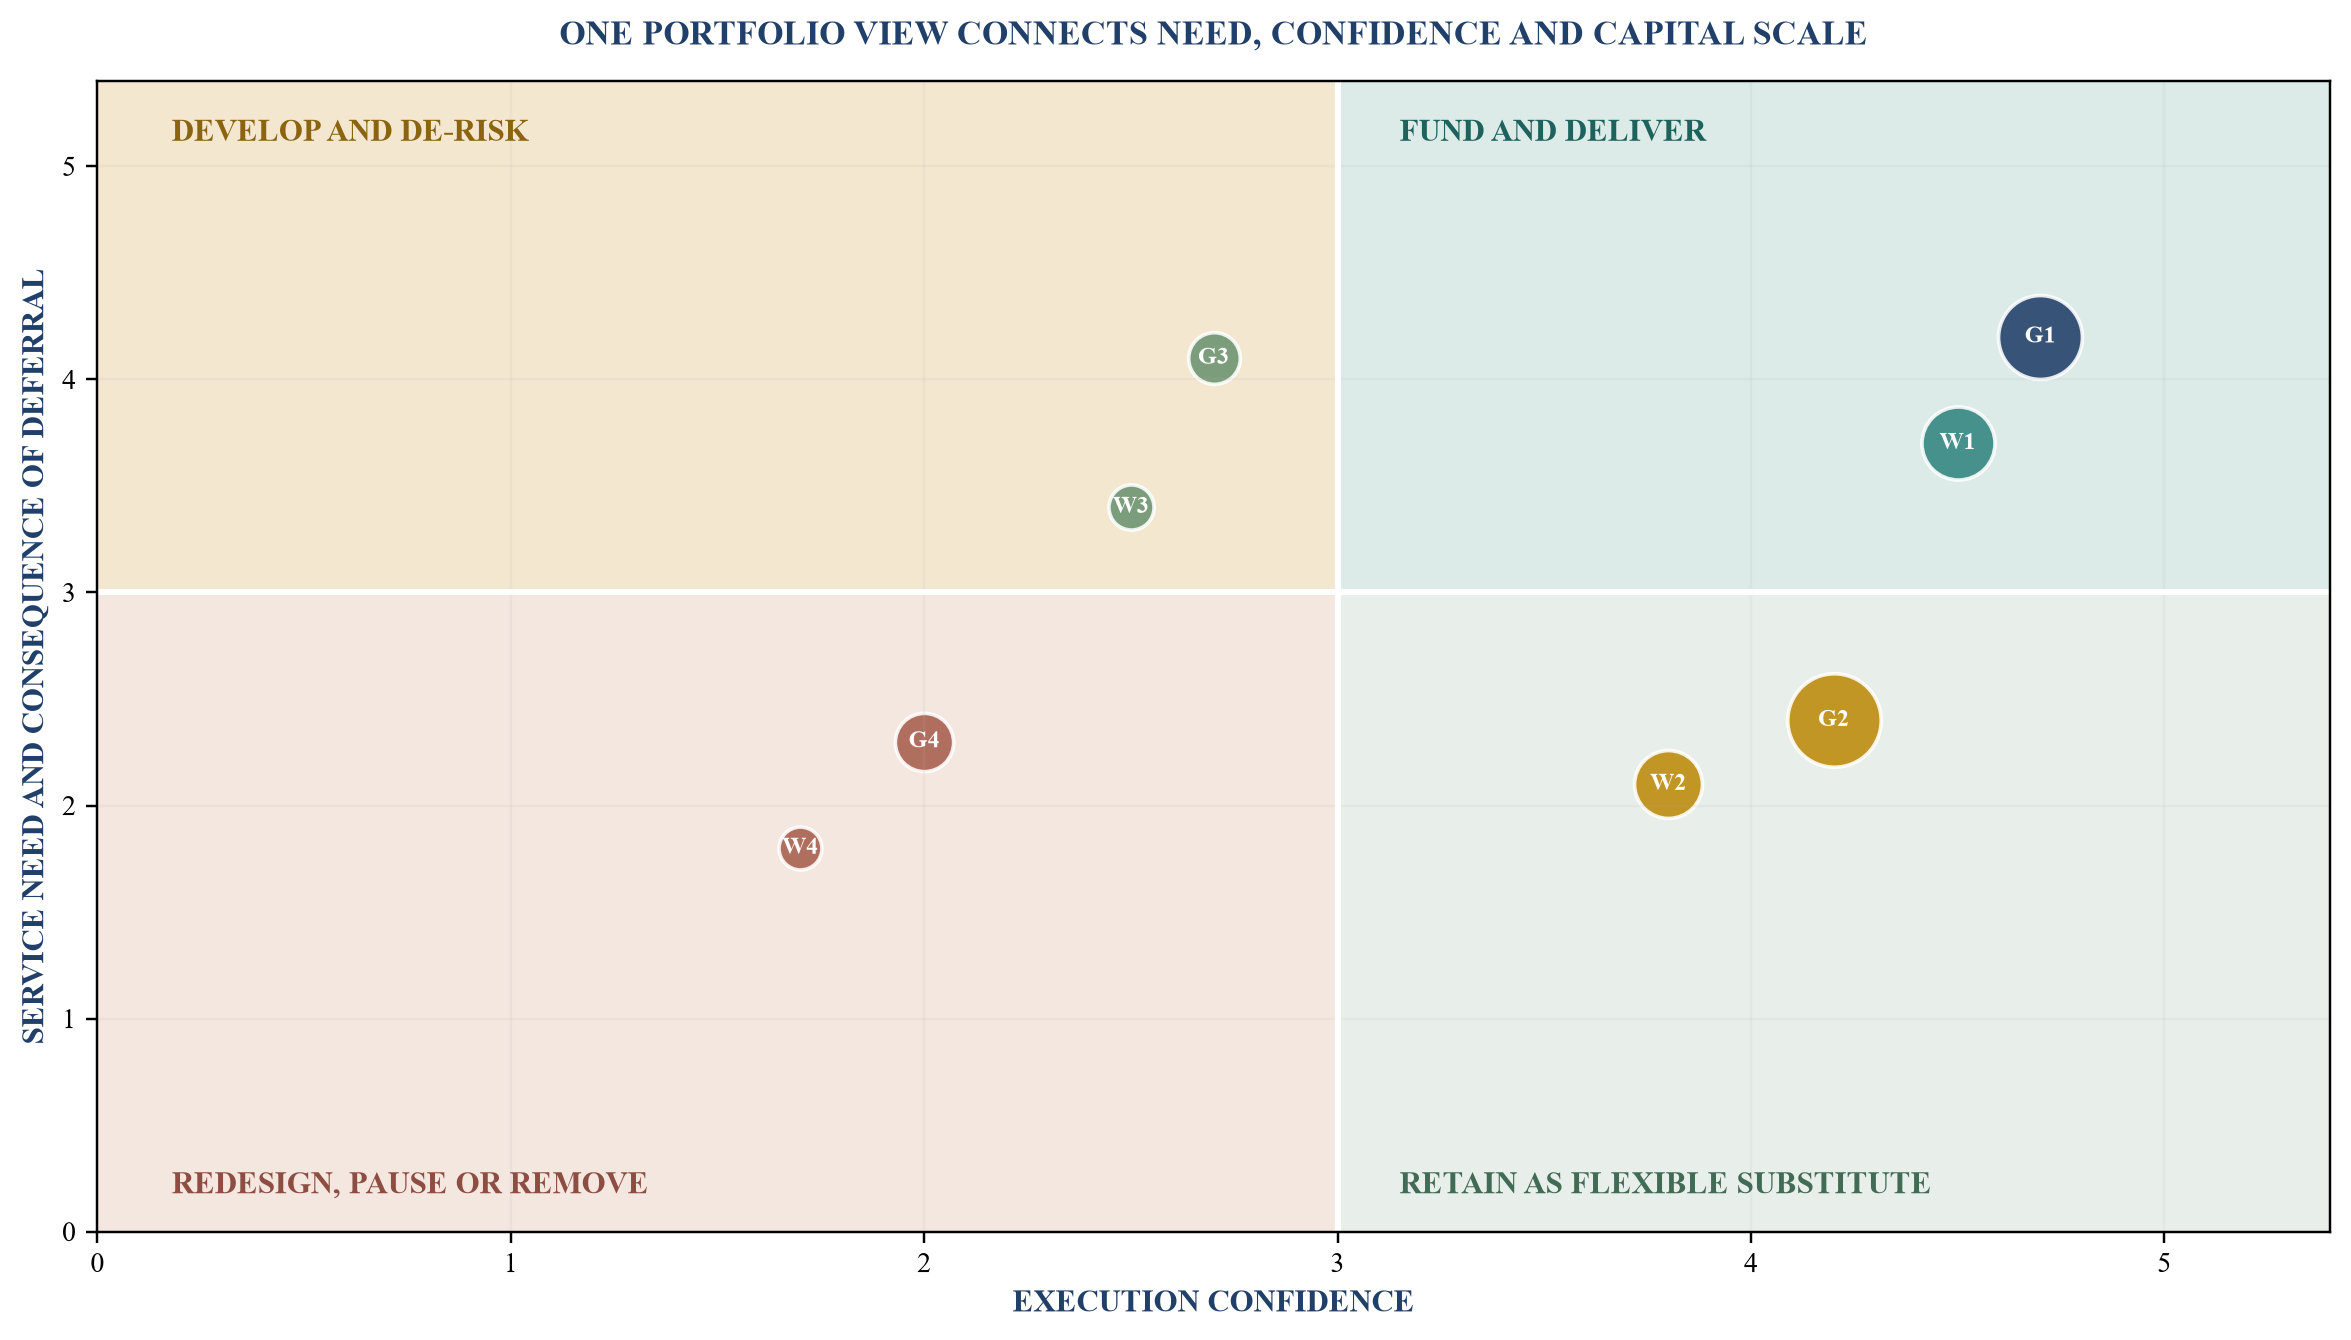
All projects, scores and costs are hypothetical modelling assumptions. Bubble size represents total capital cost; the matrix supports discussion and does not replace legal duties or feasibility work.
7. Apply readiness gates before major commitments
Readiness should be assessed through stage gates tied to specific decisions. Gate 0 confirms the need and any mandatory obligation. Gate 1 confirms that credible options have been considered. Gate 2 confirms the preferred concept, interfaces and data. Gate 3 confirms land, permits and stakeholder pathways. Gate 4 confirms procurement and delivery readiness. Gate 5 confirms funding and authorises notice to proceed. Commissioning and benefits gates then control entry into service and close-out.
The IMF Public Investment Management Assessment framework examines project appraisal and selection, multiyear budgeting, maintenance funding, procurement and portfolio oversight across the full investment cycle.[7][8] The IMF's appraisal guidance calls for the rationale, objectives, timetable, costs, revenues, benefits, options, risks, implementation, procurement and financing to be examined.[9] These elements support a progressive gate system and show why a project should not reach procurement with an unresolved need, scope or funding case.
A gate decision has four possible outcomes: advance; advance with time-bound conditions; hold for evidence; or stop and redesign. Conditions should identify the owner, evidence, date and consequence of non-compliance. Repeated conditional approvals can undermine the system, so the programme office should report the age and cumulative value of open conditions.
The proportionality principle remains important. A low-cost standard replacement does not need the same appraisal burden as a new treatment plant or transmission corridor. The office can maintain pathways for routine capital, complex projects, major programmes and emergencies. Every pathway still requires a clear need, authorised scope, cost control, funding and accountable service outcome.
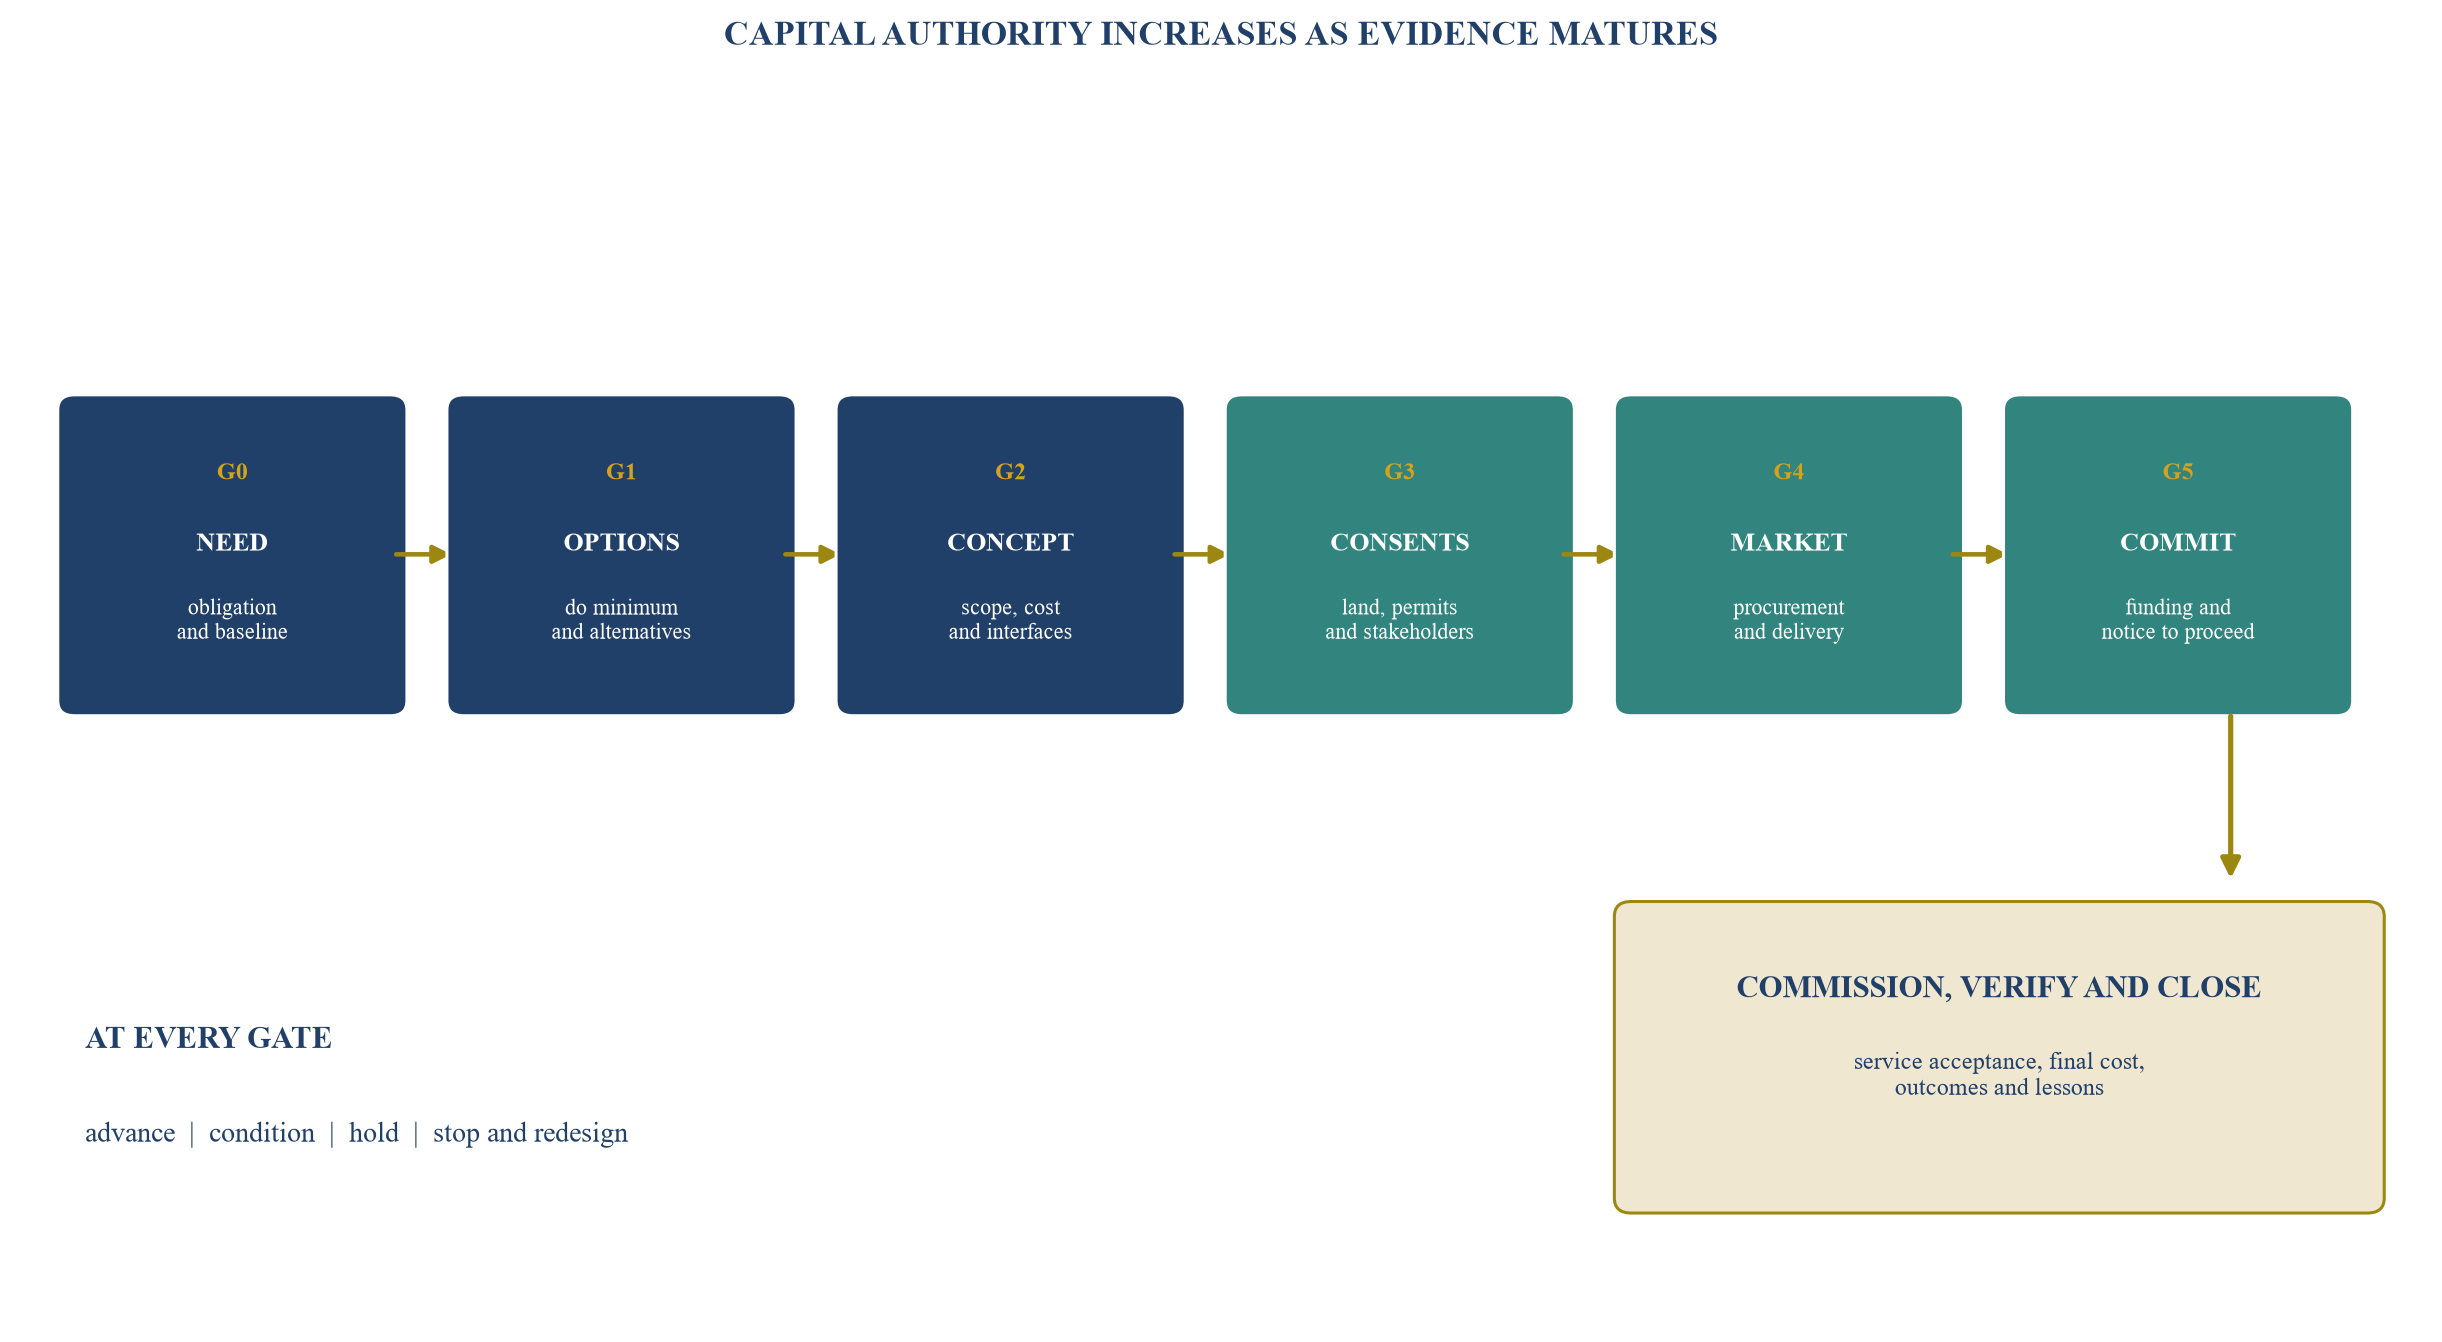
Gate evidence is cumulative. Mandatory and emergency projects may use an expedited route with recorded authority, minimum safe scope and retrospective assurance.
8. Test service criticality without inflating urgency
Service criticality should be based on consequences, affected service and timing. A robust score considers health and safety, statutory compliance, number and vulnerability of affected customers, duration and severity of interruption, environmental consequences, system resilience, economic disruption and the availability of operational alternatives.
The evidence may include asset condition, outage history, demand and capacity analysis, water-quality results, environmental monitoring, hydraulic or power-flow studies, emergency-response data and documented customer impacts. The score should identify the period within which the consequence becomes material. A project with a severe consequence in eight years may require development activity now, while its main construction cash can remain outside the immediate envelope.
The programme office should challenge urgency labels. Terms such as critical, strategic and compliance-driven need a defined basis. A legal review may show that a deadline is conditional. An operating intervention may defer a capacity expansion. A targeted refurbishment may manage risk while a larger option is developed. These findings change sequencing without denying the underlying need.
Service-criticality scoring should also capture interdependencies. A substation reinforcement may enable multiple connections and resilience projects. A raw-water transfer may change the required size of treatment works. A digital control upgrade may improve the performance of existing assets. The portfolio should record enabling relationships so that the value of one project is not assessed in isolation.
9. Make affordability an annual constraint
Total capital cost does not reveal affordability. A project draws cash across design, land, equipment, construction and commissioning. It may also increase operating expenditure, debt service or depreciation before benefits mature. The office should therefore maintain an annual funding bridge by project, source and restriction.
For a regulated utility, the bridge may include allowed revenue, customer-bill impact, regulatory timing, grants, contributions and borrowing. For a public utility, it may include appropriation, subsidy, sovereign or municipal support, user charges and lender disbursements. For a corporate utility, it may include operating cash flow, group funding, ring-fenced project finance and covenant headroom. Each source needs a status: approved, committed, conditional, proposed or unavailable.
The affordability curve ranks candidate tranches against cumulative annual cash use. A project can remain economically attractive while exceeding the funding ceiling in a particular year. The response may be resequencing, scope modularisation, alternative procurement, co-funding or demand management. It should not be an unsupported assumption that future money will appear.
The worked example uses a hypothetical 2027-2031 funding envelope and twelve project tranches. It assumes a nominal planning basis, excludes financing fees and uses simplified annual cash profiles. The curve demonstrates where cumulative commitments exceed available headroom. It is not a utility budget or tariff forecast.
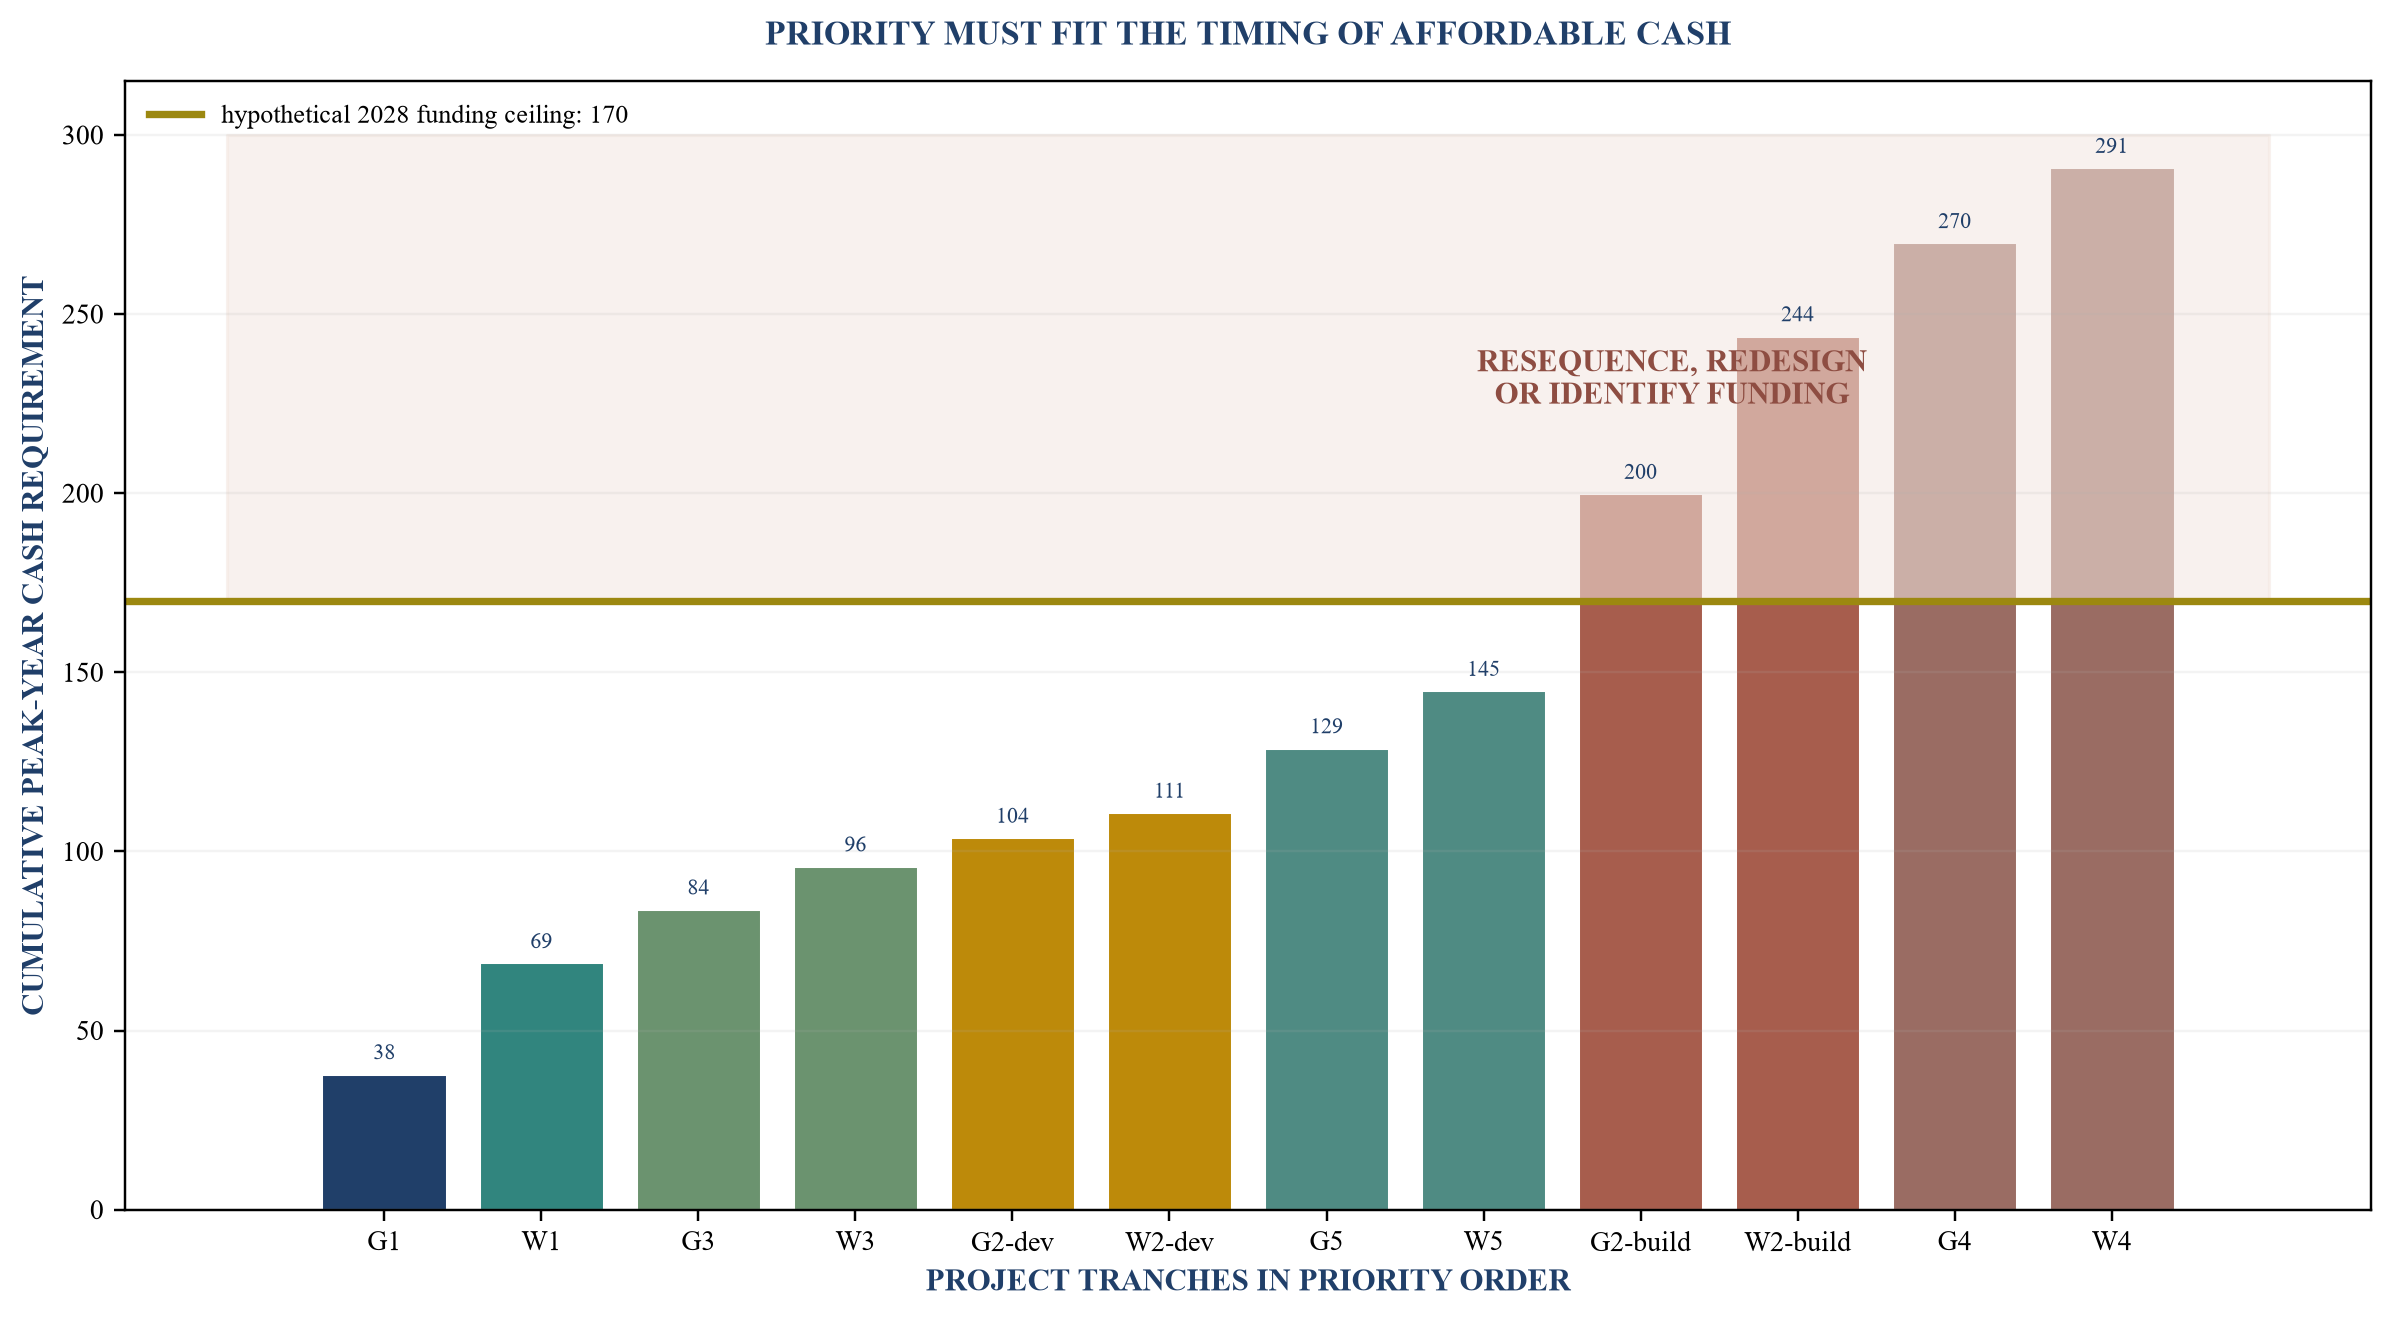
Values are modelling assumptions in USD millions. The chart uses simplified 2028 peak-year cash requirements and does not include financing fees, tax or foreign-exchange effects.
10. Keep economic value, financial value and funding separate
Economic appraisal examines costs and benefits to society or the relevant public-interest boundary. Financial appraisal examines cash flows to the utility or project entity. Funding analysis identifies whether cash is available when required. These views can produce different conclusions and should not be collapsed into one metric.
A reliability project may create strong customer and economic benefits that are not fully recovered through tariffs. A leakage project may reduce operating cost and environmental impact while requiring near-term capital. A connection project may produce positive utility cash flow only if customer contributions and take-or-pay terms are enforceable. The committee should see each view and the policy decision connecting them.
The 2026 HM Treasury Green Book describes appraisal as part of a rationale, objectives, appraisal, monitoring, evaluation and feedback cycle. It calls for comparison of options, whole-life costs and benefits, risk, optimism bias, net present social value, benefit-cost ratios and sensitivity analysis.[11] Its specified social time-preference rates are UK public-sector parameters. A utility in another jurisdiction should use its approved economic and financial assumptions rather than importing those rates without authority.
The programme office should maintain an assumptions book. It should contain price bases, escalation, discount rates, asset lives, demand scenarios, value-of-service parameters, carbon or environmental values where authorised, exchange rates, tax treatment, residual values and contingency rules. The source and approval date of each assumption need to be visible.
11. Use risk-adjusted NPV as a transparent scenario view
Risk-adjusted net present value can help compare projects when the method remains transparent. One practical approach starts with the base financial NPV, then models schedule, cost, revenue or savings, performance and funding scenarios. Probability-weighted values can be shown alongside the unadjusted case. Decision makers should also see the individual downside scenarios because an expected value can hide a severe tail.
The worked example uses a hypothetical real discount rate of 6 per cent, a ten-year analysis period and simplified probabilities. It separates the base project value from a cost-and-delay exposure and a performance exposure. The example does not estimate any actual project's return. It omits taxes, financing structure, inflation, foreign exchange, asset residual value and wider economic benefits.
Risk adjustment should avoid false precision. Probabilities derived from a small or biased project history deserve a confidence label. Correlated risks should not be treated as independent. A permitting delay can increase cost and postpone benefits; a funding delay can affect procurement and equipment prices. Scenario analysis can capture these relationships more clearly than adding isolated percentage allowances.
The committee should use switching values. These show how far a key input must change before a decision threshold is crossed. A project that remains valuable after a material cost increase, delay and benefit reduction has stronger economic resilience. A project whose case fails after a small movement requires further design, commercial protection or a different decision route.
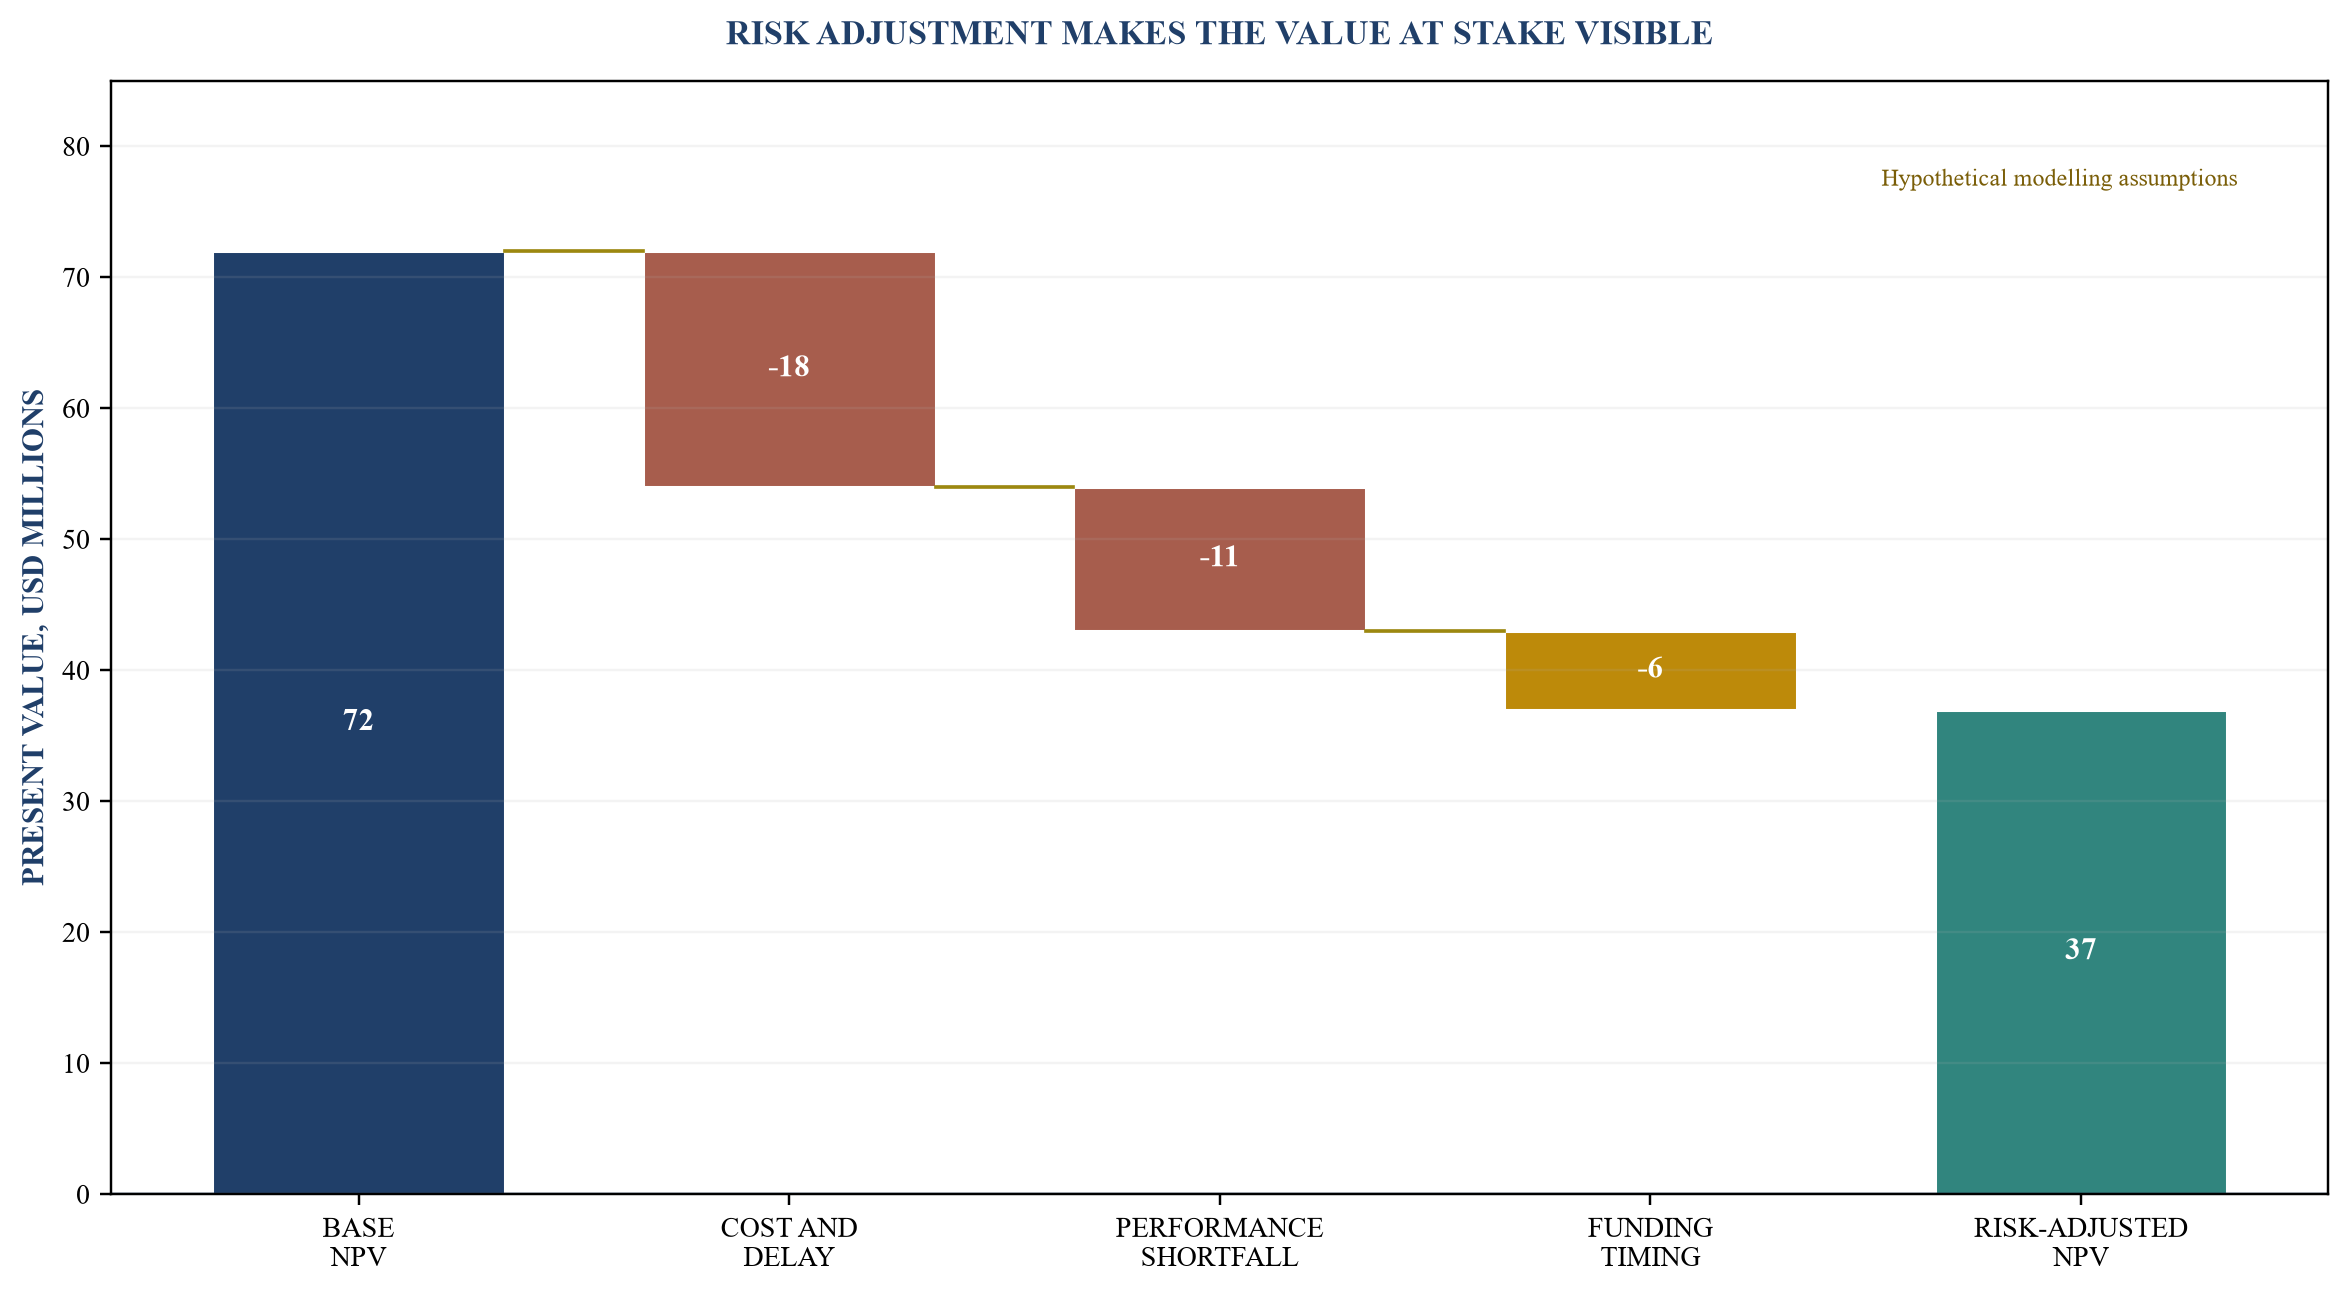
Values are modelling assumptions in USD millions using a simplified ten-year, 6 per cent real-discount framework. The bridge is a decision aid and excludes financing structure, tax, inflation, foreign exchange and wider social benefits.
12. Test financeability at project and portfolio level
Financeability asks whether capital can be committed and serviced under the proposed risk allocation. The analysis begins with the funding source. Budget or tariff funding depends on formal authority and timing. Corporate debt depends on balance-sheet capacity, ratings, covenants and cash flow. Project finance depends on contracted revenues, construction and completion arrangements, security, reserves and risk allocation. Grants and concessional finance depend on eligibility, conditions and disbursement evidence.
The programme office should record the amount, currency, tenor, price basis, security, conditions precedent, availability period, repayment profile and use restrictions for each source. It should also identify the party exposed to construction cost, delay, demand, operating performance, inflation, foreign exchange, change in law and force majeure. A label such as PPP, green finance or government-backed does not establish financeability.
The World Bank and IFC both emphasise project preparation and a bankable pipeline. IFC's infrastructure analysis links bankability to adequate project-development information and preparation arrangements.[17] The World Bank's utility and water frameworks place financial sustainability, operational efficiency, planning and stakeholder coordination within the turnaround and financing process.[16][18][19] Financeability therefore follows from service, technical, commercial and governance evidence; it is not a separate document produced at the end.
Portfolio-level financeability also matters. Several individually viable projects can create a combined refinancing peak, covenant pressure, foreign-exchange exposure or concentration in one contractor and equipment supply chain. The office should aggregate debt draw, repayment, guarantee, contingent-liability and restricted-cash profiles. Downside testing should combine realistic correlated stresses.
13. Build a portfolio through tranches and dependencies
Large projects should be divided into decision-relevant tranches when doing so preserves technical integrity. Development funding can retire route, land, environmental, geotechnical, hydraulic, power-flow, connection and procurement risks before full construction authority. Early works can protect a critical date while maintaining an explicit cancellation and reuse analysis. Modular treatment, storage or substation capacity can align cash with demand where engineering and procurement permit.
Dependencies should be modelled as a network. A transmission line may depend on a substation and land corridor. A treatment plant may depend on raw-water intake, power supply, sludge disposal and distribution reinforcement. Customer-connection projects may share an upstream asset. Funding one downstream project without its enabler can create stranded capital.
The programme office should identify three types of dependency: hard dependencies that prevent service; sequencing dependencies that change cost or timing; and benefit dependencies that affect outcome realisation. The approved portfolio should fund coherent chains rather than isolated high-scoring components.
Table 3. Hypothetical grid and water portfolio
| ID | Project | Primary need | Capital cost USDm | 2028 cash USDm | Gate | Composite score / 5 | Proposed route |
|---|---|---|---|---|---|---|---|
| G1 | central substation resilience | critical-load continuity | 145 | 38 | G4 | 4.38 | fund and deliver |
| W1 | treatment-process reliability | water-quality resilience | 110 | 31 | G4 | 4.12 | fund and deliver |
| G2 | eastern transmission corridor | demand and connection capacity | 180 | 55 | G2 | 3.35 | fund development; hold construction |
| W2 | regional supply transfer | drought resilience | 95 | 44 | G2 | 3.18 | fund development; resolve land and permits |
| G3 | protection and control renewal | failure-risk reduction | 55 | 15 | G4 | 3.96 | fund and deliver |
| W3 | leakage district programme | water loss and operating efficiency | 42 | 12 | G4 | 3.72 | fund by performance tranche |
| G4 | office connection expansion | low-confidence load growth | 70 | 26 | G1 | 2.18 | pause and refresh demand evidence |
| W4 | amenity-water extension | discretionary service expansion | 38 | 21 | G1 | 1.94 | remove from active programme |
| G5 | transformer monitoring | condition visibility | 24 | 8 | G3 | 3.44 | retain as flexible substitute |
| W5 | pump energy optimisation | operating efficiency | 29 | 7 | G3 | 3.39 | retain; seek ring-fenced funding |
All values, scores and dates are modelling assumptions. Mandatory status reflects the hypothetical example and does not describe any actual legal duty.
14. Combine scoring with committee judgement
The score creates a consistent starting point. The investment committee remains accountable for the decision. Every override should identify the score-based route, approved alternative, reason, impact on funding and service, accountable executive and review date. This record protects transparency and helps improve the model.
Sensitivity testing should precede approval. The office can vary criterion weights, cost ranges, schedule, demand, funding headroom and key benefit assumptions. If a project remains in the same decision group across credible cases, its position is robust. If it moves frequently, the committee should focus on the uncertain evidence rather than debate a precise rank.
The office should also test portfolio composition. A highest-score-first algorithm may exhaust funding on several large projects and exclude a set of smaller interventions with greater combined service value. The portfolio team can compare packages under the same constraint. It should preserve hard obligations and dependencies while examining service outcomes, risk concentration, cash profile and deliverability.
Table 4. Hypothetical scoring definitions and weights
| Lens | Hypothetical weight | Score 1 anchor | Score 3 anchor | Score 5 anchor |
|---|---|---|---|---|
| service criticality | 30% | limited and deferrable consequence | material service effect with mitigations | severe near-term service, safety or compliance consequence |
| readiness | 20% | need or scope weakly defined | preferred concept and key pathways identified | approved design basis, consents path, market route and estimate |
| affordability | 20% | exceeds headroom with no credible response | manageable through sequencing or conditional funding | fits approved annual envelope with downside headroom |
| delivery-risk control | 15% | critical exposures unowned or unmitigated | major risks identified with active plans | mature allocation, quantified exposure and tested recovery actions |
| financeability | 15% | funding source absent or incompatible | credible source under development with conditions | committed or highly evidenced source matched to cash and risk |
Weights and thresholds are modelling assumptions. The utility should approve its own policy basis and test the result under alternative weights.
15. Create a delivery control room
Portfolio approval transfers the primary question from selection to control. A delivery control room should connect the approved business case to current execution evidence. It should show baseline scope, milestones, cost to complete, contingency, risk exposure, land and permit status, procurement, funding, service outcomes and decisions required.
The control room is a decision process supported by data. A large dashboard without verified definitions can create false confidence. Every indicator needs an owner, source, refresh frequency, tolerance and escalation rule. Project directors remain accountable for delivery. The programme office reconciles their evidence, identifies cross-project constraints and presents exceptions to the correct authority.
Cost reporting should separate spend to date, commitments, forecast to complete, approved change, contingency allocation and unresolved exposure. Schedule reporting should focus on logic-linked milestones and the critical path. Funding reporting should reconcile disbursement conditions and cash. Outcome reporting should begin before commissioning so that the baseline and measurement method are agreed.
The control room should display decisions by due date. A late land approval, transformer order or treatment-process test can affect several milestones. An issue becomes useful management information when its impact, options, decision owner and deadline are visible.
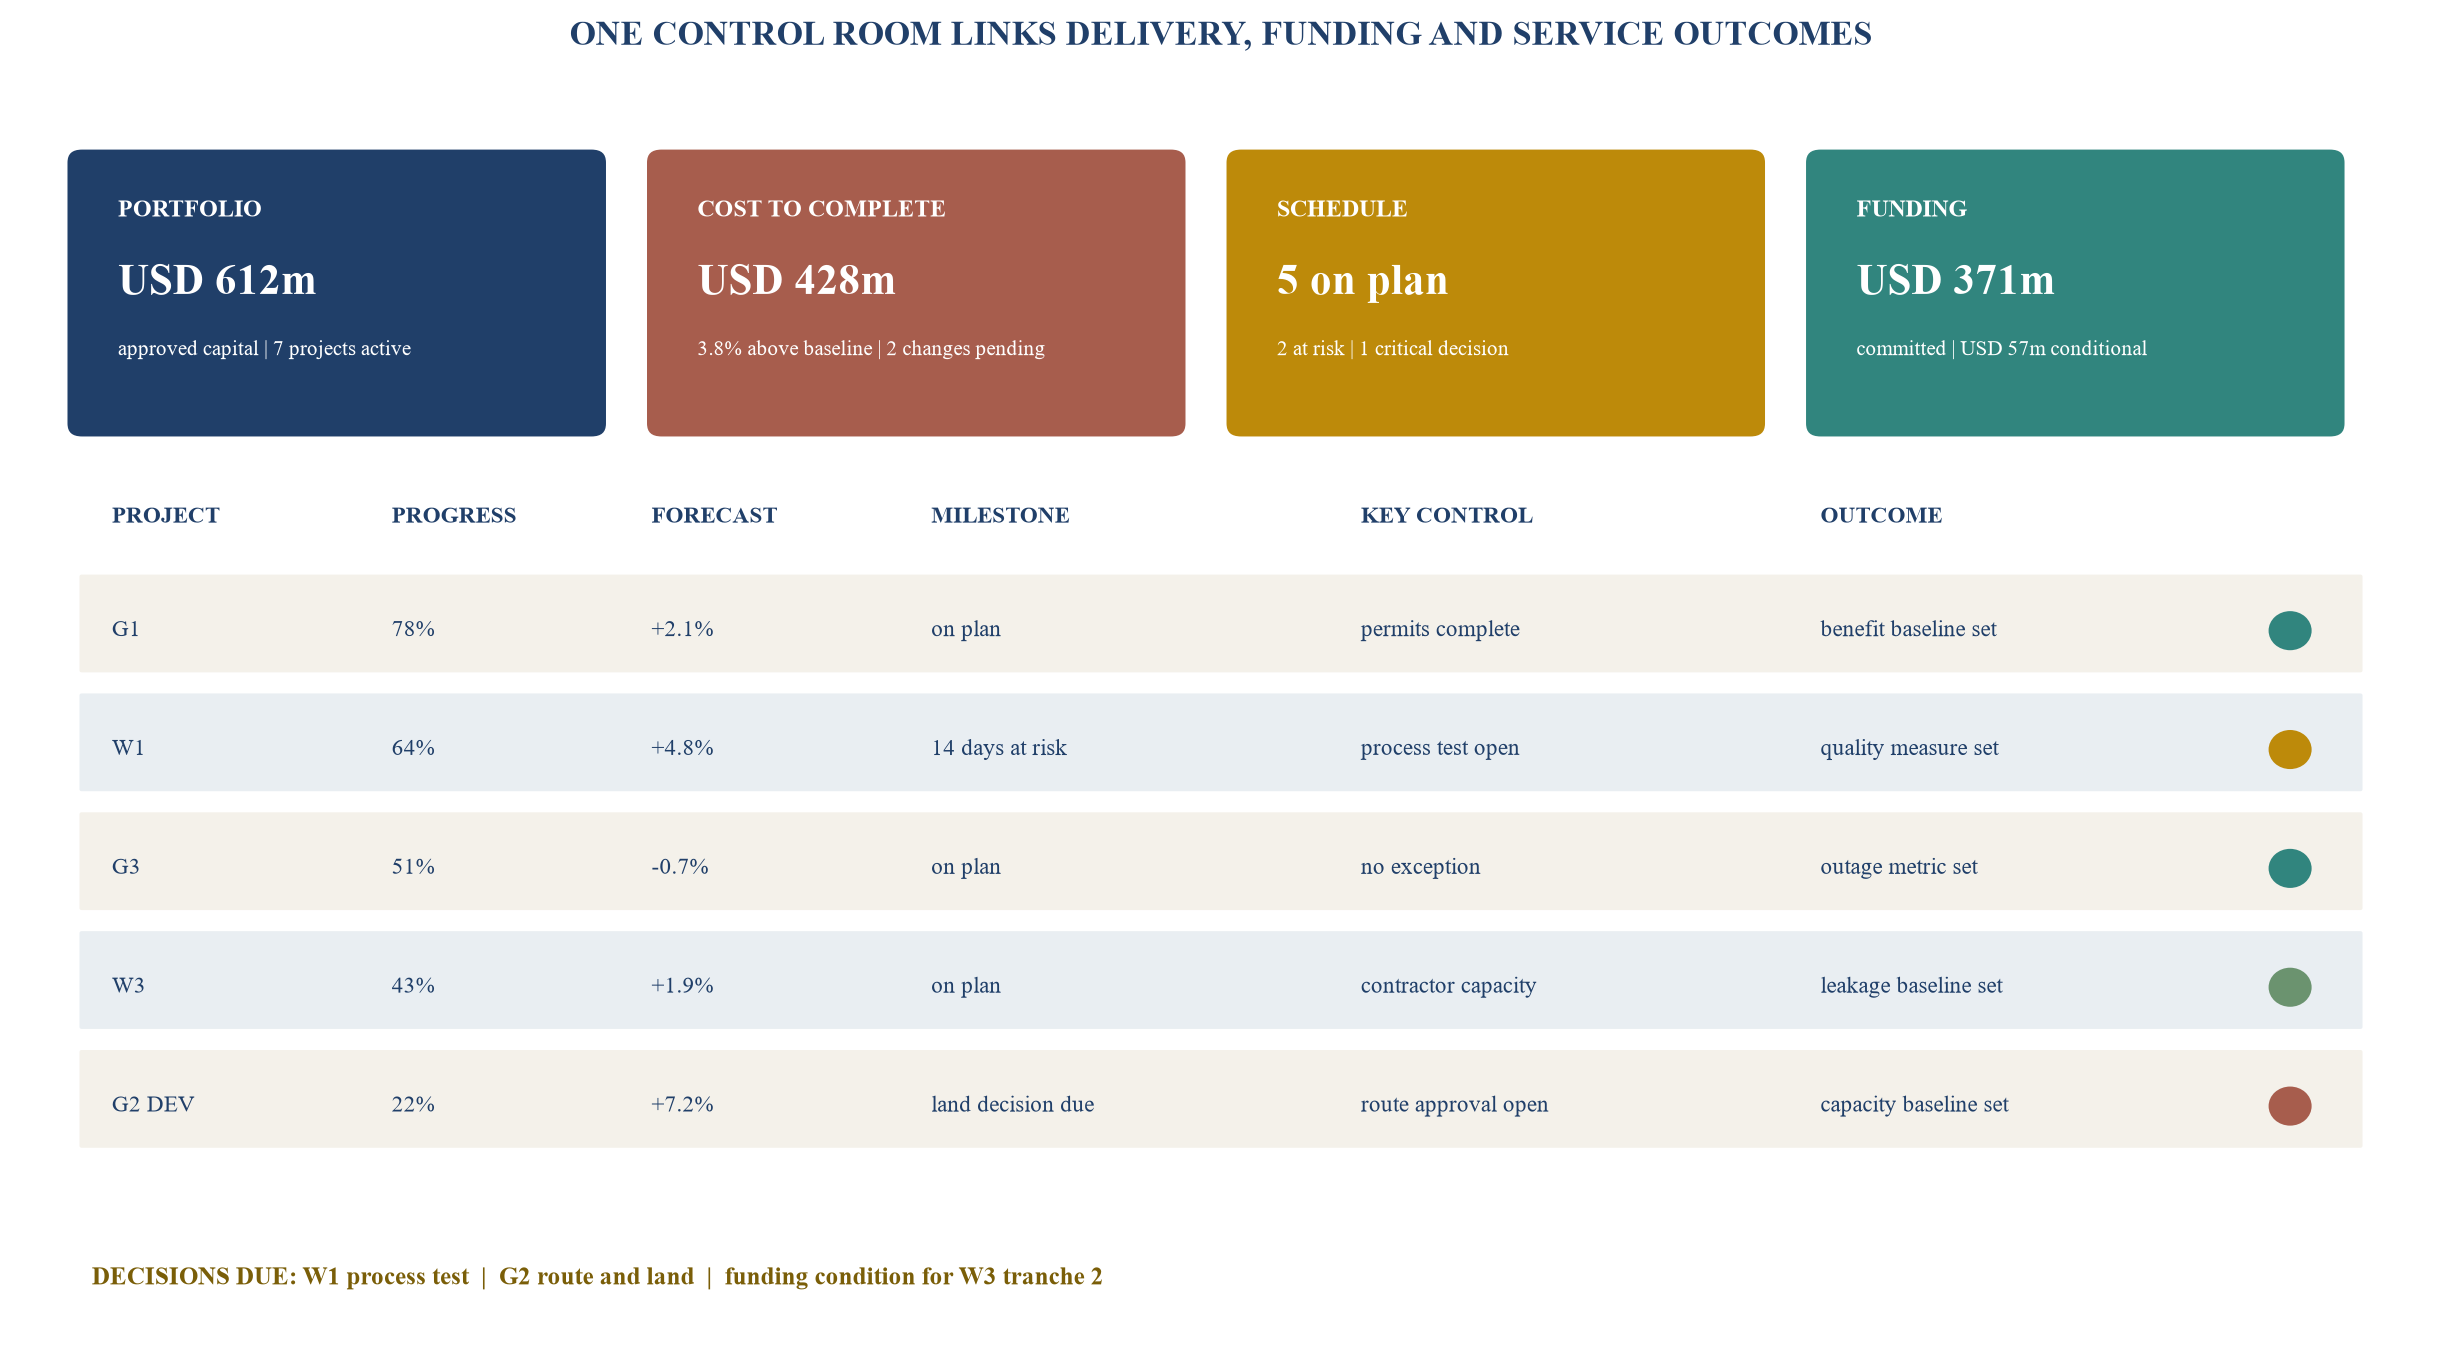
Values are hypothetical modelling assumptions. Status colours require underlying evidence and do not independently establish project health.
16. Control procurement and market capacity
Procurement strategy should reflect the project risk, market capacity and degree of scope certainty. A fixed-price contract does not remove risk when the scope is incomplete, interfaces are unclear or inflation and supply-chain exposure are excluded. The programme office should ensure that the commercial route matches design maturity and risk allocation.
Early market engagement can test contractor appetite, equipment lead times, packaging, local capability, financing requirements and contractual positions. It must follow applicable procurement rules and preserve competition. The evidence should feed back into cost, schedule and risk assumptions before notice to proceed.
The IEA reports multi-year lead times for cables and large transformers and substantial price increases since 2019.[3] A utility may consider framework agreements, standard designs, advance purchase, supplier reservations or strategic inventory. Each response has a cost and cancellation risk. The approval paper should compare schedule protection, reuse value, storage, warranty, price, supplier credit and demand confidence.
Portfolio visibility also helps prevent internal competition for the same engineers, outage windows, contractors and commissioning teams. The control room should maintain a resource and market-capacity heat map across projects. Resequencing one project may improve the deliverability of the whole programme.
17. Track benefits and existing-asset performance
A capital programme should improve service, resilience, environmental performance, capacity or cost. The service owner should agree the baseline and outcome measure before approval. The programme office should then track whether the asset enters service and whether the expected outcome appears.
Benefits measurement can include interruption frequency and duration, available network capacity, technical losses, water-quality compliance, leakage, supply interruptions, treatment performance, energy use, operating cost and customer impact. The metric must specify the boundary, source, weather or demand adjustment where relevant and verification period.
The World Bank's Utility of the Future programme links strategic vision and business planning to operational, commercial, financial and organisational actions.[16] Its water utility turnaround and financing frameworks emphasise operational efficiency and financial sustainability.[18][19] This supports a portfolio that includes maintenance, refurbishment, digital controls, demand management and operating improvement alongside new construction.
The office should require a post-investment review. The review reconciles final scope, cost, schedule, service date, benefits and outstanding obligations with the approved case. It should identify which estimates and risks were accurate, which changed and what should enter the assumptions book. Lessons become valuable when they improve the next gate rather than remain in a close-out document.
18. Mobilise the office in ninety days
The first thirty days should establish authority and evidence. Executives approve the office mandate, portfolio boundary, decision rights, obligation criteria and provisional weights. The team reconciles every active and proposed project into a single register. Finance publishes the annual funding envelope and source status. Service and engineering owners identify the minimum evidence available for each project.
Days thirty-one to sixty should apply the first gates. The office classifies obligations, checks the minimum data standard and scores the portfolio. Sponsors resolve obvious data gaps. Finance builds the annual cash and funding bridge. The team maps project dependencies and creates alternative portfolio packages. An independent challenge session tests cost, readiness, urgency and delivery assumptions.
Days sixty-one to ninety should approve the portfolio and launch control. The investment committee selects the funded programme, development programme, reserve list and paused items. Every decision receives a rationale and owner. Procurement releases are limited to projects that pass the relevant gate. The office launches the control room, decision calendar, change process and monthly portfolio review.
The initial scoring model should remain provisional for one cycle. The office should compare its decisions with delivery evidence, service outcomes and post-investment reviews. It can then refine definitions, weights and thresholds through an authorised governance process. Stability matters because frequent unrecorded changes reduce comparability.
Table 5. Hypothetical portfolio affordability and funding bridge
| Year | Gross capital requirement | Approved internal funding | Committed debt or grant | Conditional funding | Residual gap |
|---|---|---|---|---|---|
| 2027 | 96 | 62 | 24 | 10 | 0 |
| 2028 | 214 | 88 | 82 | 18 | 26 |
| 2029 | 181 | 75 | 79 | 15 | 12 |
| 2030 | 104 | 58 | 38 | 8 | 0 |
| 2031 | 52 | 34 | 18 | 0 | 0 |
Values are modelling assumptions in USD millions. Source status and restrictions must be verified before commitments.
Table 6. Ninety-day mobilisation cadence
| Period | Core actions | Decision output | Control evidence |
|---|---|---|---|
| days 1-15 | approve mandate; reconcile project universe; publish funding and obligation definitions | authorised portfolio boundary | governance charter, project register and source index |
| days 16-30 | confirm data standard; assign evidence owners; map funding and delivery constraints | accepted submission requirements | gap log, annual envelope and resource heat map |
| days 31-45 | classify obligations; test options; score five lenses | first comparative portfolio | scorecards, gate findings and dependency map |
| days 46-60 | run affordability, value, financeability and sensitivity cases | alternative portfolio packages | cash bridge, assumptions book and scenario record |
| days 61-75 | independent challenge; resolve exceptions; prepare decisions | recommended funded, development and reserve programmes | challenge log and decision papers |
| days 76-90 | approve portfolio; launch delivery control room and review cadence | controlled programme baseline | decision register, dashboard definitions and change protocol |
Timing is a practical implementation model and should be adapted to the utility's approvals, data quality and programme scale.
Conclusion
Scarce funding turns utility strategy into a sequence of explicit choices. A capital programme office gives those choices a common evidence base. It identifies mandatory obligations, applies a minimum project standard, evaluates service criticality, readiness, affordability, delivery risk and financeability, and keeps economic value separate from utility cash and funding availability.
The approach works when gates control real commitments. Strategically important projects can receive development funding without entering construction prematurely. Affordable and ready projects can advance within the annual envelope. Weak proposals can be redesigned or removed. Mandatory work remains visible, cost challenged and connected to the discretionary capital it displaces.
The control room completes the system by linking approved scope to cost, schedule, contingency, permits, procurement, funding and service outcomes. Post-investment evidence then improves the next planning cycle. The result is a repeatable decision architecture for directing limited capital towards the most critical, mature and deliverable service outcomes.
The numerical examples in this paper remain hypothetical. Utilities should adapt the model to their legal duties, regulatory or fiscal framework, asset condition, data quality, customer needs, environmental requirements and authorised financial assumptions. Major decisions require specialist engineering, legal, procurement, environmental, regulatory, tax, accounting and financing advice.
Appendix A. Project submission questions
1. What service problem exists, who is affected and which current evidence establishes the baseline? 2. Is there a binding legal, safety, environmental or service obligation; what instrument and deadline apply? 3. What is the minimum credible intervention, and which demand, operating, refurbishment and new-build options were compared? 4. Which scope, interfaces, land rights, permits, consents and stakeholder decisions remain open? 5. What is the cost-estimate basis, price date, uncertainty range, contingency rule and annual cash profile? 6. Which outcomes will be measured, from what baseline, by whom and over what period? 7. Which funding sources are approved, committed, conditional, proposed or unavailable? 8. Which delivery risks are correlated, who owns them and when must a decision be made? 9. Which upstream, downstream and shared-resource dependencies affect service and timing? 10. Which gate is being requested, and what capital or contractual commitment follows from approval?
Appendix B. Investment committee questions
1. Which mandatory obligations consume the capital envelope, and is the proposed scope the minimum credible response? 2. Which projects remain robust under alternative policy weights, cost ranges, delays and demand cases? 3. Where does annual cash exceed approved or committed funding, and which projects create the peak? 4. Which high-need projects require development funding before construction authority? 5. Which project chains must be funded together to avoid stranded or unusable assets? 6. Which procurement releases are blocked by land, permits, design, market, funding or risk allocation? 7. What combined exposure exists to one contractor, equipment class, currency, funding source or outage window? 8. Which projects can be modularised, resequenced, redesigned or supported by operating measures? 9. Which decision is due before the next committee and what happens if it is late? 10. How will approved service outcomes be verified after commissioning?
References
- International Energy Agency, Electricity 2026: Grids, published 2026. https://www.iea.org/reports/electricity-2026/grids
- International Energy Agency, World Energy Investment 2026, published 28 May 2026. https://www.iea.org/reports/world-energy-investment-2026
- International Energy Agency, Building the Future Transmission Grid, published 25 February 2025. https://www.iea.org/reports/building-the-future-transmission-grid
- World Bank, Infrastructure Foundations: From Current Assets to Future Growth, published 2026. https://www.worldbank.org/en/topic/infrastructure/publication/infrastructure-foundations-from-current-assets-to-future-growth
- World Bank, Prioritizing Infrastructure Investment: A Framework for Government Decision Making, published 2016. https://ppp.worldbank.org/library/prioritizing-infrastructure-investment-framework-government-decision-making
- World Bank, PPP Project Screening and Analytics Tool 2.0, accessed 29 August 2026. https://ppp.worldbank.org/library/ppp-project-screening-and-analytics-tool-psat-2-0
- International Monetary Fund, What is PIMA?, accessed 29 August 2026. https://infrastructuregovern.imf.org/content/PIMA/Home/PimaTool/What-is-PIMA.html
- International Monetary Fund, Public Investment Management Assessment: Review and Update, published 2018. https://www.imf.org/en/publications/policy-papers/issues/2018/05/10/pp042518public-investment-management-assessment-review-and-update
- International Monetary Fund, Public Investment Management Assessment Handbook, published 2022. https://infrastructuregovern.imf.org/content/PIMA/Home/PimaTool/PIMA-Handbook/PIMAHandbook.html
- International Monetary Fund, Well Spent: How Strong Infrastructure Governance Can End Waste in Public Investment, published 2020. https://www.elibrary.imf.org/display/book/9781513511818/ch013.xml
- HM Treasury, The Green Book 2026, published 2026. https://www.gov.uk/government/publications/the-green-book-appraisal-and-evaluation-in-central-government/the-green-book-2026
- Ofwat, PR24 final determinations, published 19 December 2024. https://www.ofwat.gov.uk/regulated-companies/price-review/2024-price-review/final-determinations/
- Ofwat, PR24 delivery plans assessment framework, published 2025. https://www.ofwat.gov.uk/consultation/pr24-delivery-plans-assessment-framework/
- Ofwat, PR24 final determinations performance commitment definitions, published 2024. https://www.ofwat.gov.uk/regulated-companies/price-review/2024-price-review/pr24-final-determinations-performance-commitment-definitions/
- Ofwat, Major water infrastructure programme, accessed 29 August 2026. https://www.ofwat.gov.uk/regulated-companies/major-water-infrastructure-programme/
- World Bank, Utility of the Future, accessed 29 August 2026. https://connect4impact.worldbank.org/landing-page/about-utility-future
- International Finance Corporation, Project Bankability: Getting Infrastructure Projects Ready for Investment, published 2018. https://www.ifc.org/content/dam/ifc/doc/mgrt/201811-cioc-ifc-analysis.pdf
- World Bank, Water Utility Turnaround Framework, published 2018. https://openknowledge.worldbank.org/server/api/core/bitstreams/43f5a9b8-6115-5390-9125-b50cb57daef2/content
- World Bank, Scaling Up Finance for Water: A WBG Strategic Framework and Roadmap for Action, published 2023. https://openknowledge.worldbank.org/bitstreams/e76f7426-d85c-46d3-9303-c2dd091b7010/download
- OECD, Infrastructure governance, accessed 29 August 2026. https://www.oecd.org/en/topics/sub-issues/infrastructure-governance.html
