

Introduction
A LEO broadband network is a moving industrial system rather than a permanent asset placed into orbit once. Spacecraft travel through short operating lives, customer equipment changes, launch prices move, spectrum coordination evolves and network software reallocates capacity continuously. The operator earns revenue from service availability while simultaneously manufacturing, launching and retiring the assets that create that service.
The first replacement cycle is therefore a decisive valuation test. Before it arrives, management can present deployment capital as exceptional. After it begins, investors can observe whether manufacturing yield, launch cadence, satellite reliability, customer contribution and network utilisation support recurring replenishment without repeated rescue capital. Terminal value must reflect that recurring requirement.
This paper treats the constellation as linked cohorts of productive assets. It values the operating platform through sustainable cash flow after replacement, rather than through satellite count or stated coverage alone.
1. Define the valuation perimeter
The analyst should first identify every asset and obligation needed to deliver an accepted customer service. The perimeter normally includes satellites, launch and integration, gateways, points of presence, network operations, spectrum and landing rights, customer terminals, software, cybersecurity, cloud capacity, sales channels, customer support and decommissioning. Shared corporate services and related-party launch or cloud arrangements need arm's-length treatment.
Legal ownership can differ from economic control. Spectrum may be held by an affiliate or notifying administration. Gateways may be leased. Customer terminals may remain operator-owned. Launch capacity may be prepaid. Government contracts can include dedicated capacity or priority rights. The valuation perimeter should reconcile legal entities, contracts, licences, assets and cash flows.
The output is a dependency map showing which rights and assets sit inside the transaction, which require continuing agreements and which can interrupt revenue if withdrawn.
2. Reconstruct the orbital fleet by cohort
Satellite count is an incomplete measure. Each spacecraft should be assigned to a cohort defined by design generation, production batch, launch mission, orbital shell, inclination, payload capacity and service-entry date. Record failures before service, orbit-raising time, active service, degraded operation, reserve status, disposal and re-entry.
Cohorts reveal ageing concentration. A large deployment wave can create a replacement cliff several years later. Staggered cohorts can distribute capital needs, although they may increase configuration complexity. The model should calculate active satellite months, usable beam capacity and expected remaining service rather than rely on objects launched.
FCC reporting conditions for Starlink Gen2 illustrate the evidence needed: failures within five years, estimated orbital lifetime after failure, disposal failure and collision-avoidance availability. Those measures can inform reliability diligence while operator telemetry remains the transaction authority. [1][7]
3. Separate design life from economic life
Design life is an engineering target. Economic life ends when a satellite can no longer provide competitive, compliant and supportable service at an acceptable cost. Radiation, propulsion margin, battery performance, component failure and debris avoidance can shorten physical life. Higher-throughput generations, different frequency use or customer-terminal changes can shorten economic life even when the spacecraft remains operable.
The analyst should compare design life, accounting useful life, observed cohort survival and management replacement policy. Each serves a different purpose. Accounting estimates allocate recorded cost. Engineering estimates support mission planning. Valuation requires the period over which the satellite contributes cash after expected degradation, failure and displacement by new technology.
Scenario ranges should be linked to evidence. A one-year reduction in average life affects replacement volume, launch demand, working capital and liquidity simultaneously.
4. Build the survival and degradation curve
A cohort model should estimate the probability that each satellite enters service, remains manoeuvrable, retains payload performance and reaches controlled disposal. The curve can use operator telemetry, anomaly records, supplier data and independent tracking. Early cohorts may have limited observations, so confidence should remain explicit.
Capacity can decline before complete failure. Power degradation, failed payload elements, propulsion constraints or thermal limits may reduce usable beams, routing flexibility or service quality. A binary active-or-failed classification can overstate capacity. The model should apply degradation factors by age and configuration.
Reliability improvement across generations should be supported by build and flight evidence. New features can raise throughput while introducing unseasoned components. The valuation should avoid transferring the mature cohort's reliability automatically to a new design.
5. Translate satellites into usable capacity
Nameplate throughput does not equal saleable capacity. Usable capacity depends on geography, demand density, gateway visibility, spectrum, interference constraints, weather, network routing, redundancy and service-level commitments. Capacity over oceans or lightly populated areas can have limited near-term monetisation while remaining strategically useful.
The network model should allocate capacity by beam, geography, time and customer class. It should reserve engineering margin, failover capacity and government priority capacity before calculating commercial availability. Optical inter-satellite links can improve routing and resilience, subject to demonstrated performance and gateway design. Amazon reported tests of optical links at 100 gigabits per second over approximately 1,000 kilometres; that disclosure demonstrates a tested capability, not the commercial utilisation of an entire network. [8]
Valuation uses delivered and billable capacity after constraints, not aggregate theoretical throughput.
6. Reconcile subscribers and traffic
Subscriber counts should reconcile billing, active terminals, suspended accounts, trials, wholesale customers and churn. The analyst should distinguish consumer, enterprise, aviation, maritime, mobility, government and backhaul services because price, traffic, equipment, support and contract terms differ.
Each cohort of customers needs average revenue, data consumption, busy-hour demand, acquisition cost, terminal subsidy, installation cost, support cost, bad debt and churn. A high subscriber count can destroy value where terminal subsidy and service cost exceed contribution or where congested cells require disproportionate replenishment.
The model should also test traffic growth per subscriber. Flat customer numbers can require more capacity as applications change. Price and fair-use policies may moderate demand, although competitive response and regulation can restrict those levers.
7. Underwrite terminal economics
Customer terminals connect orbital investment to revenue. Record bill-of-material cost, manufacturing yield, logistics, installation, subsidy, ownership, warranty, returns and expected replacement. Enterprise and mobility terminals may require certification, integration and long sales cycles. Consumer hardware can require substantial upfront subsidy.
The analyst should calculate cash payback by customer cohort. Service gross margin alone can hide terminal and acquisition cash. A customer acquired near the end of a satellite generation may still be valuable if the terminal remains compatible with replacement spacecraft. Forced terminal migration can create another capital cycle.
Terminal performance also changes addressable demand. Electronically steered antennas, power use, size, thermal performance and installation complexity affect aviation, maritime, defence and rural adoption. Technology value belongs in the model only when the hardware can be produced, certified and supported at the assumed cost.
8. Validate enterprise and government backlog
Contracted demand should be classified by enforceability, committed capacity, minimum payment, service-entry condition, cancellation right, geographic scope and customer readiness. Frameworks and memoranda should remain outside base backlog unless they include binding minimum economics.
Telesat reported approximately USD 1.0 billion of LEO backlog at the end of 2025 and described multi-year agreements, while its Lightspeed programme was still progressing toward service. This is useful public evidence of contracted demand ahead of operation. The disclosed backlog should be interpreted with the issuer's definition and delivery conditions. [3][4]
Transaction diligence should reconcile every material contract to customer credit, terminal availability, gateway readiness and regulatory permission. Government priority or reserved capacity can reduce commercial flexibility and should be reflected in both revenue and capacity planning.
9. Model pricing by cell and service
Global average revenue per user can conceal local economics. Price should be modelled by service, geography, channel, capacity cell and contract term. Competitive terrestrial broadband can constrain consumer pricing in dense markets. Remote, maritime, aviation or government services may command higher prices while requiring specialised terminals and support.
Wholesale agreements can reduce acquisition cost but share economics with distributors. Bundled offers can use the constellation to support another business, requiring transfer-pricing analysis. Promotional pricing can accelerate adoption while depressing cohort contribution.
The valuation should link price to usable capacity and service quality. Congested cells may require demand management or new satellites. Underutilised cells may need wholesale or mobility distribution. A price assumption without a capacity and channel mechanism should remain outside the base case.
10. Identify the first replacement cycle
The first replacement cycle begins when operational removals can no longer be covered by initial overbuild, spares or unused capacity. Its timing can differ by shell and customer region. The analyst should identify the earliest cohort whose retirement creates a service or resilience shortfall.
Replacement volume equals scheduled retirements, expected early failures, collision or regulatory removals and capacity growth, less usable retained capacity. Replacements may use a new generation with different throughput and mass. A one-for-one satellite count can therefore misstate both launch demand and economic capacity.
The board should receive a rolling ten-year cohort chart showing service entry, expected exit, replacement order date, manufacture, launch, orbit raising and commercial acceptance. The schedule exposes capital commitments years before retirement.
11. Calculate steady-state replenishment
A simple starting measure divides active satellites by average economic life. The result should then be adjusted for failures, spares, growth, launch batch size and production yield. For a 4,800-satellite network with a 5.3-year average life, annual scheduled replacement averages about 906 spacecraft before other adjustments. The actual pattern depends on cohort timing.
The replenishment budget includes spacecraft manufacturing, payloads, launch, insurance where used, integration, ground upgrades, capitalised labour, software, spares and disposal-related costs. Working capital matters because components and launches can be paid before service entry.
Unit cost should be supported by supplier contracts, internal production accounts and launch agreements. Future cost reductions should be tied to yield, volume and design evidence. Inflation, foreign exchange and constrained components can offset learning.
12. Separate maintenance from growth capital
Maintenance replenishment preserves the service and cash flow assumed in terminal value. Growth capital increases coverage, throughput, resilience or addressable services beyond that baseline. The classification should follow economic purpose rather than management labels.
A higher-throughput replacement may contain both. The analyst can allocate cost to the capacity needed to replace retiring service and the incremental capacity supported by evidenced demand. Ground and terminal upgrades required solely for the new capacity belong with growth. Reliability improvements that reduce failures may lower future maintenance needs after evidence emerges.
Free cash flow used for valuation should deduct maintenance replenishment. Growth capital can be evaluated through incremental cash flows. Treating all replacement as discretionary growth inflates sustainable cash generation.
13. Model launch capacity and price
Replenishment requires launch slots with compatible orbit, mass, dispenser and schedule. The model should map each cohort to contracted launches, provider concentration, deposits, escalation, termination, delay rights and alternate providers. Rideshare economics may reduce cost but constrain schedule or orbit.
Amazon disclosed more than 80 secured launches for its first generation and a diversified provider set. That scale illustrates how launch procurement can precede service revenue and create long-dated commitments. [5]
Related-party launch creates another issue. The economic model should use the cash cost and opportunity cost relevant to the consolidated owner, while a transaction perimeter may require an arm's-length service agreement. Launch price reductions create value only if capacity is available when replacements are needed.
14. Test manufacturing throughput and yield
The replenishment plan requires a production system capable of sustaining annual output after initial deployment. Measure line rate, first-pass yield, rework, component lead times, acceptance tests, inventory, labour learning and bottleneck equipment. Initial surge capacity may not remain available once growth funding falls.
Amazon reported a facility designed to build up to five satellites per day at peak capacity. The figure demonstrates an industrial design target; transaction diligence would need actual sustained output, yield and accepted spacecraft. [6]
The valuation should include minimum efficient scale and fixed-cost absorption. A network with reduced growth may still need a large factory for replacements. Outsourced manufacturing can convert fixed cost to contracted dependency. The chosen structure affects margin, resilience and working capital.
15. Include ground-network renewal
Gateways, fibre, cloud, network operations and cybersecurity require continuing investment. Satellite replacement can trigger antenna, modem, software or routing upgrades. Gateway access also depends on local licences, land, power, backhaul and weather resilience.
Ground assets should be placed on their own renewal curves. A constellation can have adequate orbital capacity and still fail to monetise it because a target country lacks landing rights or gateways. Inter-satellite routing can reduce some dependencies without removing customer-terminal, spectrum and terrestrial interconnection requirements.
The sustainable capital budget should include recurring security, software and operations investment. Deferred ground renewal can appear as near-term cash generation while weakening service reliability and regulatory compliance.
16. Value spectrum as a conditional right
Spectrum and orbital filings enable operation within defined parameters. They are governed through international coordination, national authorisations, deployment milestones and continuing compliance. ITU Resolution 35 uses milestone-based implementation for certain non-GSO assignments, and WRC-23 introduced further orbital tolerances. [2][9]
The analyst should map frequencies, notifying administrations, milestones, coordination status, national market access, interference disputes and change-of-control implications. Value depends on the ability to deploy and provide service, not on a filing in isolation.
Spectrum should not be double counted as both an intangible asset and the basis of operating cash flow. A relief-from-royalty or option method can provide a cross-check where market evidence supports it. The primary enterprise valuation should retain the operating cash flows and explicit regulatory risks.
17. Underwrite disposal and sustainability
Replacement creates a disposal programme as well as a manufacturing programme. The operator must manage end-of-life manoeuvres, passivation, tracking, collision avoidance, re-entry and reporting. Failures can leave non-manoeuvrable objects and increase operational or regulatory consequences.
FCC conditions require reporting on disposal failures, estimated orbital lifetime and collision-avoidance outages. UK orbital guidance requires licences for operation and identifies continuing regulatory obligations. [1][10]
The model should include disposal fuel margin, operations labour, replacement timing, insurance or indemnity, decommissioning security where applicable and expected cost of anomalies. Sustainability performance can affect licensing, spectrum access, customer procurement and financing. It therefore enters cash flow and risk, rather than appearing solely as an ESG narrative.
18. Measure service continuity during replacement
Retirement and replacement overlap. New satellites require launch, orbit raising, testing and network integration before contributing full capacity. Delayed launches or early failures can create temporary coverage or resilience gaps.
The model should simulate capacity by shell and geography through the transition. Include spares, routing alternatives, service-priority rules and minimum redundancy. Government and enterprise service-level agreements may require capacity buffers that cannot be sold to consumer customers.
Continuity has a cash consequence through credits, churn, lost sales and reputation. A smooth aggregate satellite count can conceal local shortfalls. Replacement approval should therefore use beam-level or cell-level service evidence where material.
19. Build the subscriber contribution bridge
Revenue should bridge to cash contribution through service delivery, channel share, terminal subsidy, customer support, bad debt, gateway use, cloud, spectrum fees and allocated network operations. The model should identify which costs scale with subscribers, traffic, geography or satellite count.
Consumer contribution can improve as terminal cost falls and cohorts mature. Enterprise contribution may include integration and dedicated capacity. Mobility can carry certification and support costs. Government services may require security and resilience investment.
The bridge should be tested by cohort and region. Management reporting that combines all services can hide cross-subsidy. Terminal value should use the contribution expected after customer acquisition and hardware replacement, not a headline service margin.
20. Connect demand to replacement decisions
Every replacement batch should have a capacity purpose. Maintenance batches preserve contracted or forecast contribution. Upgrade batches serve identified demand, relieve congestion, add resilience or enter a market with permissions and distribution.
The investment committee should require a replacement business case before manufacture. It should show retiring capacity, committed demand, forecast traffic, expected price, satellite and launch cost, ground dependencies, downside use and cancellation point. Batches can be staged to preserve flexibility.
This discipline prevents technical momentum from driving capital. It also prevents underinvestment where profitable demand is obscured by aggregate network results. Replacement becomes a portfolio of dated capacity decisions.
21. Construct the sustainable free-cash-flow case
Sustainable free cash flow begins after deducting operating cost, customer acquisition, terminal cash, maintenance replenishment, ground renewal, spectrum and regulatory cost, tax and working capital. Growth investment is separately matched with incremental demand.
The forecast should extend through at least one full replacement cycle. A shorter period can place the capital cliff inside terminal value without explicit modelling. The terminal year should resemble a steady operating state, including average annual replacement and normalised subscriber acquisition.
Debt service should be tested against this cash flow. Financing based on pre-replacement EBITDA can create refinancing dependence. Lenders may require funded reserves, launch contracts, insurance, minimum liquidity and covenant headroom.
22. Set the terminal value correctly
A perpetual-growth terminal value assumes the business can maintain the asset base supporting terminal cash flow. The cash flow must therefore include steady-state replenishment. A multiple method requires the same discipline because comparable-company multiples reflect different capital intensity, maturity and accounting.
The analyst should cross-check terminal value against replacement-adjusted free cash flow, invested capital, subscriber contribution and capacity value. A terminal growth rate above long-run demand or pricing growth requires a clear mechanism. Technology gains may reduce cost or raise capacity, but competitors can pass benefits to customers.
Terminal value sensitivity should vary economic life, replacement unit cost, launch price, subscriber contribution, utilisation, churn and discount rate together. Single-variable tables can understate correlated downside.
23. Avoid accounting and valuation mismatches
Accounting depreciation may differ from economic replenishment. IFRS requires useful-life estimates and impairment testing, while fair value reflects market-participant assumptions. IAS 16 addresses depreciation of property, plant and equipment; IAS 36 addresses impairment; IFRS 13 provides the fair-value framework. [11][12][13]
An extension of accounting life can improve reported profit without creating cash. A shorter replacement policy can increase capital while improving service or capacity. The valuation model should reconcile accounting carrying values, tax bases and economic capital.
Capitalised development, launch and labour should be reviewed for consistency. Write-offs and impairment can reveal changed expectations, although they do not automatically set transaction value.
24. Value technology upgrades separately
New generations may improve throughput, power efficiency, routing, spectrum reuse, terminal compatibility or manufacturing cost. The analyst should define the measurable capability, evidence status, remaining development, incremental cost and customer benefit.
Upgrade value equals incremental cash flow after ground, terminal, launch and transition costs. It should not be capitalised merely because newer satellites carry more throughput. Capacity without demand can dilute returns. Incompatible terminals can create migration costs.
Technology options can be probability weighted and staged. A prototype, in-orbit demonstration, production qualification and commercial service are distinct evidence gates. Value increases when technical evidence and funded demand converge.
25. Build the hypothetical cohort model
The illustrative network contains 4,800 active satellites: 1,200 entering service in year one, 1,500 in year two, 1,300 in year three and 800 in year four. Economic life ranges from 4.8 to 5.8 years by cohort, producing an average of 5.3 years. Expected early failure adds 2.5 per cent to scheduled replacement.
The model assumes 906 scheduled replacements a year in steady state, plus 23 for failures. Manufacturing and launch cost averages USD 2.4 million per accepted replacement satellite, producing approximately USD 2.23 billion of annual orbital replenishment before ground renewal and working capital. These figures are hypothetical.
The case assumes customer and enterprise contribution of USD 3.05 billion after terminal and acquisition cash, network operating cost of USD 0.72 billion, ground renewal of USD 0.18 billion and other sustaining cash of USD 0.21 billion. Replacement-adjusted pre-tax cash is negative USD 0.29 billion. A valuation based on EBITDA alone would miss that result.
26. Repair the economics in the worked case
The hypothetical board considers five levers. A second-generation design raises capacity per satellite, manufacturing yield reduces accepted unit cost, diversified launch procurement lowers average launch cost, terminal redesign reduces acquisition cash and enterprise sales improve contribution per unit of congested capacity.
The combined remedial case reduces replacement cost per accepted satellite to USD 1.85 million and scheduled fleet equivalent to 4,300 satellites while preserving usable capacity. Annual orbital replenishment falls to approximately USD 1.55 billion. Customer contribution rises to USD 3.35 billion, while ground and other sustaining cash total USD 0.43 billion. Replacement-adjusted pre-tax cash becomes approximately USD 0.65 billion.
The improvement is conditional on in-orbit performance, production yield, launch contracts, terminal economics and customer demand. Each lever receives a milestone and downside case rather than immediate full credit.
27. Bridge headline value to replacement-adjusted value
The hypothetical headline terminal value is USD 7.4 billion. The bridge deducts USD 1.55 billion for capital omitted from the headline case, USD 0.60 billion for demand and churn risk, USD 0.35 billion for launch and manufacturing concentration and USD 0.40 billion for spectrum, market-access and disposal risk. The resulting replacement-adjusted value is USD 4.50 billion.
An upgrade option can add value after evidence gates. In the illustration, a probability-weighted USD 0.70 billion technology option is offset by USD 0.45 billion of required ground, terminal and transition investment, adding net USD 0.25 billion. The final illustrative value becomes USD 4.75 billion.
The bridge prevents replacement liabilities from being hidden in the discount rate. It also keeps technology upside visible without treating it as completed.
28. Stress correlated downside
The severe case combines a one-year reduction in economic life, ten per cent higher replacement cost, six-month launch delay, slower subscriber growth, higher terminal subsidy and two percentage points more annual churn. These variables can interact because ageing satellites and delayed launches constrain service while customer economics weaken.
The model should calculate liquidity, service capacity, covenant headroom and funding need through the transition. Management actions may include slowing geographic expansion, repricing congested services, reducing subsidies, staging replacement batches, adding wholesale capacity or raising equity. Each action has timing and commercial consequences.
The board should identify the earliest decision date, rather than wait for the cash minimum. Component orders and launch deposits can make later cost reductions impossible.
29. Structure financing around the cycle
Financing should match the evidence and cash profile. Corporate equity can fund technology and market uncertainty. Vendor finance or export credit may support manufacturing. Launch prepayments can secure capacity. Project-style debt may become possible where contracted revenue, defined assets, reserves and replacement funding are credible.
Debt sizing should use replacement-adjusted cash and downside liquidity. A funded replenishment reserve can reduce interruption risk, although it ties up capital. Covenants may test active capacity, contracted revenue, launch cover, liquidity and regulatory status alongside leverage.
Refinancing should not be the only source of replacement capital. A lender needs visibility over satellite title, insurance, spectrum dependencies, launch contracts, ground assets and step-in limitations.
30. Design transaction diligence
An acquisition or financing data room should include fleet register, telemetry summaries, failure and anomaly logs, remaining-life analysis, production yield, supplier commitments, launch contracts, gateway rights, spectrum filings, national licences, customer contracts, terminal economics, network utilisation and cohort cash flow.
Technical, commercial, regulatory and financial teams should share one cohort identifier. This allows a satellite generation to be traced from bill of materials and launch through capacity, customers, revenue and replacement. Inconsistent identifiers create false reconciliation.
Confirmations should focus on high-value dependencies: notifying administration, material market licences, key launch providers, manufacturers, gateway hosts, enterprise customers and insurers. Diligence should protect controlled or security-sensitive information.
31. Establish governance after closing
The board should approve a rolling fleet and capacity plan, annual replacement budget, launch strategy, spectrum and sustainability report, customer-economics thresholds and technology gates. Capital approval should show the retiring cohort, demand served, evidence confidence and downside liquidity.
Monthly reporting can include active and degraded satellites, expected remaining service, replacement work in process, manufacturing yield, launch cover, usable capacity, congestion, subscriber contribution, terminal payback, regulatory milestones and disposal performance.
Independent review is appropriate when management changes useful life, replacement policy or terminal assumptions materially. Those changes affect earnings, capital and valuation together.
32. Define the investment decision
The final decision should state the replacement-adjusted enterprise-value range, funding required through the next cycle, key regulatory rights, customer contribution, launch and manufacturing dependencies, downside liquidity and conditions for technology upside.
Approval can be staged through closing conditions, milestone consideration, escrow, earnouts, committed capital tranches or covenants. Price should remain connected to verified operating capacity and sustainable cash.
The board should record the evidence that would change the decision. A valuation framework becomes useful when it supports action under uncertainty and can be refreshed as cohorts mature.
33. Reconcile valuation with market evidence
Market evidence can test the model, although no quoted multiple removes the need to model replacement. Public operators differ in constellation maturity, vertical integration, launch access, customer mix, spectrum position, government exposure and accounting. Private transactions may include strategic rights, preferred securities, commercial agreements or funding commitments that are not visible in headline value.
The analyst should build a comparison matrix before using revenue, subscriber, capacity or EBITDA multiples. The matrix should show forecast period, replacement treatment, terminal subsidies, ground investment, spectrum perimeter, launch relationship, net debt and remaining deployment capital. Adjusted observations can then inform a range rather than a single benchmark.
Recent funding prices may reflect scarcity, strategic access or an investor's portfolio benefits. They should be reconciled to the rights acquired and the capital still required. A transaction completed before the first replacement cycle can be informative about demand for the asset class while providing limited evidence about sustainable free cash flow.
34. Incorporate tax and jurisdictional cash movement
Constellation revenue, assets and licences can span many jurisdictions. The valuation should map service entities, satellite ownership, intellectual property, gateways, customer billing, withholding taxes, indirect taxes, transfer pricing and cash repatriation. Regulatory entities may need local capital or restrictions on distributions.
Tax depreciation can differ from accounting and economic life. Launch and satellite expenditure may receive different treatment by jurisdiction. Losses generated during deployment may expire or remain trapped outside profitable entities. The model should therefore calculate cash tax by legal entity and scenario rather than apply a group rate mechanically.
Change of control can affect tax attributes, licences and intercompany agreements. Transaction structure may alter the perimeter of debt, intellectual property and spectrum rights. Tax benefits should enter value after legal availability, timing and execution cost are established. The paper does not provide tax advice; transaction-specific advice is required.
35. Test insurance and contingent liabilities
Insurance can cover launch, in-orbit failure, third-party liability or specific assets, subject to exclusions, deductibles, aggregate limits and market capacity. Large constellations may retain meaningful risk because insuring every spacecraft is uneconomic or unavailable. The analyst should reconcile insured values, premiums, claims history and self-insured exposure.
Liability can extend beyond the replacement cost of a satellite. A launch failure can delay a cohort. A disposal failure can create regulatory and operational consequences. Service interruption can trigger credits or claims. Government customers may require indemnities, security controls or priority restoration.
Expected loss should be modelled through frequency, severity and correlation. Rare events can affect multiple satellites, a shared component, a launch batch or ground infrastructure. Insurance recoveries should reflect policy terms and collection timing. Uninsured exposure belongs in liquidity and value, while remote legal outcomes should remain scenario-specific rather than presented as certain obligations.
36. Establish evidence confidence and refresh rules
Every material assumption should carry a source, date, owner and confidence level. Direct telemetry, executed contracts, accepted production records and regulatory approvals provide stronger evidence than forecasts, non-binding customer interest or technical roadmaps. Confidence affects scenario weighting and the structure of price protection.
The model should refresh when a new cohort enters service, a material anomaly occurs, launch procurement changes, spectrum milestones move, customer pricing changes or management revises economic life. A quarterly refresh may be appropriate during deployment and replacement, supported by a monthly operational dashboard.
Evidence confidence should also determine diligence expenditure. A high-value assumption supported only by management forecast warrants independent technical, commercial or contractual verification. A low-value assumption may be monitored through sensitivity. This proportional approach focuses time and cost on the variables capable of changing price, financing capacity or approval.
Version control is essential because small changes in life, replacement cost and subscriber contribution can alter value materially. The board pack should retain the prior model, explain changes and identify which evidence changed. A model that cannot reproduce its earlier decision is unsuitable for transaction governance.
Conclusion
The first replacement cycle converts a LEO constellation from a deployment story into an operating infrastructure business. Satellite cohorts, usable capacity, subscribers, terminals, launch, spectrum, ground assets and disposal must be valued as one continuing system.
Recurring replenishment belongs inside sustainable free cash flow and terminal value. Technology improvements can create material upside after demand and operating evidence are established. Cohort-based modelling exposes the dates, capital and dependencies that aggregate satellite counts conceal.
For boards and transaction teams, the practical test is direct: can the network replace ageing capacity, protect service quality and generate cash through the cycle without relying on unmodelled capital? The answer determines financeability and value.
Appendix A. Fleet cohort register
The minimum register contains spacecraft identifier, generation, batch, launch, shell, service-entry date, capacity, failure status, degradation, manoeuvrability, expected exit, disposal plan and replacement batch. Records should reconcile operator telemetry, production acceptance, launch manifests and regulatory reporting.
Appendix B. Customer and capacity register
For every material geography and service, record usable capacity, reserved capacity, active terminals, traffic, price, contribution, churn, acquisition cash, service commitment and regulatory permission. This register connects demand with the orbital cohorts that support it.
Appendix C. Replacement approval checklist
Each batch should identify retiring capacity, accepted unit cost, production slot, launch slot, ground readiness, customer demand, spectrum status, disposal capacity, liquidity, downside use and cancellation point. Approval evidence should be dated and owned.
Appendix D. Worked-case figures and tables
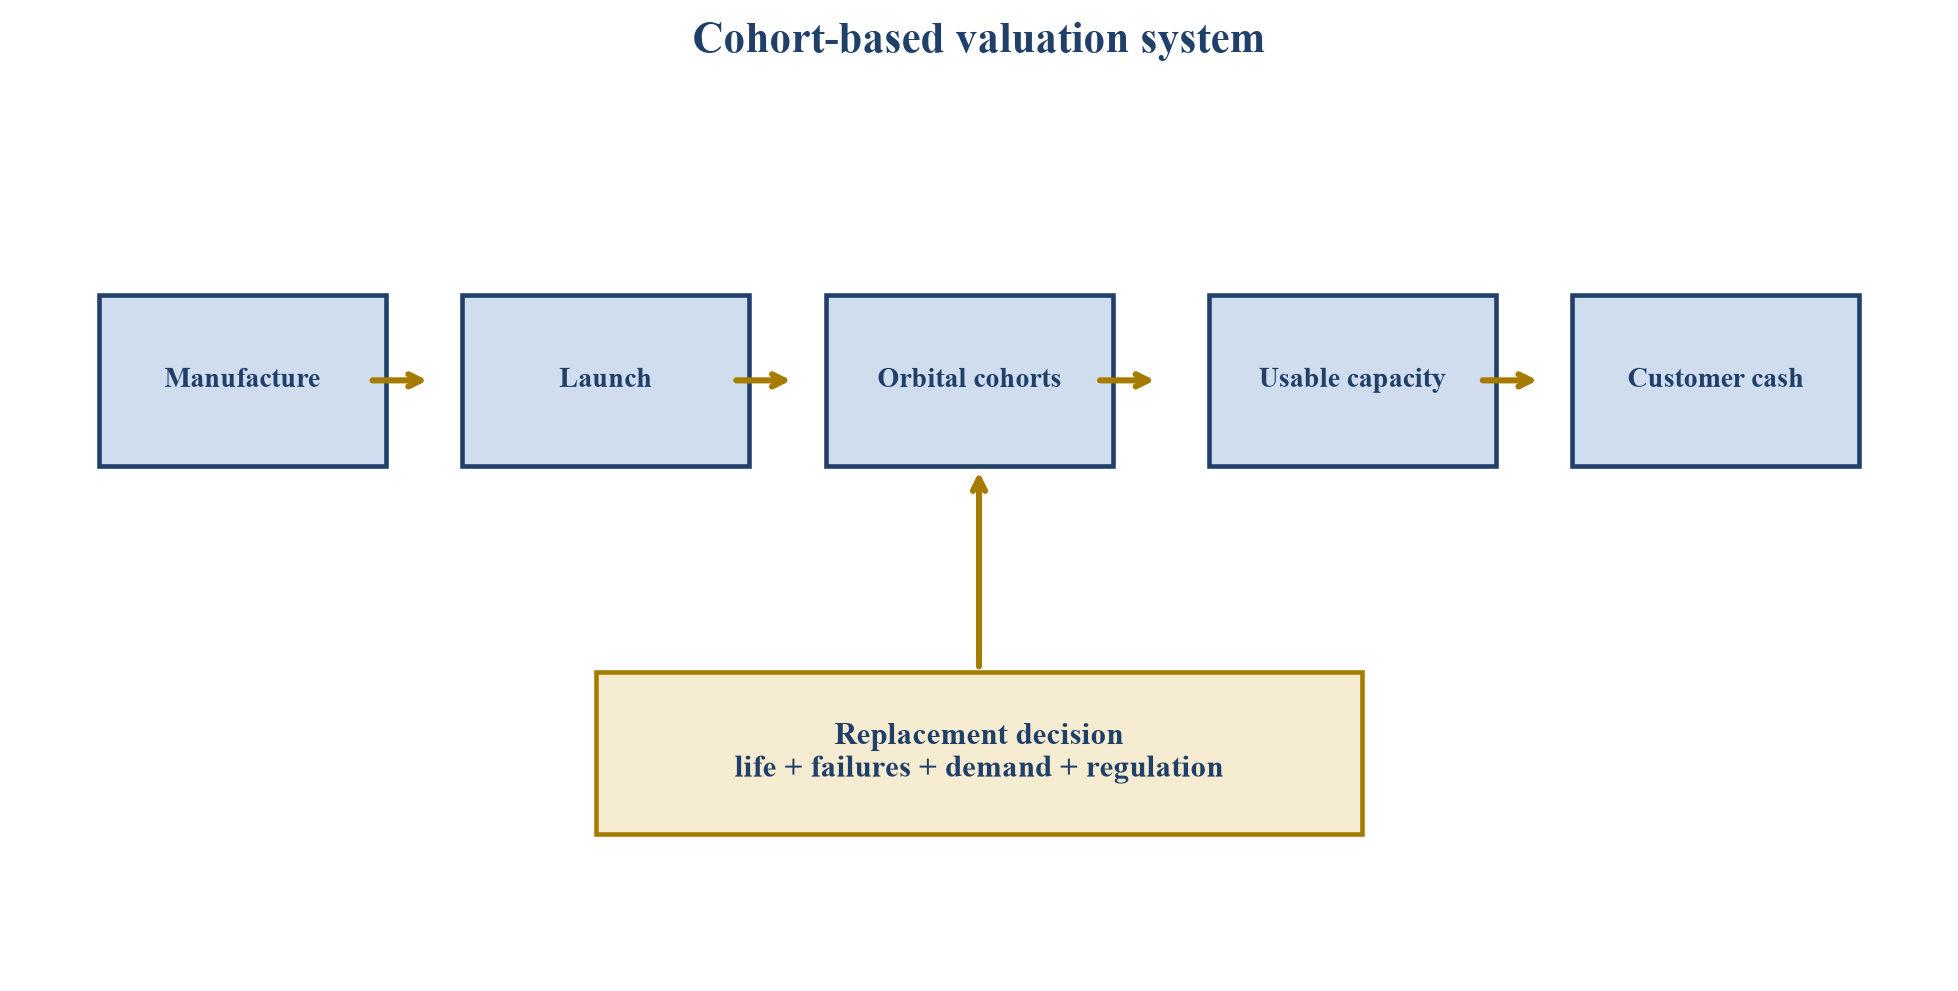
Proposed architecture connecting satellite cohorts, capacity, customers, cash contribution and replacement decisions.
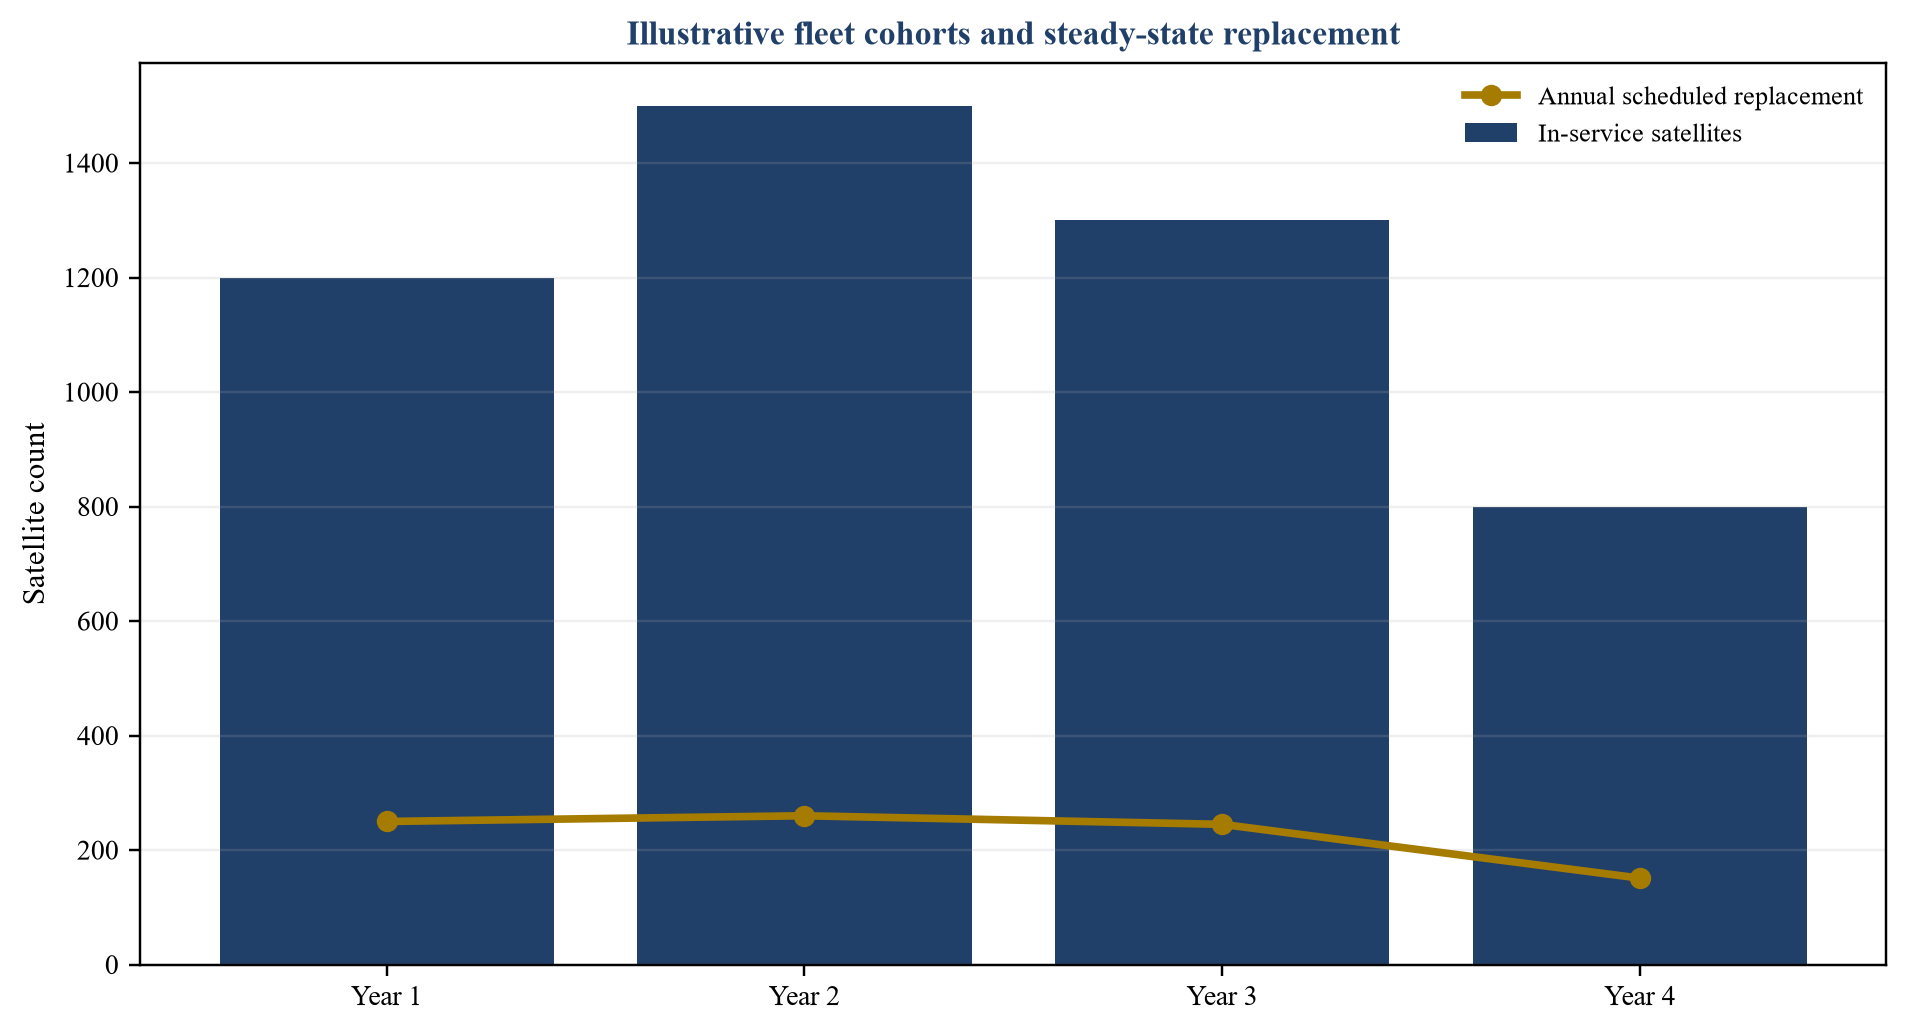
Hypothetical in-service fleet by cohort and annual scheduled replacement before failures or growth.
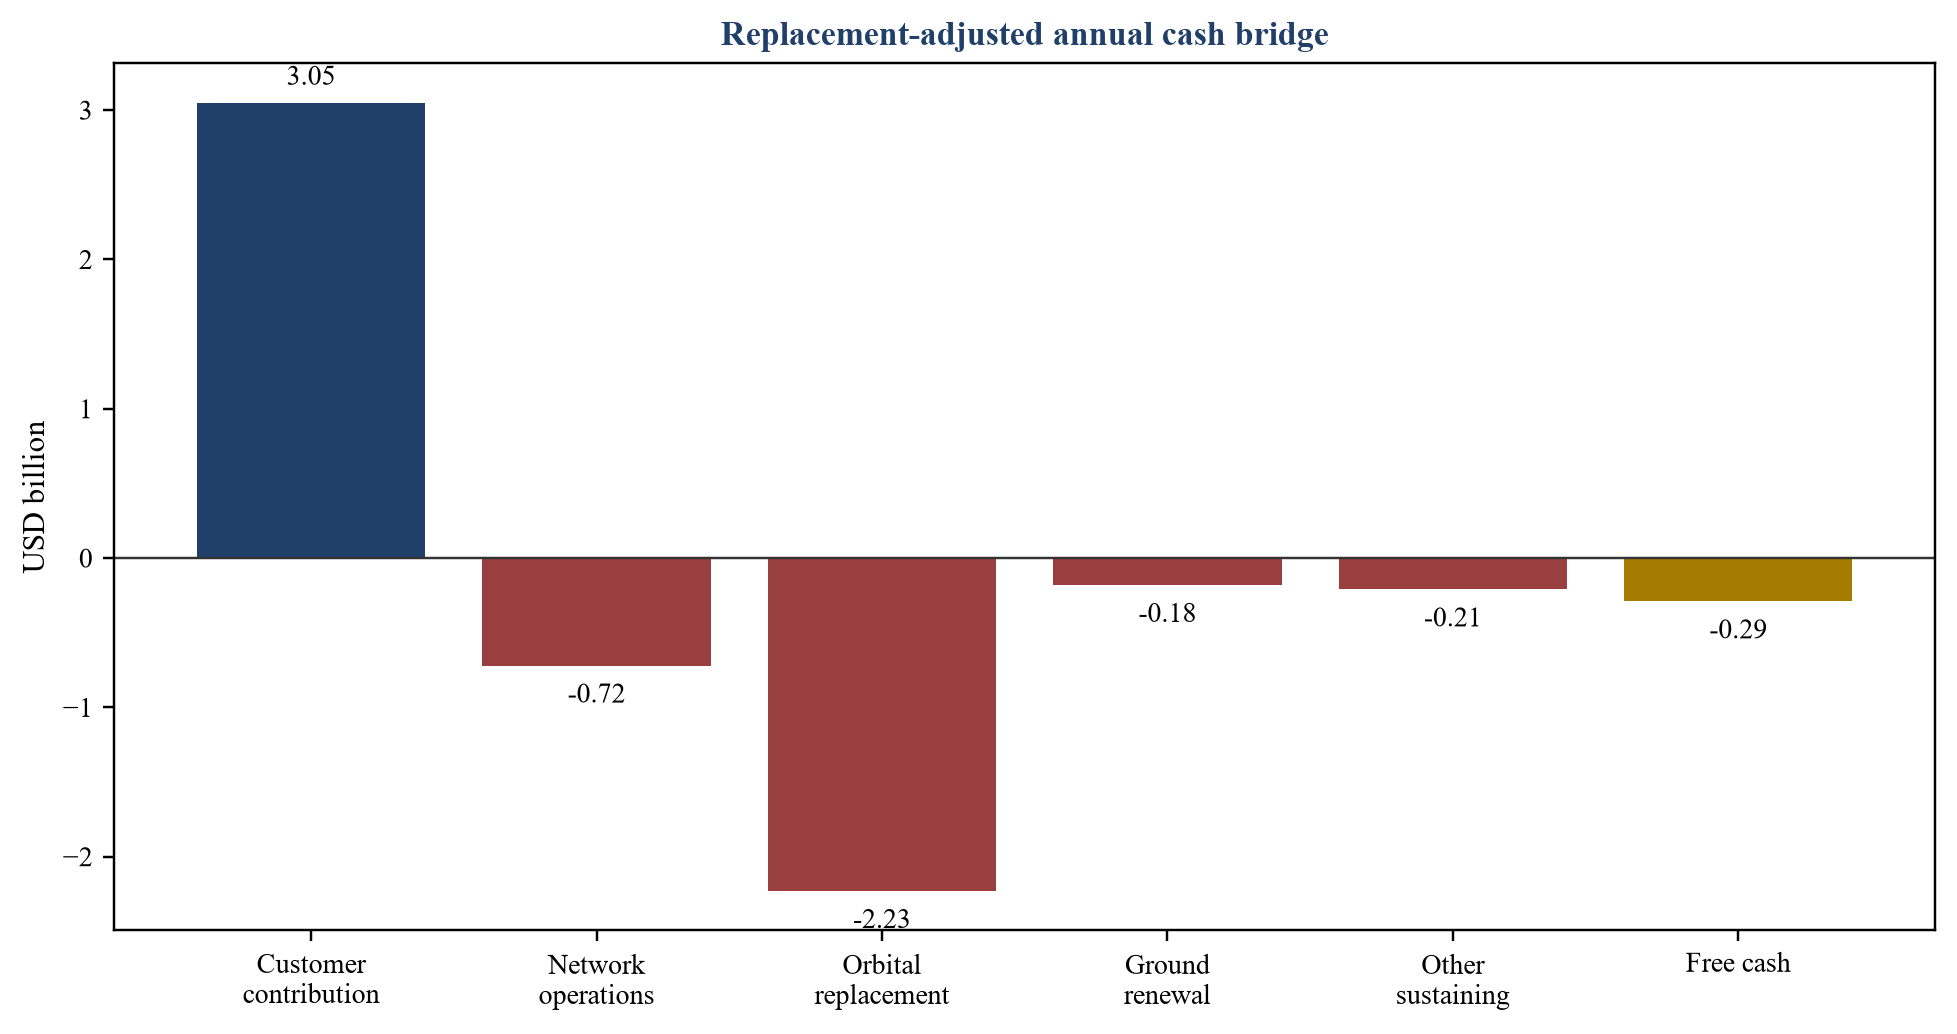
Hypothetical annual customer contribution less network operations, orbital replenishment, ground renewal and other sustaining cash.
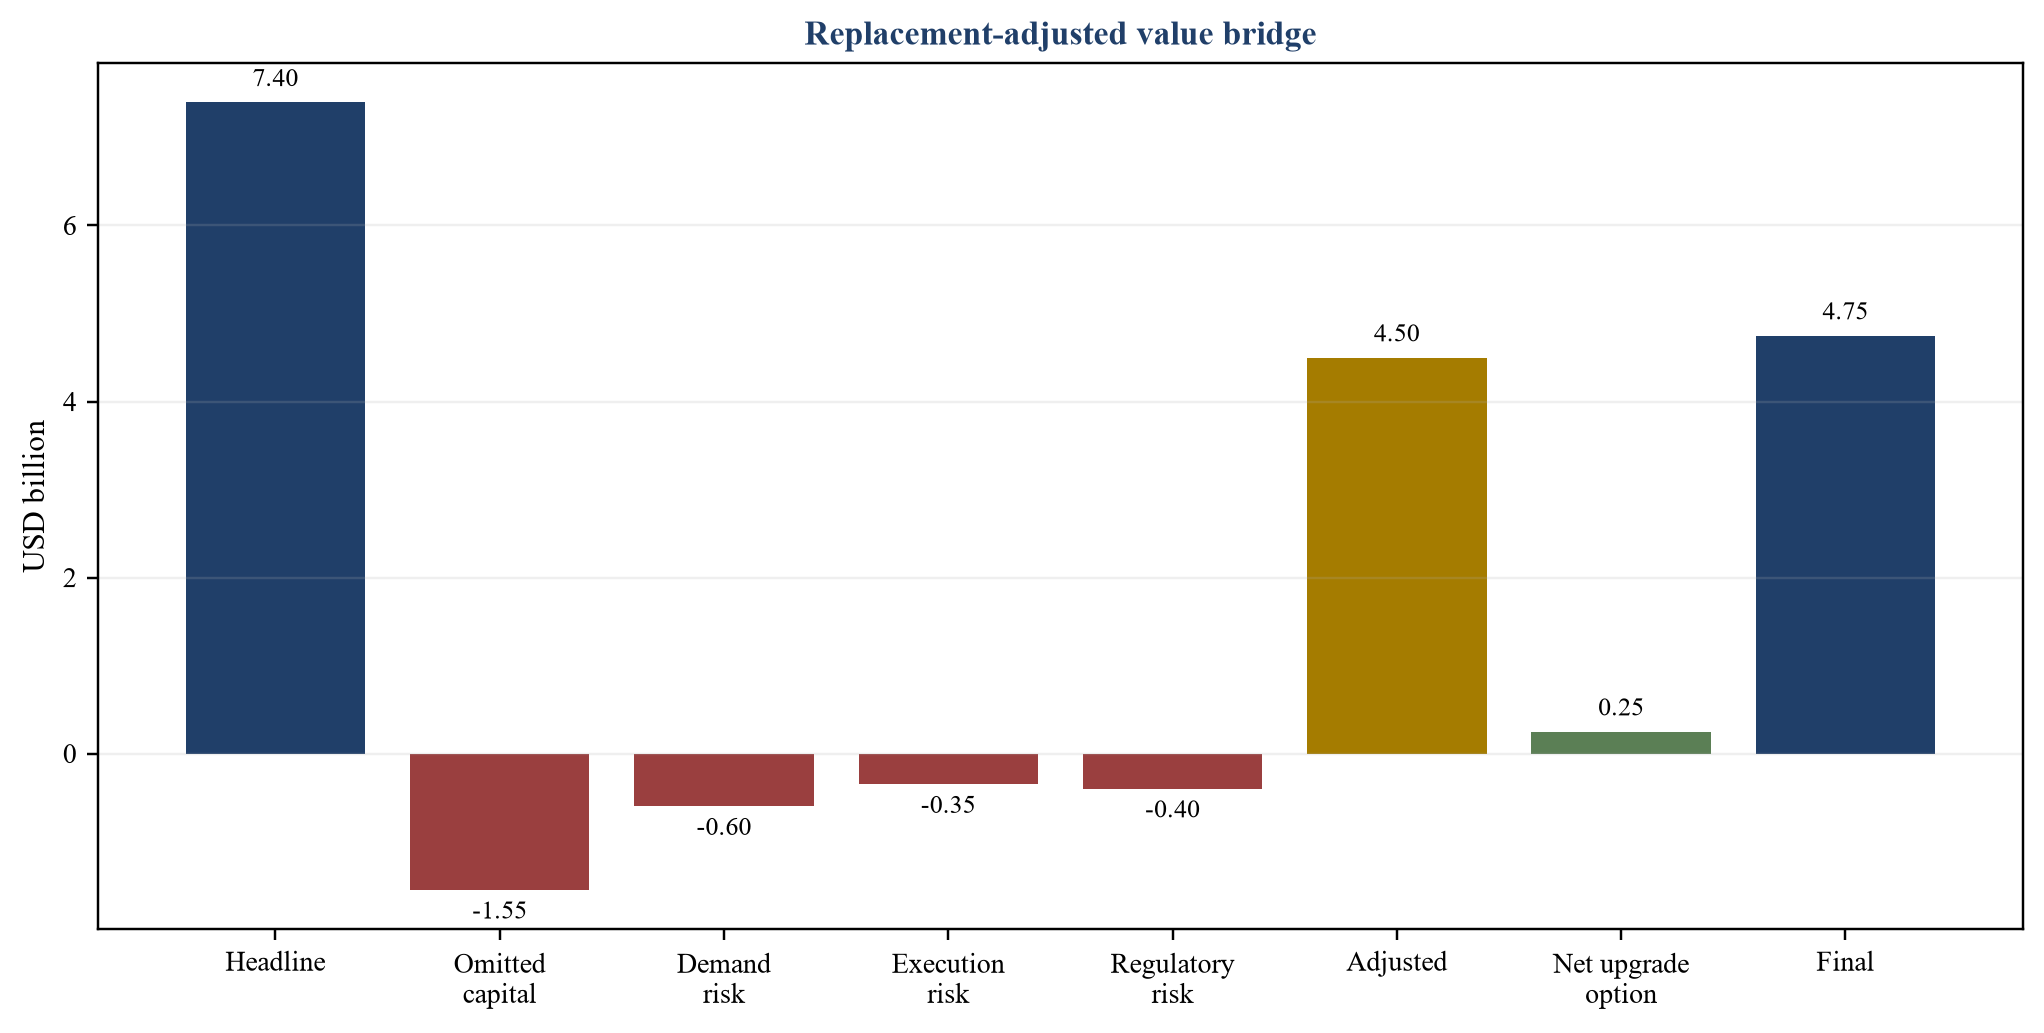
Hypothetical bridge from headline terminal value to replacement-adjusted value and net technology option.
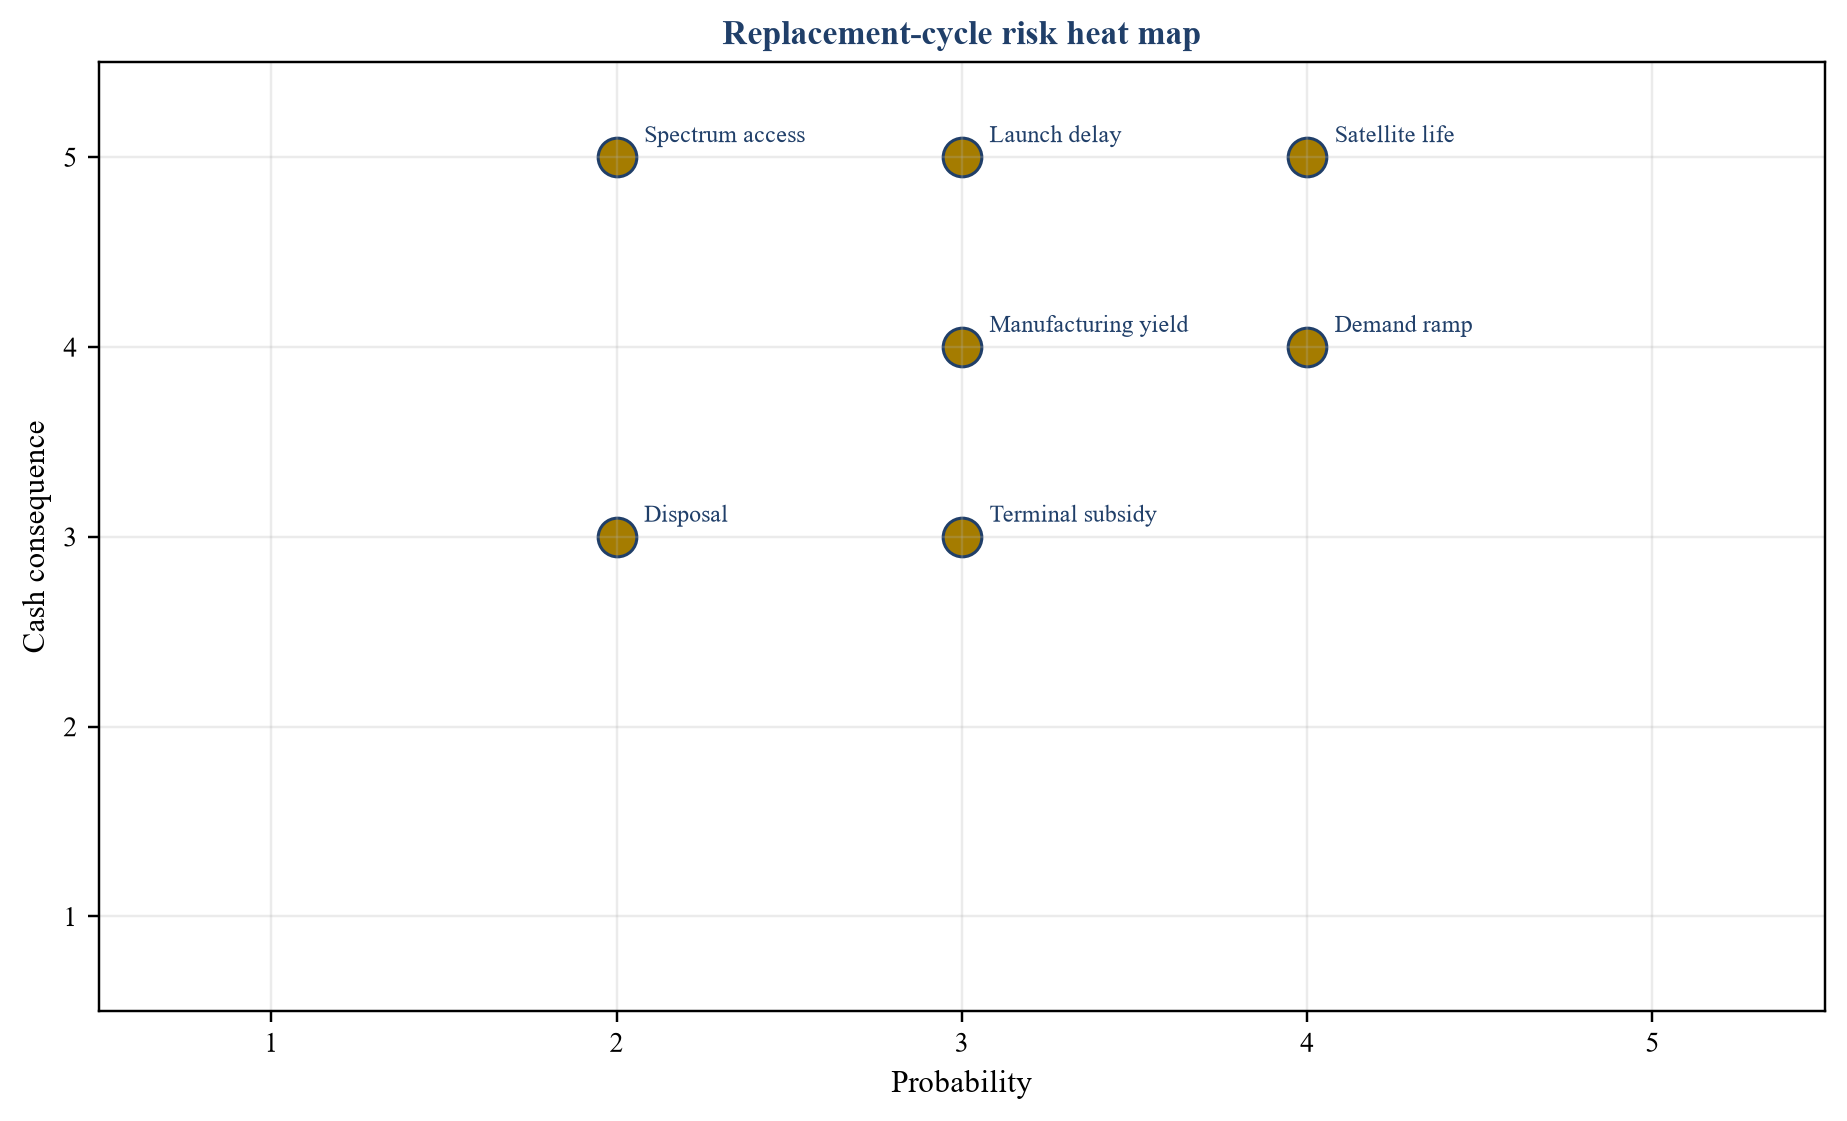
Illustrative probability and cash consequence assessment for key replacement-cycle risks.
| Evidence | Required measure | Valuation use |
|---|---|---|
| Production and launch | accepted satellites by batch and mission | cohort size and cost |
| Service entry | date and usable capacity | productive life |
| Reliability | failure degradation and manoeuvrability | survival curve |
| Retirement | expected exit and disposal route | replacement timing |
| Regulation | filing licence and reporting status | operating right |
Proposed diligence fields.
| Item | Assumption | Annual result |
|---|---|---|
| Active fleet | 4,800 satellites | 4,800 |
| Average economic life | 5.3 years | 906 scheduled replacements |
| Early failure addition | 2.5 per cent | 23 replacements |
| Accepted unit cost | USD 2.4 million | USD 2.23 billion |
| Ground renewal | stated case | USD 0.18 billion |
All figures are illustrative and describe no identified operator.
| Service | Revenue evidence | Required cash deductions |
|---|---|---|
| Consumer | active billed terminal | subsidy acquisition support churn |
| Enterprise | executed minimum commitment | integration dedicated capacity support |
| Mobility | certified installed terminal | channel share certification operations |
| Government | funded service order | security resilience reserved capacity |
| Wholesale | contracted traffic or capacity | distributor share and credit risk |
Proposed reconciliation.
| Step | Amount | Evidence required |
|---|---|---|
| Headline terminal value | 7.40 | forecast method and terminal assumptions |
| Omitted replacement capital | minus 1.55 | cohort and accepted unit cost |
| Demand and churn risk | minus 0.60 | customer cohorts and capacity utilisation |
| Launch and production risk | minus 0.35 | contracts throughput and yield |
| Spectrum regulatory disposal risk | minus 0.40 | rights milestones and performance |
| Replacement-adjusted value | 4.50 | integrated model |
| Net technology option | plus 0.25 | milestones and incremental cash |
| Final illustrative value | 4.75 | board-approved evidence set |
All amounts are illustrative USD billions.
| Gate | Approval evidence | Stop condition |
|---|---|---|
| Capacity need | retiring cohort and funded demand | unallocated capacity |
| Technical | qualified design and production yield | unresolved critical anomaly |
| Launch | binding slot and compatible mission | unfunded or uncontracted access |
| Ground | gateways software and terminals ready | material dependency incomplete |
| Finance | replacement-adjusted liquidity | financing gap before service |
| Regulation | filings licences and disposal compliant | milestone or market-access breach |
Proposed board control.
| Requirement | Potential instrument | Evidence gate |
|---|---|---|
| Design and market uncertainty | equity | in-orbit and customer proof |
| Satellite manufacturing | vendor or export finance | accepted units and title |
| Launch procurement | deposits or committed facility | slot and provider contract |
| Contracted service capacity | project-style debt | minimum revenue and replacement reserve |
| Technology upgrade | milestone capital | performance and compatible demand |
Proposed risk allocation.
| Dimension | Core measure | Trigger |
|---|---|---|
| Fleet | active degraded and remaining life | retirement cliff |
| Production | accepted output yield and rework | replacement delay |
| Launch | covered batches and schedule variance | capacity gap |
| Customers | contribution churn and terminal payback | negative cohort economics |
| Capacity | utilisation congestion and resilience | service deterioration |
| Regulation | milestones licences disposal performance | operating-right risk |
| Liquidity | replacement-adjusted cash and reserve | funding shortfall |
Proposed monthly decision record.
Sources
- Federal Communications Commission, SpaceX Gen2 Starlink authorisation conditions and reporting requirements, DA 24-1193. Read the primary source
- International Telecommunication Union, Non-geostationary-satellite networks and Resolution 35 milestone approach. Read the primary source
- Telesat Corporation, 2025 Annual Report. Read the primary source
- Telesat Corporation, 2025 financial results and Lightspeed financing disclosure. Read the primary source
- Amazon, Project Kuiper first full-scale deployment and launch procurement. Read the primary source
- Amazon, satellite production facility and production-capacity disclosure. Read the primary source
- Federal Communications Commission, Gen2 Starlink environmental and failure reporting record, DA 26-36. Read the primary source
- Amazon, optical inter-satellite link test. Read the primary source
- International Telecommunication Union, WRC-23 international regulation of satellite services. Read the primary source
- UK Government, Operating an orbital space object: rules and regulations. Read the primary source
- IFRS Foundation, IAS 16 Property Plant and Equipment. Read the primary source
- IFRS Foundation, IAS 36 Impairment of Assets. Read the primary source
- IFRS Foundation, IFRS 13 Fair Value Measurement. Read the primary source
- International Private Equity and Venture Capital Valuation Guidelines. Read the primary source
- United Nations Office for Outer Space Affairs, Guidelines for the Long-term Sustainability of Outer Space Activities. Read the primary source
- United Nations Office for Outer Space Affairs, Registration Convention. Read the primary source
- UK Government, Space regulatory financial tools package and sustainability response. Read the primary source
- UK Space Agency, Connectivity in Low Earth Orbit programme. Read the primary source
- Amazon, 2024 Letter to Shareholders and Project Kuiper return objective. Read the primary source
- Telesat Corporation, Lightspeed programme capital plan and satellite configuration. Read the primary source
- Iridium Communications, 2025 Annual Report and satellite useful-life estimation. Read the primary source
- International Telecommunication Union, Regulation of Satellite Systems. Read the primary source
- United Nations Office for Outer Space Affairs, Outer Space Treaty. Read the primary source
- United Nations Office for Outer Space Affairs, Liability Convention. Read the primary source
- Amazon, Amazon Leo mission deployment updates. Read the primary source
