

1. Define the portfolio decision
The investment committee must decide how much exposure to allocate across power, grid equipment, data-centre real estate, semiconductor capacity and compute services. It should also determine how much capital to reserve for interconnection, construction, equipment, commissioning, customer ramp and refinancing.
The decision requires a single portfolio view because one bottleneck can delay several assets at once. A fund can own a power project, a data-centre platform and an accelerator supplier while remaining concentrated in the same grid node, packaging capacity, cloud customer or financing window.
2. Define the AI infrastructure chain
The chain begins with generation and grid capacity, continues through site control, substations, transformers, cooling and buildings, and reaches accelerators, memory, networking, software and customers. Revenue emerges only when these elements form an accepted service.
The International Energy Agency describes data centres as integrated systems containing servers, storage, networks, power supply, grid connection, cooling and backup infrastructure [1]. Portfolio analysis should therefore follow the complete service rather than one asset label.
3. Treat the three assets as one risk system
Power, chips and compute affect one another through timing, capacity and economics. A delayed transformer can idle installed servers. A chip delay can leave energised capacity underutilised. A cooling limitation can reduce rack density and change sellable compute. A customer change can alter both chip mix and load profile.
The fund should map these causal links before approving investments. The risk system should state which company controls each link, what evidence establishes readiness, which party bears delay cost and how long substitution takes.
4. Distinguish capacity from availability
Headline capacity does not establish an investable service. Grid studies, power agreements, transformer delivery, building completion, chip allocation, network integration and customer acceptance can each constrain availability. The lowest usable capacity in the chain limits output.
The committee should maintain a capacity waterfall from requested megawatts to secured, energised, commissioned and billable capacity. It should use the same discipline for chips, racks and compute units. Announcements and reservations belong outside the base case until conditions are satisfied.
5. Define the bottleneck clock
Each dependency has a different lead time. Data-centre development can move faster than transmission and generation. Semiconductor fabs and packaging capacity require long planning and construction. Customer workloads can shift faster than physical assets.
The IEA notes that data centres can become operational in two to three years while energy infrastructure often requires longer planning, construction and capital cycles [2]. The fund should build its reserve and liquidity plan around the slowest credible path rather than the most optimistic individual schedule.
Table 1. Power-chips-compute capacity and evidence ladder
| System layer | Announced state | Investable evidence | Primary failure mode | Portfolio consequence |
|---|---|---|---|---|
| Power | Requested or marketed megawatts | Executed interconnection, funded network works, deliverable generation, energisation plan and operating limits | Queue delay, generation shortfall, transformer constraint or curtailment | Delayed facility revenue and additional interest during construction |
| Facility | Controlled land or planned data centre | Site rights, permits, design, procurement, funded construction and commissioning evidence | Permit, water, cooling, contractor, schedule or cost failure | Stranded power rights, capex overrun and delayed customer acceptance |
| Chips | Roadmap allocation or purchase intention | Binding supply terms, approved configuration, packaging and memory availability, delivery and warranty | Accelerator, HBM, packaging, networking or export-control constraint | Lower rack deployment, changed performance and idle facility capacity |
| Compute | Installed equipment or benchmark claim | Integrated cluster, accepted performance, service availability, metering and support | Network, software, cooling, reliability or utilisation failure | Service credits, lower revenue and higher cost per useful compute unit |
| Customer cash | Pipeline or reservation | Credit-approved contract, measurable service, acceptance, minimum payment, invoice and collection | Ramp delay, cancellation, credit deterioration or price reset | Lower debt capacity, reserve pressure and valuation change |
The ladder is a portfolio-control framework; company-specific rights, capacity and dates require direct verification.
6. Establish the portfolio population
The population should include every fund holding, side vehicle, development joint venture, equipment-finance exposure, reserve commitment and material contract. Proposed assets should remain separate from signed investments. The record should reconcile to legal ownership, valuation schedules, capital calls and portfolio reporting.
The manager should also include look-through dependencies outside the fund. A facility may contract with a utility, chip distributor, network provider and cloud customer. Each underlying counterparty and condition can affect several holdings.
7. Map geographic concentration
AI data centres are geographically concentrated because power, fibre, land, customers and specialist labour cluster. The IEA reports that nearly half of United States data-centre capacity is located in five regional clusters [3]. Local grid and permitting constraints can therefore affect a large share of national capacity.
The fund should map each site to balancing area, substation, transmission zone, water system, fibre route and hazard profile. Geographic diversification should follow independent infrastructure rather than postal address. Two campuses in different jurisdictions can share one transmission corridor or cloud availability zone.
8. Map grid-interconnection concentration
Interconnection requests can exceed the capacity that becomes operational. NERC's 2025 assessment describes uncertainty and delays in adding resources for new data centres and other large loads [4]. ERCOT adjusted reported data-centre load additions using observed delay and utilisation factors, illustrating the gap between requested and realised demand [4].
The portfolio map should record application status, studies, agreements, security, network upgrades, responsible party, energisation date and curtailment terms. A queue position without completed conditions should remain contingent.
9. Map generation concentration
Power supply can depend on one generation technology, fuel, market, utility or development programme. The IEA expects renewables, natural gas, nuclear and other sources to contribute to data-centre demand, with regional variation [3]. Each route carries different delivery, price, emissions and reliability characteristics.
The fund should separate physical supply, financial hedges, certificates and contractual claims. A power-purchase agreement does not by itself establish deliverability to the site. Transmission, shape, balancing, congestion and curtailment remain material.
10. Map transmission and transformer concentration
Large loads require substations, transformers, switchgear, transmission capacity and protection systems. The United States Department of Energy identifies transmission need arising from load growth, generation interconnection and congestion [5]. The IEA's 2026 update also highlights pressure on power electronics and transformers as AI rack density rises [6].
The fund should map manufacturer, specification, slot, deposit, delivery, testing, spares and replacement time. Several portfolio campuses can compete for the same equipment and engineering teams. One supplier delay can therefore create a fund-level event.
11. Map cooling and water concentration
Higher rack density can shift cooling design from conventional air systems toward liquid cooling and more complex heat rejection. Water availability, ambient conditions, equipment interfaces and maintenance can limit deliverable compute. The building's nameplate power can exceed the heat load it can sustain.
Diligence should connect chip configuration to rack density, cooling architecture, water and energy consumption, redundancy, commissioning and customer responsibility. The fund should test whether later accelerator generations fit the facility without material retrofit.
12. Map construction concentration
Several campuses can use the same contractor, modular supplier, commissioning team or critical equipment. Simultaneous programmes can strain labour, cash and management attention. A construction portfolio should therefore show common vendors and overlapping critical paths.
The manager should reconcile schedule, procurement, cost to complete, contingency and interface ownership. It should distinguish fixed-price protection from exclusions, allowances, change orders and contractor credit. Delay damages should be compared with actual revenue and financing exposure.
13. Map accelerator concentration
AI compute can rely on a small number of accelerator architectures and supply channels. Different facility investments can therefore share chip allocation, product-cycle and pricing risk. A change in one vendor's roadmap can affect power density, cooling, network and customer demand across the portfolio.
The fund should record ordered product, quantity, configuration, delivery window, cancellation, warranty, support and resale rights. A purchase order does not prove delivery or system acceptance. Concentration should be measured on cost, installed compute, revenue and reserves.
14. Map high-bandwidth-memory concentration
High-bandwidth memory is a critical element of advanced AI accelerators. United States export-control materials describe HBM as essential to AI training and inference at scale [7]. Packaging and memory availability can therefore constrain accelerator delivery even when logic dies exist.
The portfolio map should look through the accelerator to memory generation, supplier, packaging route and qualification. The fund should identify whether substitutions change performance, software or warranty. Memory exposure belongs in chip and compute scenarios.
15. Map advanced-packaging concentration
Advanced packaging connects logic, memory and chiplets into high-performance systems. NIST identifies metrology, thermomechanical behaviour, warpage, interconnects and heterogeneous integration as important manufacturing challenges [8]. GAO reports that United States incentive projects target gaps from materials through assembly, testing and packaging [9].
The fund should map packaging technology, provider, capacity, yield, substrate, test and lead time. A portfolio can appear diversified by chip vendor while remaining concentrated in one packaging route.
16. Map networking concentration
Useful compute depends on high-speed networking within racks, clusters and data-centre regions. Network architecture affects scaling efficiency, latency, failure domains and power. A large number of accelerators can deliver poor economics when interconnect or software cannot sustain workloads.
Diligence should examine topology, equipment supply, software, utilisation, failure history and customer workload. The fund should separate theoretical peak performance from measured job completion and billable service.
17. Map software-stack concentration
Accelerators require compilers, libraries, orchestration, scheduling, monitoring and model frameworks. Portfolios can share one software ecosystem even when physical assets differ. Switching cost can create durable demand and supplier leverage.
The manager should test portability, licensing, version support, security and actual migration experience. A claim of hardware independence should be supported by representative workloads and customer acceptance. Software concentration belongs in valuation and exit planning.
18. Map cloud-customer concentration
Several assets can serve the same hyperscaler, model developer or enterprise platform through different contracts. The IEA notes that data-centre investment has expanded rapidly and will require significant capital-market funding [6]. Customer capital discipline and AI economics can therefore affect the whole infrastructure chain.
The fund should look through special-purpose entities and operators to ultimate customer credit, workloads and budgets. It should distinguish contracted minimum payments from forecasts, options and reservations. Customer limits should aggregate power, space, equipment and compute exposure.
19. Map financing concentration
Power projects, data centres, chip inventory and compute platforms can seek debt and equity in the same market window. Higher rates, risk repricing or doubts about AI returns can delay several financings. Construction facilities and equipment loans can also depend on the same lenders or collateral values.
The manager should map maturity, draw conditions, covenants, collateral, customer requirements and refinancing dates. It should model simultaneous needs across holdings. Fund reserves should not assume every asset refinances on schedule.
20. Map policy and export-control concentration
Advanced computing chips, semiconductor manufacturing equipment, software and related technology can be subject to national-security controls. United States BIS materials describe controls on advanced computing items, HBM and manufacturing equipment [7,10]. Rules, destinations and licences can change addressable markets and supply routes.
The fund should maintain a current compliance matrix supported by qualified advice. It should identify product classification, end user, destination, licence, cloud-access restrictions and contractual consequences. Policy exposure can affect both chip availability and customer revenue.
21. Map semiconductor-policy dependence
Public incentives can support fabs, packaging, workforce and research. NIST's CHIPS for America programme covers manufacturing incentives, advanced packaging, technology centres and metrology [11]. GAO reports direct funding and loans across projects intended to strengthen the United States supply chain [9].
The manager should verify award, milestones, cost sharing, clawbacks, national-security conditions and company access. An announced programme is not cash available to a portfolio company. Incentive timing and obligations belong in financing and valuation.
22. Map utilisation correlation
Power, space and chips create fixed or committed cost before utilisation. AI workload demand can move quickly across training, inference, model size and hardware generations. Several facilities can therefore experience utilisation pressure from one customer or technology shift.
The fund should define usable capacity and measure reserved, installed, available, scheduled, consumed, billable and collected units. It should reconcile compute telemetry to invoices. Headline occupancy can conceal low accelerator utilisation or discounted commitments.
23. Map efficiency correlation
Hardware, software and cooling efficiency can reduce energy per task while expanding the range of economically viable workloads. The IEA's 2026 analysis reports rapid task-level efficiency improvement alongside growth in more energy-intensive applications [6]. Efficiency can change demand, product mix and competitive position across the portfolio.
The manager should avoid assuming that efficiency automatically lowers total electricity demand. It should model price, workload growth, utilisation and customer behaviour. Efficiency gains belong in scenarios supported by measured performance.
24. Map obsolescence correlation
Accelerator generations can improve performance and energy efficiency before facilities or financing mature. A portfolio holding chips, data centres and equipment lenders can face correlated residual-value risk. The effect depends on workload, software support, power cost and secondary demand.
The fund should record refresh cycle, customer responsibility, resale rights, depreciation, removal cost and financing terms. It should model the facility after a refresh, including higher rack density, cooling and electrical changes. Old equipment should not be assumed to retain a liquid market.
25. Map operational reliability correlation
AI compute can create large and dynamic electrical loads. NERC has established work on emerging large loads, modelling, commissioning and disturbance performance [12]. A common design, control system or load-management practice can affect several campuses.
The manager should examine ride-through, ramp rates, power quality, backup, testing and utility coordination. It should record whether operational flexibility is contractual and tested. Grid reliability events can create simultaneous service and regulatory consequences.
26. Build the dependency graph
The dependency graph should connect each holding to grid nodes, generation, transformers, cooling, chip vendors, HBM, packaging, networking, software, customers and capital providers. Every edge should carry an evidence grade, capacity, date and recovery period.
The graph should identify both risk and optionality. A portfolio power asset can support a portfolio data centre when rights, price, transmission and governance align. Strategic narratives should not create assumed synergies without contracts and operating authority.
Table 2. Evidence grades for power, chips and compute
| Grade | Evidence state | Base-case treatment | Required action | Review trigger |
|---|---|---|---|---|
| A | Executed, funded and tested capacity with current operating evidence | Include within documented limits and dates | Monitor performance, counterparty and renewal | Incident, variance, contract change or capacity reduction |
| B | Executed right with material construction, delivery or acceptance condition | Include conditionally with downside timing and capital | Close condition and preserve contingency | Missed milestone, cost change or supplier delay |
| C | Allocated or reserved capacity supported by preliminary terms | Exclude from firm output; retain as option | Verify security, capacity, schedule and approvals | Investment, procurement or financing decision |
| D | Management forecast or supplier indication without binding support | Treat as unverified planning input | Assign owner, evidence request and deadline | Immediate committee review |
| E | Unknown source, date, counterparty or recovery route | Treat as a critical diligence exception | Defer, limit or price exposure | Immediate |
Evidence grades support portfolio governance; they do not replace technical, legal, regulatory or commercial diligence.
27. Calculate look-through exposure
Look-through exposure should be shown on invested cost, fair value, planned reserves, megawatts, accelerator capacity, customer revenue and downside capital. Each lens reveals a different concentration. A chip supplier can be small in current fair value and large in future revenue dependency.
The calculation should retain gross exposure beside any probability-weighted measure. Scenario weights are management assumptions until observed. The committee should be able to trace every aggregate value to an asset, contract and evidence date.
28. Measure bottleneck centrality
A central bottleneck affects many holdings or value pathways. It can be one transmission node, transformer supplier, packaging provider, chip architecture, cloud customer or lender. High centrality identifies where diligence and mitigation can have fund-wide benefit.
The manager should rank dependencies by affected fair value, revenue, reserves and replacement time. A low-cost item with a two-year replacement can outrank a larger expense with immediate substitutes. Probability and consequence should remain separate.
29. Visualise the risk system
A network visual can show how distinct assets converge on shared dependencies. Power projects, data centres, equipment suppliers and compute services should appear separately, with links to the nodes that constrain monetisation.
The figure should connect to an evidence table. Unknown or weak links should be visible. The graphic supports committee judgement and does not establish probability or valuation.
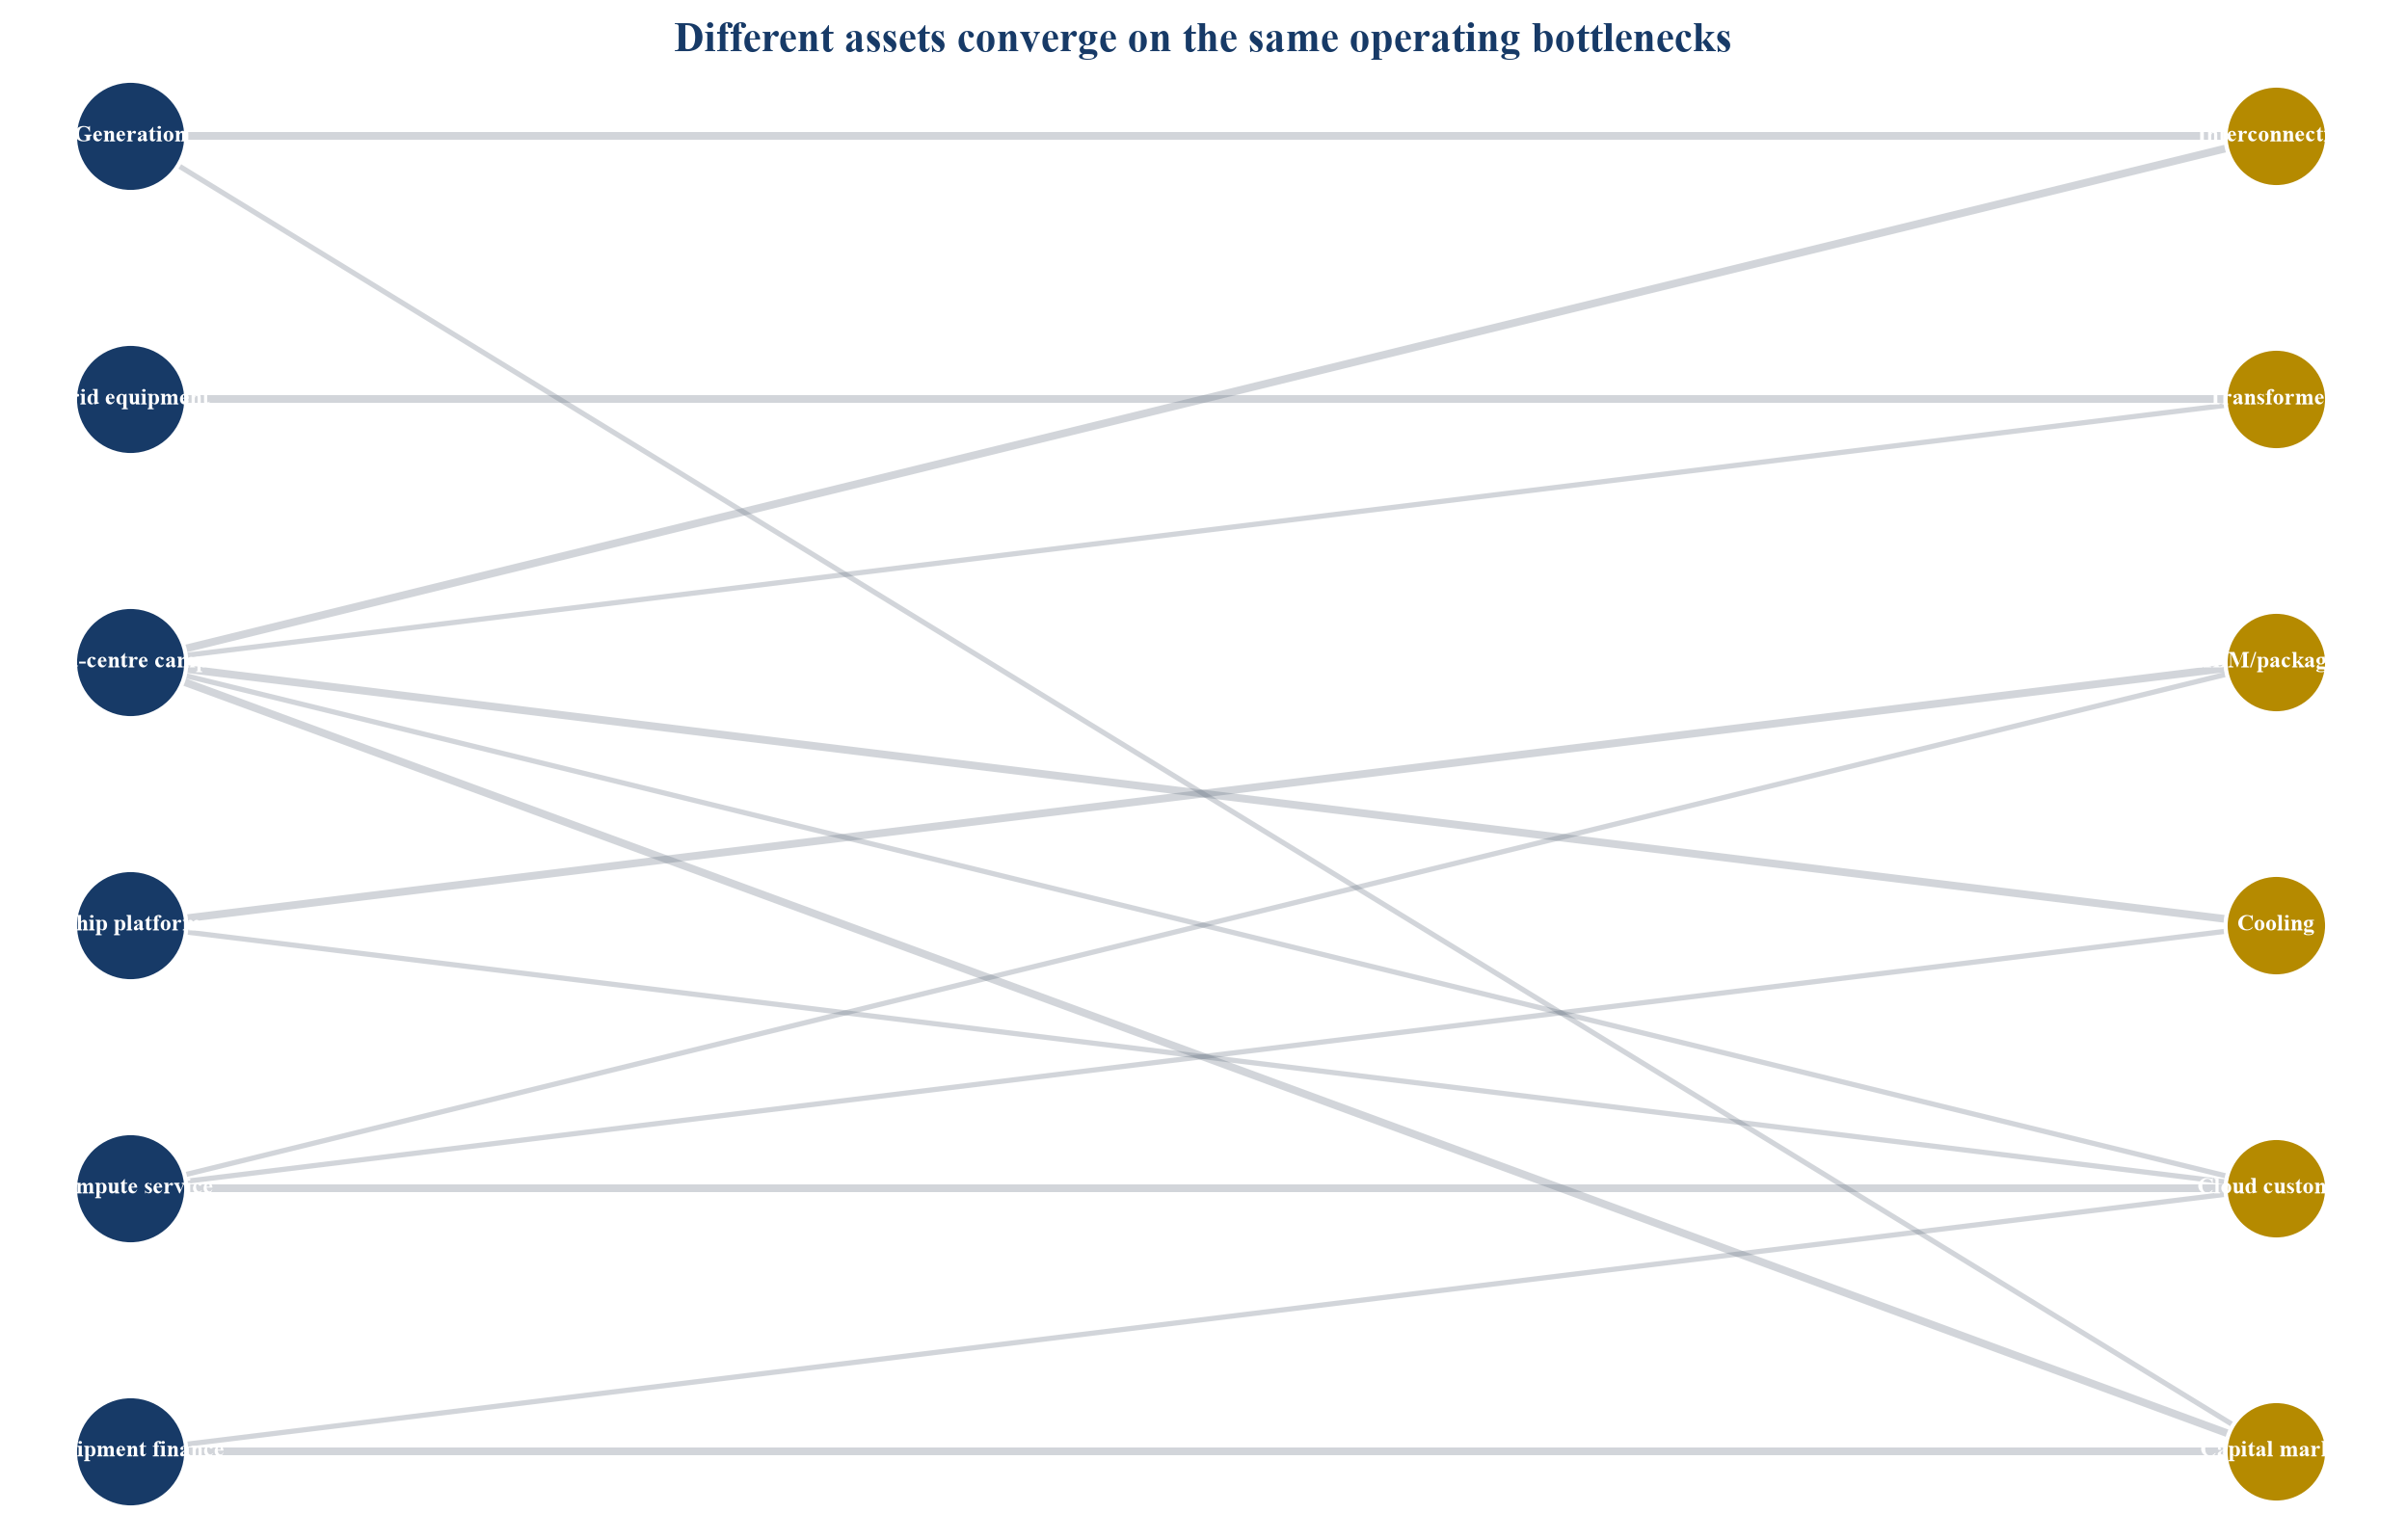
Nodes and links are hypothetical management assumptions prepared to demonstrate the framework.
30. Set power limits
Power limits should aggregate facilities by grid node, utility, transmission zone, generation source and energisation window. The fund can approve a maximum share of fair value and reserves dependent on one route before mitigation.
The limit should consider deliverability and recovery time. Contracted energy at another location does not replace unavailable power at the site. Exceptions should state evidence, duration, capital exposure and review trigger.
31. Set chip and packaging limits
Chip limits should cover architecture, vendor, product generation, HBM, packaging and network interfaces. The fund should show concentration across owned inventory, financed equipment and customer-provided hardware. Customer ownership can transfer obsolescence while preserving operational dependence.
The committee should test alternative configurations, software compatibility, performance, cooling and commercial acceptance. A technically possible substitute may not preserve customer economics or delivery date.
32. Set customer limits
Customer limits should aggregate power purchase, lease, equipment, cloud and compute contracts by ultimate economic buyer. Multiple counterparties within one corporate group or workload budget can create one exposure.
The fund should analyse credit, minimum payment, start conditions, ramp, service levels, termination, renewal and security. A reservation or framework should remain outside contracted cash. Customer concentration should be shown before and after guarantees.
33. Set construction-window limits
Several projects can enter procurement, construction and commissioning at the same time. Common contractors, transformers, cooling equipment and financing markets can create simultaneous capital calls. The fund should limit overlapping exposure or retain sufficient contingency.
The portfolio calendar should identify every critical milestone and shared vendor. It should include factory acceptance, delivery, installation, energisation, commissioning and customer acceptance. Dates should carry evidence grades.
34. Set financing limits
Financing limits should cover lender, instrument, maturity, covenant and refinancing market. Equipment-backed debt can share residual-value and customer risk across holdings. Project finance can depend on the same power and customer contracts used in equity valuation.
The manager should model correlated covenant pressure and refinancing. It should preserve liquidity for conditions precedent, cost overruns and delayed customer cash. Leverage should follow verified service capacity rather than planned megawatts.
35. Build shock scenarios
Shock scenarios should specify event, affected holdings, timing, cash consequence and action. They should include isolated and compound bottlenecks. A chip delay with an energised campus creates different economics from a grid delay with equipment already delivered.
The purpose is to identify decisions, not produce unsupported probabilities. The committee should update the cases when contracts, deliveries, performance and market evidence change.
Table 3. Hypothetical cross-portfolio AI infrastructure shock scenarios
| Scenario | Assets affected | Illustrative revenue timing effect | Illustrative additional capital need | Primary portfolio decision |
|---|---|---|---|---|
| Grid energisation delayed 12 months | Three campuses and one power asset | USD 72m revenue deferred | USD 48m interest, construction and runway | Rephase equipment, enforce rights and preserve contingency |
| Accelerator and HBM delivery reduced | Two campuses and one compute platform | USD 44m revenue deferred | USD 31m deposits, redesign and idle-capacity cost | Reallocate chips and qualify alternative configurations |
| Cooling redesign after density increase | Two campuses | USD 26m revenue deferred | USD 38m retrofit and commissioning | Fund redesign or constrain rack deployment |
| Cloud customer reduces ramp | Four contracts across three holdings | USD 85m contracted and forecast cash moves | USD 54m debt and liquidity requirement | Enforce minimums, remarket capacity and resize leverage |
| Capital-market repricing | Five holdings | No immediate service change | USD 67m additional equity and refinancing support | Rank follow-ons and syndicate or sell exposure |
| Compound power, chip and customer event | Six holdings | USD 138m cash delayed or impaired | USD 112m before mitigation | Protect highest evidence assets and restructure the remainder |
All values are illustrative management assumptions; they are not forecasts or market observations.
36. Model grid delay
The grid-delay case should start with the actual interconnection agreement, network works, equipment, responsible parties and current schedule. It should trace construction interest, idle equipment, customer remedies, operating costs and alternative power.
Management should distinguish temporary generation, behind-the-meter supply and financial hedges. Each alternative requires lawful operation, capacity, fuel, emissions, reliability and customer acceptance. The fund should compare bridge cost with preserved enterprise value.
37. Model chip delay
The chip-delay case should record binding allocation, product, quantity, packaging, memory, delivery, payment and cancellation. It should identify whether other portfolio companies compete for the same units and whether reallocation is permitted.
The company should show the compute and customer effect of alternative hardware. Benchmark results should use representative workloads and total system cost. A lower chip count can preserve revenue when software and customer requirements allow it.
38. Model customer-ramp delay
The customer-ramp case should trace contract start, acceptance, minimum payments, options, service credits and termination. It should distinguish available capacity from customer consumption and recognised revenue from collected cash.
The fund should assess remarketing rights, technical specificity and fit-out ownership. A campus designed for one customer may require material time and capital to serve another. Debt documents can restrict replacement customers.
39. Model efficiency upside
Efficiency can increase useful compute per megawatt, reduce cost or release capacity. It can also accelerate obsolescence or reduce the value of older infrastructure. The model should specify hardware, software, workload and measurement boundary.
The fund should avoid applying one efficiency assumption to every holding. Gains should be supported by observed performance and customer economics. Released power has value only when the facility can deploy additional equipment and sell service.
40. Model regulatory change
Export controls, grid rules, environmental requirements and data policy can change supply or demand. The model should identify the exact rule, effective date, jurisdiction, affected contract and lawful alternatives. General geopolitical concern is insufficient for valuation.
The manager should obtain qualified advice and maintain decision records. A restriction can impair one market while improving scarcity value or domestic demand elsewhere. Both effects require evidence.
41. Model simultaneous financing need
The fund should combine project draws, equipment deposits, company runway, debt service and customer receipts into one calendar. Separate asset models can hide a peak capital requirement across the portfolio.
The model should include committed and discretionary reserves, management fees, recycling, distributions, borrowing limits and collateral. It should show which capital preserves a verified milestone and which merely postpones a decision.
42. Build the capacity waterfall
The capacity waterfall should begin with requested or marketed megawatts and deduct uncompleted interconnection, grid limits, construction, cooling, chip delivery, integration, availability and customer ramp. The result is billable service capacity.
The same method should reconcile accelerator orders to accepted compute. Each deduction needs an owner and evidence date. The waterfall prevents one capacity number from carrying several incompatible meanings.
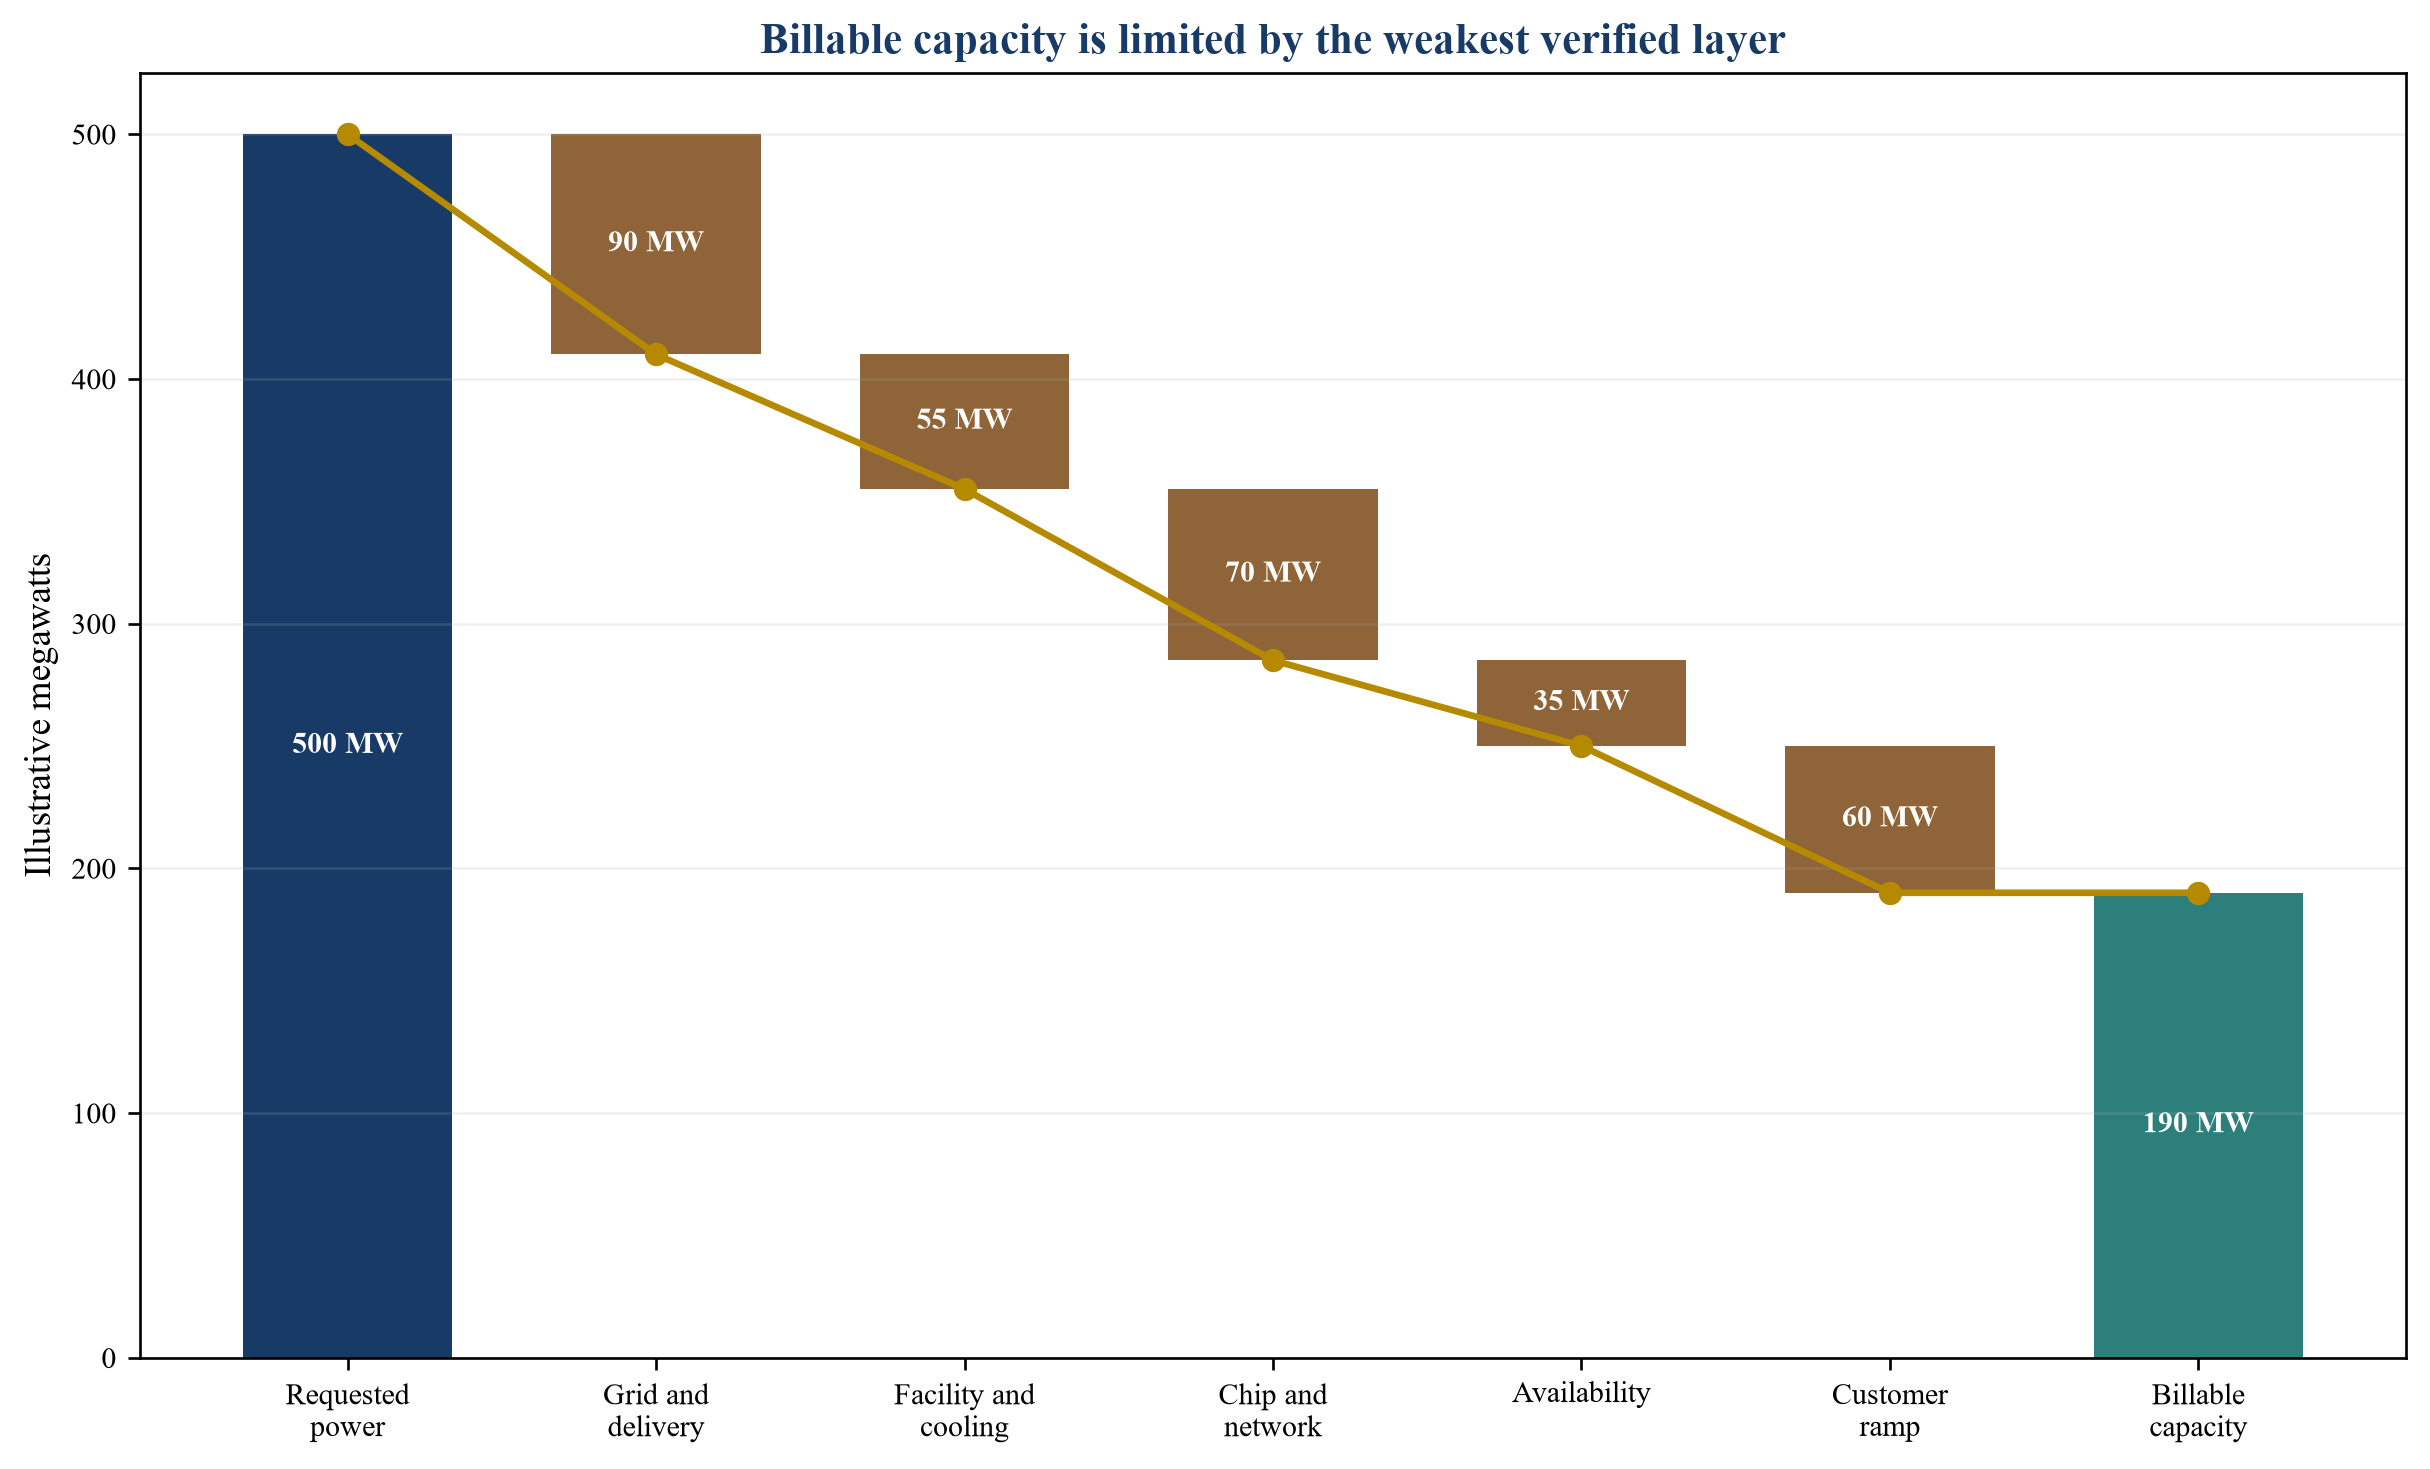
Values are hypothetical management assumptions used only to demonstrate the reconciliation.
43. Design milestone reserves
Reserves should follow evidence across all layers. A campus can earn follow-on capital by closing interconnection conditions, installing transformers, completing commissioning, securing chips and passing customer acceptance. A chip platform can earn capital through delivered product, integrated performance and contracted use.
The reserve memo should state milestone, evidence, amount, ownership, next financing and portfolio effect. A delay can justify changed terms or smaller capital. Calendar progression should not release reserves automatically.
44. Allocate portfolio contingency
Company reserves address planned capital. Portfolio contingency addresses shared shocks whose allocation cannot be predicted. The fund should size contingency against correlated grid, equipment, customer and financing scenarios.
Release should require a fund-level memo showing affected holdings, alternatives and remaining liquidity. The fund should preserve enough capital to avoid supporting one asset at the expense of higher-evidence holdings.
45. Sequence procurement
Power equipment, cooling, chips and networking can require deposits before delivery. Early procurement can protect schedule and create inventory, obsolescence and cancellation risk. The fund should coordinate procurement with the evidence needed for site and customer readiness.
The portfolio calendar should show deposits, title, storage, insurance, delivery, installation and acceptance. Equipment acquired by one company should not be assumed transferable to another without contractual and technical verification.
46. Preserve customer optionality
Long-term customer contracts can support financing and concentration. Flexibility to remarket capacity can protect downside. The fund should balance dedicated design with standard interfaces, modular capacity and lawful assignment.
The investment case should identify which fit-out and equipment are reusable. It should test customer change under realistic power density, network, security and timing. Optionality has value only when the alternative customer can accept and pay.
47. Govern valuation
IPEV's 2025 Guidelines set out best-practice recommendations for reporting private-capital investments at fair value [13]. Valuation should use market-participant assumptions, observable transactions where available, calibrated inputs and documented judgement.
The fund should reflect changes in power rights, equipment delivery, customer contracts, utilisation, financing and policy when they affect expected cash flow or risk. One shared event can change several valuations and should be treated consistently.
48. Avoid double counting capacity
A power right, facility megawatt and compute contract can represent the same underlying capacity at different stages. Adding each as separate portfolio value can double count one economic stream. Internal transactions can also inflate reported revenue without adding external cash.
The manager should reconcile capacity and cash across entities. It should identify related-party contracts and eliminate duplicate contribution in portfolio scenarios. Strategic value should remain separate from base fair value until supported.
49. Analyse contract bankability
Financeable contracts should define service, capacity, acceptance, minimum payment, price, escalation, credits, termination, assignment and security. Power, lease and compute documents should describe compatible dates and responsibilities.
The lender will test whether customer cash survives delay, underperformance and change. Labels such as take-or-pay should be examined through the actual provisions. A contract beginning after an uncertain condition does not fund construction by itself.
50. Analyse collateral and residual value
Collateral can include land rights, buildings, power equipment, servers, chips, contracts and accounts. Value depends on control, transferability, obsolescence, location, customer fit and enforcement. A rack of accelerators can be valuable and costly to remove or remarket.
The fund should obtain asset schedules, title, liens, warranties, serial numbers and secondary evidence. It should model value under an orderly sale and a stressed timetable. Residual value should not replace operating cash in the base financing case.
51. Analyse strategic exit correlation
Utilities, infrastructure funds, data-centre operators, cloud platforms and chip companies can be potential buyers. Several holdings can depend on the same buyer group and financing market. A large transaction can change competitive and regulatory conditions for later exits.
The manager should map credible buyers, control restrictions, integration fit and capacity needs. It should avoid treating private deal values as verified when they are undisclosed. Exit readiness requires transferable rights and a complete operating record.
52. Construct fund return scenarios
Return scenarios should combine ownership, dilution, reserves, capacity, utilisation, customer cash, financing and exit timing. The model should show how many independent outcomes support target returns and how a common bottleneck changes several holdings.
Gross and net results should use consistent assumptions. Scenario outputs remain management estimates. The committee should focus on decisions that change allocation, reserves or risk transfer.
Table 4. Hypothetical AI infrastructure fund return scenarios
| Scenario | Illustrative invested capital | Illustrative gross distributions | Illustrative gross multiple | Principal system outcome |
|---|---|---|---|---|
| Downside bottleneck | USD 240m | USD 144m | 0.6x | Grid, chip and customer delays affect facilities and financing together |
| Preservation | USD 240m | USD 408m | 1.7x | Power and equipment assets preserve value while compute ramps slowly |
| Base illustration | USD 240m | USD 840m | 3.5x | Several campuses energise and independent customers ramp accepted compute |
| Upside | USD 240m | USD 1.80bn | 7.5x | Capacity expands, utilisation rises and infrastructure exits diversify |
| Concentrated upside | USD 240m | USD 2.40bn | 10.0x | One hyperscale platform contributes most value and customer exposure |
All amounts, multiples and timing assumptions are illustrative management estimates; they are not market observations, forecasts or recommendations.
53. Test fund-life fit
Grid, construction, chip and customer clocks can extend beyond the planned investment period. The fund should compare every holding's remaining path with reserve horizon, extension rights and expected liquidity.
The committee should identify options before time pressure rises. Syndication, secondary sale, structured capital, continuation, strategic partnership and stop decisions should be assessed on evidence and limited-partner alignment.
54. Govern follow-on decisions
Every follow-on should reassess the complete risk system. A strong site cannot justify capital when chips and customers remain unsupported. A chip allocation cannot justify a facility when power is contingent.
The memo should show valuation, ownership, dilution, milestone runway, alternatives and portfolio liquidity. Pro rata rights are options. Sunk cost and fear of signalling should not replace expected value.
55. Govern cross-portfolio action
The fund may coordinate power procurement, equipment, customers and technical expertise across holdings. It must respect company governance, confidentiality, competition, export controls and lender rights.
Cross-portfolio contracts should have clear authority and arm's-length economics. One company should not subsidise another without approved consideration. Synergy should be measured through external cash and verified cost.
56. Report to limited partners
Limited partners need consistent information on power, capacity, chips, utilisation, contracts, reserves, valuation and material events. ILPA's Portfolio Company Template supports periodic disclosure of company metrics beyond standard reporting and is being updated as data expectations evolve [14].
Reporting should distinguish verified evidence, manager judgement and hypothetical scenarios. It should explain changes in shared dependencies and reserves. Aggregation can protect commercially sensitive details while retaining decision usefulness.
57. Rebalance the portfolio
The fund can rebalance through new investments, follow-ons, syndication, asset sales, equipment transfers, write-offs and reserve changes. Private infrastructure limits rapid adjustment, so action should begin when evidence changes.
Adding a power asset can reduce or increase dependence depending on deliverability. Adding another data centre can raise concentration in one customer or grid node. The portfolio effect belongs in each decision.
58. Apply five portfolio gates
The first gate tests power and site delivery. The second tests chip and system availability. The third tests accepted compute and customer cash. The fourth tests reserves and financing. The fifth tests fund life and liquidity.
An open gate should trigger evidence, changed terms, smaller sizing, mitigation or a stop. The committee should record owner and deadline. A press release or supplier roadmap does not close a gate.
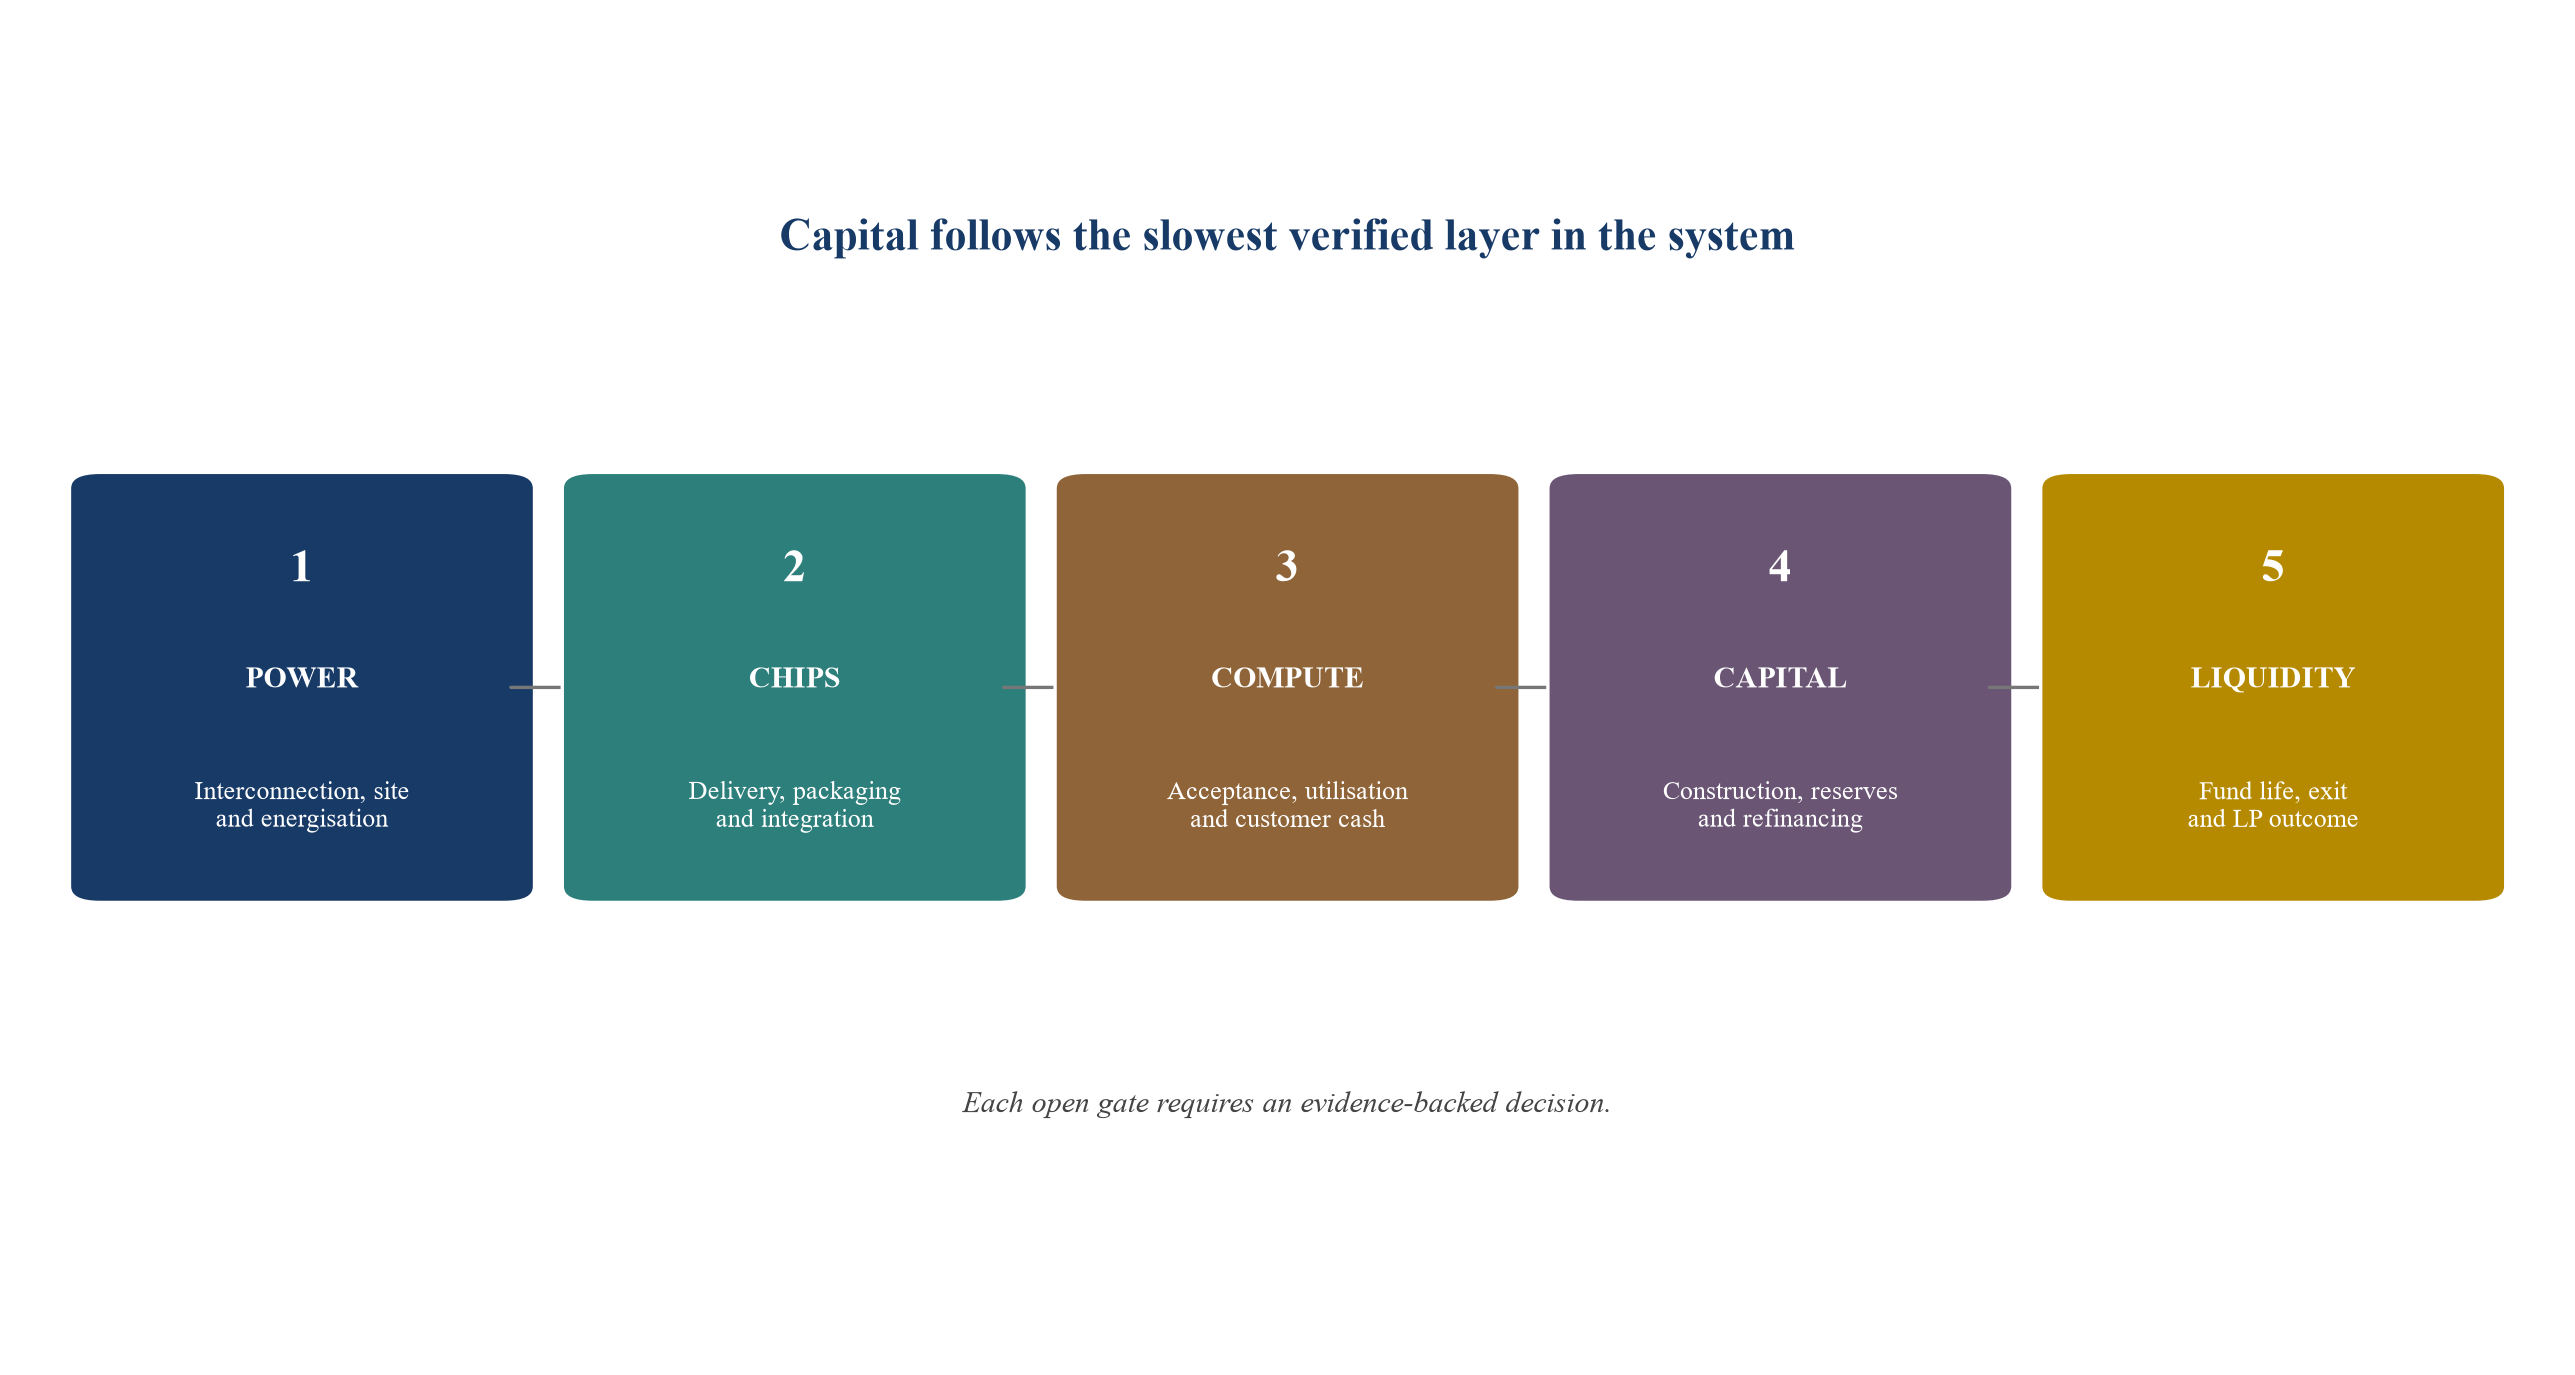
Each gate requires current evidence and a recorded capital decision.
59. Maintain the decision record
The manager should record every capacity claim, dependency, contract, assumption, reserve, valuation, exception and review trigger. The record should identify source, owner and date. It should show why capital moved across holdings.
This discipline prevents repeated forecasts from becoming facts. It also supports audit, limited-partner reporting and later performance review. Material unknowns should remain visible until resolved or explicitly accepted.
The record should reconcile technical and financial units. Megawatts should connect to racks, accelerators, usable compute, service availability, invoiced revenue and collected cash. Changes in one unit should flow through the same controlled model. This allows the committee to distinguish a physical delay from a commercial underperformance and to assign the correct response.
The manager should preserve rejected assumptions and prior versions. A replaced energisation date, chip allocation or customer ramp can reveal systematic optimism and improve later underwriting. Decision quality depends on the evidence available at the time, the alternatives considered and whether the stated trigger produced the promised action.
60. Conclusion
Power, chips and compute are separate assets within one operating and financing system. Grid connection, equipment, packaging, cooling, software, customers and capital determine whether announced capacity becomes collected cash. Diversification by industry label can preserve the same bottleneck.
The Power-Chips-Compute Portfolio Framework combines a dependency graph, capacity waterfall, evidence grades, shock scenarios, milestone reserves and liquidity tests. It enables investment committees to allocate capital against delivered service and manage correlated AI infrastructure exposure before a shared constraint becomes a fund-level crisis.
Implementation should begin with one reconciled portfolio population and a ninety-day evidence sprint. The manager can map the ten largest capacity and cash dependencies, validate the five highest-consequence recovery routes, rebuild the reserve calendar and update valuation. Subsequent reviews should focus on changed evidence, approaching decisions and unresolved exceptions rather than repeating the complete diligence exercise.
References
- International Energy Agency. Energy and AI: Energy Demand from AI. April 2025. https://www.iea.org/reports/energy-and-ai/energy-demand-from-ai
- International Energy Agency. Energy and AI. April 2025. https://www.iea.org/reports/energy-and-ai
- International Energy Agency. Energy and AI: Executive Summary. April 2025. https://www.iea.org/reports/energy-and-ai/executive-summary
- North American Electric Reliability Corporation. 2025 Long-Term Reliability Assessment. 2025. https://www.nerc.com/globalassets/our-work/assessments/nerc_ltra_2025.pdf
- United States Department of Energy. National Transmission Needs Study. 2026. https://www.energy.gov/oe/national-transmission-needs-study
- International Energy Agency. Key Questions on Energy and AI: Executive Summary. 2026. https://www.iea.org/reports/key-questions-on-energy-and-ai/executive-summary
- United States Bureau of Industry and Security. Commerce Strengthens Export Controls to Restrict China's Capability to Produce Advanced Semiconductors. December 2024. https://www.bis.gov/press-release/commerce-strengthens-export-controls-restrict-chinas-capability-produce-advanced-semiconductors-military
- National Institute of Standards and Technology. CHIPS Metrology Program. https://www.nist.gov/chips/research-development-programs/metrology-program
- United States Government Accountability Office. Semiconductors: Information on Projects Funded to Strengthen U.S. Supply Chain. GAO-26-107882. December 2025. https://www.gao.gov/products/gao-26-107882
- United States Bureau of Industry and Security. Commerce Strengthens Restrictions on Advanced Computing Semiconductors and Foundry Due Diligence. January 2025. https://www.bis.gov/press-release/commerce-strengthens-restrictions-advanced-computing-semiconductors-enhance-foundry-due-diligence-prevent
- National Institute of Standards and Technology. CHIPS for America. https://www.nist.gov/chips
- North American Electric Reliability Corporation. Large Loads Action Plan. https://prod.nerc.com/initiatives/large-loads-action-plan
- International Private Equity and Venture Capital Valuation Board. IPEV Valuation Guidelines 2025. December 2025. https://www.privateequityvaluation.com/Valuation-Guidelines
- Institutional Limited Partners Association. Draft Updated Portfolio Company Template. July 2026. https://ilpa.org/resources-tools/resource-library/ilpa-portfolio-company-template-v-2-0/
- Lawrence Berkeley National Laboratory. 2024 United States Data Center Energy Usage Report. December 2024. https://doi.org/10.71468/P1WC7Q
- United States Department of Energy. Recommendations on Powering Artificial Intelligence and Data Center Infrastructure. 2024. https://www.energy.gov/articles/doe-releases-new-report-evaluating-increase-electricity-demand-data-centers
- Federal Energy Regulatory Commission. Exploding Data Center Demand. 2024. https://www.ferc.gov/news-events/news/exploding-data-center-demand
- North American Electric Reliability Corporation. Reliability Guideline: Large Loads and Bulk Power System Reliability. https://www.nerc.com/
- National Institute of Standards and Technology. CHIPS for America Publications. https://www.nist.gov/chips/publications
- National Institute of Standards and Technology. Strategic Opportunities for U.S. Semiconductor Manufacturing. 2022. https://doi.org/10.6028/NIST.CHIPS.1000
- National Institute of Standards and Technology. Metrology Gaps in the Semiconductor Ecosystem. 2023. https://www.nist.gov/news-events/news/2023/06/new-chips-report-describes-metrology-grand-challenges-semiconductor-sector
- United States Department of Commerce. CHIPS Implementation Strategies. https://www.nist.gov/chips/chips-implementation-strategies
- United States Department of Commerce. Investing in American Competitiveness. January 2025. https://www.commerce.gov/sites/default/files/2025-01/Investing-in-American-Competitiveness.pdf
- United States Congress. CHIPS and Science Act of 2022. https://www.congress.gov/bill/117th-congress/house-bill/4346
- European Commission. European Chips Act. https://digital-strategy.ec.europa.eu/en/policies/european-chips-act
- European Commission. Data Centres in Europe. https://energy.ec.europa.eu/topics/energy-efficiency/energy-efficient-products/data-centres_en
- United Kingdom Department for Science, Innovation and Technology. National Data Library and Data Centre Policy. https://www.gov.uk/government/organisations/department-for-science-innovation-and-technology
- International Energy Agency. Electricity Mid-Year Update 2025. https://www.iea.org/reports/electricity-mid-year-update-2025
- International Energy Agency. Global Energy Review 2026. https://www.iea.org/reports/global-energy-review-2026
- International Energy Agency. Energy and AI Data Product. June 2025. https://www.iea.org/data-and-statistics/data-product/energy-and-ai
- United States Environmental Protection Agency. ENERGY STAR Data Centers. https://www.energystar.gov/buildings/resources-audience/data-centers
- Uptime Institute. Data Center Site Infrastructure Tier Standard. https://uptimeinstitute.com/tiers
- ASHRAE. Thermal Guidelines for Data Processing Environments. https://www.ashrae.org/technical-resources/bookstore/datacom-series
- Open Compute Project. Data Center Facility Project. https://www.opencompute.org/projects/data-center-facility
- International Organization for Standardization. ISO/IEC 30134 Data Centre Key Performance Indicators. https://www.iso.org/committee/654019.html
- United States Securities and Exchange Commission. Private Fund Advisers. https://www.sec.gov/investment/private-fund-advisers
- Institutional Limited Partners Association. Principles 3.0. https://ilpa.org/industry-guidance/principles-best-practices/
- International Organization of Securities Commissions. Principles for the Valuation of Collective Investment Schemes. https://www.iosco.org/library/pubdocs/pdf/IOSCOPD413.pdf
- Financial Accounting Standards Board. Fair Value Measurement, Topic 820. https://asc.fasb.org/topic&trid=2127586
- United States Government Accountability Office. Electricity Grid Resilience and Data-Centre Load Growth. https://www.gao.gov/
About the Author
Chennakeshav (CK) is a corporate finance and investment banking executive with 25+ years of global experience in deal origination, structuring and execution across M&A, growth capital and corporate strategy. He has led value-creation mandates for founders, corporates and funds — bridging the boardroom view to hands-on execution and close.
His career spans Morgan Stanley, HSBC, Lloyds Banking Group, EWEC, ADQ portfolio companies and Emirates Growth Fund, across TMT, real estate, fintech, deeptech, cleantech, infrastructure and energy. He has partnered with C-suite leaders, private equity and venture funds, sovereign wealth funds and family offices to finance complex fund raises and scale-up ventures, and has led M&A due diligence, post-merger integration and business-transformation initiatives to create value.
At Matchpoint Partners he is Managing Partner, leading the firm's corporate finance, M&A and capital-raising practice. He holds an MBA from London Business School, an engineering degree from VTU and a Master of Laws (LLM, in progress) from UCL London.
An active start-up mentor, CK mentors at Techstars, DIFC FinTech Hive, Startup Grind, Founder Institute and IN5, serves as Entrepreneur Mentor in Residence (EMiR) at London Business School, and judges the Entrepreneurship World Cup.
