

1. Define the portfolio decision
The investment committee must decide whether the portfolio contains enough independent routes to technical, commercial and liquidity success. Company count, sector labels and geography provide an incomplete view. The decision requires a look-through map of the resources, rights, customers and capital markets on which every holding depends.
The committee should identify the shocks that can impair several holdings at once, quantify the capital consequences and decide which concentrations are intentional. A concentrated exposure can be rational when it is understood, priced and supported by reserves. An exposure discovered during a crisis represents a governance failure.
2. Define the investment universe
The space economy covers spacecraft manufacturing, launch manufacturing and services, ground systems, space operations, applications and ancillary services. The UK National Space Strategy technical annex uses these six segments to connect upstream infrastructure with downstream services [1]. The OECD value-chain approach also follows activities from research and manufacturing through operations and applications [2].
The fund should classify a company by its principal economic driver rather than its marketing description. A software company can depend on one satellite constellation. A component supplier can depend on one launch cadence. An Earth-observation platform can depend on public procurement, third-party imagery and cloud processing. The portfolio record should retain both the stated category and the actual dependency profile.
3. Distinguish visible and hidden concentration
Visible concentration includes one holding, geography, stage or subsector exceeding an approved limit. Hidden concentration arises when distinct holdings share a dependency that is absent from standard exposure reports. It can sit in a supplier, licence, launch route, spectrum band, customer budget, data source or financing syndicate.
The OECD's 2026 space-economy report identifies market concentration, specialised supply chains, critical materials, orbital sustainability and signal resilience as distinct vulnerabilities [3]. A portfolio method should keep these categories separate before examining their interaction. Combining every risk into one score can conceal the mechanism that requires action.
4. Use the economic dependency as the unit of risk
The unit of analysis should be the dependency whose disruption changes enterprise value or funding need. Legal entities remain necessary for ownership and valuation, while dependencies explain correlated outcomes. One launch delay can defer revenue for satellite manufacturers, operators, analytics companies and ground-service providers in different portfolio buckets.
Each dependency record should state the affected holding, contractual status, substitute, replacement time, cash consequence and evidence date. A dependency should remain open when management has named an alternative without demonstrating technical qualification, capacity, commercial terms and regulatory acceptability.
5. Define the correlation clock
Space dependencies operate on different clocks. A launch failure can create an immediate mission loss. Spectrum coordination can take years. A component shortage can delay a production batch. A government procurement cycle can shift revenue and financing. Orbital congestion can accumulate across the useful life of a constellation.
The fund should record shock onset, time to detection, time to substitute and time to recover. This reveals whether liquidity can bridge the disruption. A portfolio may survive a six-month launch delay and fail under a three-year regulatory or component redesign path.
Table 1. SpaceTech dependency taxonomy and evidence
| Dependency class | Typical shared exposure | Direct diligence evidence | Portfolio consequence | Possible response |
|---|---|---|---|---|
| Launch and range | Provider, vehicle, spaceport, payload-processing facility, schedule | Executed launch contract, manifest position, integration status, insurance and alternative route | Delayed deployment, revenue and financing; mission-loss concentration | Multi-launcher design, schedule margin, alternative integration and liquidity reserve |
| Spectrum and orbital rights | Frequency band, national filing, ITU coordination, gateway location | Filing status, coordination correspondence, licence conditions and deployment milestones | Delayed service, redesign, geographic constraint or impairment | Earlier filing, band flexibility, staged deployment and regulatory expertise |
| Components and manufacturing | Radiation-qualified electronics, sensors, propulsion, optics, foundry, test facility | Bill of materials, qualified-source list, inventory, yield and redesign evidence | Production interruption, cost escalation and schedule slip | Dual qualification, inventory, redesign funding and supplier investment |
| Customers and policy | Defence, civil-space agency, telecom operator, anchor enterprise | Contract, budget authority, acceptance, renewal and payment record | Correlated revenue loss and slower financing | Customer limits, dual-use markets, contract diversity and runway buffer |
| Ground, cloud and data | Ground-station network, cloud, geospatial data source, GNSS signal | Service agreement, capacity, portability, architecture and incident record | Service outage, margin pressure, security exposure and switching cost | Redundancy, interoperability, tested migration and contractual protection |
| Capital and talent | Specialist investors, strategic partners, systems engineers and licensed personnel | Syndicate capacity, runway, hiring, retention, security clearance and succession | Simultaneous round pressure, execution delay and dilution | Staggered rounds, reserve pool, co-investor development and talent continuity |
The categories are a portfolio framework; actual dependencies and recovery periods require company-specific verification.
6. Establish the portfolio population
The population should include every legal investment, side vehicle, convertible, warrant, reserve commitment and material indirect exposure. Proposed investments should remain separate from signed positions. The record should reconcile to cap tables, subscription documents, bank movements, valuation schedules and fund reporting.
The manager should also identify dependencies held outside a company's control. A portfolio company may buy launch, imagery or ground service through an integrator. The underlying provider still belongs in the look-through map. Unknown counterparties should be labelled as data gaps and assigned an owner and deadline.
7. Map launch-provider concentration
Launch access is a cross-portfolio dependency because many business plans begin earning material revenue only after deployment. The FAA states that August 2025 marked its thousandth licensed or permitted commercial space operation, reflecting a growing operating base [4]. GAO also reports increasing commercial use of federal ranges and pressure on range infrastructure [5].
The fund should map provider, vehicle, orbit, range, payload-processing site, manifest position and integration standard. A contract with a launcher does not establish a fixed launch date. Diligence should verify deposits, termination rights, delay remedies, compatibility, alternative launchers and the time needed to move.
8. Map range and spaceport concentration
Launch-provider diversity can still rely on the same government range, spaceport, airspace, maritime exclusion area or payload-processing facility. Weather, infrastructure, safety review and competing missions can therefore correlate nominally independent launches. GAO's 2025 range review records increased strain and the need for improved cost recovery [5].
The portfolio map should distinguish vehicle concentration from range concentration. It should also record whether alternative sites require new environmental review, licences, transport, integration equipment or customer approval. Recovery time belongs in reserve and revenue scenarios.
9. Map mission-architecture concentration
Several holdings can depend on the same orbital regime, satellite lifetime, revisit cadence, link budget or constellation scale. A common architecture can amplify collision, debris, regulatory and unit-economic assumptions. Architecture correlation matters even when hardware suppliers differ.
The fund should record orbit, altitude, inclination, constellation size, replacement rate, latency requirement, ground coverage and disposal plan. It should examine how a policy change or degradation in one architectural assumption affects capital needs and addressable service.
10. Map spectrum concentration
Satellite systems depend on access to radio-frequency spectrum and associated orbital resources. The ITU manages international coordination, notification and recording through the Master International Frequency Register, while national administrations remain central to filings and licensing [6]. Non-geostationary systems can also face deployment milestones intended to reduce spectrum warehousing [6].
The manager should map frequency bands, administrations, filing status, coordination parties, gateway constraints and deployment deadlines. Spectrum should be treated as a governed right rather than a marketing claim. A missed milestone or unresolved coordination issue can change service territory, system design and valuation.
11. Map ground-segment concentration
Ground stations, teleports, mission control, gateways, antennas and network operations connect orbital assets to customers. Multiple portfolio companies can use one commercial network, one gateway jurisdiction or one specialist software stack. A local outage or contract dispute can therefore create a portfolio event.
Diligence should identify owned and contracted infrastructure, service levels, security controls, capacity, pricing, termination, data location and portability. Management should demonstrate failover under representative operating conditions. A slide describing redundancy is weaker than a completed test and incident record.
12. Map cloud and processing concentration
Downstream space applications can share cloud hosting, machine-learning infrastructure, geospatial data pipelines and common software libraries. The customer may experience a space-enabled product, while economic and resilience exposure sits in conventional digital infrastructure.
The fund should map the full data path from collection through downlink, processing, model inference, storage, distribution and customer decision. It should separate proprietary data from third-party inputs and identify egress cost, migration time, cyber controls and contractual rights. A cloud concentration limit can be as relevant as a launch limit.
13. Map component concentration
Space manufacturing uses specialised parts, materials and processes in relatively low production volumes. The OECD identifies dependence on specialised components, qualified suppliers and critical inputs as an industrial vulnerability [3]. NASA's Electronic Parts and Packaging Program produces guidance on performance, failure modes, testing, reliability and supply-chain quality for space-flight hardware [7].
The portfolio map should include radiation-qualified electronics, optics, sensors, propulsion, batteries, solar arrays, antennas, timing devices and critical software. The manager should record source, lead time, qualification status, inventory, yield, export constraints and redesign duration.
14. Map semiconductor and foundry concentration
Radiation environments can require specialised device design, fabrication, screening and assurance. NASA and JPL materials describe radiation effects and the need to evaluate components for specific missions [8,9]. Several holdings can therefore rely on the same foundry, packaging house, radiation-test facility or qualified device family.
Diligence should test whether commercial components have mission-specific evidence and whether substitutions require board redesign, software changes or renewed qualification. A low-cost part can carry high schedule criticality. Portfolio exposure should be measured by consequence and replacement time as well as spend.
15. Map propulsion and power concentration
Launch vehicles, spacecraft and in-orbit systems can share propulsion chemistry, pressure vessels, valves, propellant suppliers, batteries and solar-cell technology. Common qualification facilities and safety regimes create further dependence. A supplier event can affect several stages of the value chain.
The fund should identify technical alternatives, interface changes, testing requirements and customer acceptance. It should distinguish a component available in a catalogue from a flight-qualified substitute with confirmed capacity. Redesign funding and schedule should enter downside reserves.
16. Map testing and qualification concentration
Thermal-vacuum chambers, vibration facilities, clean rooms, radiation testing and specialised integration sites can become bottlenecks. Availability matters because a delayed slot can push a launch manifest and cascade into revenue, financing and customer acceptance.
The manager should map booked slots, cancellation rights, alternative facilities and the sequence of tests. It should check whether the same facility serves several holdings in overlapping windows. Shared test capacity belongs in the portfolio calendar.
17. Map customer concentration
Space companies can sell to a small set of defence agencies, civil-space bodies, telecommunications operators, insurers, energy companies or prime contractors. Different portfolio companies may ultimately depend on one appropriation, programme or procurement office. Logo counts can overstate independent demand.
The fund should look through integrators and resellers to the source of budget and acceptance authority. It should distinguish funded backlog, framework agreements, trials, memoranda and proposals. Collections, renewals and exercised options provide stronger evidence than announced contract ceilings.
18. Map government-budget concentration
Public organisations remain important buyers and funders of upstream space activity. OECD reporting notes that government sources can account for a large share of upstream markets in parts of Europe and Asia [10]. Government demand can validate technology and provide revenue, while linking several holdings to one fiscal cycle.
The portfolio record should map agency, programme, appropriation, contract vehicle, milestone, payment and political dependency. Announced policy, budget request, authorised programme and obligated contract are different evidence states. The manager should model delays and scope changes without assuming cancellation.
19. Map prime-contractor concentration
Smaller space companies can reach government or large commercial customers through a small group of primes. Prime access can accelerate qualification and distribution. It can also create margin pressure, information asymmetry, termination exposure and acquisition dependency.
The fund should identify flow-down terms, exclusivity, foreground and background intellectual property, data rights, acceptance, payment and change control. It should assess whether the company can sell through another route and how long qualification would take. One prime across several holdings should be visible at fund level.
20. Map policy and national-security concentration
Space technologies can be dual-use and strategically sensitive. Export controls, foreign-investment review, security classification, ownership restrictions and domestic-capability requirements can affect hiring, supply, funding and exit. The UK's strategy describes a globally connected supply chain alongside measures for resilient and secure domestic capability [11].
The manager should maintain a jurisdiction-specific matrix supported by qualified advice. It should record controlled items, licences, security obligations, restricted investors, data locations and potential buyer limitations. A policy event can improve demand while narrowing the capital and exit universe.
21. Map orbital-sustainability concentration
Orbital congestion, debris and collision risk can affect launch approval, insurance, mission life and customer confidence. The OECD treats safety and sustainability risks as a distinct vulnerability and notes their interaction with rapidly expanding space activity [3]. The economic consequence depends on orbit, manoeuvrability, tracking, conjunction procedures and disposal capability.
The fund should record collision-avoidance responsibility, tracking data, propulsion margin, autonomy, disposal plan and insurance treatment. Several holdings in one altitude band can share environmental risk. A sustainability service company can also gain demand from the same pressure, creating a possible hedge that requires separate economic analysis.
22. Map space-weather concentration
Solar activity can disrupt spacecraft electronics, communications, navigation, power systems and terrestrial infrastructure. Portfolio companies in different categories may therefore share one environmental driver. Mission design, shielding, operational procedures and service redundancy determine the consequence.
Diligence should identify design environment, test evidence, forecast inputs, safe modes, recovery procedures and customer obligations. The fund should avoid assuming that insurance transfers every business consequence. Lost service, replacement time and reputational effects can remain with the company.
23. Map cyber and signal concentration
Space systems can be exposed through ground networks, command links, supply chains, cloud services, identity systems and user terminals. Navigation and communication signals can also face interference, jamming or spoofing. The OECD identifies signal resilience and cyber vulnerabilities among systemic concerns [3].
The manager should map critical services, privileged access, encryption, key management, software updates, incident response and third parties. It should test whether several holdings depend on one identity provider, network operator or software component. Shared cyber exposure belongs in fund-level scenario exercises.
24. Map insurance concentration
Launch, in-orbit, liability and business-interruption cover can depend on a specialised insurance market. A loss event can change pricing, capacity, exclusions and deductibles for several portfolio companies at once. Companies without insurance can still be affected through lender, customer or licence requirements.
The fund should record cover, insurer panel, limits, exclusions, premium assumptions, claims history and renewal date. It should stress simultaneous repricing and reduced capacity. Insurance should be treated as a financing and risk-allocation dependency rather than evidence that the underlying risk has disappeared.
25. Map talent concentration
Space ventures can compete for systems engineers, mission operators, radio-frequency specialists, propulsion experts, security-cleared staff and experienced programme leaders. The UK Space Agency's 2024 industry study reports skills constraints among surveyed organisations and notes the sector's high qualification profile [12].
The manager should map key roles, location, clearance, immigration, retention, succession and overlap across holdings. One technical founder advising several companies can create governance and capacity risk. Talent exposure should include the time required to train or clear a replacement.
26. Build the dependency graph
The dependency graph should link each holding to launch routes, orbits, spectrum, components, facilities, ground systems, cloud, customers, policy, capital and talent. Every edge should carry an evidence grade and recovery period. The graph should distinguish contractual commitment from management intention.
The graph should also record positive connections. Shared customers, standards and infrastructure can reduce selling cost or improve interoperability. The fund should count these benefits once and avoid adding the same ecosystem advantage to every company valuation and again as a portfolio premium.
Table 2. Dependency-graph evidence grades
| Grade | Evidence state | Portfolio treatment | Required action | Review trigger |
|---|---|---|---|---|
| A | Executed right, qualified source or tested alternative with current performance evidence | Include documented capacity, terms and recovery time | Monitor compliance, capacity and counterparty health | Contract change, incident, missed service or renewal |
| B | Executed arrangement with open qualification, capacity or schedule condition | Apply conditional availability and downside timing | Close conditions and fund contingency | Milestone miss, supplier delay or design change |
| C | Named alternative supported by preliminary technical and commercial work | Treat as an unproven mitigation | Obtain quotation, qualification plan, capacity and approval | Financing decision or critical-path entry |
| D | Management assertion without direct support | Treat dependency as unresolved | Assign owner, evidence request and deadline | Investment or follow-on committee |
| E | Unknown source, right, customer or recovery path | Treat as a diligence exception and potential concentration | Escalate, limit capital or defer decision | Immediate |
Evidence grades guide review intensity; they do not replace legal, technical or commercial diligence.
27. Calculate look-through exposure
Look-through exposure should be shown on invested cost, fair value, planned reserves, revenue, backlog and downside capital. Each lens answers a different question. A supplier can be immaterial to current cost and critical to future reserves. A customer can dominate backlog without dominating recognised revenue.
The calculation should avoid false precision. Where dependence is partial, the manager can use scenario weights that are explicitly labelled as management assumptions. The underlying gross exposure should remain visible beside the weighted output.
28. Measure dependency centrality
Centrality describes how many holdings and value pathways connect to one dependency. A central node can be one launch provider, spectrum band, component family, government programme or ground network. High centrality does not establish loss probability. It identifies where diligence and contingency can have portfolio-wide value.
The manager should rank nodes by affected cost, fair value, reserve need, revenue and replacement time. A low-probability node with severe, slow recovery can merit more attention than a frequent event with inexpensive mitigation. The ranking should remain transparent to the investment committee.
29. Visualise the portfolio network
A network view can expose concentration that a sector pie chart misses. Holdings should appear as one node class and external dependencies as another. Edge thickness can represent illustrative exposure, while colour indicates dependency class.
The visual should remain linked to a data table and evidence record. It should not substitute for analysis. Unknown edges should be displayed rather than omitted so that incomplete diligence remains visible.
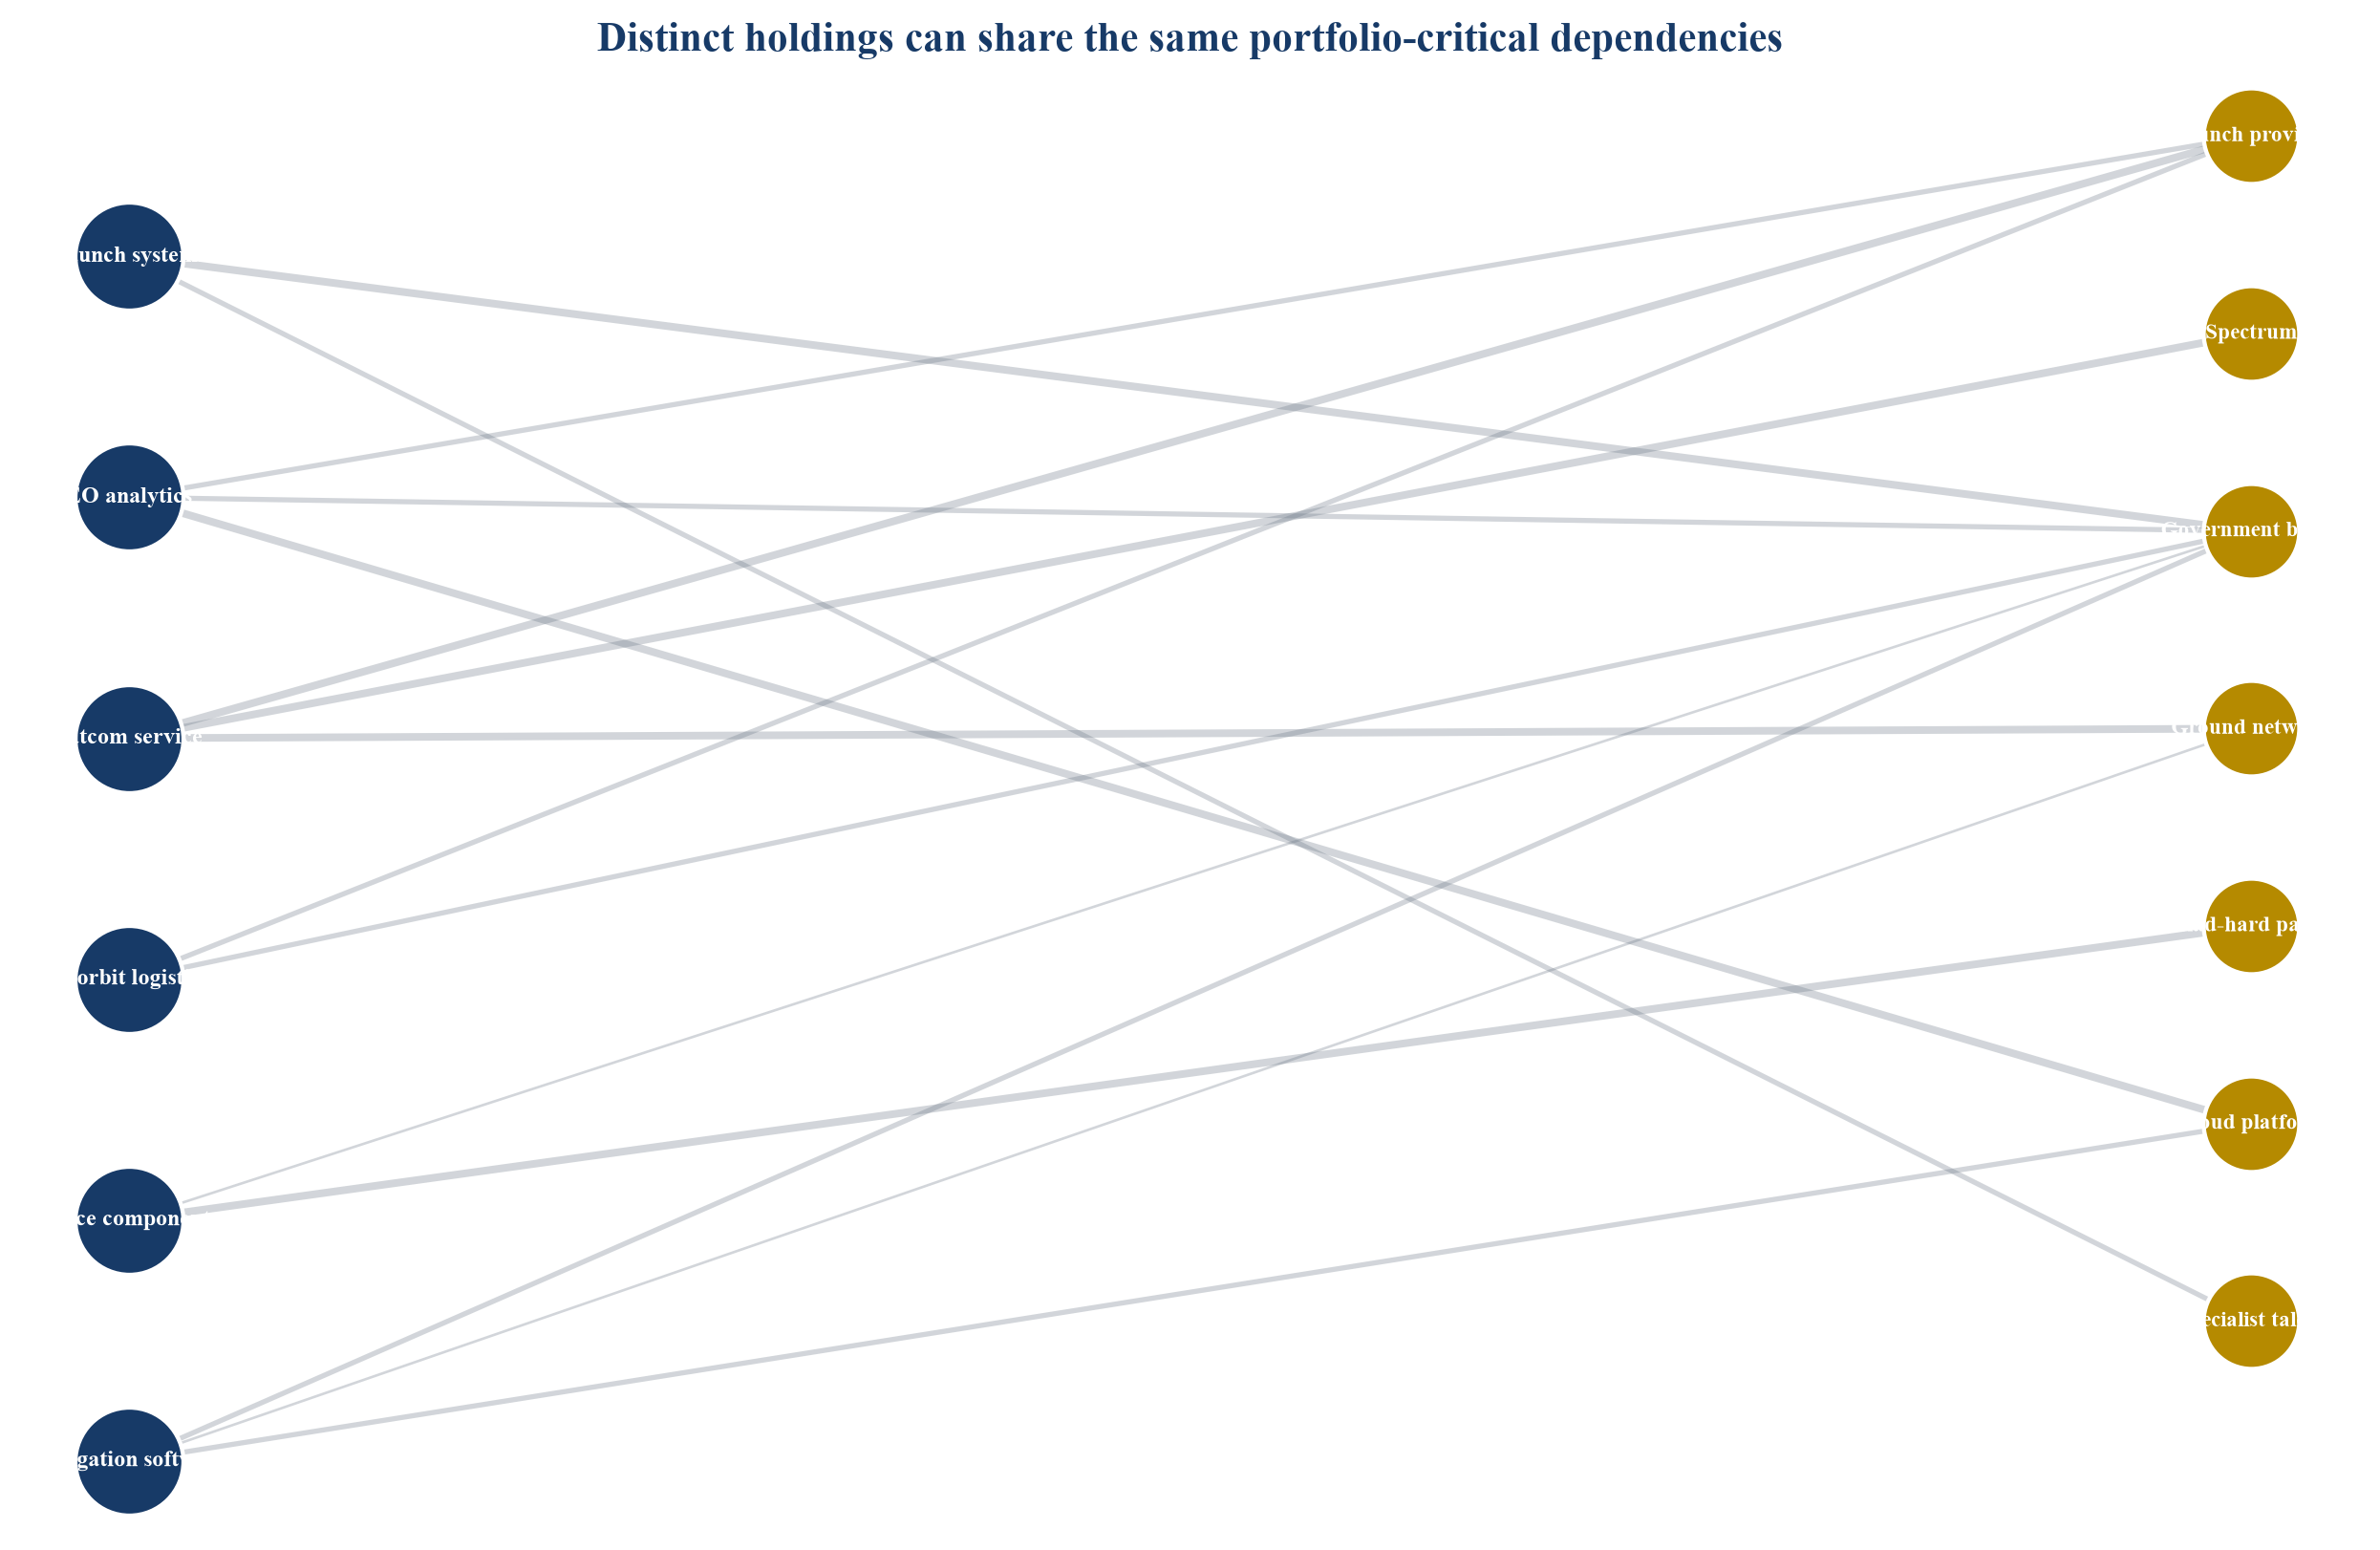
Nodes and exposures are hypothetical management assumptions prepared to demonstrate the method.
30. Set launch limits
Launch limits should consider provider, vehicle family, range, orbit and time window. A fund can set a maximum share of fair value and planned reserves dependent on one route before approved mitigation. The relevant threshold depends on fund size, company stage and replacement time.
Exceptions should specify why concentration is accepted, which evidence supports the decision and what event triggers review. A lower-cost launch should be compared with the cost of delay, redesign and correlated revenue exposure across the portfolio.
31. Set spectrum and licence limits
Spectrum limits should identify holdings dependent on one band, administration, filing path or gateway jurisdiction. Rights may be subject to coordination, deployment and use conditions. The ITU framework supports coexistence and records international status, while national regimes determine company-specific authority [6].
The committee should require a dated legal and regulatory status for material systems. It should avoid treating a filing as an operating licence or coordinated assignment. Reserve planning should include technical and commercial consequences of delay or modification.
32. Set customer and programme limits
Customer limits should aggregate direct contracts, prime-contractor flow-through, grants and procurement programmes by ultimate budget source. A diversified list of contract counterparties can still rely on one government mission or commercial network build.
The manager should test loss, delay, scope reduction and payment slowdown. It should identify which companies can redirect products to another market without material redesign or new qualification. Dual-use potential should be supported by paid evidence or a credible conversion plan.
33. Set component and facility limits
Component limits should cover qualified suppliers, foundries, test facilities and logistics routes. The threshold should consider replacement time and mission criticality. A low-spend component can justify a strict limit when failure stops production.
The fund can respond through dual qualification, inventory, advance purchase, redesign or investment in enabling capacity. Each response carries capital, obsolescence and governance risk. The company and fund should agree who finances mitigation and who owns unused inventory or tooling.
34. Set capital-market limits
Several holdings can seek rounds from the same specialist investors, strategic partners or government co-investment programmes. A market shock can therefore create simultaneous runway pressure. Portfolio diversification by technology does not protect against financing correlation.
The manager should map runway, next milestone, expected round, insider capacity, potential leads and decision dates. It should model bridges across the whole fund rather than approving each company in isolation. Syndicate development is a portfolio capability.
35. Build shock scenarios
Shock scenarios should combine a defined event, affected holdings, evidence, time path, cash consequence and management response. They should cover both isolated and compound events. A launch delay combined with a financing contraction can be more damaging than either event alone.
The committee should use a small set of decision-relevant scenarios. It should avoid assigning probabilities that lack evidence. The purpose is to expose capital and governance choices before the shock, then update assumptions when events provide new information.
Table 3. Hypothetical cross-portfolio SpaceTech shock scenarios
| Scenario | Holdings affected | Illustrative revenue timing effect | Illustrative additional capital need | Primary decision |
|---|---|---|---|---|
| Six-month launch and range delay | Four of twelve | USD 28m revenue deferred | USD 18m bridge and integration carry | Prioritise payloads, secure alternatives and stage reserves |
| Spectrum coordination delay | Three of twelve | Service launch deferred by 12 months | USD 22m for runway and redesign options | Continue, narrow geography or revise architecture |
| Radiation-qualified component shortage | Five of twelve | Production volume reduced for nine months | USD 14m inventory, qualification and working capital | Allocate scarce parts and fund second source |
| Government programme rephasing | Six of twelve | USD 35m backlog moves beyond fund year | USD 26m portfolio bridge requirement | Protect highest evidence pathways and diversify customers |
| Specialist financing contraction | Eight of twelve | No direct revenue change; rounds delayed | USD 42m insider and syndicate requirement | Rank follow-ons against milestones and fund liquidity |
| Compound launch, customer and funding event | Seven of twelve | USD 55m deferred or at risk | USD 61m before mitigation | Preserve critical assets, restructure and seek portfolio liquidity |
All amounts and percentages are illustrative management assumptions; they are not forecasts or market observations.
36. Model launch delay
The launch-delay case should begin with contracted date, current manifest evidence, integration state and alternative routes. It should then trace revenue recognition, customer milestones, burn, insurance, supplier commitments and next financing. The model should separate delay from mission loss.
Management should show which costs stop, continue or accelerate. It should identify decisions that preserve optionality, including payload storage, alternative vehicle work and customer amendments. The fund should avoid funding an open-ended wait without a verified recovery path.
37. Model mission loss
A mission-loss scenario should include insured proceeds, exclusions, claim timing, replacement manufacture, launch availability, customer remedies and regulatory obligations. Replacement cost alone understates the effect when the company loses market window, data continuity or strategic credibility.
The investment committee should test whether the company can provide service through third-party capacity or data. It should assess how a loss changes valuation and future insurance. Proceeds should not be assumed until coverage, causation and payment are supported.
38. Model spectrum delay
The spectrum-delay model should trace filings, coordination, national authority, equipment design, gateway location, deployment milestones and commercial territory. It should distinguish a procedural delay from a requirement that changes the system.
The company should present lawful alternatives, technical changes, cost, timing and customer impact. The fund should compare continuing the original path with narrower deployment, partnership or sale. Unsupported access should remain outside the base case.
39. Model supply-chain disruption
Supply-chain scenarios should begin with a controlled bill of materials and qualified-source list. They should identify inventory, orders, lead time, yield, substitution, redesign, testing and customer approval. Company-level averages can conceal one critical part.
The fund should model allocation conflicts across holdings. Purchasing scarce inventory for one company may reduce availability for another. Related-party or cross-portfolio transactions require independent economics, documented authority and conflict management.
40. Model public-demand rephasing
A government programme can continue while milestones, procurement lots or payments move. The downside model should reflect the specific contract and budget process. It should not equate every delay with cancellation.
The manager should trace funded backlog, acceptance, invoicing and cash. It should identify which costs are reimbursable, which require working capital and which assets can serve another customer. Policy support has value only when it reaches the company through enforceable economics.
41. Model simultaneous financing need
The fund should combine company runway and milestone calendars into one cash schedule. Round labels do not show financing risk. A later-stage constellation can require more capital and carry less technical proof than an earlier-stage software company.
The model should include committed reserves, discretionary reserves, management fees, recycling, expected distributions and fund borrowing constraints. It should show which companies reach a value-inflecting milestone before cash exhaustion and which require capital merely to continue.
42. Build a concentration dashboard
The dashboard should show the largest look-through dependencies by cost, fair value, reserves, revenue and recovery time. It should connect each number to current evidence. A heat map helps the committee see whether different holdings depend on the same node.
The dashboard should also display unknowns and overdue reviews. A concentration score without evidence freshness can provide false comfort. The manager should retain the underlying company and dependency records for audit and limited-partner reporting.
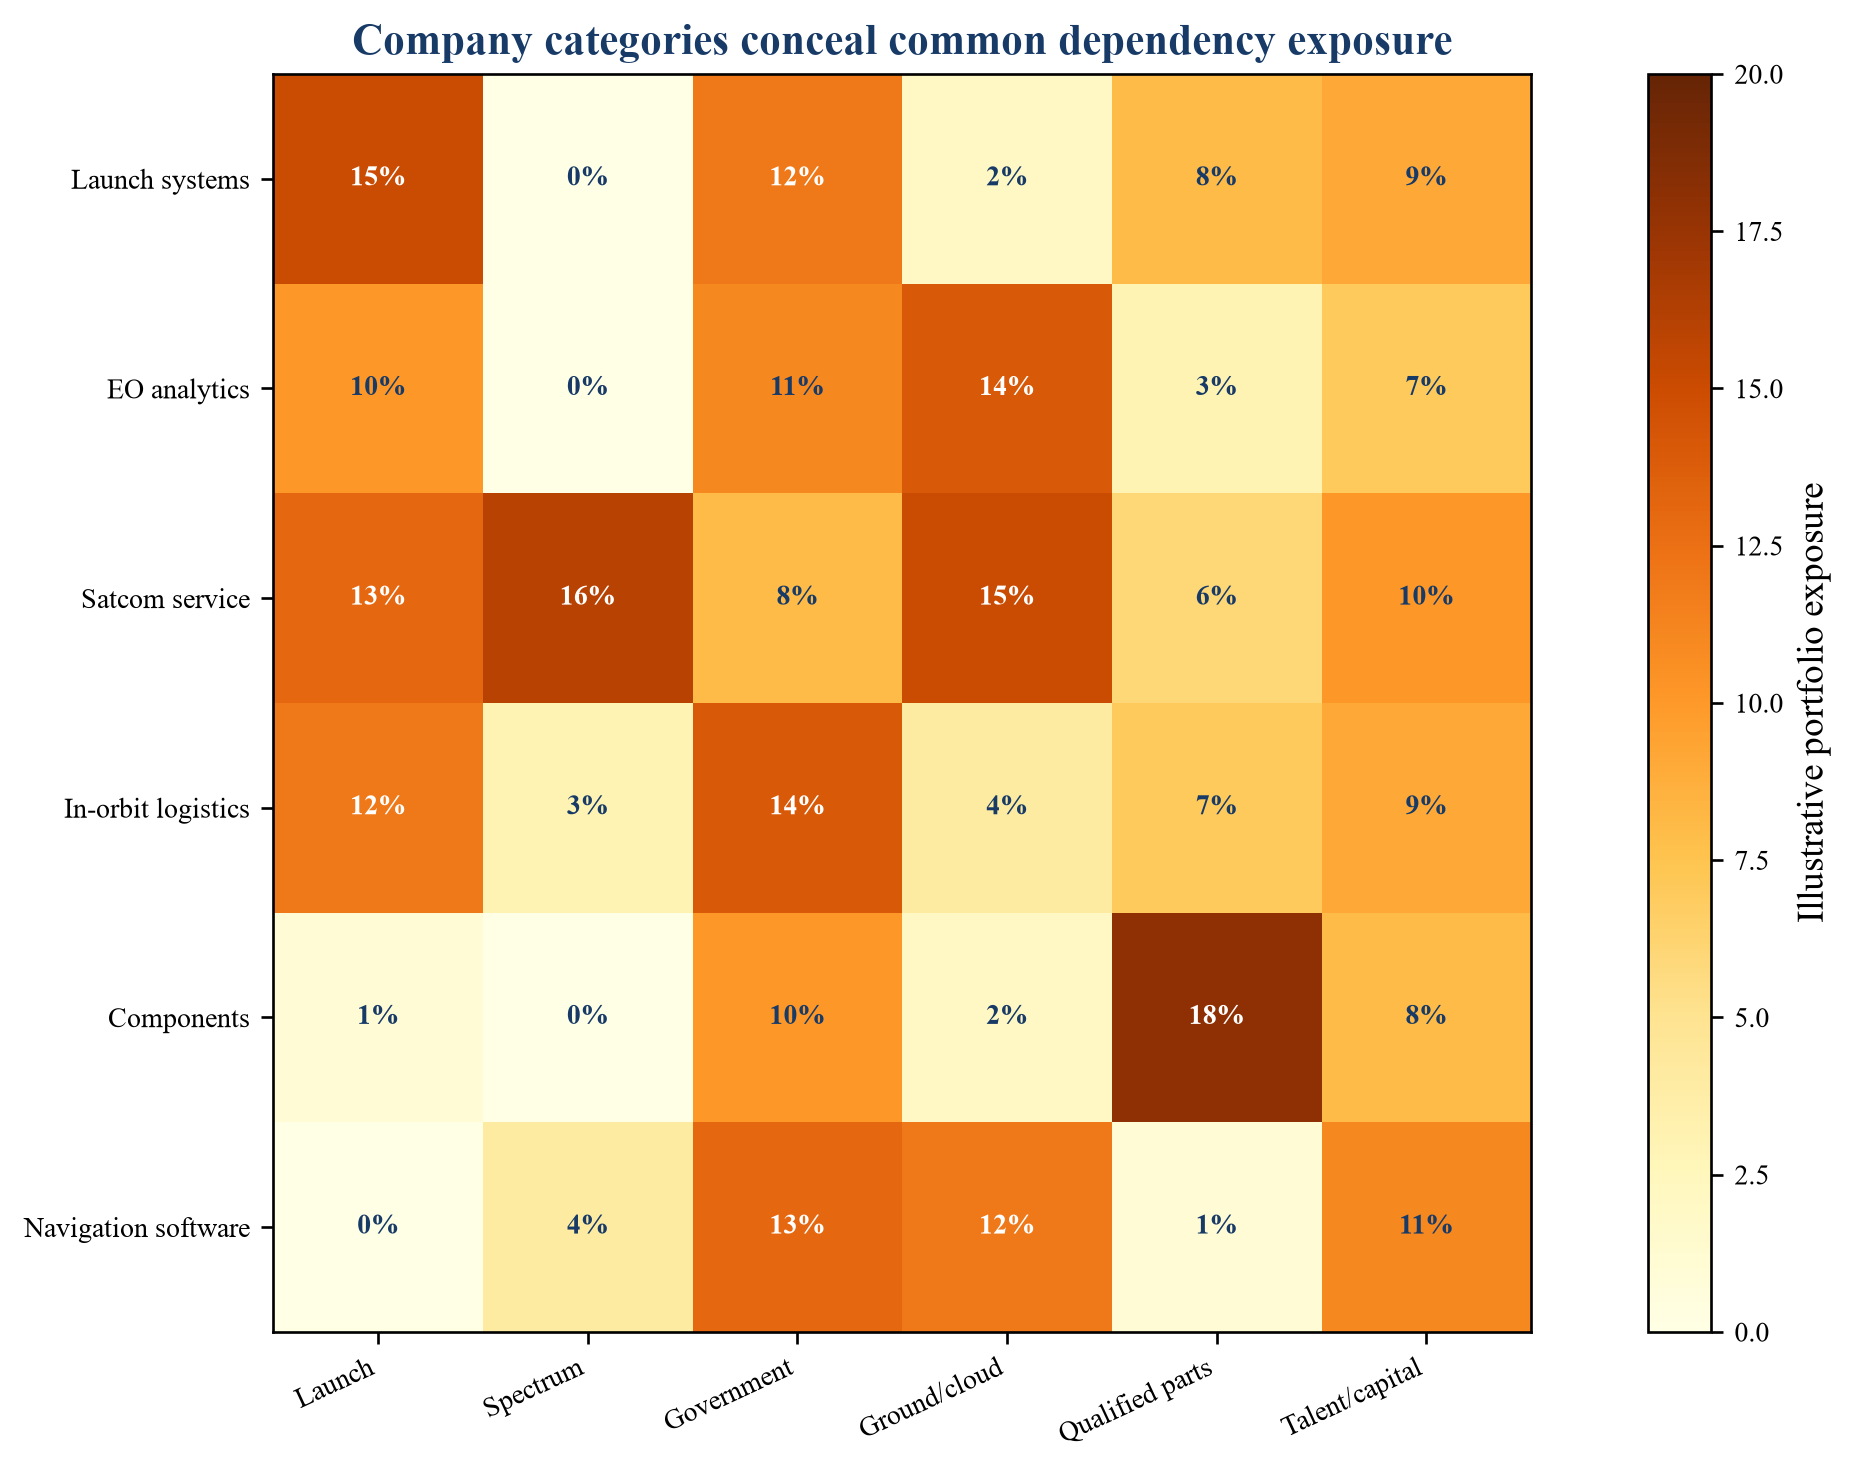
Values are hypothetical percentages of portfolio exposure prepared to demonstrate the dashboard.
43. Design milestone reserves
Reserves should be tied to technical, commercial and dependency-reduction milestones. A satellite company can earn follow-on capital through completed qualification, secured spectrum, launch integration and funded customer acceptance. Calendar passage alone does not create evidence.
The reserve memo should state milestone, evidence owner, amount, decision date, ownership effect and alternatives. A milestone can justify less capital when the company removes a dependency or secures a partner. Failure should trigger re-underwriting rather than automatic abandonment.
44. Allocate portfolio contingency
Company reserves address expected follow-ons. Portfolio contingency addresses shared shocks whose allocation cannot be predicted at commitment. The fund should size contingency against correlated needs and its legal ability to recycle or borrow.
Contingency should not become unallocated capital available without discipline. Its release requires a portfolio-level memo showing the shock, affected holdings, response alternatives and effect on remaining liquidity. The committee should record why one company receives support over another.
45. Sequence capital calls
Capital calls should reflect a realistic schedule for company rounds, milestone bridges and fund obligations. SpaceTech portfolios can have long development and deployment paths. Calling all capital early can reduce limited-partner efficiency, while calling too late can impair negotiating position.
The manager should coordinate expected notices with the reserve calendar and downside cases. It should not assume distributions arrive before committed support. A liquidity range is more decision-useful than one deterministic curve.
46. Preserve syndicate capacity
Co-investors, strategic investors, government funds and lenders can extend capital capacity. Their participation should be evidenced by mandate, process, diligence and decision timing. A name on a prior round does not establish future support.
The fund should monitor which holdings compete for the same capital providers. It should build alternative syndicates before runway becomes critical. Information sharing must respect confidentiality, conflicts and securities law.
47. Govern valuation
IPEV's 2025 Guidelines set out current best-practice recommendations for reporting private-capital investments at fair value [13]. The fund's valuation process should use observable transaction evidence, calibrated assumptions, market participants' perspective and documented judgement. Dependency changes belong in valuation when they affect expected cash flows, risk, financing or marketability.
Technical progress should not automatically create value. The manager should link each milestone to customer economics, capital needs and remaining risk. A shared launch or customer event can affect several valuations at the same date and should be reviewed consistently.
48. Avoid double counting ecosystem value
Portfolio companies can benefit from shared infrastructure, customers, standards and talent. The same ecosystem effect can enter company forecasts, comparable narratives and a portfolio strategic premium. Counting it repeatedly overstates value.
The investment committee should identify each common driver once, test its evidence and allocate its effect consistently. Cost synergies or cross-selling should remain outside base value until there is authority, operational capacity, customer consent and a measurable economic pathway.
49. Analyse strategic exit correlation
Several holdings can depend on the same small set of strategic acquirers. National-security review, export controls, buyer budgets and integration appetite can therefore correlate exit timing and price. One acquisition can also reduce competition for later assets or create a new platform buyer.
The manager should map credible buyer categories, ownership constraints, product fit and transaction precedents without treating private deal values as known when they are undisclosed. Exit readiness should include transferable contracts, rights, security, technical records and an independent operating plan.
50. Analyse public-market correlation
Public market conditions affect comparables, crossover capital, special-purpose acquisition companies and buyer financing. A portfolio can hold diverse technologies while relying on one risk-appetite cycle for liquidity. Space-sector volatility can also affect private round terms.
The fund should use valuation ranges and financing scenarios rather than a single public-market multiple. It should distinguish business performance from market movement and avoid using one listed company as a universal comparable across launch, satellite, components and software.
51. Analyse secondary liquidity
Secondary sales can reduce concentration, return capital or manage fund life. Pricing depends on company evidence, rights, information access, buyer universe and transaction structure. A discount can be economically rational when it releases scarce reserves or reduces a central dependency.
The manager should compare a secondary with continued holding, structured liquidity, company tender, continuation vehicle and strategic sale. Conflicts, allocation and limited-partner governance should be documented. Indications should not be treated as executable proceeds.
52. Construct fund return scenarios
Return scenarios should connect company values with dependency shocks, dilution, reserves, timing and exit concentration. The model should show how many independent outcomes are required to achieve the target return. A portfolio whose base case depends on one buyer, programme or launch route is economically concentrated.
The manager should report gross and net effects under consistent assumptions. It should separate current fair value from scenario value and identify which outcomes remain unverified. Sensitivity should focus on decisions that change capital allocation.
Table 4. Hypothetical SpaceTech fund return and dependency scenarios
| Scenario | Illustrative invested capital | Illustrative gross distributions | Illustrative gross multiple | Dependency outcome |
|---|---|---|---|---|
| Downside concentration | USD 180m | USD 108m | 0.6x | Launch, government and financing shocks affect most holdings together |
| Resilience case | USD 180m | USD 306m | 1.7x | Components, software and contracted services offset upstream losses |
| Base illustration | USD 180m | USD 630m | 3.5x | Several independent service exits and one infrastructure outcome |
| Upside | USD 180m | USD 1.35bn | 7.5x | Multiple strategic exits across distinct customers and dependency paths |
| Concentrated upside | USD 180m | USD 1.80bn | 10.0x | One constellation or launch platform contributes most portfolio value |
All amounts, multiples and timing assumptions are illustrative management estimates; they are not market observations, forecasts or recommendations.
53. Test fund-life fit
Space companies can require repeated engineering, qualification, deployment and customer cycles. The fund should compare each holding's technical and commercial clock with investment period, extension rights, reserve horizon and expected liquidity. A strong company can remain a poor fit for a fund nearing its end.
The committee should identify decisions available before time pressure rises. These can include syndication, secondary sale, structured capital, continuation, strategic partnership or earlier stop. The chosen route should protect company continuity and limited-partner alignment.
54. Govern follow-on decisions
Every follow-on should reassess company evidence, dependency concentration and fund liquidity. Pro rata rights provide an option rather than an obligation. Sunk cost, reputation and fear of signalling should not replace comparative expected value.
The memo should show the result with and without participation, expected dilution, milestone runway, alternative investors and effect on other reserves. It should record conflicts when the manager controls several affected holdings or vehicles.
55. Govern cross-portfolio action
The fund can create value through shared procurement, technical introductions, customer access and risk intelligence. It must protect confidential information, competition, export controls and company governance. A fund-level dependency map should use the minimum information needed for portfolio decisions.
Any cross-portfolio contract should have clear authority, arm's-length economics and documented benefit. The manager should avoid directing one company to subsidise another. Strategic coordination is valuable when company boards retain independent judgement.
56. Report to limited partners
Limited partners need a clear account of concentration, reserves, valuation and material events. ILPA's Portfolio Company Template was designed to support periodic disclosure of company metrics beyond standard fund reporting and is being updated as expectations and data systems evolve [14]. The fund should choose measures that reflect its strategy and remain consistent.
Reporting should distinguish verified company facts, manager judgements and hypothetical scenarios. It should explain material changes in dependency exposure and reserve policy. Aggregated reporting can protect sensitive details while preserving decision usefulness.
57. Rebalance the portfolio
Private funds rebalance through new investments, follow-ons, syndication, secondary sales, write-offs and reserve changes. They cannot trade every risk away quickly. Rebalancing should therefore begin when evidence changes rather than after a formal round or valuation date.
The manager should compare company-level opportunity with portfolio dependence. Adding an attractive Earth-observation company can increase exposure to one launch provider, cloud platform and government budget. The portfolio effect belongs in the decision.
58. Apply five portfolio gates
The first gate tests the dependency map and evidence. The second tests concentration and recovery. The third tests company economics under the shared shock. The fourth tests reserves and syndicate capacity. The fifth tests fund-life and liquidity fit.
An open gate should trigger more evidence, changed terms, smaller sizing, a mitigation plan or a stop decision. The committee should record owner and deadline. Management confidence does not close a gate without support.
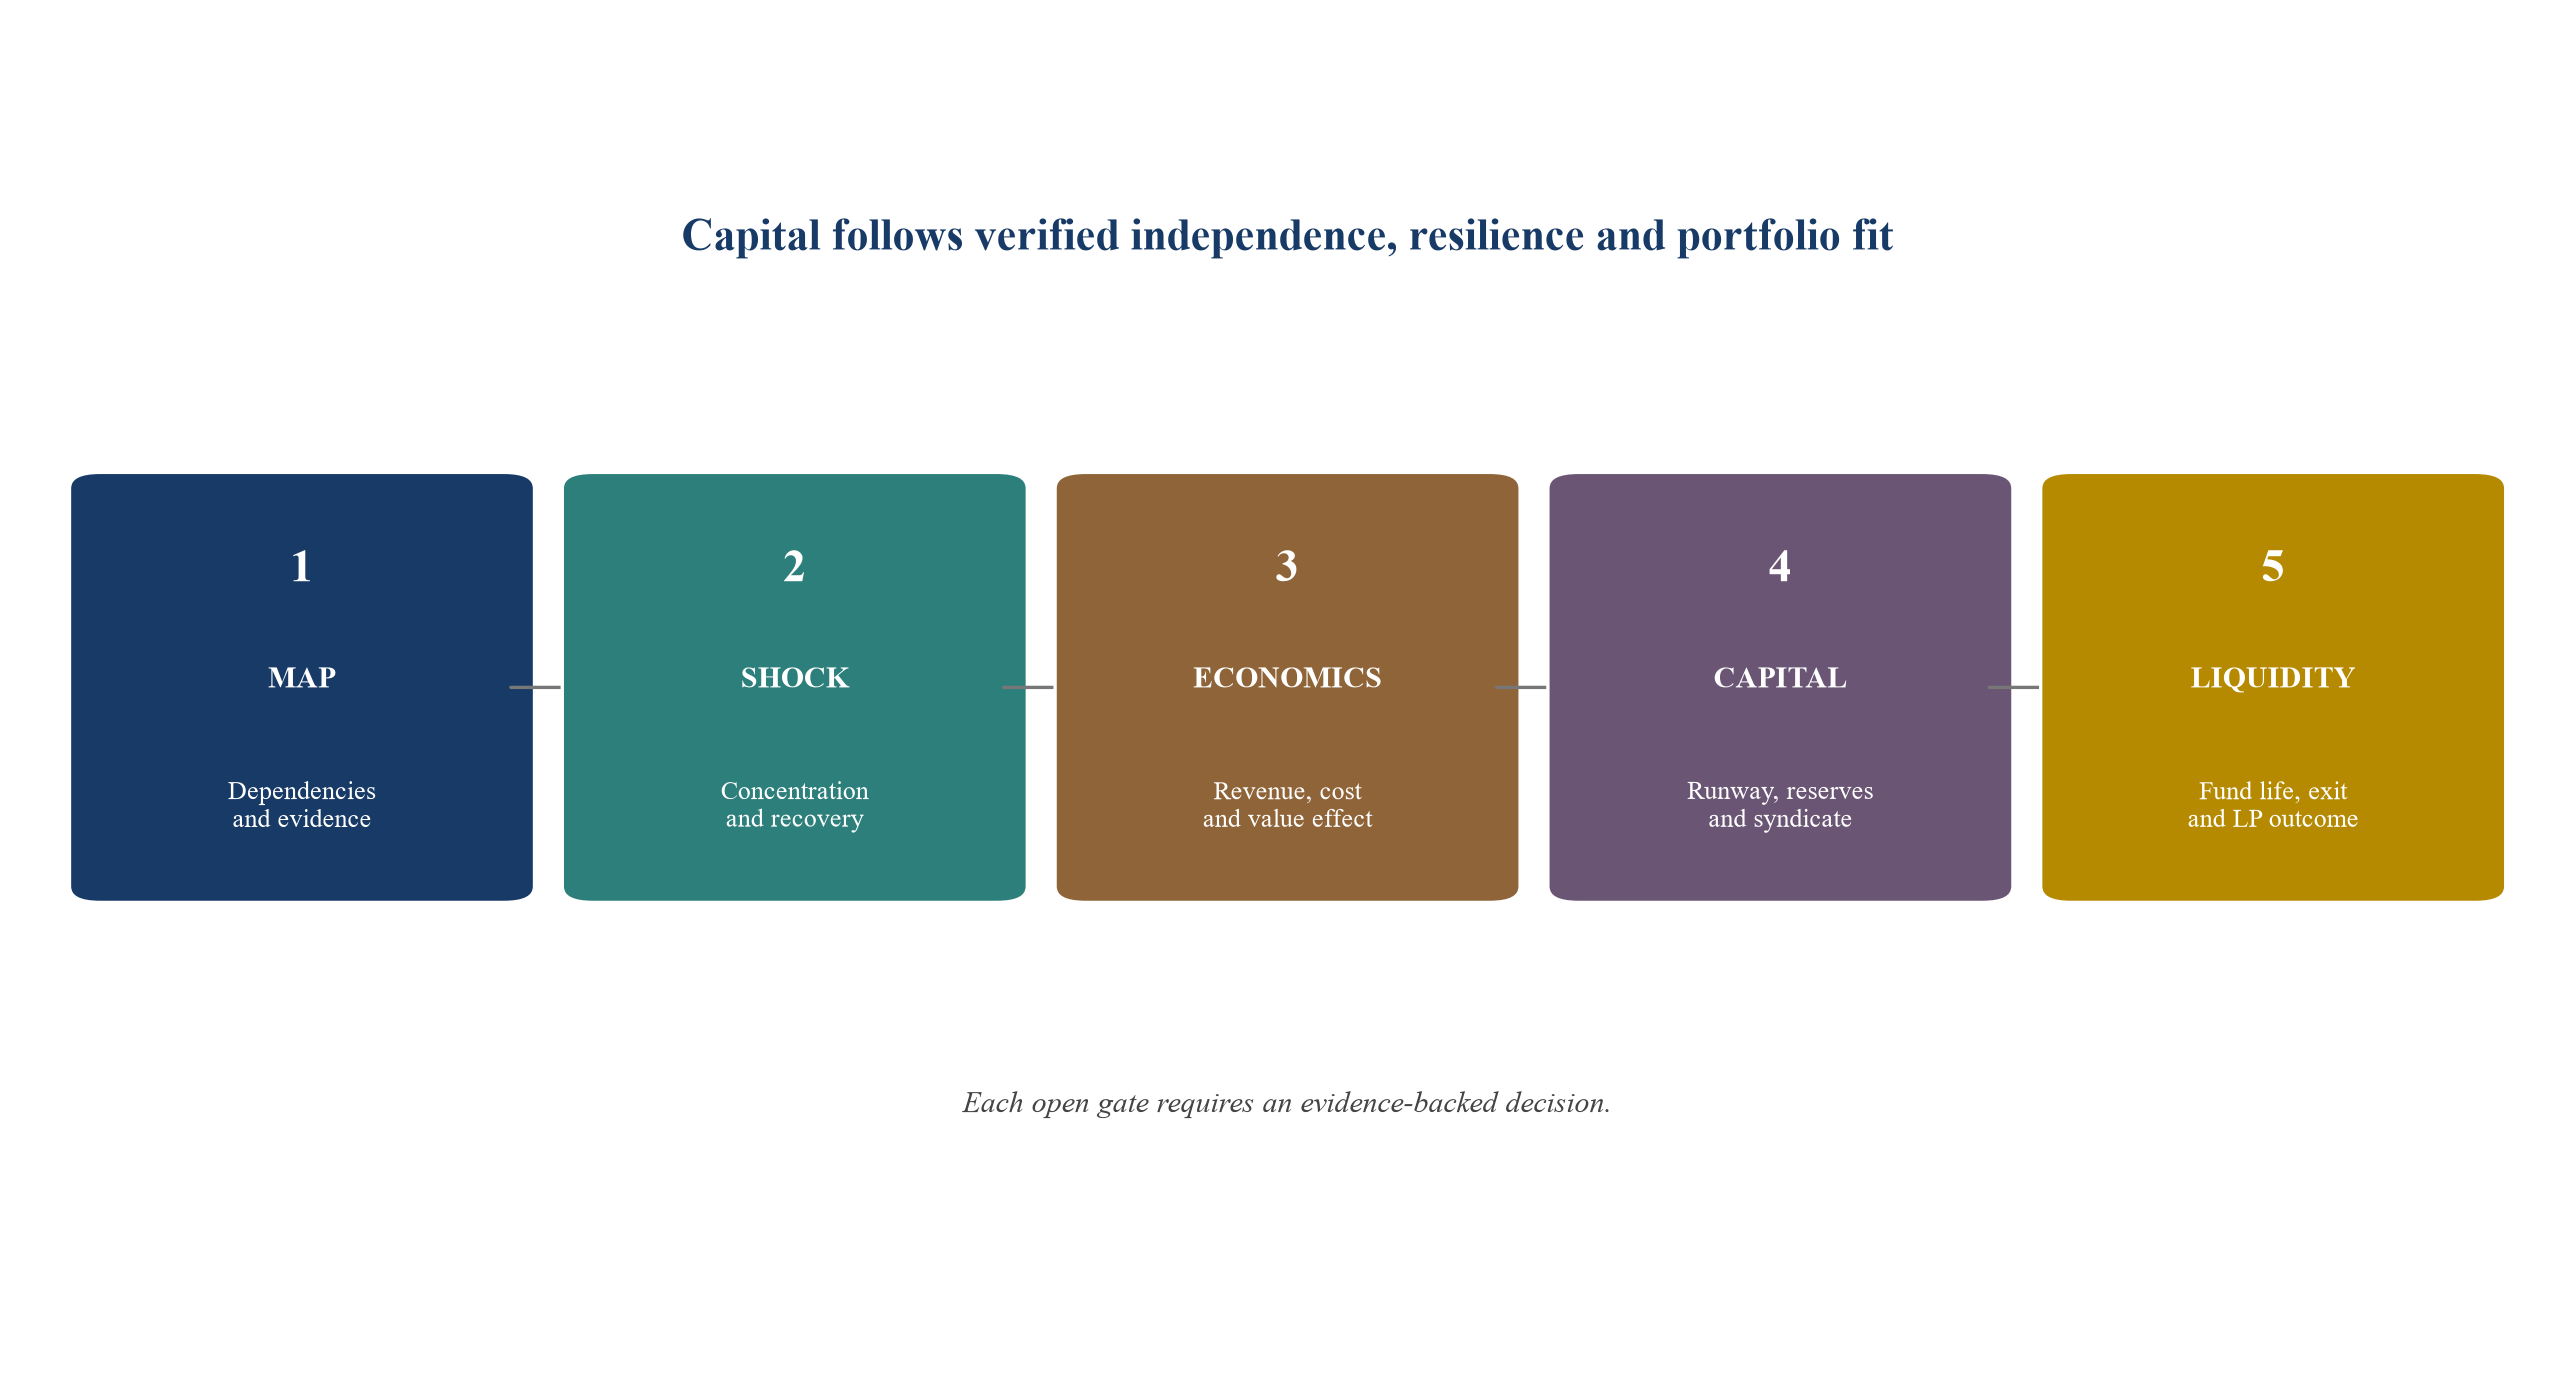
Each gate requires current evidence and a recorded capital decision.
59. Maintain the decision record
The manager should record every dependency, evidence grade, scenario, limit, exception, reserve, valuation and review trigger. The record should identify source, owner and date. It should preserve why capital moved between holdings and how shared risks were treated.
The decision record supports governance, audit and later performance review. It also prevents a repeated narrative from becoming a portfolio fact. Material unknowns should remain visible until they are resolved or explicitly accepted.
60. Conclusion
SpaceTech portfolios can carry concentrated economic risk across apparently different companies. Launch, spectrum, components, facilities, customers, policy, ground systems, capital and talent connect outcomes across the value chain. Company count and subsector labels do not reveal these common drivers.
The SpaceTech Dependency Portfolio Framework combines a look-through graph, evidence grades, shock scenarios, limits, milestone reserves and liquidity tests. It enables investment committees to choose concentration deliberately, fund resilience before a crisis and preserve capital for outcomes that remain technically and commercially independent.
References
- UK Department for Business, Energy and Industrial Strategy. National Space Strategy: Technical Annex. 2021. https://www.gov.uk/government/publications/national-space-strategy/national-space-strategy-technical-annex
- Organisation for Economic Co-operation and Development. The Economics of Space Sustainability. 2024. https://doi.org/10.1787/b2257346-en
- Organisation for Economic Co-operation and Development. The Space Economy at a Glance 2026. 9 September 2026. https://doi.org/10.1787/cbf9b240-en
- United States Federal Aviation Administration. Commercial Space Transportation. https://www.faa.gov/space
- United States Government Accountability Office. National Security Space Launch: Increased Commercial Use of Ranges Underscores Need for Improved Cost Recovery. GAO-25-107228. June 2025. https://www.gao.gov/products/gao-25-107228
- International Telecommunication Union. Satellite Regulation and Coordination. Updated September 2026. https://www.itu.int/en/mediacentre/backgrounders/Pages/Regulation-of-Satellite-Systems.aspx
- National Aeronautics and Space Administration. NASA Electronic Parts and Packaging Program. https://nepp.nasa.gov/
- NASA Jet Propulsion Laboratory. Space Radiation Effects on Integrated Circuits. https://parts.jpl.nasa.gov/asic/Appendix.3.html
- NASA Jet Propulsion Laboratory. Component Engineering and Assurance: Radiation Effects. https://parts.jpl.nasa.gov/radiation-effects/
- Organisation for Economic Co-operation and Development. The Space Economy in Figures. 2023. https://doi.org/10.1787/fa5494aa-en
- UK Government. UK Space Strategy. September 2026. https://www.gov.uk/government/publications/uk-space-strategy/uk-space-strategy
- UK Space Agency. Size and Health of the UK Space Industry 2024. July 2025. https://www.gov.uk/government/publications/size-and-health-of-the-uk-space-industry-2024
- International Private Equity and Venture Capital Valuation Board. IPEV Valuation Guidelines 2025. December 2025. https://www.privateequityvaluation.com/Valuation-Guidelines
- Institutional Limited Partners Association. Draft Updated Portfolio Company Template. July 2026. https://ilpa.org/resources-tools/resource-library/ilpa-portfolio-company-template-v-2-0/
- European Space Agency. Report on the Space Economy 2025: Private Investment in Space. 2025. https://space-economy.esa.int/documents/tJMabTj61KkdGVOtF6SKw6wGSxicen6ajUWamCG3.pdf
- European Space Policy Institute. Space Venture Europe 2025. https://www.espi.or.at/reports/space-venture-europe-2025/
- UK Government. National Space Strategy in Action. July 2023. https://www.gov.uk/government/publications/national-space-strategy-in-action/national-space-strategy-in-action
- UK Government. Space Industrial Plan: From Ambition to Action. March 2024. https://www.gov.uk/government/publications/space-industrial-plan/space-industrial-plan-from-ambition-to-action-advancing-uk-space-industry
- UK Space Agency. Unlocking Space for Investment: Investor Readiness Essentials. 2025. https://www.gov.uk/government/publications/unlocking-space-for-investment-growth-hub/track-1-investor-readiness-essentials
- United States Government Accountability Office. Missile Warning Satellites: Space Development Agency Should Be More Realistic and Transparent About Risks to Capability Delivery. GAO-26-107085. 2026. https://www.gao.gov/products/gao-26-107085
- Organisation for Economic Co-operation and Development. Harnessing New Space for Sustainable Growth of the Space Economy. 2023. https://doi.org/10.1787/a67b1a1c-en
- Organisation for Economic Co-operation and Development. Earth's Orbits at Risk: The Economics of Space Sustainability. 2022. https://doi.org/10.1787/16543990-en
- United Nations Office for Outer Space Affairs. Guidelines for the Long-term Sustainability of Outer Space Activities. 2021. https://www.unoosa.org/oosa/en/ourwork/topics/long-term-sustainability-of-outer-space-activities.html
- United Nations Office for Outer Space Affairs. Online Index of Objects Launched into Outer Space. https://www.unoosa.org/oosa/osoindex/index.jspx
- European Space Agency. Space Debris by the Numbers. https://www.esa.int/Space_Safety/Space_Debris/Space_debris_by_the_numbers
- United States Federal Communications Commission. Space Bureau. https://www.fcc.gov/space
- United States National Oceanic and Atmospheric Administration. Commercial Remote Sensing Regulatory Affairs. https://www.nesdis.noaa.gov/commercial-space/regulatory-affairs
- United States Department of Commerce. Office of Space Commerce. https://space.commerce.gov/
- United States Bureau of Industry and Security. Export Administration Regulations. https://www.bis.gov/regulations/ear
- United States Department of State. Directorate of Defense Trade Controls. https://www.pmddtc.state.gov/
- UK Civil Aviation Authority. Space industry licensing. https://www.caa.co.uk/space/
- UK Government. Space Industry Act 2018. https://www.legislation.gov.uk/ukpga/2018/5/contents
- UK Government. Space Industry Regulations 2021. https://www.legislation.gov.uk/uksi/2021/792/contents
- European Union Agency for the Space Programme. EU Space Programme. https://www.euspa.europa.eu/european-space/eu-space-programme
- European Commission. EU Space Strategy for Security and Defence. https://defence-industry-space.ec.europa.eu/eu-space-policy/eu-space-strategy-security-and-defence_en
- National Aeronautics and Space Administration. Small Spacecraft Systems Virtual Institute. https://www.nasa.gov/smallsat-institute/
- National Aeronautics and Space Administration. Orbital Debris Program Office. https://orbitaldebris.jsc.nasa.gov/
- United States Securities and Exchange Commission. Private Fund Advisers. https://www.sec.gov/investment/private-fund-advisers
- Institutional Limited Partners Association. Principles 3.0. https://ilpa.org/industry-guidance/principles-best-practices/
- International Organization of Securities Commissions. Principles for the Valuation of Collective Investment Schemes. https://www.iosco.org/library/pubdocs/pdf/IOSCOPD413.pdf
About the Author
Chennakeshav (CK) is a corporate finance and investment banking executive with 25+ years of global experience in deal origination, structuring and execution across M&A, growth capital and corporate strategy. He has led value-creation mandates for founders, corporates and funds — bridging the boardroom view to hands-on execution and close.
His career spans Morgan Stanley, HSBC, Lloyds Banking Group, EWEC, ADQ portfolio companies and Emirates Growth Fund, across TMT, real estate, fintech, deeptech, cleantech, infrastructure and energy. He has partnered with C-suite leaders, private equity and venture funds, sovereign wealth funds and family offices to finance complex fund raises and scale-up ventures, and has led M&A due diligence, post-merger integration and business-transformation initiatives to create value.
At Matchpoint Partners he is Managing Partner, leading the firm's corporate finance, M&A and capital-raising practice. He holds an MBA from London Business School, an engineering degree from VTU and a Master of Laws (LLM, in progress) from UCL London.
An active start-up mentor, CK mentors at Techstars, DIFC FinTech Hive, Startup Grind, Founder Institute and IN5, serves as Entrepreneur Mentor in Residence (EMiR) at London Business School, and judges the Entrepreneurship World Cup.
