

1. The investment decision
The utility must decide whether a proposed detection system can reduce the total economic cost of leakage and response. That decision covers sensors, communications, data engineering, models, analyst review, field confirmation, repair and feedback. A model that produces alerts without a reliable path to field action is incomplete.
Approval should state the target network, leak types, operating baseline, acceptable errors, deployment cost, service workflow, evidence period and conditions for scale. The decision should remain tied to verified field outcomes.
2. Define the useful outcome
The useful outcome is a leak that is detected early enough, located tightly enough, confirmed efficiently and repaired economically. Detection alone identifies abnormal behaviour. Localisation narrows the search. Confirmation determines whether the event is real. Repair converts information into water and service benefit.
These stages should be measured separately. A system can detect an anomaly accurately while sending crews to a wide or incorrect search area.
3. The base-rate problem
Leaks are rare relative to normal operating intervals. Even a small false-positive rate can generate more false than true alerts when millions of normal observations are screened. Precision therefore depends on both model behaviour and the underlying event rate.
A pilot should disclose the number of true leaks, normal periods, alerts, investigations and confirmed outcomes. Overall accuracy can look high when the model mostly predicts the common no-leak class.
4. Confusion-matrix economics
A true positive can accelerate repair. A false positive consumes review and field capacity. A false negative leaves a leak undetected. A true negative avoids intervention. Each outcome has a different cost, and those costs vary by asset, location and consequence.
The economic threshold should reflect avoided water, damage, service interruption and escalation against analyst, survey, excavation and missed-event cost.
5. Precision and recall
Precision measures the share of alerts that are true. Recall measures the share of actual events detected. Raising sensitivity can improve recall while increasing false alerts. Tightening the threshold can improve precision while missing smaller events.
Recent multi-network work reports materially different precision and recall across network structures and leak sizes [1]. One threshold should not be assumed to suit every district or operating state.
6. Detection-to-repair architecture
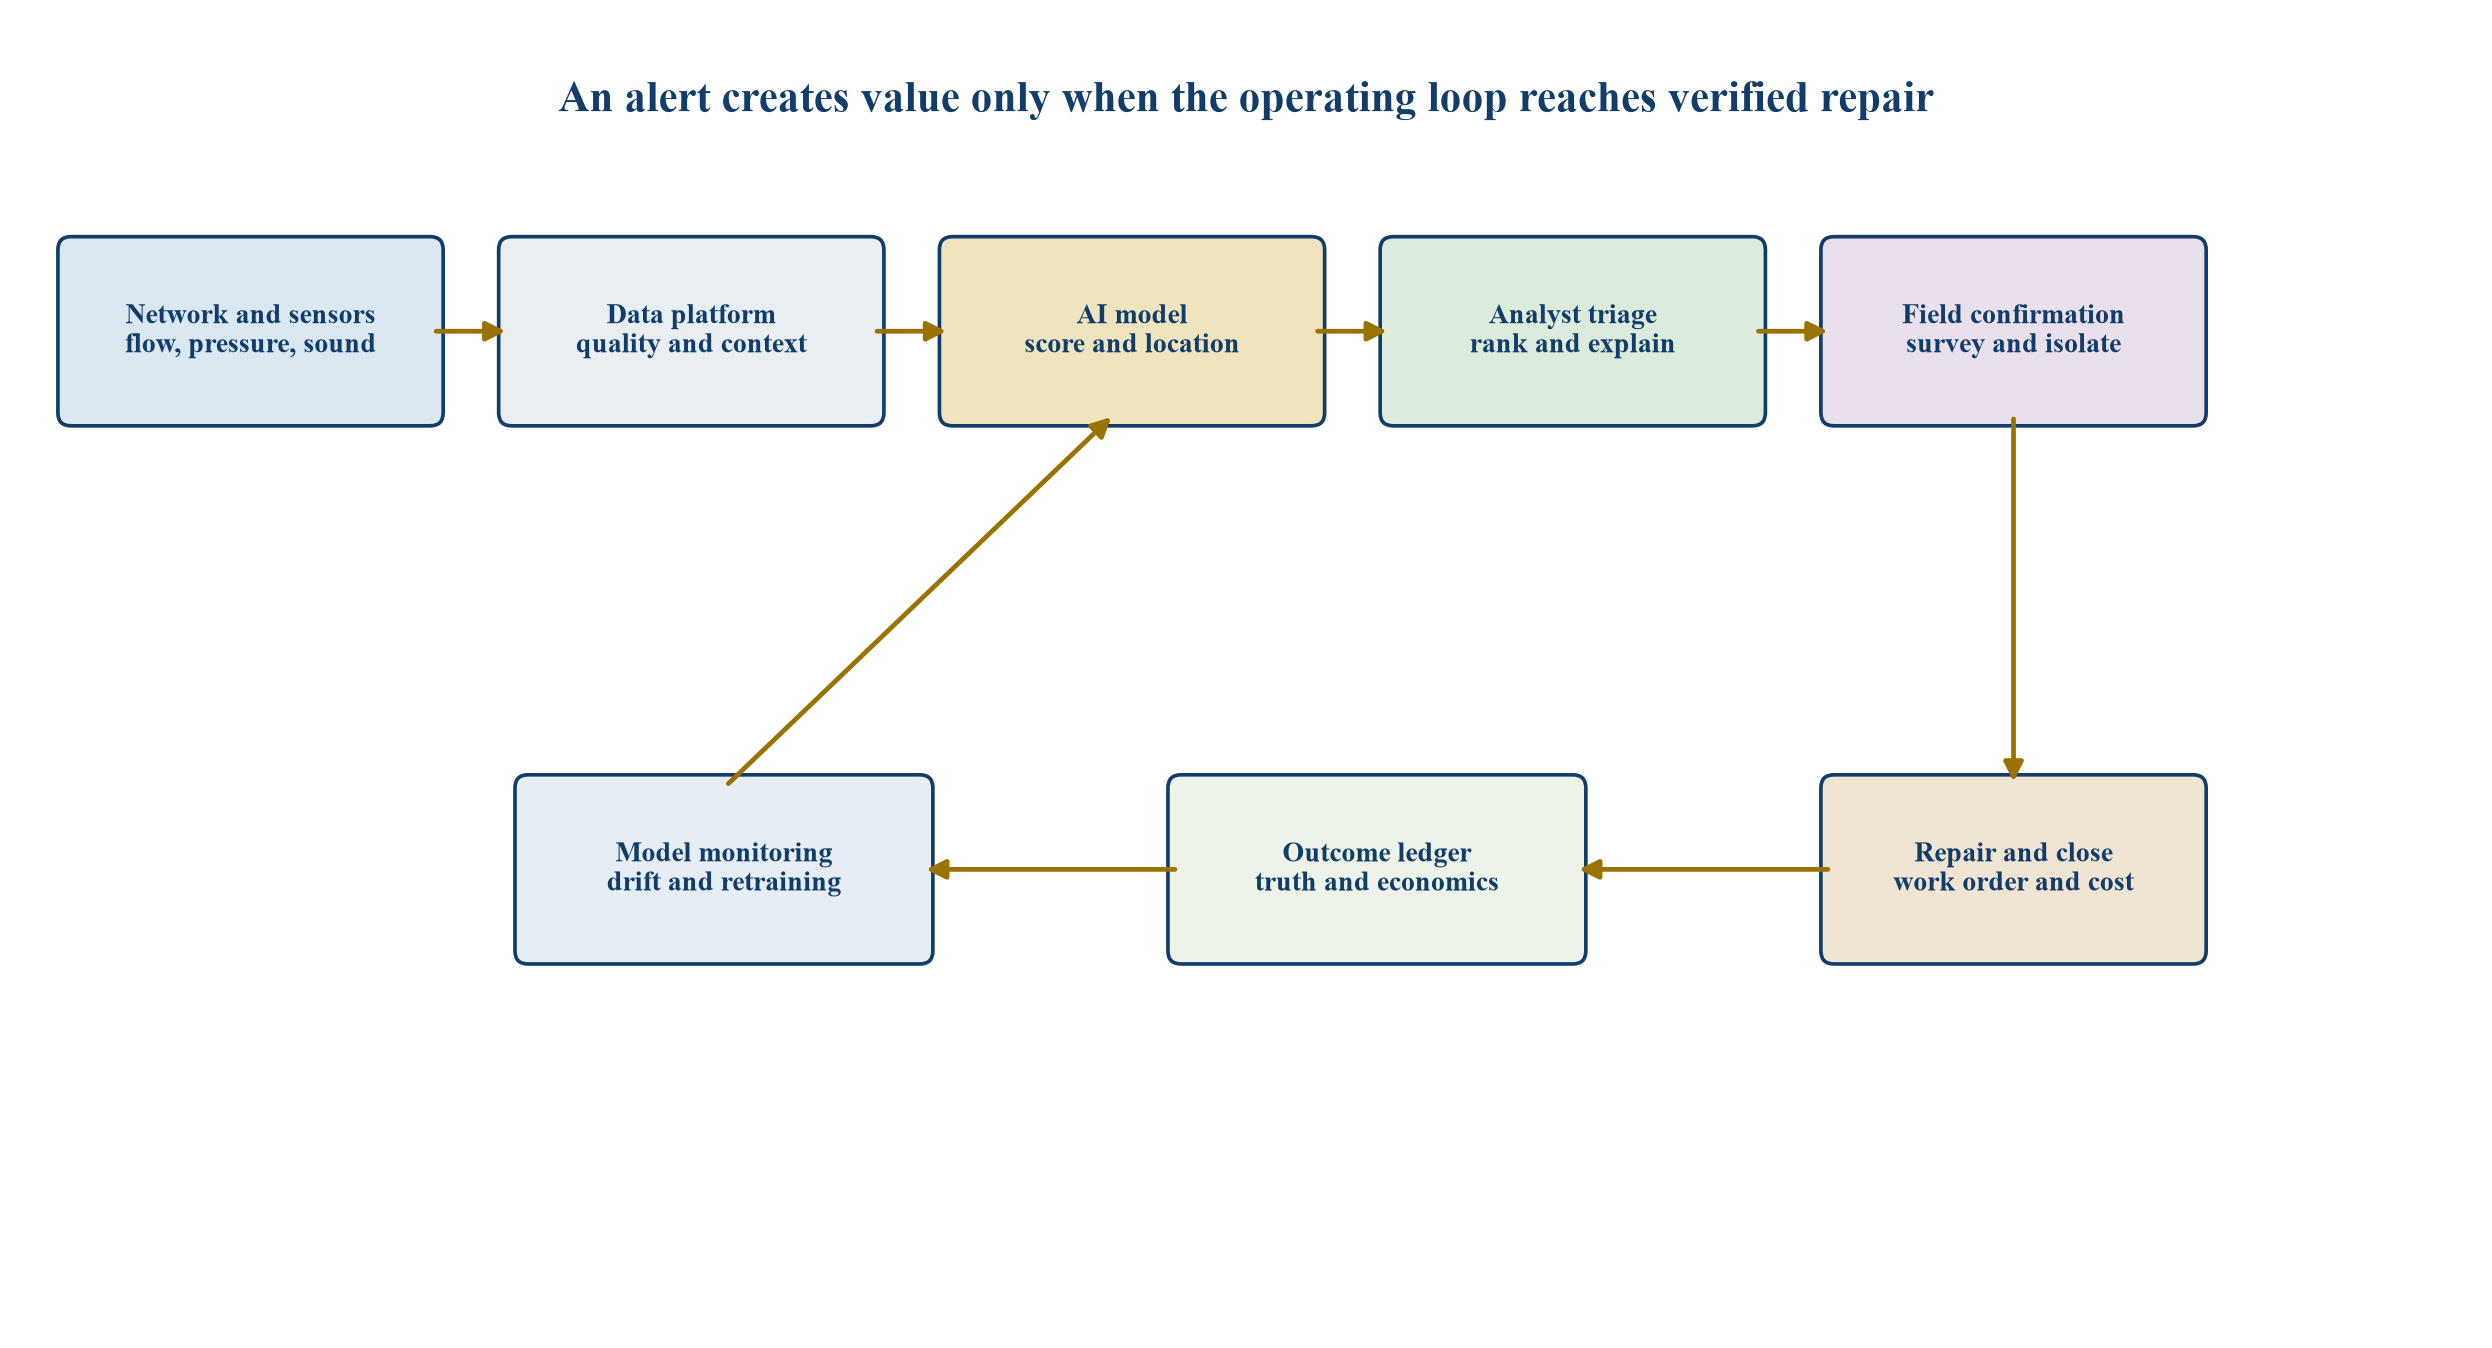
Generic structure; actual systems, responsibilities and controls depend on utility and jurisdiction.
7. Detection versus localisation
Binary detection asks whether an event exists. Localisation asks where it is. Size estimation asks how material it may be. Research benchmarks show that detection performance can exceed localisation performance, particularly under noise, sparse sensors or weak hydraulic signatures [2].
Procurement should specify the required location tolerance and field-search burden. A correct alert covering several kilometres can remain operationally expensive.
8. Define leak classes
Leaks can include background leakage, service-connection leakage, bursts, valve or hydrant loss, reservoir overflow and customer-side events. Their signals, consequences and response times differ.
The taxonomy should identify which classes the system is designed to detect. Vendor claims should not extend from a tested class to every loss mechanism without evidence.
9. Establish the operating baseline
The baseline should record current detection methods, survey frequency, response time, repair confirmation, leak run time, water lost, repeat visits and cost. It should also document network segmentation, sensor estate, telemetry availability and field constraints.
The investment case needs a counterfactual. A leak found by AI may also have been found through routine night-flow analysis or customer reports.
10. Pressure sensors
Pressure changes can indicate bursts, demand events, valve operations, pump changes and leaks. Sensor location, resolution, sampling and synchronisation influence detectability.
Models should incorporate known operating events and pressure-management zones. A threshold trained under one control regime may fail after set-point or supply changes.
11. Flow sensors
District and boundary flow support minimum-night-flow, balance and anomaly methods. Reliable boundaries and calibrated input meters are essential.
Flow anomalies can reflect legitimate demand, network transfers, flushing or meter error. Context and confirmation remain necessary.
12. Acoustic sensing
Acoustic loggers and correlators can detect leak noise and support location. Pipe material, diameter, soil, background noise, pressure and sensor spacing affect propagation.
Water use, pumps and environmental noise can resemble leaks. Field confirmation should remain part of the workflow.
13. Fibre and distributed sensing
Existing or installed fibre can support continuous acoustic or vibration monitoring over long corridors. Coverage and data volume can be attractive for critical mains.
The business case should include access rights, interrogation equipment, signal processing, specialist analysis, false-event classification and repair integration.
14. Advanced metering infrastructure
Customer-meter intervals can reveal continuous consumption and possible premises leakage. Distribution-network detection may also use aggregated demand residuals and hydraulic context.
AMI coverage, interval, communication reliability and customer consent shape the use case. Customer-side alerts need a separate service process.
15. Satellite and remote sensing
Remote sensing can prioritise broad areas using surface, moisture or other signals. It may complement field survey where access is difficult.
Ground conditions, weather, depth and non-water moisture can affect interpretation. Confirmation cost and revisit frequency should be included.
16. Sensor fusion
Combining pressure, flow, acoustic, AMI, work-order, weather and operational data can reduce ambiguity. Fusion also increases integration and data-quality requirements.
The model should reveal which sources drove the alert and how it behaves when a source is unavailable. Resilience should be tested through sensor-ablation scenarios.
17. Sensor placement
Placement should follow the target leak size, network topology, hydraulic sensitivity, critical assets, communications and field access. Uniform spacing may waste coverage or miss low-sensitivity areas.
Research on model falsification and sensor placement demonstrates that uncertainty and network configuration affect localisation capability [3]. The pilot should test placement alternatives before full rollout.
18. Sampling and synchronisation
Fast transients can require high-frequency and tightly synchronised data. Slow background leakage may be detected through lower-frequency trends. Sampling should match the physical signal and operating decision.
Clock drift, missing intervals and aggregation can produce apparent anomalies. Data engineering controls should be specified alongside the model.
19. Communications
Connectivity determines latency, completeness and cost. The design can use cellular, radio, fibre, low-power networks or store-and-forward methods.
Coverage, power, data volume, maintenance and cyber controls should be tested in the actual deployment environment. Laboratory connectivity is not field evidence.
20. Data-quality gates
The pipeline should test plausibility, range, time alignment, duplication, missingness, flat-line behaviour and calibration status. Data failing a critical gate should not create an operational alert without qualification.
Quality status should travel with the prediction so analysts can distinguish network anomalies from sensor anomalies.
21. Label quality
Supervised learning requires examples marked as leak or normal. Labels can come from controlled tests, confirmed repairs, work orders, surveys or simulation. Each has limitations.
Work orders may omit unfound alerts or contain inaccurate times and locations. Controlled releases may not represent natural failures. The training register should preserve provenance and confidence.
22. Rare-event data
Large leaks may be operationally important and statistically scarce. Small leaks may be more numerous but weakly visible. A dataset should represent the intended event and network conditions.
Resampling can assist training while leaving evaluation prevalence realistic. Performance should be reported on an untouched field-representative set.
23. Simulation
Hydraulic and transient models can generate labelled scenarios across locations and sizes. They support controlled experiments and coverage exploration.
Simulation assumptions about demand, roughness, controls, noise and sensor behaviour should be documented. A model trained on synthetic data requires field validation.
24. Simulation-to-field gap
Recent research reports substantial performance loss when models trained on simulation are applied directly to field measurements, with improvement after field-data transfer learning [4]. That evidence supports a deliberate adaptation stage.
The utility should retain a field holdout set and prevent repeated tuning against the final acceptance sample.
25. Model classes
Methods include statistical thresholds, change detection, hydraulic residuals, support-vector machines, tree ensembles, neural networks, graph models, transformers and autoencoders. No model class is automatically best for every network.
Selection should follow field precision, recall, location, latency, interpretability, maintainability and cost rather than novelty.
26. Supervised classification
Supervised models learn from labelled examples. They can perform well when field labels cover operating variation and the target class.
Performance may degrade for new pipe materials, seasons, pressure zones or sensor configurations. The deployment plan needs monitoring and retraining rules.
27. Unsupervised anomaly detection
Unsupervised methods learn normal patterns and score deviations. They can identify novel events with fewer leak labels.
They can also alert on legitimate operational change. The operating team needs context, threshold governance and a path to classify outcomes.
28. Hydraulic residual methods
Residual methods compare measurement with model prediction. Their value depends on model calibration, demand estimation and sensor uncertainty.
They can provide physical interpretation and localisation, while network changes require model maintenance. The utility should budget for calibration.
29. Explainability
Analysts need enough evidence to rank and investigate alerts. Useful explanation can include affected sensors, time window, deviation direction, candidate area, comparable events and data-quality status.
Explanation should support operational judgement. A visual explanation does not prove causal correctness.
30. Alert funnel
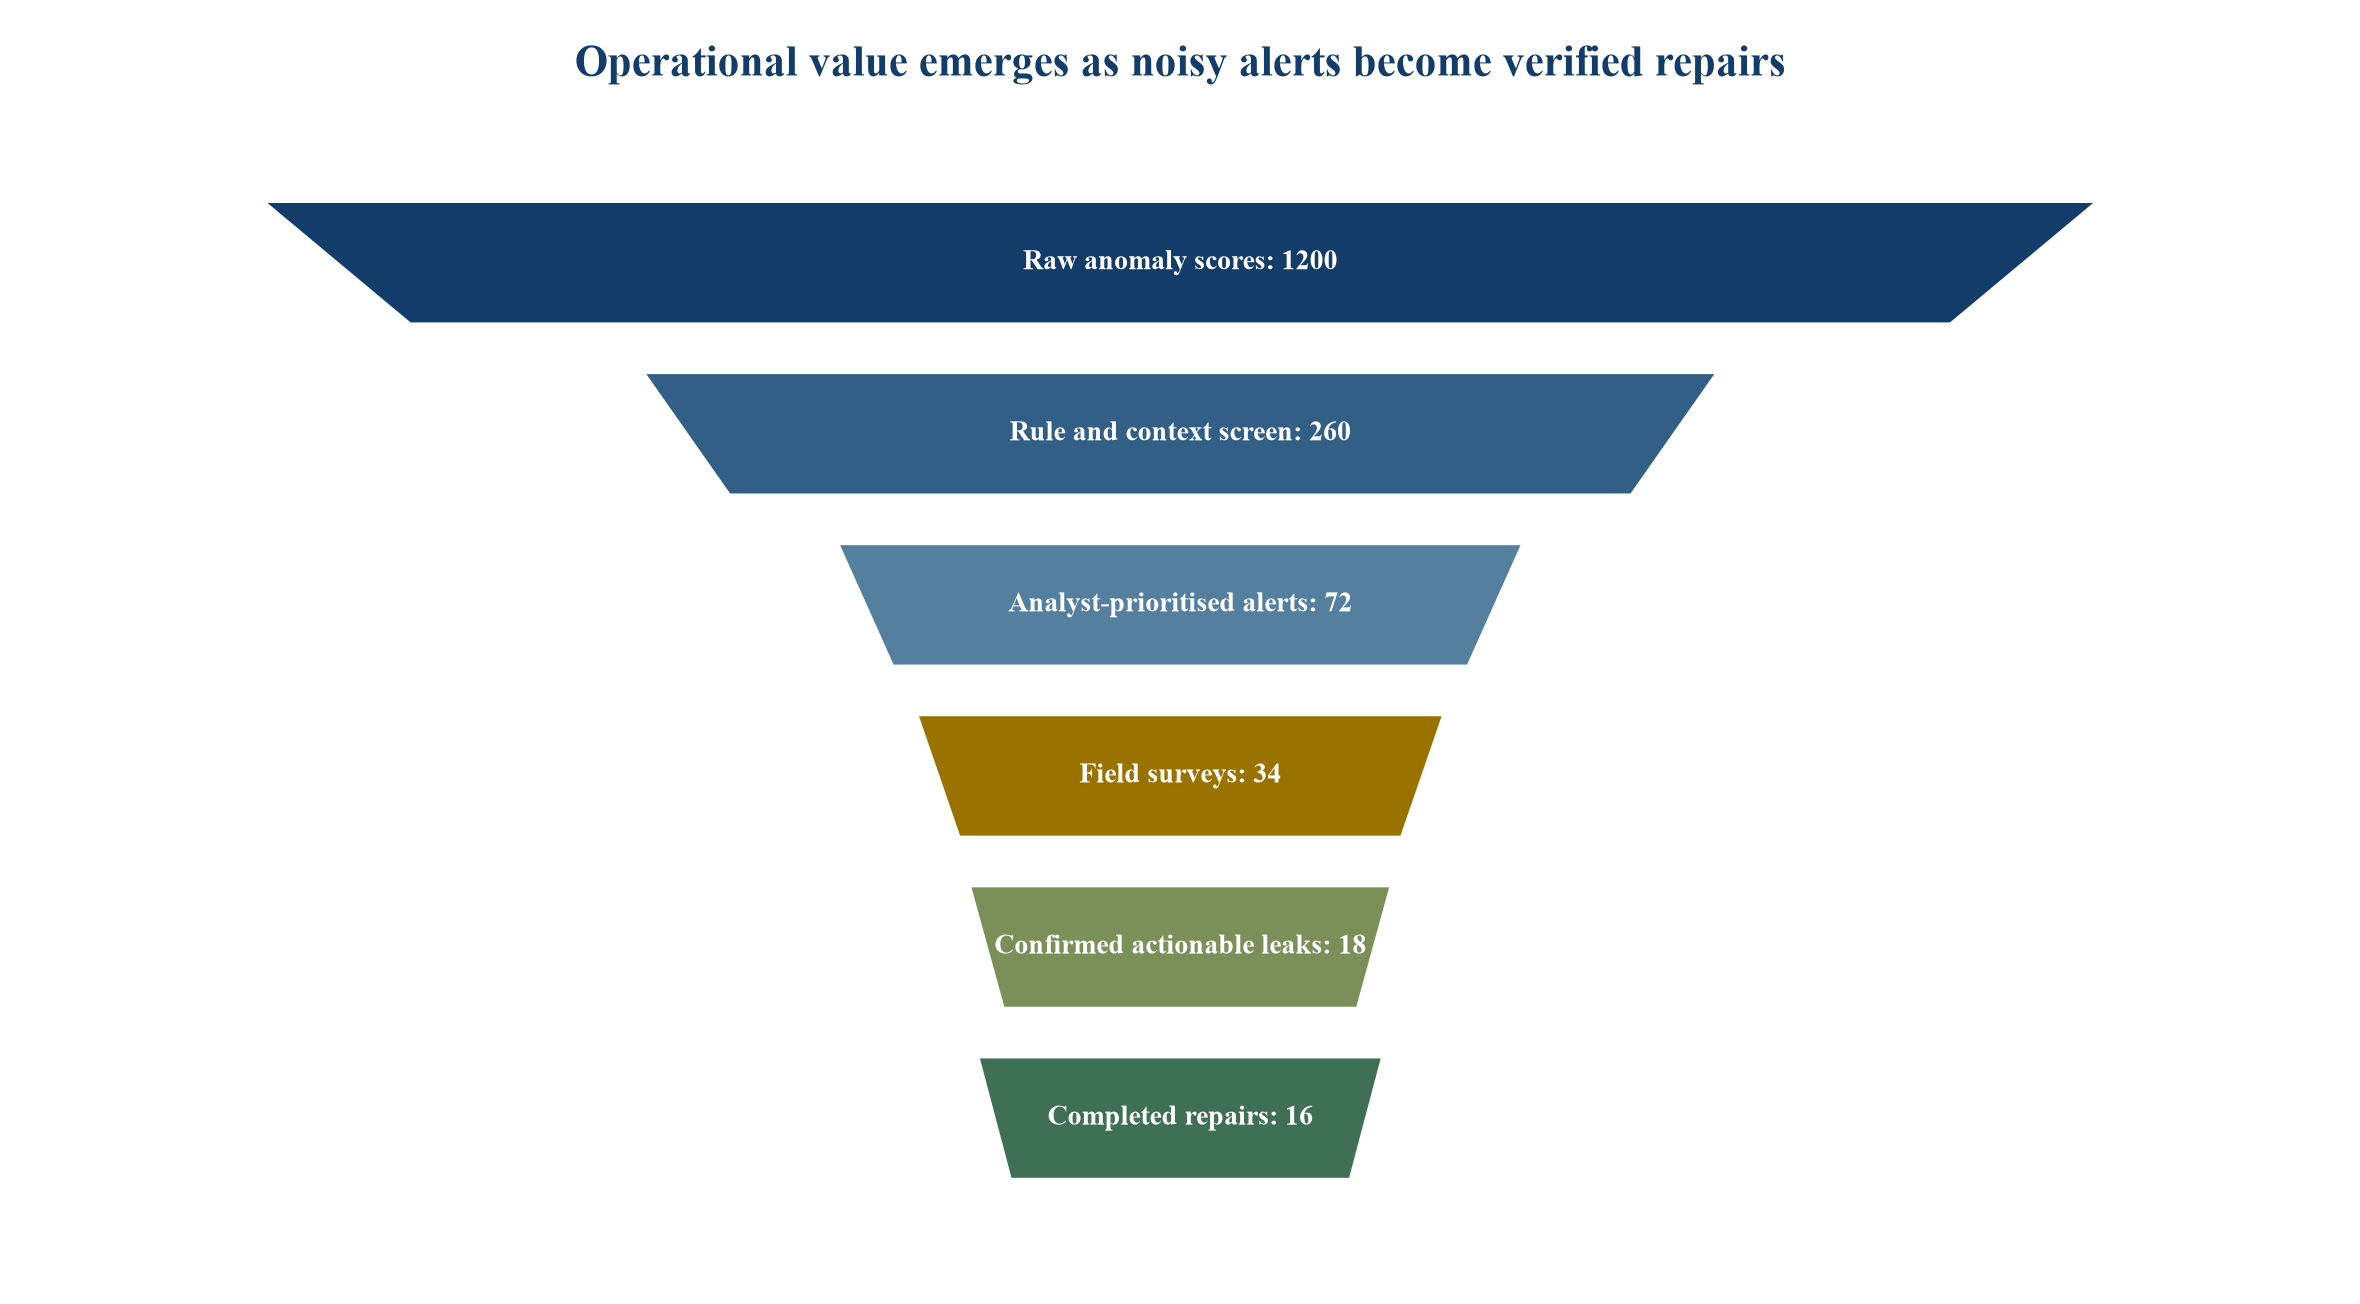
Illustrative counts only; actual volumes depend on network, model and operating thresholds.
31. Threshold governance
Thresholds determine alert volume and missed events. They should be approved by use case, zone and consequence. Operators should know when a threshold changed and why.
Emergency or critical-main detection may favour recall; routine background-leak work may favour precision. The economic model should reflect this choice.
32. Alarm fatigue
EPA guidance on distribution-system event detection describes the need to balance sensitivity with false positives and recognises alarm fatigue from excessive alerts [5]. Leak operations face a comparable human constraint.
Queue size, age, review time, dismissal reasons and repeat alerts should be monitored. An unworked alert has no operational value.
33. Alert deduplication
One physical event can generate repeated scores across sensors and time. The platform should group related signals into an incident and retain the underlying evidence.
Poor deduplication inflates headline alert counts and analyst workload. Incident-level precision is more useful than record-level precision.
34. Prioritisation
Alerts can be ranked by estimated loss, consequence, confidence, critical customers, road risk, access and proximity to other work. The ranking method should remain transparent.
High confidence does not always mean high value. A moderate-confidence event on a critical main may require faster review.
35. Analyst triage
Analysts should review data quality, operating events, neighbouring sensors, hydraulic context, history and consequences. Triage should lead to dismiss, monitor, remote test or field action.
Decision time and consistency should be measured. Training examples can use adjudicated outcomes.
36. Field confirmation
Confirmation can use acoustic survey, step testing, pressure logging, visual inspection, tracer methods or controlled isolation. The method should match pipe and location.
Field teams need a search area, evidence package, safety plan and closure code. An alert remains unverified until the agreed confirmation standard is met.
37. Excavation decision
Excavation has direct cost and disruption. The utility should define when confidence and consequence justify excavation, exploratory work or continued monitoring.
The decision should account for traffic, permitting, customer impact and opportunity to coordinate planned works.
38. Repair confirmation
After repair, the utility should confirm the defect and observe whether the signal and water balance change as expected. A repair that does not explain the alert provides new evidence.
The outcome ledger should retain location, asset, defect, flow estimate, cost, duration and signal response.
39. Feedback loop
Confirmed outcomes should update labels, thresholds, rules and model monitoring. Dismissed alerts should record a reason, not simply disappear.
Feedback quality is an operating capability. Vendor retraining should be auditable and subject to acceptance controls.
40. Performance scorecard
Table 1. Illustrative detection and operating scorecard
| Dimension | Metric | Evidence | Decision use |
|---|---|---|---|
| Detection | Recall by leak class and size | Confirmed events and controlled tests | Missed-event exposure |
| Alert quality | Precision and false discovery | Incident-level adjudication | Analyst and field workload |
| Localisation | Distance or search-area error | Confirmed repair location | Survey and excavation cost |
| Timeliness | Detection-to-triage and repair | System and work-order timestamps | Avoided run-time benefit |
| Reliability | Data availability and model uptime | Platform logs | Operating continuity |
| Economics | Cost per confirmed leak and net benefit | Finance and outcome ledger | Scale or redesign |
41. False-positive cost
False-positive cost includes analyst review, repeat monitoring, field survey, travel, traffic control, customer contact and possible excavation. It also includes opportunity cost when crews defer real work.
The model should calculate cost by alert pathway rather than one average. Most false alerts may end remotely, while a small share drives expensive field activity.
42. False-negative cost
A missed leak can continue losing water, energy and chemicals and may escalate into service interruption or damage. Cost depends on leak rate, duration, location and consequence.
The utility should avoid unsupported catastrophe assumptions. Scenario ranges should separate routine loss from high-consequence events.
43. Localisation error cost
Poor localisation expands survey distance, delays confirmation and can lead to unnecessary excavation. Search-area size is therefore an economic metric.
Models should report error distributions and difficult zones. Average distance can conceal a long tail that drives cost.
44. Value of time
Earlier detection creates value when it shortens leak run time relative to existing practice. The benefit begins only after alert review and action.
End-to-end time should cover event onset, score, analyst decision, field visit, repair and closure. Model latency alone is insufficient.
45. Avoided-water value
Avoided water can be valued at short-run marginal production cost, scarcity value, deferred capacity or tariff value, depending on the decision. These are different concepts.
The business case should state the chosen value and prevent double counting. Cash benefit available for financing may be narrower than economic benefit.
46. Damage and service value
Early action may reduce road, property, outage and emergency costs. Historical incident data can support scenario ranges.
Rare severe events should be probability-weighted and disclosed separately. Insurance treatment and deductibles should be considered.
47. Cost stack
Table 2. Illustrative total-cost stack
| Cost layer | Typical items | Timing | Control |
|---|---|---|---|
| Sensor estate | Devices, installation, power and calibration | Upfront and replacement | Coverage and asset register |
| Connectivity and platform | Communications, storage, integration and support | Recurring | Service levels and usage controls |
| Model operations | Configuration, monitoring, retraining and licences | Recurring and change-driven | Version and acceptance control |
| Human workflow | Analyst triage, surveys and programme management | Alert-driven | Queue and productivity reporting |
| Field action | Confirmation, traffic, excavation and repair | Incident-driven | Work-order and outcome evidence |
| Risk allowance | Failures, cyber response and transition | Contingent | Risk register and reserve |
48. Benefit stack
Benefits can include water and energy saved, lower emergency response, reduced damage, improved continuity, better targeting of renewal and stronger regulatory evidence. Each benefit needs a baseline and owner.
The investment model should distinguish cash, avoided cost, deferred capital and public value. Only realised or contractually funded cash should support debt service.
49. Illustrative sensitivity
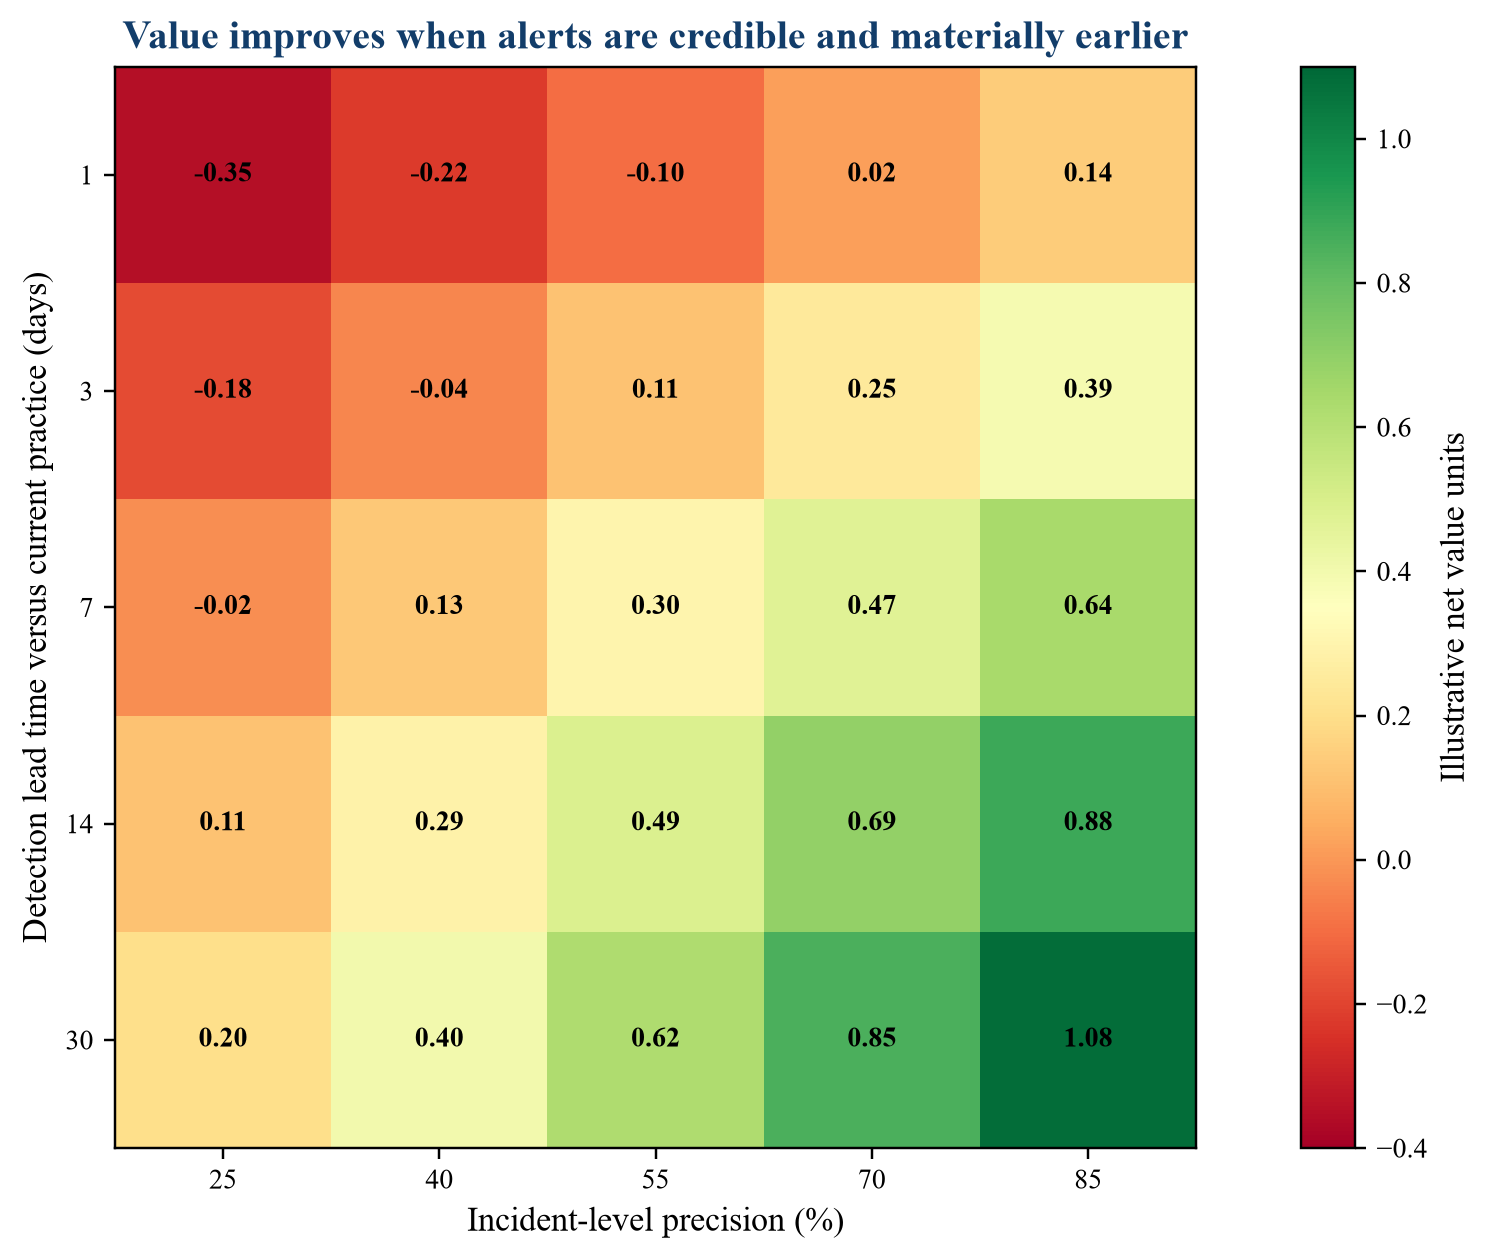
Illustrative values only; this is not a forecast, valuation or vendor comparison.
50. Capex versus service model
The utility can own sensors and platform, subscribe to a managed service or use a hybrid. Ownership affects control, skills, integration, replacement and exit.
The economic comparison should use total cost over the expected life and include transition. A low pilot price may not represent full-scale operations.
51. Financing
Digital infrastructure can be funded from utility capex, operating budgets, innovation funds, grants, vendor finance or broader performance programmes. Financing should match asset life and contract enforceability.
Modelled benefit does not automatically provide repayment cash. Budget authority and payment source should remain explicit.
52. Performance-based payment
Vendor remuneration can link partly to service availability, accepted alerts, verified leaks, lead time or net benefit. The metric should remain within vendor influence and resist gaming.
Payment solely per alert rewards volume. Payment solely per confirmed leak may discourage difficult but valuable events. A balanced structure can combine fixed capability and outcome components.
53. Procurement data room
The data room should include network maps, sensor inventory, telemetry samples, event and repair history, operating logs, existing methods, data quality, security standards and field workflow.
Bidders should receive a common evaluation dataset where feasible. Confidential and critical-infrastructure information needs controlled access.
54. Vendor claim normalization
Claims should state network, pipe, sensor, event prevalence, leak size, noise, training data, test split and evaluation unit. Accuracy without these conditions is insufficient.
The utility should translate every claim into the target operating environment and request reproducible evidence.
55. Pilot design
A pilot should include representative districts, seasons, demand states, pipe materials and sensor conditions. It should run long enough to observe normal variation and genuine or controlled events.
The protocol should be agreed before model tuning and preserve a blind acceptance phase.
56. Shadow mode
In shadow mode, the system produces alerts without directing operations. Analysts compare outputs with current practice and later outcomes.
Shadow mode supports safe threshold calibration and workload measurement. It should have a fixed end and decision gate.
57. Controlled tests
Known releases or hydrant events can test detection and localisation under controlled conditions. They support repeatability but may not represent natural leaks.
The programme should label controlled and natural events separately and avoid pooling them without disclosure.
58. Acceptance criteria
Acceptance should cover field precision, recall, location, latency, data availability, alert duplication, workflow integration, cybersecurity, reporting and economics. Criteria should be measured at incident level.
The contract should state the sample period, confidence treatment and remedy when evidence is insufficient.
59. Scaling gate
Scale should require stable operation, manageable workload, positive downside economics, acceptable cyber risk, maintainable integration and a funded field-response capacity.
A successful technical pilot can still fail the operating or commercial gate.
60. Model drift
Demand, controls, sensors, assets and climate change over time. Drift can alter score distributions and error rates.
Monitoring should compare data, alerts and outcomes by district and season. Threshold or model changes should follow controlled approval.
61. Recalibration and retraining
Recalibration can adjust thresholds or hydraulic parameters; retraining changes learned behaviour. The utility should define triggers, data requirements, testing and rollback.
New versions should be shadow-tested before production. Historical performance should remain reproducible.
62. Cybersecurity
Sensors, gateways, platforms and integrations expand the attack surface. Controls should cover identity, encryption, patching, segmentation, logging, incident response and vendor access.
An automated alert should not control valves or pumps without separate safety and authorisation design.
63. Resilience
The system should degrade safely when communications, sensors or cloud services fail. Operators need fallback methods and visibility of blind areas.
Service-level reporting should distinguish platform uptime from useful data availability.
64. Data rights
Contracts should define ownership, permitted use, retention, export, model-training rights and deletion. The utility should retain its network, event and outcome history.
Exit should include usable data and documentation in non-proprietary formats where required.
65. Risk allocation
Table 3. Illustrative deployment risk matrix
| Risk | Preferred owner | Contract treatment | Management response |
|---|---|---|---|
| Sensor and telemetry failure | Party controlling equipment or service | Availability, repair and data-quality terms | Redundancy and blind-area reporting |
| Incomplete historic labels | Utility for disclosed records; vendor for accepted method | Data caveat and field-validation plan | Conservative acceptance and shadow phase |
| Model performance | Vendor within agreed environment | Incident-level metrics and remedy | Monitoring, rollback and retest |
| Network or operating change | Utility with vendor cooperation | Change notice and recalibration process | Versioned configuration and budget |
| False field action | Shared according to evidence and workflow | Confirmation protocol and liability limits | Approval gate and outcome review |
| Cyber incident | Party controlling the affected layer | Security obligations and response | Segmentation, logging and recovery |
66. Governance
An accountable owner should connect operations, data, IT, cybersecurity, finance, procurement and field teams. The steering group should review outcome and economics, not only vendor activity.
Material thresholds, model versions and scope changes need defined approval rights.
67. Monthly dashboard
The dashboard should show coverage, data quality, alerts, deduplicated incidents, precision, recall where observable, location error, queue age, field actions, confirmed leaks, repair time, water estimate, cost and benefit.
Confidence and missing truth should remain visible. Unverified alerts should not be presented as leaks found.
68. Red flags
Red flags include accuracy without prevalence, synthetic-only validation, no blind field test, alert-level rather than incident-level reporting, missing false-investigation cost, weak sensor coverage, proprietary data lock-in, uncontrolled retraining, no field capacity and benefit claimed without repaired outcomes.
Each requires evidence, redesign, price protection or a decision not to scale.
69. First 180 days
The first six months should define use cases, baseline current practice, map data and sensors, select pilot areas, establish truth and workflow, procure the platform, run shadow mode and agree acceptance.
The investment committee should see real queue, field and cost evidence before approving expansion.
70. Investment-committee pack
The pack should include target leak classes, baseline, sensor and data map, model evidence, pilot protocol, confusion-matrix economics, operating design, cyber review, procurement terms, cost-benefit scenarios, risk matrix and scale gates.
Management estimates should remain identified. Vendor claims should retain source and test conditions.
71. Decision rule
Proceed when the system produces field-credible, timely and economically prioritised incidents; integrates with a funded confirmation-and-repair workflow; preserves data and security; and delivers positive downside value relative to current practice.
Scale should follow verified outcomes. A high model score alone is not an investment case.
72. Calculate base-rate arithmetic before procurement
The preparation team should calculate expected alerts under several event-prevalence and error assumptions. For each network-day or other evaluation unit, the model should estimate true events, detected events, missed events, false alerts and total investigations. This exposes situations where an apparently small false-positive rate overwhelms a rare true-event population.
The arithmetic should use the same unit as the operating workflow. A sensor-record classification rate cannot be translated directly into crew visits without deduplication and incident grouping. The model should also test different districts, because event prevalence and hydraulic observability may differ materially.
73. Calibrate probability and confidence
A model score is not automatically a calibrated probability. Calibration testing should compare predicted confidence with observed event frequency across score bands and operating conditions. Poor calibration can distort ranking, threshold selection and business-case estimates even when classification order remains useful.
The platform should distinguish model confidence, data-quality confidence and localisation confidence. A high model score based on incomplete or failing sensors should not appear equivalent to a well-supported incident. Calibration should be rechecked after model, sensor or network changes.
74. Segment the network economically
Critical transmission mains, dense urban distribution, rural networks and customer service lines have different event consequences, observability and response costs. The utility should segment deployment and select sensing, thresholds and workflows accordingly. A single enterprise average can conceal areas with negative economics or unacceptable blind spots.
The segment model should consider pipe material, diameter, failure history, pressure, consequence, access, repair cost, customer density and current detection practice. Scale should begin where the combination of signal, consequence and response capability creates the strongest evidence-based case.
75. Design the truth process
Every alert should move toward a final truth status: confirmed leak, confirmed non-leak, unresolved, inaccessible, duplicate, sensor fault or legitimate operational event. The status should record evidence and adjudicator. Unresolved cases should remain in performance reporting so the system does not appear more precise by excluding difficult outcomes.
The truth process should also identify leaks discovered outside the alert system. Those events are necessary to estimate recall. A system cannot claim to detect most leaks when the denominator includes only its own alerts.
76. Measure crew capacity
Alert value depends on available analyst, survey and repair capacity. The operating model should forecast hours by alert stage, skill and geography. It should test queue growth after storms, seasonal changes, sensor rollout or threshold adjustment.
Service-level targets should prioritise consequence and age. When capacity is constrained, the system should show which incidents remain unworked and the water or risk exposure associated with delay. A scale decision should fund the field capacity needed to realise the expected benefit.
77. Link alerts to asset renewal
Repeated anomalies, leak clusters and difficult confirmations can reveal assets that require renewal rather than repeated repair. The programme should feed verified evidence into risk-based capital planning. It should also separate an alerting-system benefit from the later renewal benefit to avoid double counting.
The asset team should receive location, defect, pipe, repair, recurrence and uncertainty data in a stable format. Capital-planning decisions should combine this evidence with condition, consequence and whole-life cost. AI therefore supports renewal prioritisation when the outcome ledger remains trustworthy.
78. Quantify data and integration debt
Legacy telemetry, inconsistent identifiers, missing timestamps, duplicated assets and fragmented work orders can require significant remediation. These costs should be estimated before vendor selection and allocated between utility and supplier. A pilot that uses manually curated data may understate full-scale operating cost.
The integration design should define master identifiers for sensor, asset, district, customer and work order. Reconciliation controls should track unmatched records. Data remediation can create independent value, while the AI investment case should still include the expenditure required to sustain it.
79. Establish model-operations discipline
Production operation needs version control, feature definitions, deployment approval, performance monitoring, incident logging, rollback, retraining and retirement. The utility should know which model generated each alert and which data and thresholds applied.
The vendor should document planned and emergency changes. Material updates should pass regression and shadow tests using retained evidence. Model operations should integrate with wider IT service management so that data and application failures receive ownership and resolution rather than remaining invisible analytical issues.
80. Test vendor concentration and exit
A proprietary platform may combine devices, communications, data, model and workflow. This can simplify accountability while increasing switching risk. The contract should define data export, interface documentation, hardware access, transition support and continued operation during exit.
The business case should include replacement and transition cost. It should identify which components can be competed independently and which create lock-in. Long-term value depends on preserving the utility's evidence and operating capability even when the supplier changes.
81. Run an operational red-team exercise
Before acceptance, an independent team should challenge the system with sensor dropout, clock drift, legitimate demand spikes, valve operations, pump changes, telemetry delay, duplicated records, cyber events and leaks in weakly observed areas. The exercise should test alerts, explanations, workflow, escalation and recovery.
The purpose is to identify failure modes and hidden dependencies. Results should lead to configuration, contract, training and contingency changes. Unresolved critical failures should prevent scale until the utility accepts and funds the residual risk.
82. Audit the claimed benefit
Benefits should reconcile from alert to incident, confirmation, repair, post-repair signal, estimated flow, run-time reduction and financial value. Finance and operational owners should approve the method. Sampling can verify work-order and cost accuracy.
The audit should distinguish vendor-attributed, utility-attributed and jointly achieved outcomes. Benefits that cannot be linked to a changed operating decision should not be assigned automatically to the model. The audit trail supports investment review, regulatory reporting and performance payment.
83. Build a downside financial case
The downside case should combine lower event prevalence, weaker precision, smaller leaks, slower field response, higher connectivity cost, earlier sensor replacement and delayed integration. It should also test the cost of a material cyber or transition event without presenting such a scenario as certain.
Management should identify which variables drive value and which can be controlled. The investment may remain justified through critical-risk reduction even when direct cash payback is weak; that rationale should be explicit and separately approved.
84. Create benefits-realisation gates
The programme should have gates for technical readiness, operating adoption, verified outcome, economic value and scale. Each gate should state evidence, owner and decision. Passing an earlier gate should not predetermine the next.
Benefits-realisation reviews should compare current performance with the approved baseline and counterfactual. They should identify value lost through queue delay, field constraints or incomplete repair. Corrective actions should have dates and owners. Funding for later deployment should follow demonstrated capability rather than sunk-cost momentum.
85. Preserve human accountability
The model can prioritise evidence; authorised utility personnel remain responsible for operational and public-service decisions. Roles should be clear for alert dismissal, field dispatch, isolation, excavation, customer communication and repair. Critical decisions should retain an audit trail.
Staff should understand model limits and common failure modes. Training should use real local cases and test decision quality. Overreliance can cause missed contextual information; habitual dismissal can erase model value. Governance should support disciplined challenge in both directions.
86. Conclusion
AI can improve leak detection when sensors, data, models and field operations form one controlled system. False-positive economics brings discipline to threshold, sensor, workflow and procurement decisions. It also exposes the operational cost hidden by headline accuracy.
The strongest programme measures incident-level precision, recall, localisation, timeliness and net benefit in the target network. It learns from every field outcome, monitors drift and scales only when verified repairs support the case.
References
- Kwon, D. et al. Exploration of deep learning leak detection model across multiple smart water distribution systems: Detectable leak sizes with AMI meters. Water Research X, 2025. https://doi.org/10.1016/j.wroa.2025.100332
- Ranganathan, S., Vinothkumar, N. and Muthuramalingam, E. Benchmarking Diverse Learning Architectures for Leak Detection and Localization in Water Distribution Systems. Journal of Water Process Engineering, 2026. https://doi.org/10.1016/j.jwpe.2026.110114
- Goulet, J.-A., Coutu, S. and Smith, I.F.C. Model falsification diagnosis and sensor placement for leak detection in pressurized pipe networks. Advanced Engineering Informatics, 2013. https://doi.org/10.1016/j.aei.2013.01.001
- Explainable simulation-to-field transfer learning for transient-based leak detection in water distribution networks. Water Research, 2026. https://doi.org/10.1016/j.watres.2026.126464
- United States Environmental Protection Agency. Distribution System Water Quality Monitoring: Sensor Technology Evaluation Methodology and Results. https://www.epa.gov/sites/production/files/2015-06/documents/distribution_system_water_quality_monitoring_sensor_technology_evaluation_methodology_results.pdf
- Ofwat. Innovation Fund Annual Report 2025. https://www.ofwat.gov.uk/wp-content/uploads/2025/07/Ofwat-Innovation-Fund-Annual-report-2025-v5.pdf
- Ofwat. Green energy solutions and CCTV leak prevention among winning water innovations. https://www.ofwat.gov.uk/green-energy-solutions-and-cctv-leak-prevention-among-winning-water-innovations/
- Standardization and Benchmarking of Datasets and Evaluation Protocols for Machine Learning-Based Water Leak Detection: A Systematic Review. Water, 2026. https://doi.org/10.3390/w18182267
- SIAM: An open-source framework for identifying anomalies in water distribution networks. Software Impacts, 2026. https://doi.org/10.1016/j.simpa.2026.100842
- Water leak detection using self-supervised time series classification. Information Sciences, 2021. https://doi.org/10.1016/j.ins.2021.06.015
- Water Pipeline Leakage Detection Based on Machine Learning and Wireless Sensor Networks. Sensors, 2019. https://doi.org/10.3390/s19235086
- Detection of Water Leaks in Suburban Distribution Mains with Lift and Shift Vibro-Acoustic Sensors. Sensors, 2022. https://doi.org/10.3390/s22166066
- Leak Detection and Localization Using Models: Field Results. Procedia Engineering, 2014. https://doi.org/10.1016/j.proeng.2014.02.128
- International Water Association. Performance-Based Contracts for Non-Revenue Water Management. https://www.iwa-network.org/our-work/performance-based-contracts-for-non-revenue-water-market-development
- World Bank. Water Loss Reduction Performance Based Contract Guidance Note. 2025. https://documents1.worldbank.org/curated/en/099157411052511694/pdf/IDU-ddae29b5-2722-4a36-9992-5ac7789d6bb1.pdf
- World Bank PPP Resource Center. Performance-Based Contracting Tools for Non-Revenue Water Reduction. https://ppp.worldbank.org/water-and-sanitation/performance-based-contracting-tools-non-revenue-water-reduction-tools-resources
About the Author
Chennakeshav (CK) is a corporate finance and investment banking executive with 25+ years of global experience in deal origination, structuring and execution across M&A, growth capital and corporate strategy. He has led value-creation mandates for founders, corporates and funds — bridging the boardroom view to hands-on execution and close.
His career spans Morgan Stanley, HSBC, Lloyds Banking Group, EWEC, ADQ portfolio companies and Emirates Growth Fund, across TMT, real estate, fintech, deeptech, cleantech, infrastructure and energy. He has partnered with C-suite leaders, private equity and venture funds, sovereign wealth funds and family offices to finance complex fund raises and scale-up ventures, and has led M&A due diligence, post-merger integration and business-transformation initiatives to create value.
At Matchpoint Partners he is Managing Partner, leading the firm's corporate finance, M&A and capital-raising practice. He holds an MBA from London Business School, an engineering degree from VTU and a Master of Laws (LLM, in progress) from UCL London.
An active start-up mentor, CK mentors at Techstars, DIFC FinTech Hive, Startup Grind, Founder Institute and IN5, serves as Entrepreneur Mentor in Residence (EMiR) at London Business School, and judges the Entrepreneurship World Cup.
LinkedIn: https://www.linkedin.com/in/ckadya/
Profile: https://www.matchpoint-partners.com/team/ck-adya.html
