
1. The investment decision is a corridor, not a plant
An ammonia project is often introduced through its renewable resource, electrolyser capacity and anticipated plant-gate cost. Those elements describe production potential. They do not establish the cost, timing or reliability of a tonne delivered to a qualifying buyer.
The investable unit is the complete corridor. It begins with renewable power and water, passes through hydrogen production and ammonia synthesis, and continues through storage, loading, shipping, destination handling, certification and the buyer's conversion or consumption process. Each interface can add capital, operating cost, delay, loss, credit exposure and regulatory risk.
The International Energy Agency reports that trade would underpin more than 40 per cent of announced low-emissions hydrogen volumes by 2030 if all projects materialised. Less than 8 per cent of that trade-oriented volume is operating, under construction or backed by committed investment [1]. The gap demonstrates that announced export potential and financeable corridor capacity are different conditions.
The practical question is therefore not which region can quote the lowest production cost. It is which corridor can deliver the required molecule, specification, evidence and schedule at an acceptable risk-adjusted cost.
2. Why ammonia leads traded hydrogen derivatives
Ammonia combines an established global market with storage, terminal and shipping experience. It is already used in fertilisers and chemicals, and it can serve as a maritime fuel or a hydrogen carrier. The IEA identifies long-term bilateral contracts as the dominant structure in early low-emissions hydrogen trade, particularly for ammonia and ammonia-derived fertilisers [1].
Existing infrastructure creates a foundation rather than a complete green-ammonia corridor. Around 170 ammonia terminals operate globally, according to the IEA [1]. A terminal designed for conventional ammonia may still require changes to capacity, loading rates, segregation, safety systems, certification records and operating schedules. A new export project may also require dedicated renewable power, water and synthesis infrastructure far from the existing terminal.
Ammonia's value depends on how the buyer will use it. Direct consumption avoids reconversion. Maritime use adds bunkering, vessel and fuel-safety interfaces. Cracking ammonia back into hydrogen adds capital, energy loss, purification and destination-utilisation risk. A corridor ranking that ignores the end use can select the wrong project.
3. Delivered compliant ammonia is the governing metric
The comparison metric used in this paper is delivered compliant ammonia at the buyer's gate. The word delivered captures the physical chain. The word compliant captures carbon accounting, renewable-power rules, chain of custody, product specification and buyer eligibility. The buyer's gate fixes the boundary at which cost and performance transfer.
A simplified bridge is:
Delivered compliant cost = renewable power + water + electrolysis + nitrogen and synthesis + storage and loading + marine transport + destination handling + certification and compliance + financing and risk allowances.
This formula is an analytical structure, not an observed market price. Each component changes with scale, location, utilisation, financing, public support and contract allocation. The model should also recognise loss and working capital. Hydrogen conversion consumes electricity; synthesis and refrigeration consume energy; storage and shipping can create boil-off or handling losses; and long voyages tie up inventory.
The result should be compared with the buyer's maximum acceptable cost. The IEA defines that concept by asking how much can be spent on hydrogen feedstock while the total levelised cost of the low-emissions product remains comparable with the incumbent route [3]. This buyer-specific ceiling is more useful than a universal supply ranking.
4. Three buyer routes create three different maps
The first route is direct ammonia consumption in fertiliser, chemicals or another industrial process. The corridor delivers a product the buyer can use without cracking. Product purity, carbon intensity, delivery schedule and feedstock integration drive value.
The second route is ammonia as maritime fuel. The corridor must include bunkering infrastructure, fuel availability at relevant ports, vessel readiness, safety procedures and a credible emissions-accounting pathway. A low production cost provides limited value when the vessel cannot bunker at the required ports or the fuel cannot satisfy the applicable regime.
The third route is ammonia as a carrier for pure hydrogen. The destination requires storage, cracking, purification and often compression or pipeline delivery. The IEA estimates that shipping pure hydrogen through conversion and reconversion routes implies minimum costs around USD 2 per kilogram of hydrogen and energy use above 10 kilowatt-hours per kilogram, more than 30 per cent of hydrogen's energy content [1]. That burden can reverse the ranking of distant production locations.
The same origin can therefore be competitive for direct ammonia and unattractive for delivered pure hydrogen. Portfolio decisions should preserve this distinction throughout screening, valuation and contracting.
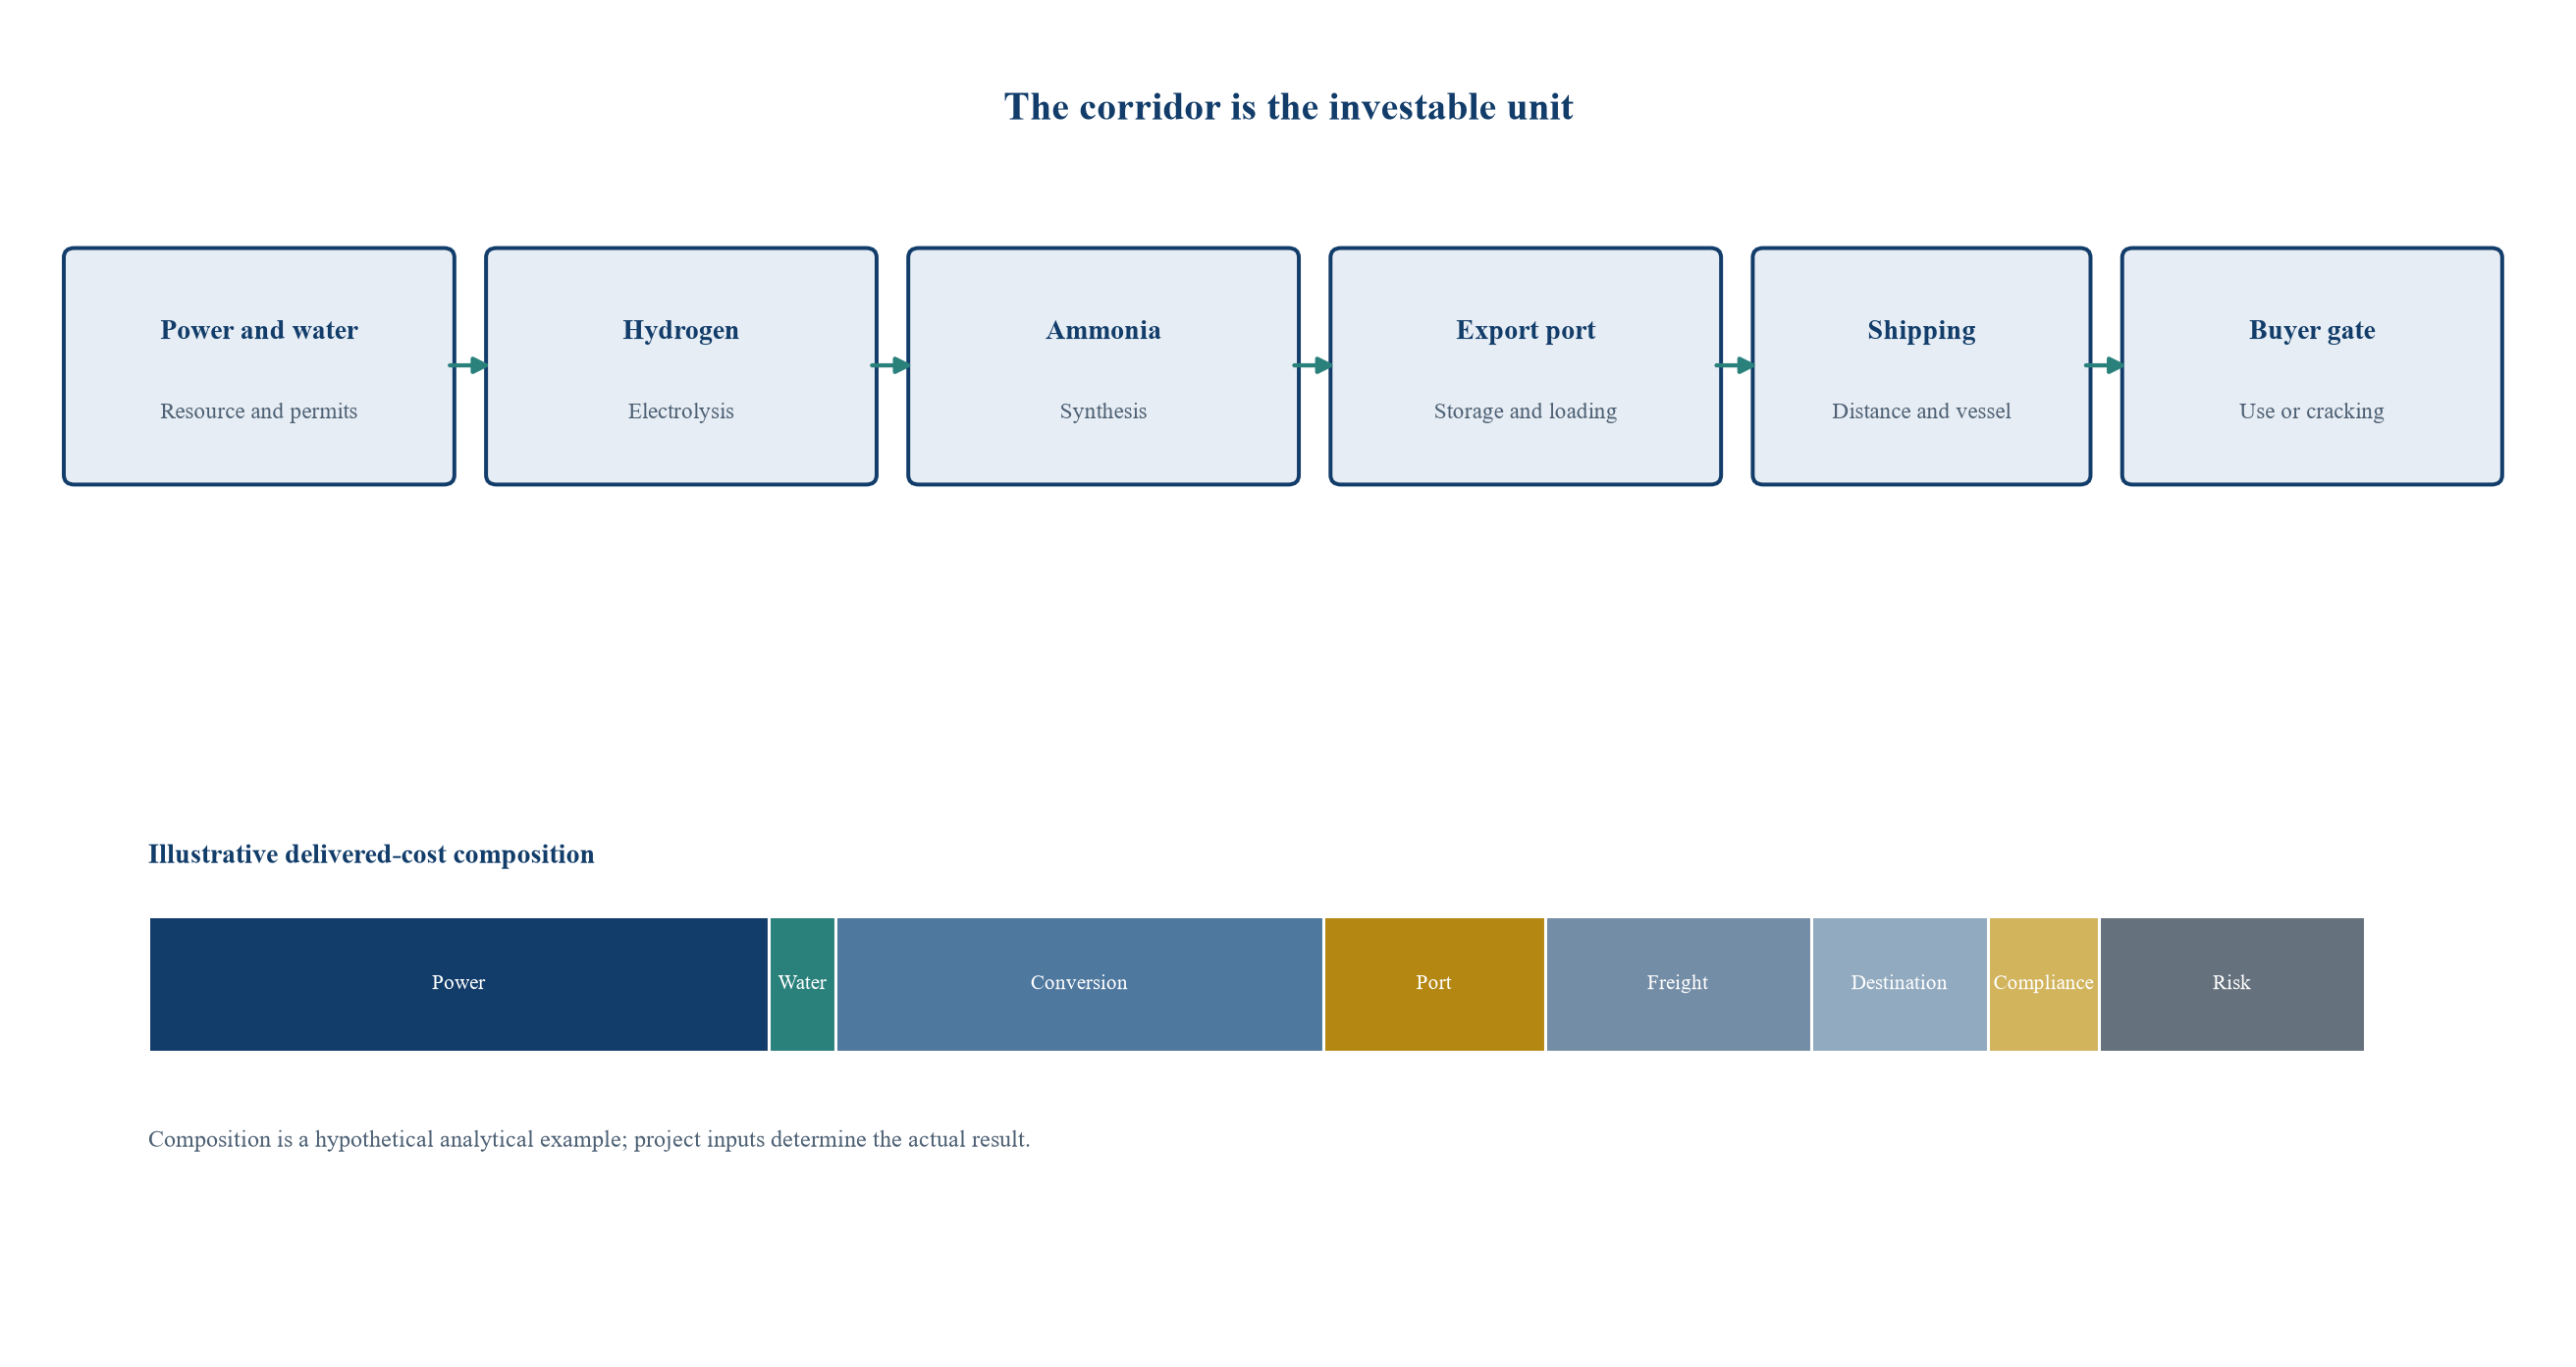
Every interface adds cost, evidence requirements and completion risk. The buyer route determines whether destination cracking is required.
5. Readiness must be measured across the chain
An export corridor cannot be more commercially ready than its least-ready critical link. Electrolysers and conventional ammonia synthesis are established at different scales, while integrated renewable-ammonia operations, dedicated green terminals, large-scale bunkering and ammonia cracking remain at different stages of deployment.
Technology readiness should be separated from commercial readiness. A component can be technically proven while its warranty, performance guarantee, replacement supply chain or operating record remains inadequate for project-finance assumptions. A terminal can handle ammonia while lacking contracted capacity or the modification plan required by the new project. A certification rule can be published while the audit, registry and cross-border recognition process remains immature.
The readiness assessment should assign an evidence threshold to each link: operating reference, construction contract, performance guarantee, permit, allocated land, grid or power connection, port agreement, shipping capacity, destination interface and accepted certification pathway. Announced intent should remain outside the base completion case.
6. A technology and commercial-readiness curve
Renewable generation is commercially mature, although profile and connection risk remain location-specific. Electrolysis is operating at industrial scale, while rapid changes in manufacturers and equipment pricing require bankable warranty and supplier-credit assessment. Ammonia synthesis is mature, but flexible operation with variable renewable power can require storage or operating compromises.
Conventional ammonia storage and shipping are established. Green-ammonia segregation, traceability and large new terminal capacity require corridor-specific evidence. Direct industrial use is the shortest commercial route because it removes reconversion. Maritime fuel use depends on vessels, bunkering and regulatory acceptance. Large-scale destination cracking carries the greatest additional conversion and integration burden among the three routes considered.
The curve should influence capital staging. Mature components can enter an early engineering package. Less mature interfaces should be tested through pilots, reserved capacity, performance guarantees and decision gates. A sponsor that commits full plant scale before resolving the least-ready link converts uncertainty into stranded-capital exposure.
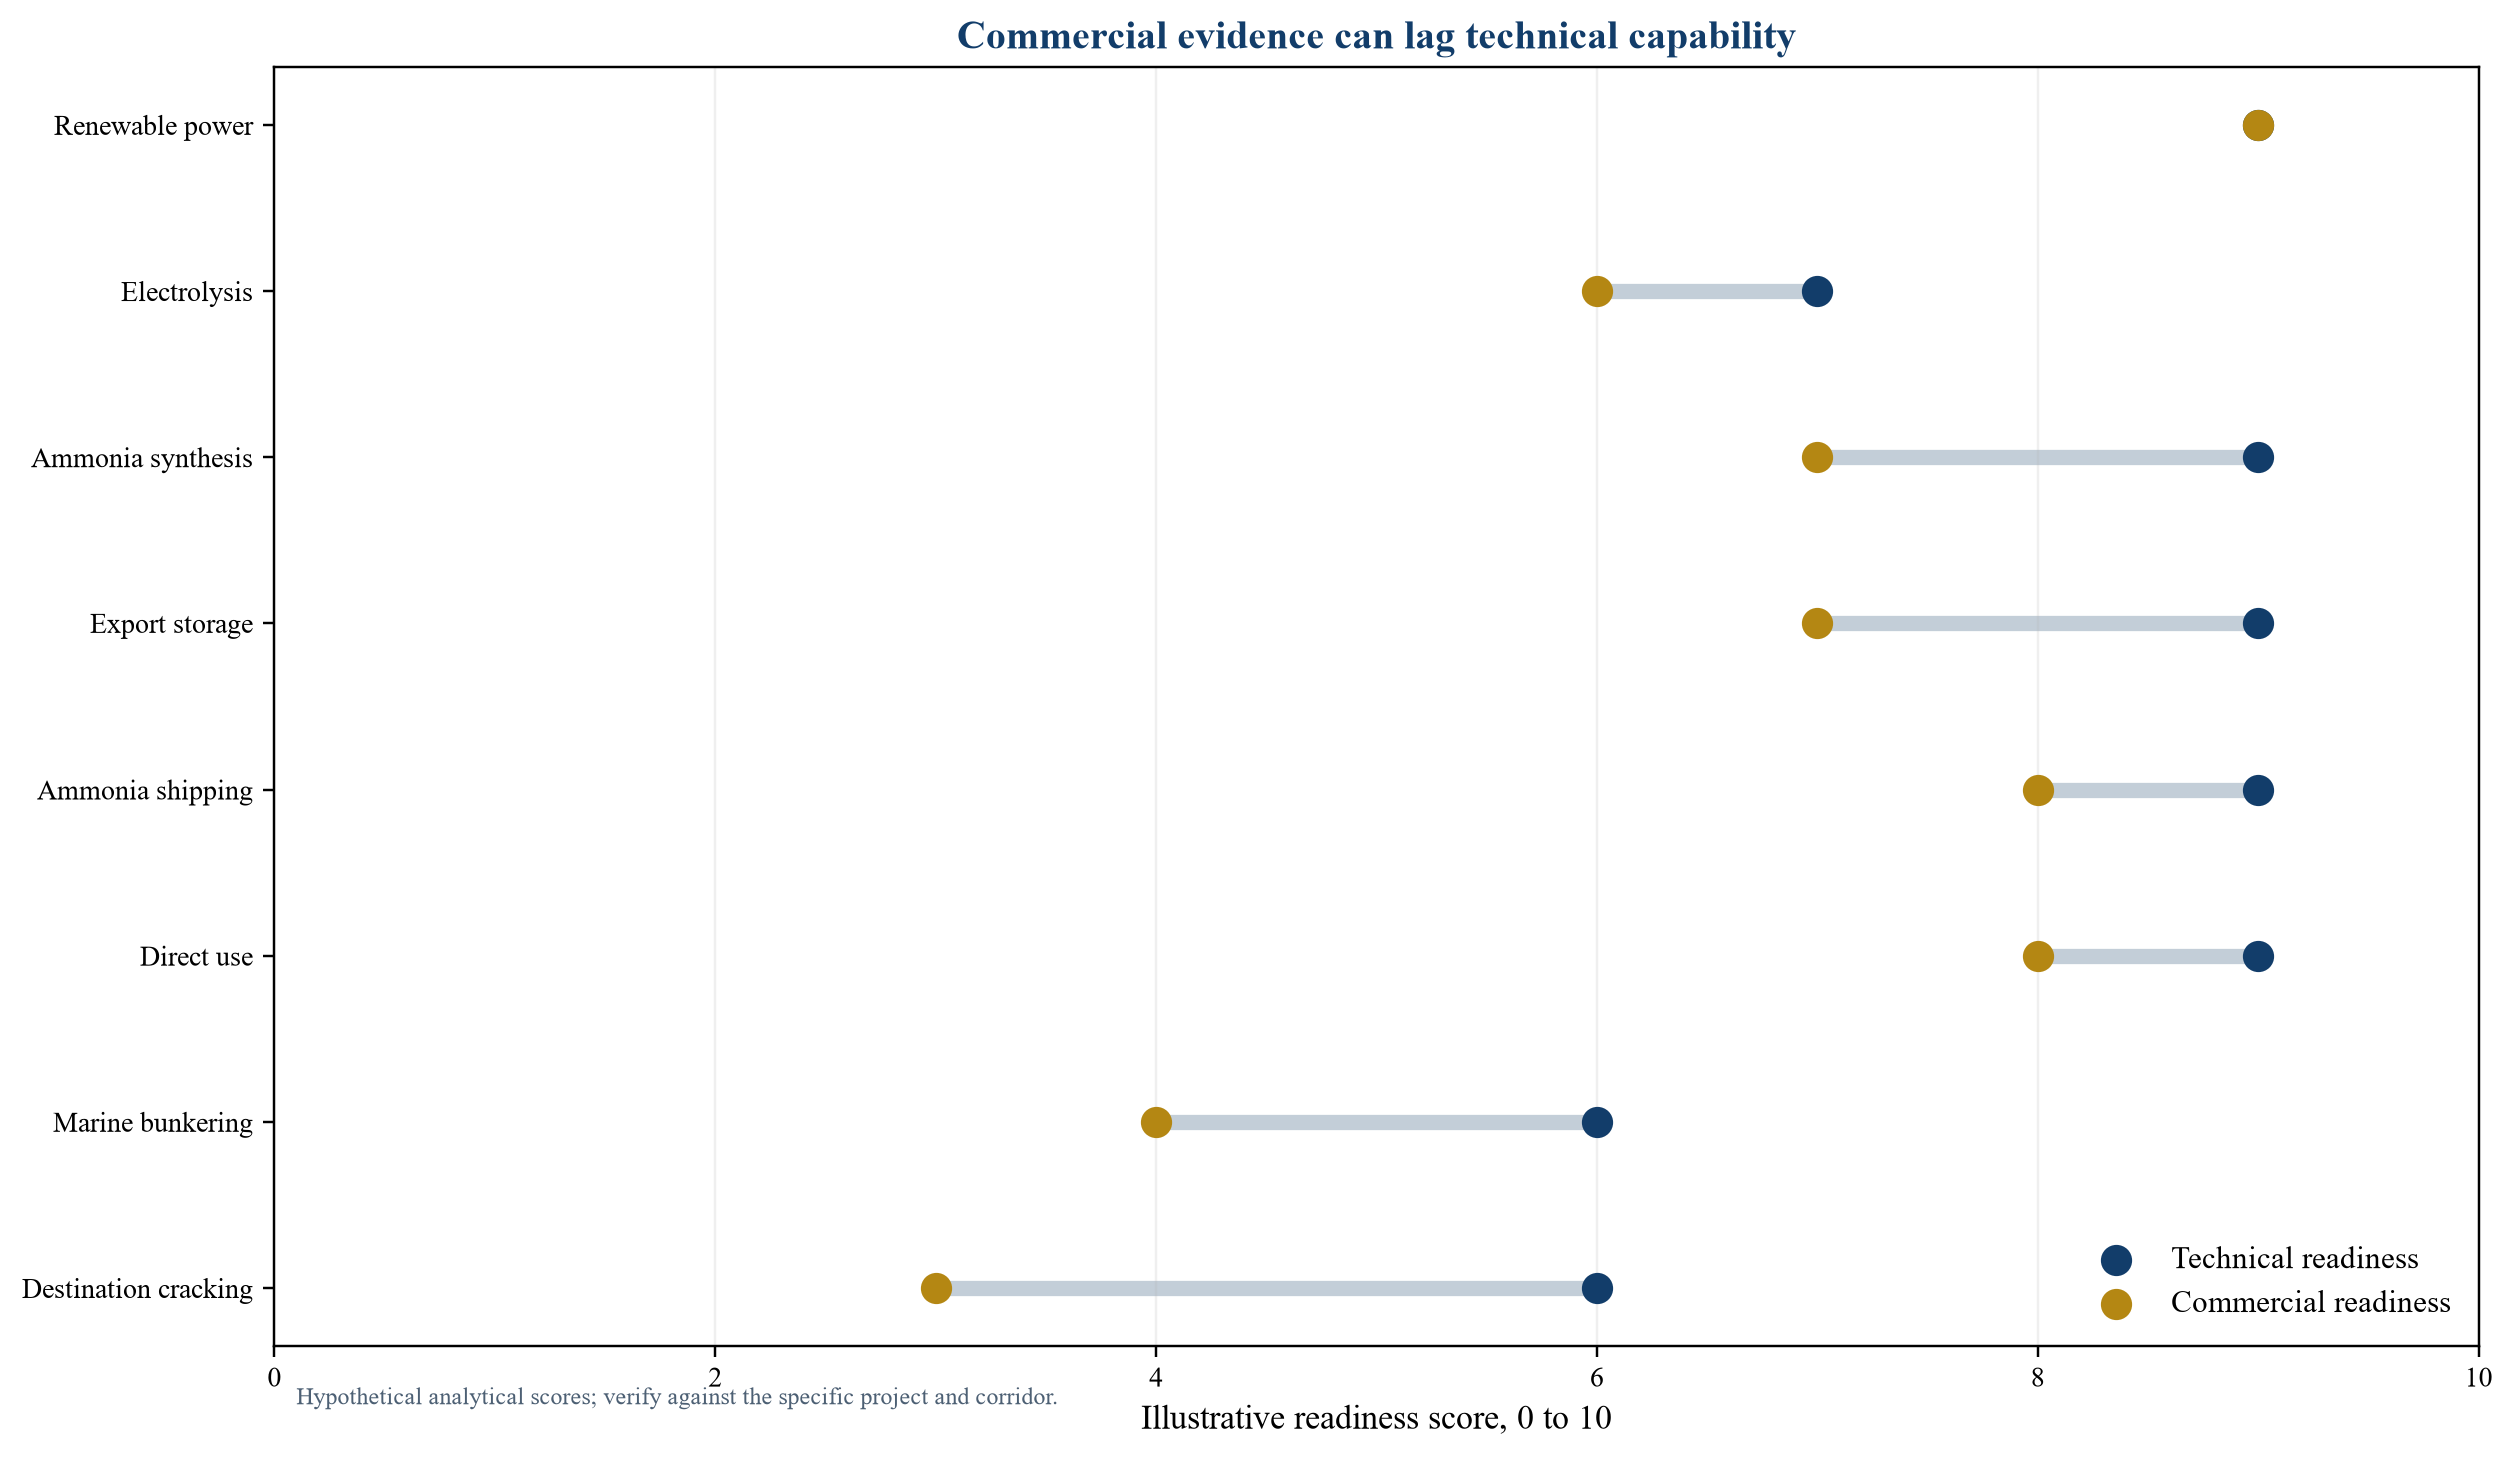
Scores are hypothetical analytical assessments used to illustrate sequencing. Each project requires evidence-based scoring before investment.
7. GCC corridor: established product experience and coordinated scale
The GCC enters the comparison with established energy, petrochemical and ammonia capabilities, deep-water ports and experience delivering large industrial projects. The Middle East accounts for more than one quarter of global ammonia trade, according to the IEA [4]. This base can support operating capability, contractor familiarity and buyer confidence.
Oman's approach demonstrates coordinated development. Hydrom's auction framework allocates land and organises projects in Duqm and Salalah, including pathways oriented to ammonia export and domestic steel [5]. The Oman Green Hydrogen Strategy describes a state-coordinated model for land, auctions and common infrastructure [6]. Round 3 offers a Duqm block of up to 300 square kilometres and permits phased proposals and surplus-power flexibility [5].
Coordination does not remove shared-infrastructure risk. Projects can depend on transmission, desalination, pipelines, common storage, port expansion and export scheduling delivered by different entities. Lenders need aligned completion dates, capacity rights, tariffs, step-in arrangements and remedies. The corridor should be valued against the slowest critical shared asset rather than the sponsor's plant schedule.
8. GCC corridor: resilience and route concentration
GCC projects can access European and Asian routes, yet the exact loading port determines maritime exposure. The IEA's 2026 review describes how disruption around the Strait of Hormuz affected hydrogen-derived products and fertiliser markets [4]. That evidence supports a corridor-resilience test covering port location, alternative routes, inventory, insurance, shipping availability and buyer diversification.
Resilience should not be reduced to a geopolitical premium in the discount rate. It affects physical performance and contract design. A buyer may require minimum destination inventory, alternative loading rights or supply from more than one origin. A project may need larger storage or working capital. Insurers and lenders may constrain permitted routes or require additional cover.
Oman's official announcement of a direct Duqm-to-Amsterdam corridor concept illustrates the strategic effort to link production and destination infrastructure [8]. The announcement establishes coordination intent, not operating capacity. Investment approval should depend on executed terminal, shipping, certification and offtake arrangements.
9. India corridor: domestic anchor demand and export optionality
India's National Green Hydrogen Mission aims to make the country a global hub for production, use and export [9]. This dual objective is important. Domestic refining and fertiliser demand can anchor early production, while ports can create export optionality. A project with a credible domestic fallback may have a different risk profile from a pure export project.
Official SIGHT programme materials identify 450,000 tonnes per annum of awarded production capacity across listed bidders, with scheduled commissioning in 2028 [11]. Mission progress materials also report SECI price discovery for 724,000 tonnes per annum of green-ammonia supply to fertiliser units [12]. These awards and procurement outcomes provide market-formation evidence. They do not establish operating performance or export availability.
The financing case should examine whether domestic commitments consume output that the export model assumes. It should also test transmission access, renewable matching, port storage, foreign-currency revenue, domestic-currency costs and the certification standard required by the destination buyer.
10. India corridor: policy support and compliance translation
The stated 25-year interstate transmission-charge exemption for eligible plants commissioned by 31 December 2030 can affect renewable-power economics [12]. Its value depends on eligibility, commissioning timing, power-routing assumptions and the durability of the applicable framework. The model should show the corridor with and without the benefit.
Export compliance may require a different evidence architecture from domestic procurement. Power sourcing, temporal correlation, carbon accounting and chain of custody must satisfy the buyer's jurisdiction. A tonne eligible under one programme is not automatically eligible under another.
India's port network creates several possible corridors rather than a single national case. Distance to renewable resources, grid congestion, industrial demand, storage and destination routes differ by port. Project comparison should be port-specific and contract-specific, with national policy treated as a common layer rather than a substitute for local diligence.
11. Australia corridor: resource depth and policy architecture
Australia offers large renewable-resource areas and proximity to Asian markets. Its Guarantee of Origin scheme commenced on 3 November 2025, according to the responsible department [13]. The Hydrogen Production Tax Incentive provides A$2 per kilogram for eligible renewable hydrogen for up to ten years within the programme period [13]. The 2025 Annual Climate Change Statement records that the incentive was legislated in February 2025 [15].
Hydrogen Headstart addresses the gap between production cost and sale price. ARENA's 2026 Round 2 page states a revised A$1 billion budget and identifies shortlisted projects that include ammonia and alternative-fuel pathways, subject to detailed due diligence [16]. Public support can improve project cash flow, but the financing case still needs buyer credit, port capacity, completion alignment and post-support economics.
The support should be modelled as a separate cash-flow layer with eligibility, duration, verification, cap and change-risk assumptions. It should not be embedded invisibly in a headline production cost.
12. Australia corridor: distance, scale and capital discipline
Long-distance shipping can be acceptable for direct ammonia use when production and support advantages exceed freight and working-capital costs. The same distance becomes more burdensome when destination cracking is required. Vessel round-trip time, port turnaround and inventory increase the capital employed in each delivered tonne.
Large projects can spread fixed costs and justify dedicated infrastructure. They also increase construction, offtake and concentration exposure. A project designed around a single very large buyer can become difficult to finance if that buyer's facility, policy or market changes. A modular or phased design can reduce initial exposure while sacrificing some scale economy.
Australia's corridor case should therefore distinguish resource potential from executable scale. Land, transmission, water, equipment logistics, workforce, port works and buyer ramp-up need a coordinated critical path. Public awards and shortlisting are relevant milestones; they do not remove the requirement for a complete project-finance package.
13. North Africa corridor: proximity to Europe and early-stage finance
North Africa combines renewable resources, existing industrial demand and proximity to Europe. The IEA reports that African hydrogen use reached 3.1 million tonnes in 2024, with ammonia production representing nearly three quarters of demand [17]. It also reports that only 6,000 tonnes of low-emissions hydrogen were being produced and only one of 31 projects announced for 2030 had reached final investment decision [17].
That contrast is central to valuation. The region can have strong resource and location attributes while projects remain exposed to high financing cost, infrastructure gaps and early-stage execution. More than 80 per cent of announced African ammonia capacity is intended for export, according to the IEA [17]. Export concentration can leave projects dependent on foreign regulation, buyers and currency while domestic fertiliser and industrial needs remain material.
The IEA identifies blended finance, offtake guarantees, credit guarantees, insurance, infrastructure planning and certification as near-term enablers [17]. These instruments should be evaluated by the risk they absorb, their duration and their enforceability.
14. Morocco: corridor optionality and domestic supply security
Morocco's official portal reported in September 2025 that the preliminary phase of Chbika 1 had been completed and advanced studies were the next step [18]. It also reported land reservation for five investors covering six Morocco Offer projects, with an announced aggregate cost of MAD 319 billion [18]. These are development milestones rather than operating evidence.
Morocco's position also illustrates the interaction between export ambition and domestic resilience. The IEA reports that Morocco imports all of its ammonia demand and sourced 40 per cent from the Middle East in the cited assessment [4]. Domestic low-emissions ammonia could therefore reduce import exposure as well as support exports.
An export project should be tested against domestic offtake, port routing and European compliance. A domestic anchor may reduce volume risk, while export pricing can support scale. Contract allocation should prevent the same tonne being assumed simultaneously in domestic and export base cases.
15. Egypt: industrial cluster, procurement evidence and status discipline
Egypt's Ain Sokhna cluster offers an example of production linked to existing ammonia and port infrastructure. The European Investment Bank describes an approved project involving a 100 megawatt electrolyser supplying an ammonia plant in Ain Sokhna, with the objective of producing RFNBO-compliant output for Europe [19]. The EIB also states that pre-signature project information is indicative.
SCZONE reported a EUR 397 million H2Global contract for renewable-ammonia supply to Europe, with potential supply beginning at up to 19,500 tonnes in 2027 and cumulative growth to up to 397,000 tonnes by 2033 at EUR 1,000 per tonne [20]. This provides a visible example of demand aggregation and price discovery. It should be cited as a contract and potential delivery schedule, not as delivered volume.
The Egypt case highlights how an industrial cluster, public procurement and European compliance can combine. Financing still requires executed construction, power, port, shipping, certification and buyer arrangements.
Table 1. Comparative corridor assessment
| Corridor | Structural strengths | Principal constraints | Highest-value evidence before commitment |
|---|---|---|---|
| GCC and Oman | Ammonia and industrial experience; coordinated land programmes; major ports; access to Europe and Asia | Shared-infrastructure alignment; route concentration; water and power integration; export-buyer dependence | Executed common-infrastructure agreements, port capacity, route resilience and firm offtake |
| India | Domestic fertiliser and refining demand; national mission; procurement; multiple ports | Domestic versus export allocation; port-specific interfaces; compliance translation; currency mismatch | Award terms, domestic anchor contracts, destination certification and port-specific logistics |
| Australia | Renewable resources; Guarantee of Origin; production incentive; Asian-market access | Distance; capital intensity; workforce and transmission; large-project concentration | Support eligibility, staged capital plan, port completion and contracted shipping and offtake |
| North Africa | Proximity to Europe; industrial clusters; domestic fertiliser opportunity; emerging public programmes | High cost of capital; project maturity; shared infrastructure; domestic-development trade-offs | Blended-finance package, permits, domestic/export allocation, EU compliance and port readiness |
The assessment summarises evidenced structural attributes. Project-level diligence can produce a different result.
16. Port readiness is more than available waterfront
Port diligence should cover land, storage, loading rate, berth depth, vessel compatibility, safety separation, hazardous-material procedures, utilities, firefighting, customs, scheduling and expansion rights. Existing ammonia handling can shorten development, while competing users and modification requirements can reduce effective capacity.
The project needs a binding capacity right with a tariff, availability standard and remedy. A memorandum or general port strategy does not create a financeable interface. Completion should be aligned with plant ramp-up and shipping contracts. Delay at the port can strand an otherwise complete plant.
Destination infrastructure deserves equal attention. A receiving terminal needs storage, unloading, onward transport and any cracking or bunkering system. Buyer payment should be linked to a defined delivery point and measurement method. The sponsor should understand which party bears demurrage, off-specification product, congestion and destination outage.
17. Shipping converts geography into cash-flow risk
Freight cost reflects distance, vessel availability, fuel, charter terms, insurance, canal or route charges and turnaround. Working capital reflects the time between loading and payment. A longer route can therefore affect both operating cost and financing need.
Shipping also determines delivery reliability. A corridor reliant on spot chartering can face vessel scarcity or price spikes. A long-term charter provides capacity while creating fixed obligations when production or demand is delayed. Contract tenor should align with plant ramp-up and offtake.
The downside case should include route diversion, port closure, vessel delay and insurance changes. These should be modelled as physical and liquidity effects rather than a generic risk premium. Inventory, alternative ports and diversified supply can reduce exposure, subject to their own cost.
18. Certification can create or destroy the premium
European renewable-hydrogen rules define conditions under which hydrogen and hydrogen-based fuels qualify as renewable fuels of non-biological origin [22, 23]. Compliance can affect buyer eligibility, policy value and the green premium. The corridor must preserve evidence from renewable power through production and delivery.
The diligence scope should cover the applicable standard, additionality, temporal and geographic correlation, greenhouse-gas methodology, metering, registry, chain of custody, verification body and recognition at destination. A production certificate is insufficient when transport, blending or storage breaks traceability.
Certification should appear in engineering, operating procedures and contracts. The offtake should allocate the risk of a regulatory change or failed audit. The financing model should distinguish compliant output, remediable output and product sold without the intended premium.
19. Public support changes cash flow, not physical delivery
Production incentives, grants, contracts for difference and demand auctions can narrow the gap between cost and buyer willingness to pay. They can also impose eligibility, reporting, volume, time and budget limits. The support instrument should be analysed as a contract with its own counterparty and performance conditions.
Australia's production incentive, India's procurement measures and the H2Global auction illustrate different mechanisms [12, 13, 20, 24]. A production incentive rewards eligible output. Procurement can aggregate or anchor demand. An intermediary auction can bridge producer and buyer contracts. Each instrument allocates price, volume and counterparty risk differently.
The base case should include support only after legal effectiveness, eligibility and payment mechanics are verified. It should model termination, delayed commissioning and output below the supported quantity. The project should also show economics after support expires. An asset that cannot compete or refinance without a replacement subsidy has residual-value risk.
20. Offtake quality determines financeable scale
A buyer expression of interest can support development but does not support debt service. Financeable scale follows enforceable minimum volume, buyer credit, price, tenor, delivery rules, termination compensation and lender rights.
The IEA reports 1.7 million tonnes per annum of new low-emissions hydrogen offtake agreements in 2025, while only one fifth of the new agreements were firm [2]. Sponsors should classify every commitment as announced, preliminary, conditional, firm or operating. The financial model should use only the portion that passes the relevant evidence threshold.
A portfolio of buyers can reduce concentration, provided contracts align on specification, delivery, scheduling and certification. Multiple incompatible contracts can increase operating complexity. The corridor should be sized to the contracted downside case, with uncontracted capacity treated as upside or phased capacity.
21. Contract architecture should follow the physical chain
The production company may contract separately for power, water, engineering, port capacity, shipping, certification and offtake. The obligations should form a coherent chain. If the offtake requires delivery by a fixed date, upstream contracts need schedules and remedies capable of supporting that promise.
Completion tests should cover integrated operation, product specification, renewable-power evidence, storage and loading. Delay damages should reflect the party controlling the relevant interface. Force-majeure definitions should avoid leaving one contract excused while another continues to charge.
Lenders require assignment, notice, cure and step-in rights across material agreements. Shared infrastructure may sit outside the project security package; direct agreements and capacity rights become essential. Contract mapping should show each obligation, counterparty, security, termination payment and replacement path.
22. Currency and index design can move the corridor ranking
Export revenue may be denominated in euros, dollars or another buyer currency. Power, labour, construction and local services may be paid in local currency. Equipment and debt may add further currencies. The corridor comparison should show transaction and translation exposure rather than assuming a single currency.
Price formulas can reference energy, fertiliser, carbon or inflation indices. The chosen index should reflect the buyer's alternative and the producer's cost. A mismatch creates basis risk. A fixed price transfers input volatility to the producer. A cost pass-through transfers it to the buyer and can weaken demand certainty.
Hedging can reduce exposure over available tenors, but it adds cost, collateral and counterparty requirements. Public support may be denominated differently from offtake. The model should identify the natural hedge, residual exposure and liquidity needed under adverse currency and commodity moves.
23. Cost of capital can outweigh resource advantage
Low-cost renewable electricity can be offset by a high cost of capital, long development period or weak completion package. Hydrogen and ammonia projects require substantial upfront capital before stable revenue. Financing cost compounds during construction and delay.
The IEA identifies financing cost as a major barrier in Africa and recommends blended finance, guarantees and insurance [17]. These instruments create value when they absorb a defined risk that private capital cannot price efficiently. A concessional tranche can lengthen tenor or reduce weighted cost. A guarantee can improve credit quality. Political-risk insurance can protect specified events.
The corridor comparison should calculate the benefit and conditions of each instrument. Concessional finance tied to domestic infrastructure, employment or access creates obligations that belong in the investment case. A nominally cheaper financing package can become less attractive when conditions delay closing or constrain operations.
24. Hypothetical cost-performance benchmark
The benchmark below is designed to test the method. It does not estimate any named project. Each corridor begins with a hypothetical plant-gate ammonia cost and adds port, shipping, destination, compliance and risk allowances. The values are indices rather than market prices, with the lowest direct-use delivered cost normalised to 100.
In the direct-use case, proximity, port readiness and financing can offset production differences. In the maritime-fuel case, bunkering availability and compliance receive higher weight. In the cracking case, destination conversion and energy loss become large common burdens, while shipping distance and power value affect the relative result.
The benchmark should be replaced with project-specific assumptions before an investment decision. Its purpose is to show how a ranking changes when the analytical boundary moves from the plant gate to the buyer's gate.
Table 2. Hypothetical delivered-cost index by buyer route
| Corridor | Plant-gate index | Direct industrial use | Maritime-fuel route | Cracked-hydrogen route | Primary sensitivity |
|---|---|---|---|---|---|
| GCC and Oman | 72 | 100 | 108 | 151 | Shared infrastructure, route resilience and destination conversion |
| India | 78 | 106 | 116 | 158 | Domestic allocation, port interface and destination compliance |
| Australia | 70 | 112 | 119 | 168 | Shipping distance, capital intensity and destination conversion |
| North Africa | 76 | 102 | 113 | 148 | Cost of capital, project maturity and proximity to Europe |
Values are hypothetical analytical assumptions and do not represent observed project costs. Lowest direct-use delivered cost is normalised to 100.
25. Scenario valuation should expose decision reversals
Valuation should use a corridor cash-flow model with construction, ramp-up, support, offtake, logistics and terminal assumptions. The central output is not a single net present value. It is the condition under which the preferred corridor changes.
Four sensitivities deserve priority. First, renewable-power price and utilisation affect hydrogen production. Second, cost of capital and delay affect capital recovery. Third, shipping distance and charter cost affect delivered cost and working capital. Fourth, destination cracking efficiency and utilisation affect the pure-hydrogen route.
A fifth sensitivity is contract quality. A lower-cost corridor with conditional offtake can have less financeable value than a higher-cost corridor with firm, creditworthy demand. The model should show project value, debt capacity and equity downside under the same scenario rather than treating bankability as a narrative overlay.
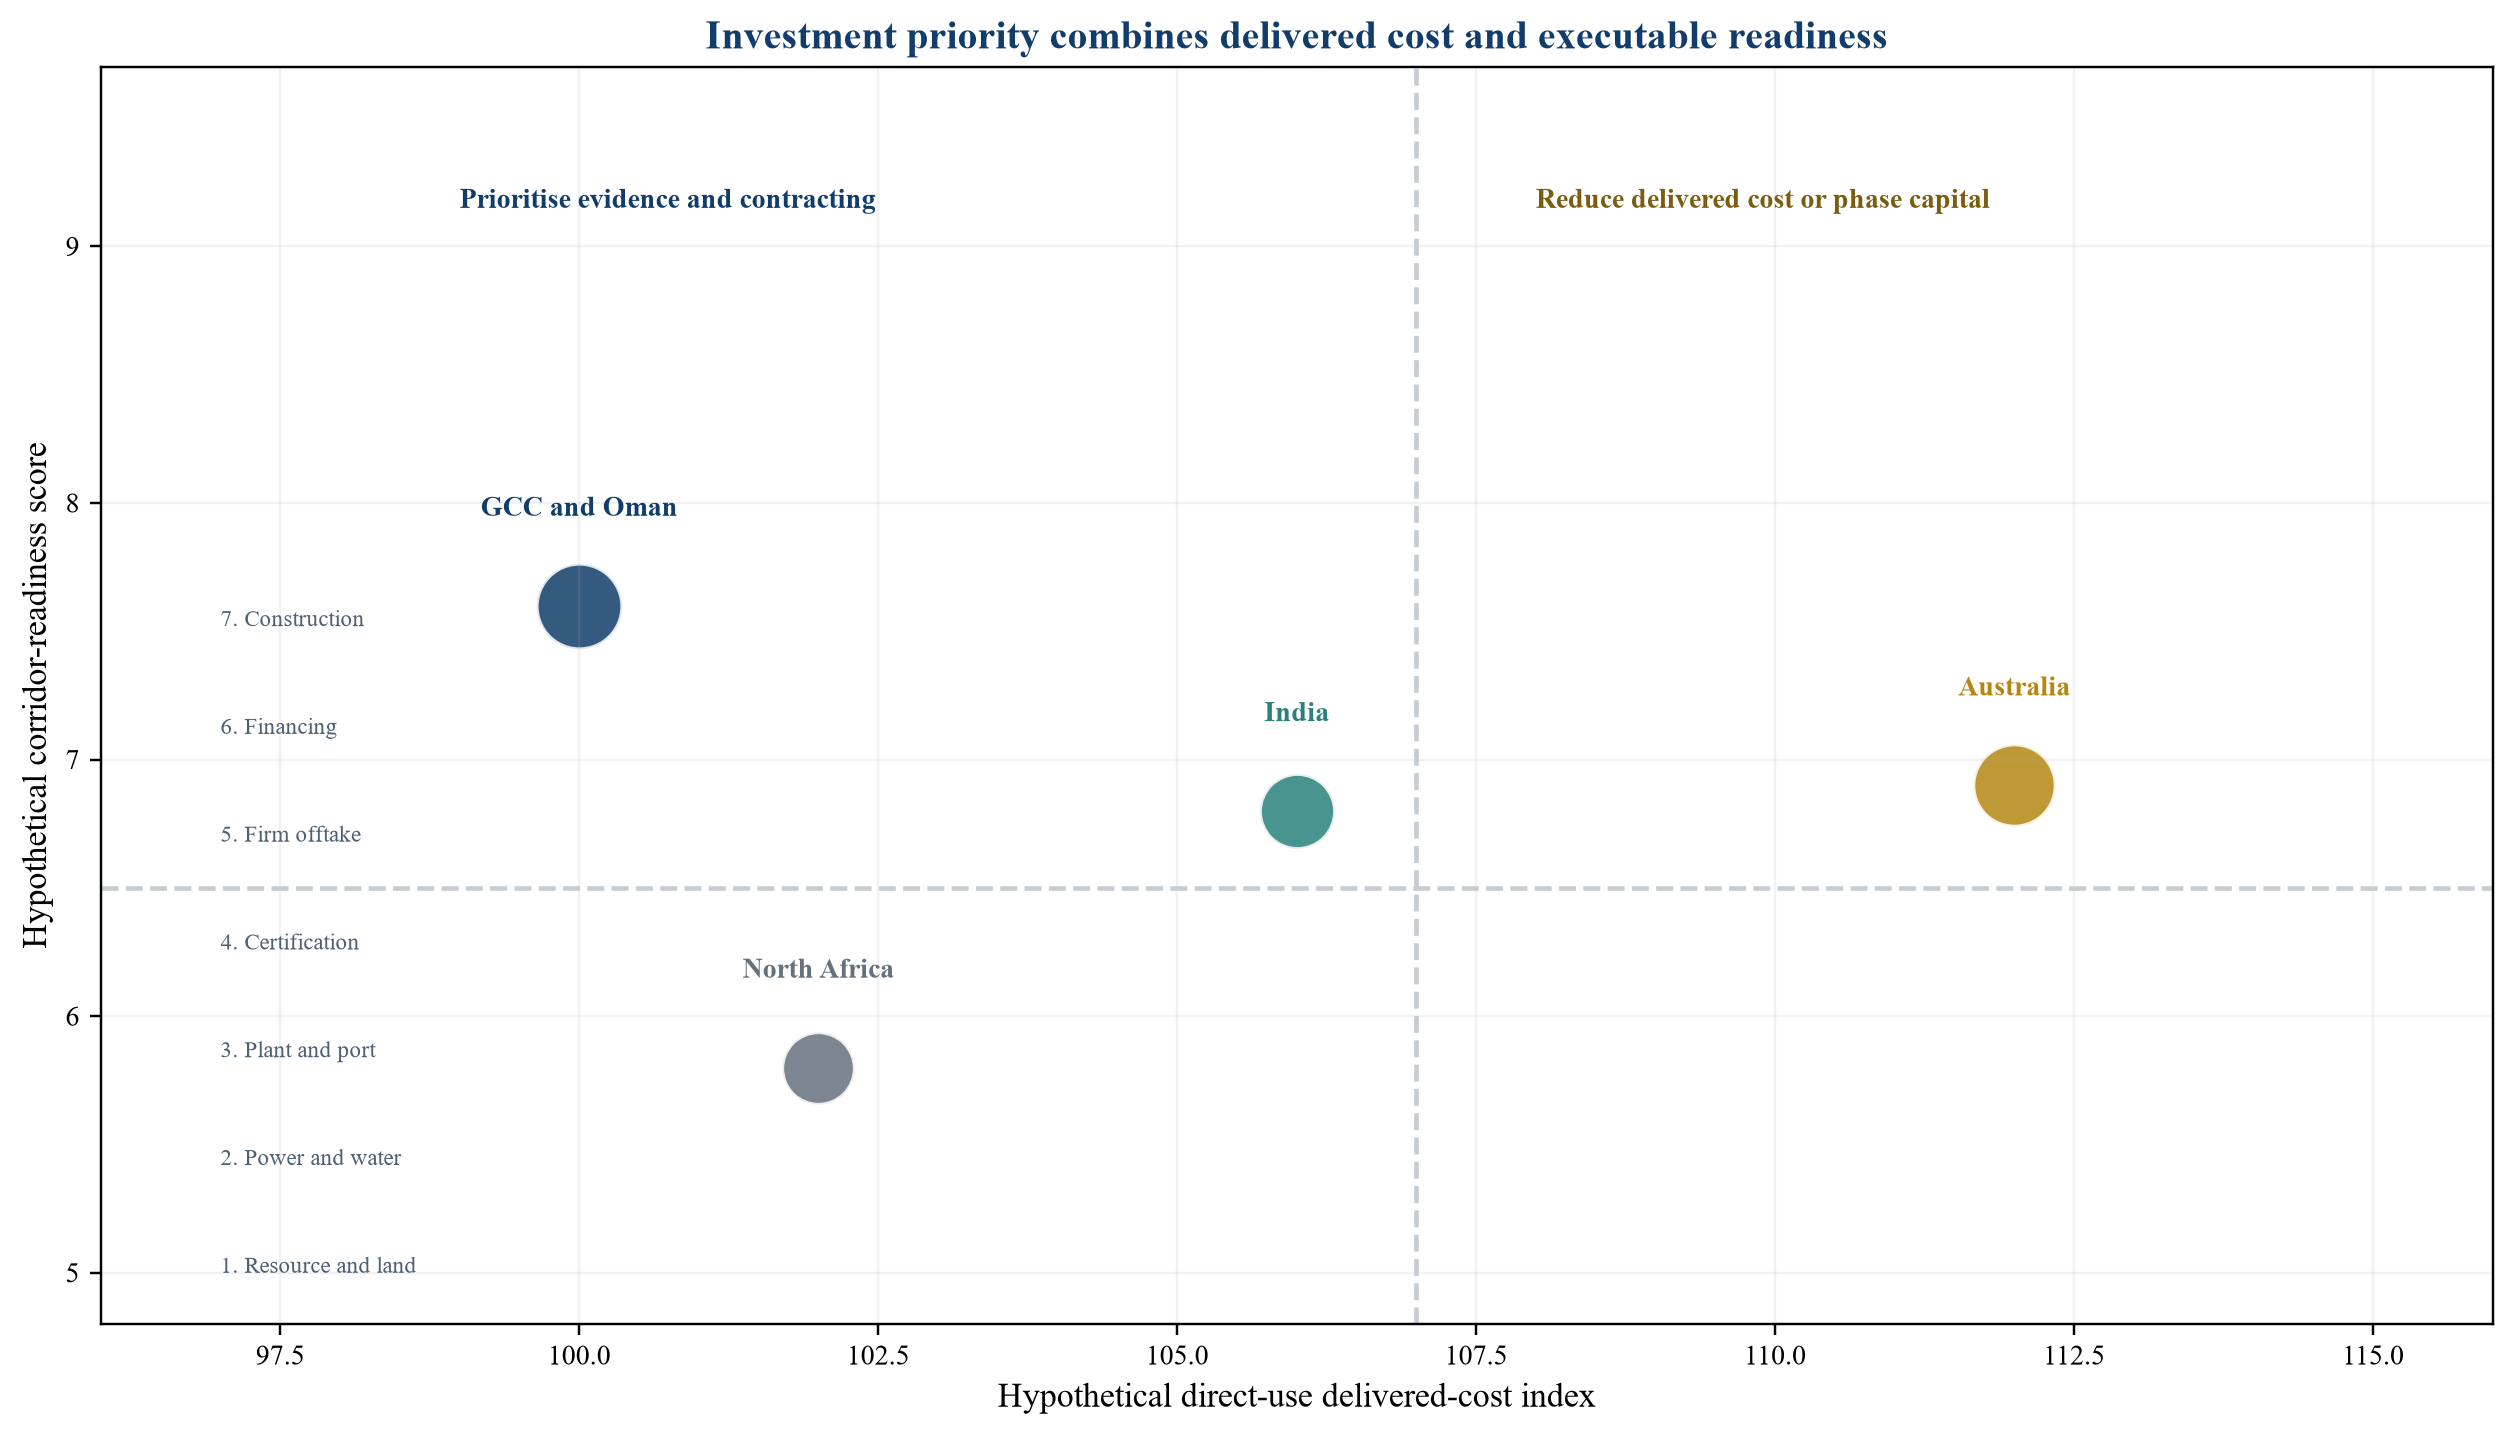
Values are hypothetical analytical assumptions. The figure illustrates how readiness and delivered cost jointly affect investment priority.
26. Decision gates convert uncertainty into staged capital
The first gate confirms resource, land and permits. The second confirms renewable power, water and transmission. The third confirms technology, engineering, equipment warranties and construction interfaces. The fourth confirms port, storage, loading, shipping and destination capacity.
The fifth gate confirms certification and chain of custody. The sixth confirms firm offtake, buyer credit and public support. The seventh confirms financing, hedging, insurance and direct agreements. Full construction commitment should follow the combined gate, with earlier capital limited to the work needed to resolve the next uncertainty.
Stage gates preserve optionality. They also improve comparability because each corridor is assessed at the same evidence level. A region with many announcements should not outrank a corridor with fewer projects and stronger contracts merely because its aggregate pipeline is larger.
27. Commercialisation roadmap
The development phase should begin with a buyer-route decision. Direct ammonia, maritime fuel and cracked hydrogen require different infrastructure and pricing ceilings. The sponsor should then select a small number of origin-port and destination pairs rather than a broad regional concept.
Pre-feasibility should establish the delivered-cost bridge, certification pathway and critical shared infrastructure. Front-end engineering should proceed alongside port, shipping and offtake term sheets. Public support should be pursued with a clear view of eligibility and timing. The project should avoid fixing plant scale before contracted demand and infrastructure capacity are credible.
Before final investment decision, the sponsor should have a coherent contract map, integrated schedule, firm offtake, financing plan and downside liquidity. Construction should preserve commissioning coordination across the plant, port and buyer. Operations should maintain audit evidence, performance data and replacement options.
28. Risk allocation matrix
The party controlling a risk should ordinarily manage it, while the party best able to finance or insure the residual exposure can carry the defined remainder. Renewable-resource and plant-performance risk usually sit with the project and its contractors. Buyer demand and buyer-site availability should sit with the buyer, subject to agreed relief. Port and shipping risks follow the contracted service and delivery point.
Government and public counterparties can address policy, common infrastructure or targeted market-formation risk through defined instruments. Lenders require security and cure rights. Insurers can cover specified physical, political or maritime events. Unallocated risk remains with the project company and should be visible in equity return and liquidity.
Table 3. Corridor risk allocation and investment gates
| Risk | Primary control | Contractual response | Investment-gate evidence |
|---|---|---|---|
| Renewable power and water | Project and suppliers | Availability, quality, curtailment and replacement provisions | Executed supply and connection agreements |
| Plant performance | EPC and technology providers | Performance guarantees, delay and shortfall damages | Proven design, warranties and integrated test |
| Shared infrastructure | Infrastructure owner and state interface | Capacity right, tariff, completion covenant and direct agreement | Funded plan and aligned completion schedule |
| Port and shipping | Terminal and carrier | Throughput, berth, charter, demurrage and alternative-route terms | Binding capacity and vessel plan |
| Certification | Project, verifier and buyer | Standard, audit, change-in-law and rejection protocol | Accepted pathway and data architecture |
| Offtake and buyer credit | Buyer and guarantor | Minimum volume, price, tenor, security and termination payment | Firm contract and credit package |
| Public support | Awarding authority and project | Eligibility, verification, payment and termination terms | Effective award and modelled expiry |
| Currency and interest rate | Project and finance parties | Indexation, hedging, reserve and covenant package | Executable hedge and downside liquidity |
Allocation is a structuring starting point. Governing law, market practice and project facts determine the final position.
29. Financing structure should follow contracted downside cash flow
Senior debt should be sized against cash flow supported by firm contracts, verified public support and conservative availability. Announced buyers, merchant premiums and uncommitted expansion belong in upside valuation. Debt tenor should fit offtake and support tenor, with a tail before material contracts expire.
Construction debt should reflect completion across the corridor, not only mechanical completion of the plant. A complete plant without export capacity cannot generate the modelled revenue. Completion tests may therefore require port availability, certification, shipping and buyer acceptance.
Liquidity should cover ramp-up, delay, working capital, shipping disruption and support-payment timing. Reserve needs rise with voyage length, buyer concentration and interface complexity. Refinancing assumptions should be tested against post-support economics and operating evidence.
30. Portfolio strategy can diversify route and policy exposure
An investor can diversify across regions, buyer routes and development stages. A GCC export asset may provide scale and operating familiarity. India may add domestic-demand optionality. Australia may provide resource and policy exposure to Asian markets. North Africa may provide European proximity and development-finance participation.
Diversification should be measured by common risk drivers. Projects in different countries can remain correlated through the same electrolyser supplier, European rule, buyer sector, shipping market or interest-rate exposure. A portfolio map should show those concentrations.
Capital can also be diversified across the value chain. Terminal, storage, shipping, cracking and certification infrastructure may offer different risk and return from production. The investor should choose whether to own interfaces, contract them or invest through a platform that can aggregate demand and capacity.
31. Board and investment-committee dashboard
The board should receive a corridor dashboard that separates observed evidence from hypothetical assumptions. It should show the buyer route, delivered-cost bridge, critical path, firm versus preliminary demand, support status, certification pathway, shared-infrastructure dependencies, downside liquidity and decision-gate status.
The dashboard should also show the reversal variables: power price, utilisation, delay, cost of capital, freight, cracking efficiency and buyer credit. Management should state which changes would cause the preferred corridor or plant scale to change.
Red flags include production-cost claims without delivery scope, aggregate pipeline figures presented as committed capacity, support assumed before eligibility, port access without binding capacity, buyer demand without credit support and certification treated as an administrative workstream.
32. Limitations
This paper compares corridor structures using public information available at the stated source dates. It does not provide a project-level cost estimate, engineering opinion, legal interpretation or forecast of commodity prices. Public project announcements may change, and scheduled dates may not be achieved.
The cost indices, readiness scores and valuation relationships are hypothetical analytical assumptions designed to demonstrate the method. They should be replaced with verified project data, executed contract terms and destination-specific regulation before any investment decision.
Regional labels contain substantial internal variation. Port, power, water, financing and policy conditions differ within each region. The analysis should be applied to specific origin-port, destination and buyer combinations.
33. Conclusion
The export map for green ammonia is determined by complete corridors. Renewable resources and plant-gate cost matter, yet they sit within a larger chain of infrastructure, shipping, compliance, contracting and finance.
GCC corridors can combine industrial experience, coordinated development and major ports. India can combine domestic anchor demand, procurement and export optionality. Australia can combine renewable resources, certification infrastructure and production support. North Africa can combine European proximity, industrial clusters and development-finance potential. Each advantage has corresponding execution and allocation questions.
The disciplined decision rule is to compare delivered compliant ammonia at the buyer's gate under the intended buyer route. Capital should follow evidence through stage gates. Firm demand, executable infrastructure, accepted certification and aligned financing convert geographic potential into an investable corridor.
References
- International Energy Agency. Global Hydrogen Review 2026: Trade and infrastructure. 2026. https://www.iea.org/reports/global-hydrogen-review-2026/trade-and-infrastructure
- International Energy Agency. Global Hydrogen Review 2026: Demand. 2026. https://www.iea.org/reports/global-hydrogen-review-2026/demand
- International Energy Agency. Global Hydrogen Review 2026: Cost acceptability. 2026. https://www.iea.org/reports/global-hydrogen-review-2026/cost-acceptability
- International Energy Agency. Global Hydrogen Review 2026: Executive summary. 2026. https://www.iea.org/reports/global-hydrogen-review-2026/executive-summary
- Hydrom. Round 3 Auction and awarded projects. https://hydrom.om/Round3Auction.aspx?cms=iQRpheuphYtJ6pyXUGiNqnYV4sgAJufC
- Hydrom. Oman Green Hydrogen Strategy 2024. https://hydrom.om/Media/Pdf/Oman-Green-Hydrogen-Strategy-2024.pdf
- Oman Ministry of Foreign Affairs. Duqm agreements. 10 June 2026. https://www.fm.gov.om/en/47729/
- Oman Ministry of Foreign Affairs. Oman-Netherlands green-hydrogen corridor announcement. https://www.fm.gov.om/en/23736/
- Ministry of New and Renewable Energy, India. National Green Hydrogen Mission. https://mnre.gov.in/en/national-green-hydrogen-mission/
- National Green Hydrogen Mission, India. Project database. https://nghm.mnre.gov.in/project.php
- National Green Hydrogen Mission, India. SIGHT programme portal. https://nghm.mnre.gov.in/sight.php?language=en
- Ministry of New and Renewable Energy, India. National Green Hydrogen Mission progress releases. 2025-2026. https://nghm.mnre.gov.in/
- Australian Department of Climate Change, Energy, the Environment and Water. Hydrogen. https://www.dcceew.gov.au/energy/hydrogen
- Australian Government. 2024 National Hydrogen Strategy. 2024. https://www.dcceew.gov.au/sites/default/files/documents/national-hydrogen-strategy-2024.pdf
- Australian Government. Annual Climate Change Statement 2025. 2025. https://www.dcceew.gov.au/sites/default/files/documents/annual-climate-change-statement-2025.pdf
- Australian Renewable Energy Agency. Hydrogen Headstart Round 2. 2026. https://arena.gov.au/funding/hydrogen-headstart-round2/
- International Energy Agency. Global Hydrogen Review 2026: Africa. 2026. https://www.iea.org/reports/global-hydrogen-review-2026/africa
- Kingdom of Morocco. Morocco adopts measures and clears preliminary phase of Chbika 1. 18 September 2025. https://www.maroc.ma/en/news/morocco-adopts-several-measures-clears-preliminary-phase-chbika-1-green-hydrogen-project
- European Investment Bank. Ain Sokhna Green Ammonia. 2025. https://www.eib.org/en/projects/all/20220666
- Suez Canal Economic Zone. Egypt Green Hydrogen project wins H2Global contract. 12 July 2024. https://sczone.eg/the-egypt-green-hydrogen-project-in-sczone-wins-a-contract-worth-e-397-million-to-export-green-fuel-to-europe/
- Suez Canal Economic Zone. SCZONE in COP27. https://sczone.eg/events/sczone-in-cop27/
- European Commission. Renewable hydrogen. https://energy.ec.europa.eu/topics/eus-energy-system/hydrogen/renewable-hydrogen_en
- European Commission. Commission Delegated Regulations (EU) 2023/1184 and 2023/1185. 2023. https://energy.ec.europa.eu/topics/eus-energy-system/hydrogen/renewable-hydrogen_en
- H2Global. Pilot auction results. 2025. https://h2-global.org/wp-content/uploads/2025/06/h2g-auction-results-slide-deck.pdf
- International Energy Agency. Global Hydrogen Review 2025: Trade and infrastructure. 2025. https://www.iea.org/reports/global-hydrogen-review-2025/trade-and-infrastructure
- International Energy Agency. Global Hydrogen Review 2024: Trade and infrastructure. 2024. https://www.iea.org/reports/global-hydrogen-review-2024/trade-and-infrastructure
- International Energy Agency. Global Hydrogen Review 2026: Production. 2026. https://www.iea.org/reports/global-hydrogen-review-2026/production
- International Energy Agency. Global Hydrogen Review 2026. 18 June 2026. https://www.iea.org/reports/global-hydrogen-review-2026
About the Author
Chennakeshav (CK) is a corporate finance and investment banking executive with 25+ years of global experience in deal origination, structuring and execution across M&A, growth capital and corporate strategy. He has led value-creation mandates for founders, corporates and funds — bridging the boardroom view to hands-on execution and close.
His career spans Morgan Stanley, HSBC, Lloyds Banking Group, EWEC, ADQ portfolio companies and Emirates Growth Fund, across TMT, real estate, fintech, deeptech, cleantech, infrastructure and energy. He has partnered with C-suite leaders, private equity and venture funds, sovereign wealth funds and family offices to finance complex fund raises and scale-up ventures, and has led M&A due diligence, post-merger integration and business-transformation initiatives to create value.
At Matchpoint Partners he is Managing Partner, leading the firm's corporate finance, M&A and capital-raising practice. He holds an MBA from London Business School, an engineering degree from VTU and a Master of Laws (LLM, in progress) from UCL London.
An active start-up mentor, CK mentors at Techstars, DIFC FinTech Hive, Startup Grind, Founder Institute and IN5, serves as Entrepreneur Mentor in Residence (EMiR) at London Business School, and judges the Entrepreneurship World Cup.
LinkedIn: https://www.linkedin.com/in/ckadya/
Profile: https://www.matchpoint-partners.com/team/ck-adya.html
