

1. Define the acquisition decision
The buyer must decide how much value to assign to a carbon-accounting business whose outputs support disclosure, target setting, procurement, product decisions, financing and transition planning. The relevant asset is a controlled evidence system. A calculation engine has limited value when source records, factors, boundaries and approvals cannot be reproduced.
The same platform may serve very different decisions. A sustainability team may prepare an annual inventory. Finance may connect emissions to reporting controls. Procurement may prioritise suppliers. A lender may use financed-emissions information. Each use has a different materiality, assurance expectation and tolerance for estimates.
The framework tests six propositions. The reporting entity and boundary are defined. Source records are complete and authorised. Factors and methods are versioned. Adjustments and estimates are transparent. Customer workflow produces reviewed information. Revenue persists at scalable service cost. Failure at any layer reduces the amount, timing or certainty of transaction value.
Table 1. Evidence required before carbon-accounting capability receives transaction value
| Evidence layer | Core question | Minimum record | Transaction consequence |
|---|---|---|---|
| Boundary | Which entities, operations and periods are included? | Approved consolidation policy | Defines the measured population |
| Source data | Can activity be traced to an authorised record? | Source, owner, period and evidence | Supports completeness and accuracy |
| Calculation | Are units, factors, methods and versions reproducible? | Versioned calculation lineage | Supports technical validity |
| Control | Who reviews, adjusts and approves the output? | Roles, exceptions and sign-off | Supports assurance readiness |
| Decision use | Does the output enter disclosure or management workflow? | User, threshold and action | Establishes customer value |
| Revenue quality | Can the platform retain customers at scalable cost? | Contract, renewal and effort | Supports transaction value |
Each layer should be tested for material entities, scopes, categories and customer decisions.
2. Define the product stack
A carbon-accounting platform can include connectors, invoice extraction, meter ingestion, supplier portals, data warehouses, factor libraries, calculation engines, workflow, controls, dashboards, reporting templates, APIs and professional services. Diligence should identify which components are deployed for each material customer and which remain roadmap items.
Proprietary value may arise from data orchestration, controls, workflow and integration rather than unique emission factors. Public and licensed factor sources can support a valuable platform when provenance and updates are managed. The buyer should distinguish owned software from third-party datasets, implementation code and customer-specific configuration.
Revenue can combine subscriptions, implementation, managed data, supplier engagement, reporting support and assurance preparation. A recurring invoice may depend on recurring manual reconstruction. The transaction model should allocate delivery effort and gross margin to the component that produces and sustains the customer outcome.
3. Establish the reporting boundary
The inventory begins with the reporting entity, organisational boundary, operational boundary and reporting period. Acquisitions, disposals, joint operations, franchises, leased assets and outsourcing can change the population. The Greenhouse Gas Protocol Corporate Standard provides consolidation approaches and accounting principles [1].
The platform should maintain a versioned entity and facility register linked to ownership and control. Boundary changes should record effective date, rationale, approver and effect on current and comparative periods. Customer spreadsheets outside this register can create omissions and double counting.
M&A diligence should compare contracted entities, connected entities, reporting entities and billed entities. A platform can report broad coverage while omitting recently acquired operations or relying on manual uploads for material units. Expansion value should follow demonstrated boundary control.
4. Map emissions lineage
Emissions lineage connects entity, site, source system, activity record, unit, factor, method, calculation, adjustment, reviewer and disclosed total. It allows a user or assurance practitioner to reproduce a number and identify the effect of change. Aggregate dashboards without this chain provide limited evidence.
The platform should preserve original records and transformations. Optical extraction, unit conversion, allocation and gap filling can introduce error. Manual changes should retain previous value, reason, user and approval. The lineage should also identify licensed data and restrictions on reuse.
The acquirer should sample material totals from disclosure back to source and forward again. Samples should include ordinary records, estimates, corrections and boundary changes. A successful trace requires the same result under the production method and version.
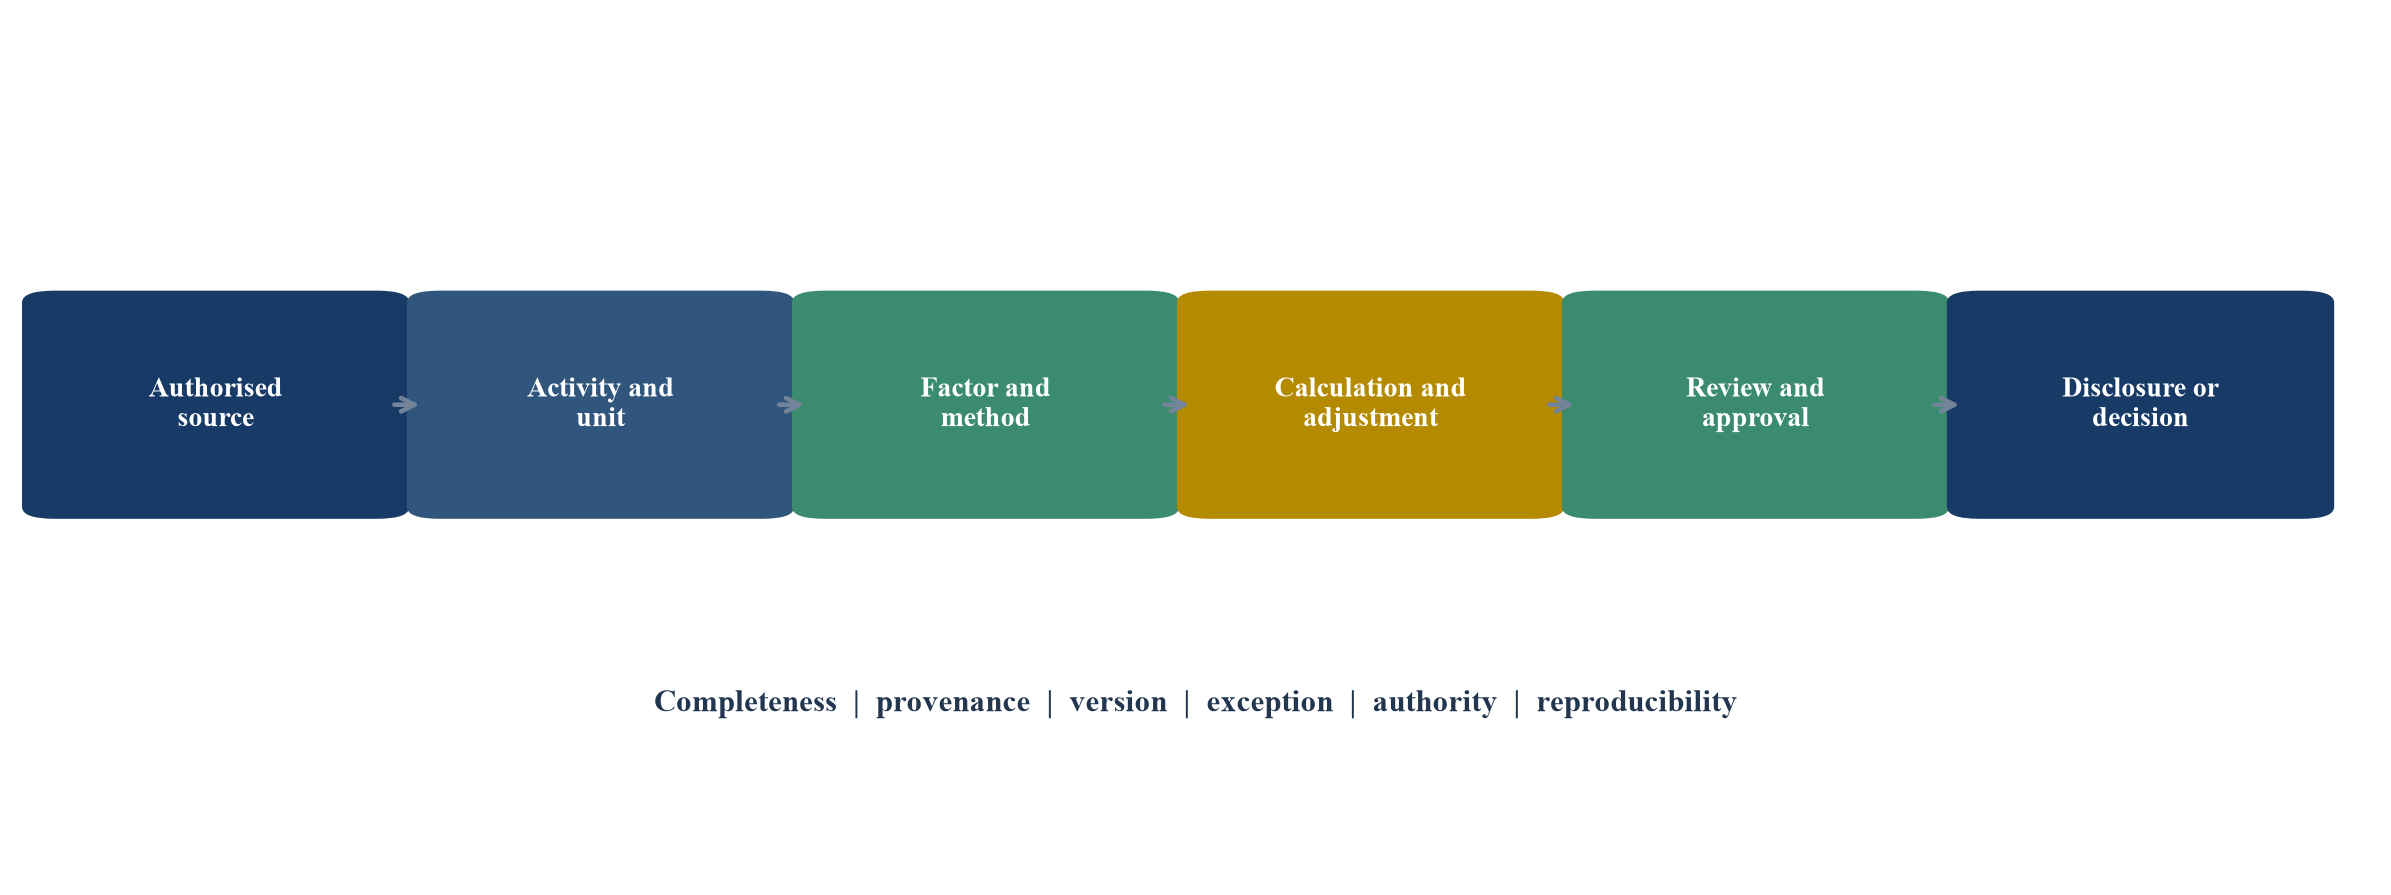
Assurance readiness requires traceability through every material transformation.
5. Reconcile source systems
Activity data can originate in enterprise resource planning, utility portals, meters, travel systems, logistics records, procurement platforms, fleet systems and supplier submissions. Each source has a different owner, granularity, frequency and control environment. A connector does not establish completeness.
The source register should map required data to system population, extraction, cutoff, exception and reconciliation. It should identify whether records are measured, invoiced, estimated or allocated. Duplicate invoices, reversed entries and late data can materially change totals.
The buyer should test connector maintenance and customer dependency. Changes to APIs, invoice formats and account structures create ongoing work. Scalable economics require monitoring, exception routing and reusable mapping rather than repeated analyst repair.
6. Govern emission factors
Emission factors convert activity into greenhouse-gas estimates. They vary by geography, technology, year, gas, unit and source. The factor library should record issuer, publication, version, effective period, geography, unit, gas coverage, global-warming potential and permitted use.
The calculation should select factors through controlled rules. A generic factor can be appropriate when primary data are unavailable, although its limitation should remain visible. Silent substitution can make year-on-year change reflect methodology rather than operations.
Factor updates require impact analysis and customer communication. The platform should preserve historical versions and support restatement where policy requires it. Diligence should test the largest factors and the process for introducing, reviewing and retiring them.
7. Control units and conversions
Carbon calculations combine energy, mass, distance, volume, currency and production units. Errors in prefixes, heating values, currencies and time periods can move reported totals by orders of magnitude. The platform should use a controlled unit system and reject ambiguous records.
Conversion logic should be versioned and tested. The source unit, converted value and factor unit should remain visible. Customer-specific conventions require documented approval. Automated extraction should preserve confidence and route uncertain values for review.
The acquirer should inspect unit-related incidents, test coverage and exception rates. A low visible error rate may reflect limited monitoring. Materiality should guide review, while deterministic controls can test every record for dimensional consistency.
8. Separate measured and estimated data
Carbon inventories often contain estimates because meter, supplier or product data are incomplete. Estimation can be necessary and decision useful. It should be labelled, methoded, approved and replaced when better evidence becomes available.
The data-quality register should identify measured, calculated, allocated, modelled and spend-based records. It should show coverage, uncertainty and trend by material category. A single completeness percentage can conceal a large spend-based Scope 3 balance.
The transaction model should not treat estimated tonnes as proprietary data assets without considering their replacement and decision value. Customers may pay for a controlled method and workflow even when primary data are unavailable. The platform's ability to improve data quality over time can support retention.
9. Apply Scope 1 discipline
Scope 1 covers direct emissions from sources owned or controlled by the reporting entity under the selected boundary. Stationary combustion, mobile combustion, process emissions and fugitive emissions require different activity records and factors. Refrigerants and industrial gases can be material despite small volumes.
The platform should reconcile equipment and fuel populations to operations. Maintenance records, purchase records and inventory movements can support fugitive-emission calculations. Estimates should not silently replace unavailable leak data.
Acquisitions and disposals create cutoff challenges. The system should apply effective dates and baseline policies consistently. Diligence should test whether the customer can reproduce Scope 1 totals after organisational change.
10. Apply Scope 2 methods
Scope 2 covers indirect emissions from purchased energy. The GHG Protocol Scope 2 Guidance distinguishes location-based and market-based methods and sets quality criteria for contractual instruments [2]. Platforms should preserve both methods where applicable and avoid blending them.
The evidence chain should link consumption, location, supplier, instrument, residual mix, factor and period. Renewable certificates and contracts require ownership, validity and retirement evidence. A tariff label alone may not satisfy the selected method.
The buyer should test whether market-based reductions reflect contractual instruments, operational change or factor updates. Customer claims and target progress depend on this distinction. Policy changes can affect factor availability and reporting treatment.
11. Build Scope 3 category control
Scope 3 covers value-chain emissions across fifteen categories under the GHG Protocol Scope 3 Standard [3]. Material categories may depend on spend, physical activity, supplier-specific data, product use and end-of-life assumptions. The platform should define applicability and method by category.
Category boundaries should prevent overlap with Scope 1, Scope 2 and other Scope 3 categories. Supplier and customer data require period, entity and product mapping. Spend-based methods need currency, inflation, geography and sector controls.
The acquirer should examine category coverage and improvement plans. A platform can calculate all categories while providing weak decision value. Stronger evidence links material categories to procurement, product design, supplier engagement or capital allocation.
12. Address financed emissions
Financial institutions may measure emissions associated with lending and investment. IFRS S2 includes financed-emissions requirements for specified activities and requires GHG Protocol measurement unless jurisdictional relief applies [5][6]. Methods can rely on enterprise value, outstanding amount, asset value and data-quality scores.
The platform should preserve portfolio date, exposure, ownership, attribution factor, borrower emissions, estimation and asset-class method. Changes in market value and portfolio composition can move reported emissions without operational change.
Financed-emissions capability should be valued by asset class and customer workflow. A broad calculation may support disclosure, while credit and engagement decisions require counterparty-level lineage and governance.
Data quality should remain visible in aggregation. Reported borrower emissions, estimated emissions and sector proxies have different reliability. The platform should preserve the hierarchy, disclose changes in source and prevent improvement in data quality from being mistaken for operational performance. Portfolio teams need to separate the effect of exposure movement, attribution methodology, market value and underlying counterparty emissions.
13. Control supplier data
Supplier portals can improve primary-data coverage and engagement. They also introduce identity, boundary, period, evidence and comparability problems. A supplier total may cover a different entity or product than the customer's purchase.
The platform should authenticate suppliers, map responses to purchasing entities and preserve evidence. Product carbon footprints require allocation and methodology details. Questionnaire completion does not establish accuracy.
Workflow should prioritise material suppliers and exceptions. Customers need to distinguish reported, verified and estimated data. The acquirer should test response, reuse rights, renewal value and the service effort needed to obtain usable submissions.
14. Govern restatement
Inventories can change because of errors, improved data, factor updates, methodology change or organisational change. The platform should define significance thresholds and restatement rules consistent with the customer's framework and policy.
Every restatement should identify cause, affected periods, previous and revised value, approver and disclosure effect. The system should retain prior versions and prevent silent overwriting. Comparative reports should explain whether change reflects performance or method.
M&A integration needs a baseline plan. Combining inventories with different boundaries and methods can create artificial progress. The buyer should include harmonisation and restatement cost in synergy timing.
15. Design the control environment
Controls should cover entity completeness, source reconciliation, unit validation, factor approval, estimate review, access, change management, calculation testing, period close and disclosure sign-off. Each control needs owner, frequency, evidence and exception process.
Automation can test populations and route exceptions. Human review remains important for boundary, method and judgement. The platform should distinguish system control from customer control and state which evidence it produces.
The acquirer should inspect control operation, not only control design. Failed controls, aged exceptions and late approvals reveal delivery risk. Controls should scale across customers without requiring undocumented analyst knowledge.
16. Prepare for sustainability assurance
ISSA 5000 provides a global principles-based standard for sustainability assurance across topics and frameworks [7][8]. It addresses limited and reasonable assurance engagements. A platform does not provide assurance unless an eligible independent practitioner performs the engagement under the applicable standard.
The platform can improve assurance readiness by preserving criteria, evidence, lineage, controls, judgements and approvals. It should support sample selection, population completeness and issue resolution. Marketing should distinguish assurance-ready records from an assurance conclusion.
Diligence should review assurance findings, adjustments, evidence requests and cycle time by customer. Repeated inability to produce evidence indicates product or implementation weakness. Improved closure over successive periods supports customer value.
Materiality is applied within the assurance engagement and can differ from product thresholds. The platform should let customers and practitioners define populations and selections without rewriting the underlying evidence. It should preserve excluded items and the basis for exclusion. Management dashboards that automatically suppress small records can impede completeness testing when many individually small items become material in aggregate.
17. Distinguish limited and reasonable assurance
Limited and reasonable assurance involve different work effort and conclusion forms. The platform should not imply that one software control automatically supports either level. Evidence sufficiency depends on subject matter, criteria, risk, materiality and practitioner judgement.
Customers may begin with limited assurance and seek stronger controls over time. The product roadmap can support this progression through better source integration, population controls, approval and audit evidence. The commercial case should reflect actual customer commitments.
The acquirer should test whether assurance partners can access required records without uncontrolled exports. Collaboration features, immutable evidence and clear issue ownership can reduce cycle time. Practitioner independence must remain protected.
18. Test calculation reproducibility
Reproducibility means an authorised user can rerun the approved population with the same source, factors, methods and versions and obtain the same result. It also means differences between versions can be explained.
The platform should preserve code and configuration, factor snapshots, transformation logs and run identifiers. Manual spreadsheet steps should be documented or removed. A dashboard total without a reproducible run provides weak assurance evidence.
The buyer should rerun selected material calculations and compare source-to-report totals. It should test whether deleted or corrected records remain auditable. Performance and cost of reproducibility matter when customers carry large datasets.
Table 2. Assurance-readiness evidence and common gaps
| Area | Strong evidence | Common gap | Transaction implication |
|---|---|---|---|
| Population | Reconciled source and boundary register | Unconnected entities or manual files | Completeness risk |
| Method | Versioned factor and calculation policy | Silent factor substitution | Comparability risk |
| Estimate | Label, method, owner and replacement plan | Estimate presented as measured | Accuracy and claim risk |
| Control | Operated control with retained evidence | Policy without execution record | Assurance delay |
| Adjustment | Previous value, reason and approval | Overwritten source | Audit-trail weakness |
| Disclosure | Report mapping and sign-off | Dashboard total copied manually | Reporting risk |
The platform supports evidence preparation; the assurance conclusion remains the practitioner's responsibility.
19. Map policy exposure
Carbon-accounting demand is influenced by disclosure standards, jurisdictional rules, customer requirements, targets and voluntary frameworks. The platform should maintain a policy register by customer, entity, period and obligation. A feature described as compliant can become stale as requirements change.
IFRS S2 requires disclosure of Scope 1, Scope 2 and Scope 3 emissions and generally references the GHG Protocol Corporate Standard, subject to jurisdictional relief [5]. The December 2025 amendments changed specific GHG disclosure requirements [9]. European standards and jurisdictional implementation add further requirements [10].
The acquirer should distinguish durable control needs from temporary reporting projects. Policy exposure can support demand and create product-maintenance cost. Forecasts should include localisation, interpretation, testing and customer communication.
Policy mapping should identify effective date, reporting entity, required metric, measurement basis, assurance requirement and transition relief. Product teams should approve interpretations and record external advice where used. A rules engine can improve consistency, although customers remain responsible for applicability. Diligence should test past policy releases for delivery timing, defects, support burden and customer adoption.
20. Govern claims and targets
Customer claims can include carbon neutrality, renewable energy, emissions reduction, product footprint and net zero. The platform should preserve the inventory, boundary, method, target baseline, credits and approvals supporting a claim.
Software should not convert an internal estimate into an externally defensible claim without governance. Claims may require legal, technical and assurance review. The interface should separate gross emissions, reductions, removals and offsets.
The buyer should review customer incidents, corrections and disputed claims. Liability and reputation can arise from product design, sales statements or misuse. Contracts should define roles while maintaining accurate product representation.
21. Observe customer workflow
Customer value depends on who uses the output and what they do. Sustainability teams may coordinate data, finance may approve disclosure, procurement may engage suppliers and executives may allocate capital. The platform should record roles, deadlines, exceptions and sign-offs.
Workflow adoption is stronger than login activity. Evidence includes period close, issue resolution, disclosure mapping, target monitoring and procurement action. A platform used only to produce one annual report may face seasonal value and switching risk.
The acquirer should observe live customer workflows and interview different functions. A single champion can conceal weak institutional adoption. Distributed roles and embedded integrations support stronger retention.
22. Measure switching cost
Switching cost can arise from connectors, mappings, factor history, controls, approvals, reports, training and assurance evidence. Data volume alone may be portable. Proprietary formats and missing export capability can create friction that customers do not value.
The platform should provide documented export, APIs and transition support. Ethical switching cost comes from embedded workflow and trusted evidence, not customer lock-in through inaccessible records. Contracts may contain portability obligations.
Diligence should review lost customers, migration time and competitor replacement. High retention can reflect contract term or policy urgency. Renewal interviews should identify which components customers would rebuild if they left.
Historical comparatives increase switching complexity because a new provider needs boundaries, factors, methods, approvals and explanations for prior periods. The target should support controlled migration and reconciliation. A platform that can import and validate a predecessor's evidence may win customers more effectively than one that requires a fresh baseline, although this capability creates data-quality and liability responsibilities.
23. Measure service intensity
Carbon data often requires mapping, interpretation, supplier engagement and year-end support. These services can be valuable and recurring. They also affect gross margin and delivery capacity. Hours should be allocated by customer, activity and period.
The acquirer should separate standard onboarding, recurring operations, advisory work and product development. Senior sustainability specialists may be a scarce dependency. Automated ingestion can shift effort into exception handling rather than remove it.
Evidence of scalability includes lower hours per record, reusable mappings, automated reconciliations, customer self-service and stable assurance outcomes. Margin improvement should be demonstrated by cohort.
Seasonality should be visible. Reporting deadlines can concentrate workload and require temporary staff or senior review. The acquirer should compare peak capacity, backlog, overtime, contractor use and customer delays. A business can report attractive annual utilisation while facing material delivery risk during close and assurance periods. Pricing and staffing should reflect the true peak requirement.
24. Test revenue quality
Revenue quality depends on contract scope, term, renewal, expansion, concentration, collection and service obligation. Annual recurring revenue can include one-off implementation or managed reporting. Diligence should reconcile contract, billing, recognition and cash.
Cohorts should separate customers by size, jurisdiction, assurance need and product. Expansion may reflect more entities, suppliers, modules or advisory work. The buyer should trace expansion to sustained workflow adoption.
Pricing should be tested against assets, entities, users, records, modules and service effort. Regulation can accelerate demand while intensifying procurement and competition. Forecasts should not treat all policy-driven demand as permanent software revenue.
Contract diligence should review data availability, customer acceptance, service credits, price increases, termination, regulatory change and professional-services commitments. Revenue may be at risk when a customer cannot provide data, yet the vendor remains responsible for a complete report. The commercial model should identify which obligations depend on customer cooperation and how delays affect recognition and cash.
25. Protect data and access
Carbon inventories contain energy use, production, procurement, logistics, supplier and financial information. The platform should classify data, limit access, encrypt records, log activity and govern subcontractors. Supplier data may be contractually restricted.
Access should reflect entity and reporting role. Assurance practitioners may require controlled read access. Administrators should not be able to alter approved evidence without trace. Development and support environments need separation.
Security diligence should include architecture, incidents, recovery, retention and deletion. A change of control may require customer or data-vendor consent. Costs should enter the integration plan.
Table 3. Data-quality hierarchy for transaction diligence
| Data class | Example | Evidence expectation | Valuation treatment |
|---|---|---|---|
| Primary measured | Meter or verified supplier activity | Source record, period and control | Strongest basis for decision use |
| Primary calculated | Fuel quantity converted to energy | Source, conversion and method | Retain with reproducibility test |
| Supplier reported | Supplier inventory or product footprint | Identity, boundary, method and evidence | Adjust for comparability and verification |
| Modelled activity | Distance, use or production estimate | Model, inputs, error and approval | Apply uncertainty and replacement cost |
| Spend based | Financial spend multiplied by sector factor | Ledger, currency, sector and factor | Screening value; limited operational attribution |
| Gap filled | Prior period or proxy | Rule, owner and replacement plan | Reduce assurance and persistence weight |
Quality should be assessed by material category and intended customer decision.
26. Apply accounting and valuation discipline
IFRS 13 defines fair value through market-participant assumptions [13]. Valuation should assess software, data rights, customer relationships, contracts and workforce capability. Calculated tonnes are not automatically an owned asset.
IAS 38 governs intangible assets and research and development [12]. Proprietary code and methods require control and future benefits. Public factors and customer records can support a valuable service without becoming target-owned data.
IFRS 15 governs revenue from customer contracts [11]. Licences, subscriptions, implementation and managed services may contain different obligations. Customer emissions and estimated savings are not platform revenue.
The valuation should separate installed recurring revenue, evidenced expansion, new jurisdictions and research pipeline. Each layer has a different probability, investment requirement and time to cash. Buyer synergy should include duplicated factor licences, connector migration, customer consent, revalidation and staff retention. A large addressable reporting market does not establish accessible revenue for the target.
Table 3. Hypothetical evidence bridge for carbon-accounting value
| Stage | Annual customer value | Buyer revenue and synergy | Principal adjustment |
|---|---|---|---|
| Management case | 8.8 | 6.0 | Full reported population |
| Boundary and source gate | 7.2 | 5.1 | Entity completeness and data rights |
| Calculation and control gate | 6.0 | 4.2 | Factors, methods, estimates and controls |
| Assurance and workflow gate | 4.9 | 3.3 | Evidence readiness and customer use |
| Persistence and cash conversion | 4.0 | 2.6 | Retention, service cost and collection |
Values in USD millions are illustrative management assumptions.
27. Construct a hypothetical acquisition
Consider a wholly hypothetical platform with 112 enterprise customers, USD 16.2 million of annual recurring revenue, 38 million activity records and 7.4 million reported tonnes of carbon-dioxide equivalent. Management assumes USD 8.8 million of annual customer value and USD 6.0 million of buyer revenue and synergy.
Boundary and source testing retains 79 customers and 5.5 million tonnes. Calculation and control review retains 68 customers and 4.7 million tonnes. Assurance and workflow review retains 61 customers and 4.1 million tonnes with reproducible lineage, approval and decision use.
After retention, service-cost and cash adjustments, the framework retains USD 4.0 million of customer value and USD 2.6 million of buyer revenue and synergy. Every amount is hypothetical and demonstrates method only.
The adjustment does not imply that excluded customers or tonnes have no value. Some may support disclosure after remediation, and some may remain useful for screening. The valuation assigns different probability and timing to each evidence state. This prevents management from pricing future remediation as completed capability while preserving an explicit pathway to upside.
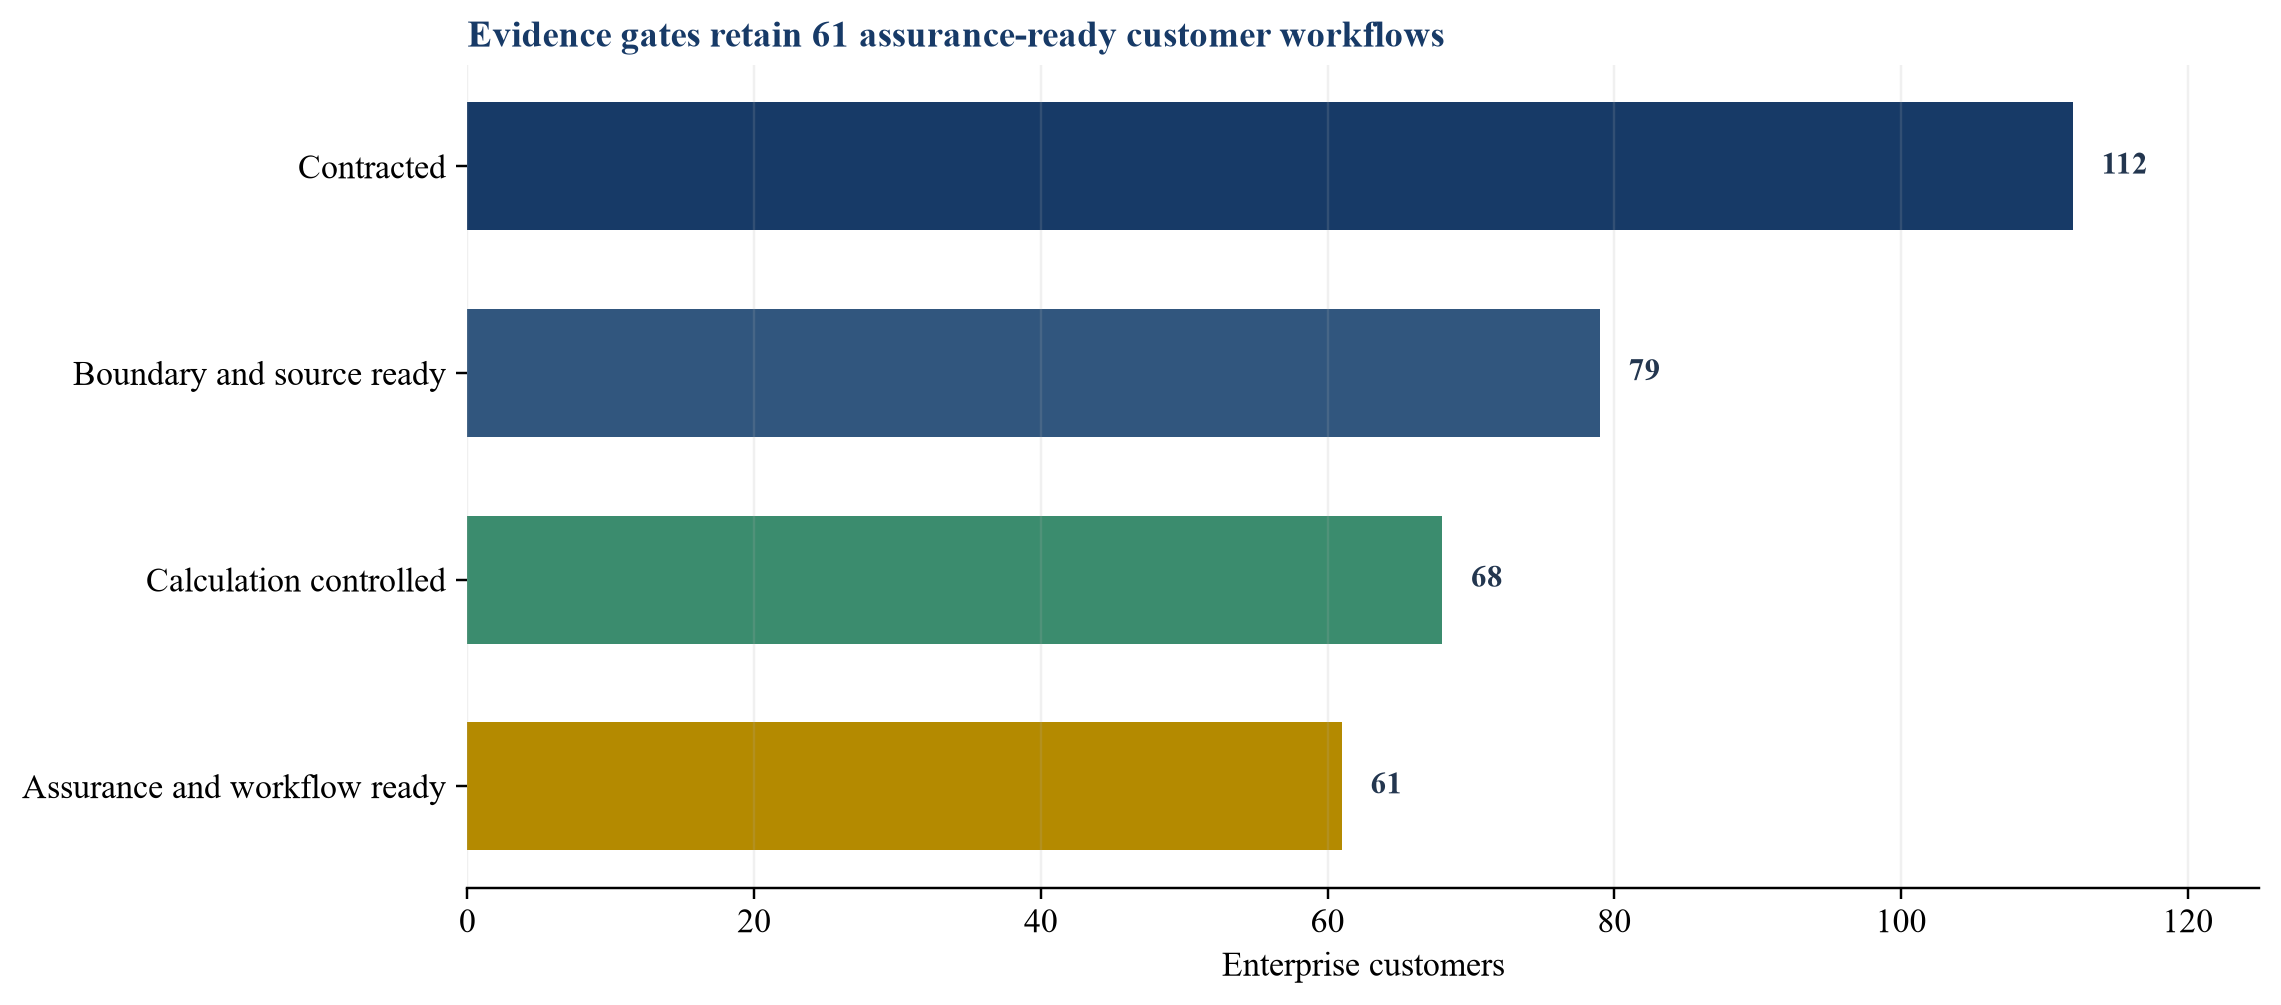
Counts are illustrative management assumptions.
28. Translate evidence into price and terms
Validated installed capability can support value at signing. Uncontrolled customer populations, policy expansion and proposed automation can be funded through milestones. Milestones should reference reproduced calculations, assurance findings, workflow adoption, renewal and collected cash.
Representations should cover data rights, factors, methods, controls, customer claims, security, intellectual property and policy statements. Holdbacks and indemnities can address defined exposures. The buyer should retain capital for integration and restatement.
Synergy should include connector migration, factor harmonisation, customer consent, control redesign and retained specialists. A gross cross-sell assumption without these costs overstates accessible value.
Earn-outs require careful design because policy and customer data are partly outside management control. Milestones should favour audited or objectively verified outcomes, such as renewal, gross margin, closed assurance findings or cash collection. Definitions should state the treatment of acquisitions, customer delays, price changes and buyer integration decisions. Governance should provide access to records and a dispute process.
29. Build diligence and execute one hundred days
The diligence request should include entity registers, source maps, factor libraries, calculation policies, test evidence, adjustment logs, controls, assurance findings, customer workflows, contracts, cohorts, service hours, security and financial models.
The first thirty days should establish control and reconcile production populations. Days thirty-one to sixty should reproduce material inventories and close priority exceptions. Days sixty-one to one hundred should harmonise governance, policy mapping, customer evidence and board reporting.
Management should report assurance-ready customers, traceable tonnes, aged exceptions, adopted workflows, recurring revenue, service effort and collected cash separately. Unsupported claims should be removed from forecasts.
Sampling should follow materiality and risk. The team should inspect the largest inventories, customers with assurance, complex Scope 3 methods, recent acquisitions, material restatements and bespoke connectors. It should reproduce selected totals and interview sustainability, finance, internal control, assurance and procurement users. Customer references should address implementation, evidence quality, workflow, switching and renewal rationale.
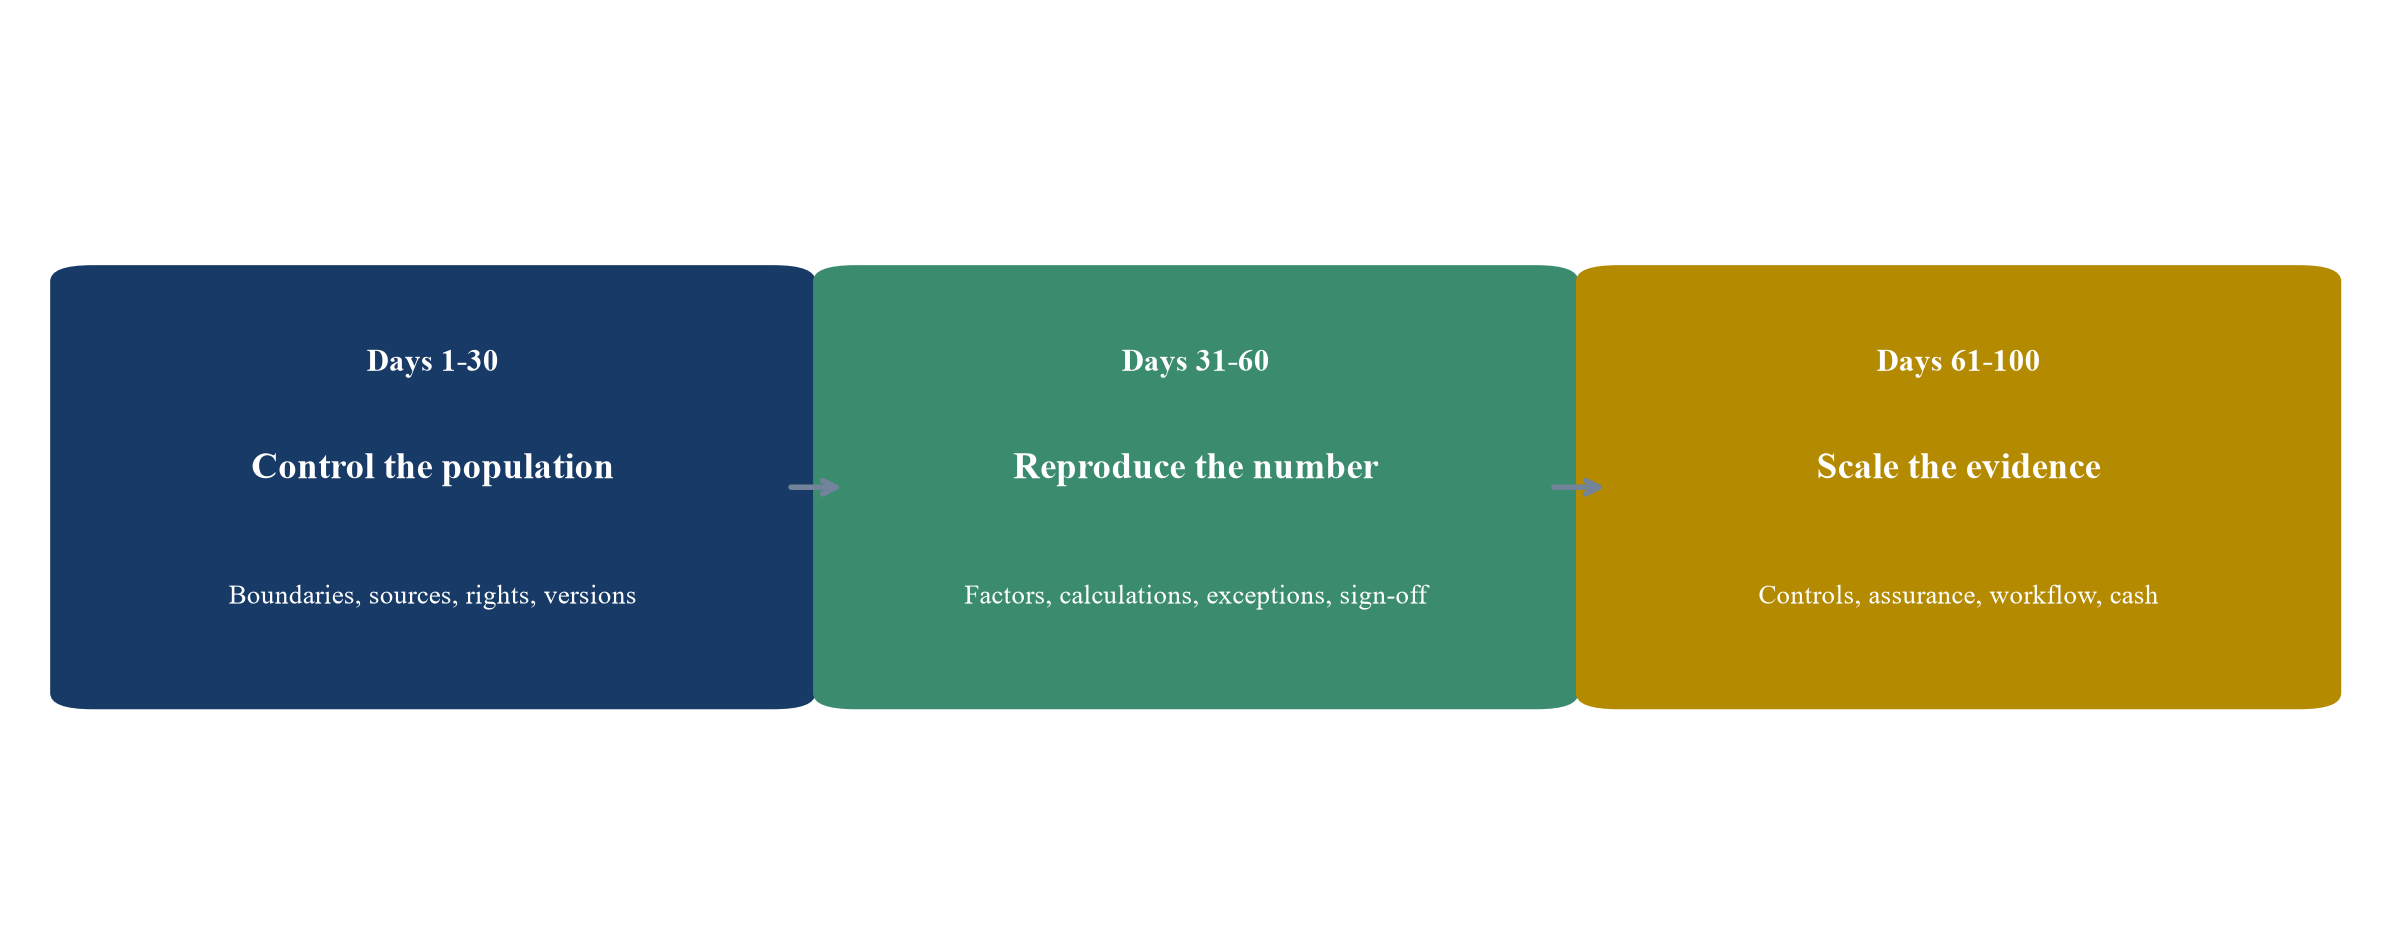
Control and reproducibility precede expansion.
30. Recognise limitations and conclude
This framework does not provide assurance on a specific inventory, platform or transaction. Applicable criteria, obligations and evidence depend on customer, jurisdiction, reporting framework and intended use. Current accounting, assurance, legal, tax and technical advice is required.
The hypothetical case does not estimate market demand, likely savings or transaction value. Reported emissions can change because of operations, boundary, method, factors and improved data. A lower carbon number does not by itself prove operational reduction.
Carbon accounting also faces legitimate methodological diversity. Different reporting frameworks, product methods and sector practices can produce different numbers from related activities. Diligence should test fitness for the customer's criteria rather than seek one universal answer. The platform should explain differences and preserve reconciliation where customers use several frameworks.
The quality of evidence will remain uneven across value chains. A defensible system makes that unevenness visible and supports planned improvement. It should not convert a proxy into a measured fact through presentation. Boards and buyers can make better decisions when coverage, estimation, uncertainty and control exceptions remain connected to financial consequence.
Long-term policy demand should be separated from near-term commercial evidence. Renewal, assurance findings, workflow use, service effort and collected cash can be observed today. These measures should support the valuation without replacing technical diligence. Strong transaction evidence connects reproducible numbers to customers who continue to use and pay for the system.
Boundary governance should identify responsibility for associates, joint ventures and value-chain entities. Legal ownership, financial control and operational control can lead to different consolidation outcomes. Customers may change approach between reporting frameworks or jurisdictions. The platform should preserve the selected policy, rationale and reconciliation rather than applying one default across every customer. Baseline recalculation rules should be linked to significant structural changes and retained with comparative disclosures. This history becomes especially important after an acquisition, when management needs to explain whether the combined inventory reflects operational performance, a changed boundary or a different accounting method.
Lineage should extend to aggregated and exported reports. A controlled calculation can lose reliability when users copy totals into presentation or reporting templates and apply manual rounding, netting or exclusions. The platform should map report fields to approved outputs and preserve the report version, preparer, reviewer and release date. API customers require equivalent controls because downstream transformations may alter units or population without visibility to the vendor. Diligence should therefore inspect the last mile from calculation engine to released disclosure as well as the internal computation.
Reconciliation should compare expected and received populations before calculations begin. Examples include site counts, meter counts, invoice sequences, fleet assets, employee trips and supplier spend. The platform should identify missing periods, duplicate records and unusual movements. Management review should focus on meaningful exceptions rather than substitute for systematic completeness controls. Customer responsibility for source availability should be stated, while the product should make missing evidence visible. A complete-looking total built on an incomplete population remains a weak basis for assurance and valuation.
Factor governance affects customer comparability. A platform may choose a more specific factor as better data becomes available, causing emissions to rise or fall without a change in activity. The system should produce a factor-change bridge that isolates operational, boundary, activity and methodology effects. This supports management decisions and reduces confusion during assurance. It also gives the buyer evidence that the product can manage scientific and policy updates without uncontrolled restatement work. Factor licensing and redistribution rights should remain connected to every calculation and customer export.
Purchased goods and services often illustrate the Scope 3 evidence challenge. Spend data can provide broad coverage, while physical quantities and supplier-specific product data can support more actionable analysis. The platform should avoid mixing methods without disclosure. It should preserve the hierarchy used for each supplier and product, record allocation and verification status and show how method changes affect the baseline and target trajectory. Procurement teams need a number that can direct engagement, while reporting teams need a complete and comparable inventory. One method may not satisfy both decisions.
Assurance readiness can be measured through repeatable operating indicators. These include requested-item turnaround, unresolved evidence exceptions, post-close adjustments, control deviations and the share of material balances reproduced from primary sources. The platform should avoid scoring its own assurance quality as if it were an independent conclusion. Diligence can compare these indicators across customers and periods to identify whether product maturity is improving and professional-service effort is declining. Assurance findings should feed product development through a governed process that preserves practitioner independence and customer confidentiality.
The investment case should also consider talent and knowledge concentration. Carbon accounting combines software engineering, emissions methodology, reporting interpretation, customer implementation and assurance support. A few senior specialists may hold undocumented rules or customer context. The buyer should map critical roles, review documentation and test whether teams can reproduce complex inventories without the original implementer. Retention and knowledge-transfer cost belong in the transaction model. Scalable value requires institutional capability rather than dependence on individual memory.
Customer outcome evidence should reflect the decision supported. A completed disclosure can demonstrate reporting utility. A changed procurement specification can demonstrate operational use. A reduction claim requires a controlled baseline and evidence of activity change. The buyer should avoid combining these outcomes into one undifferentiated value figure. Each outcome has a different beneficiary, observation period, attribution method and probability of renewal. A structured outcome ledger gives management a better basis for product investment and pricing.
Integration planning should preserve customer evidence while reducing duplicate systems. Migrating calculations before source, factor and report lineage are reconciled can break comparatives and assurance trails. The buyer should sequence identity, rights, data, method, controls and outputs, then obtain customer acceptance. Parallel runs may be required for material inventories. Integration savings should begin after validated migration rather than at legal close. This sequencing protects the revenue base and makes the synergy case auditable.
Board oversight should distinguish production reliability from methodological judgement. Production reporting can track successful runs, data completeness, exception age and service levels. Method governance should track factor changes, estimation, boundary decisions, restatements and policy interpretation. Commercial reporting should track renewal, gross margin, cash and assurance support. Combining these measures into a single platform-health score can hide the source of risk. Separate, reconciled reporting enables directors and transaction teams to direct remediation and capital to the layer that constrains value.
The practical conclusion is that transaction value begins with an auditable carbon number and continues through customer workflow, retention and scalable delivery. A defensible platform can reproduce its outputs, expose judgement, support effective controls and connect evidence to decisions for which customers continue to pay.
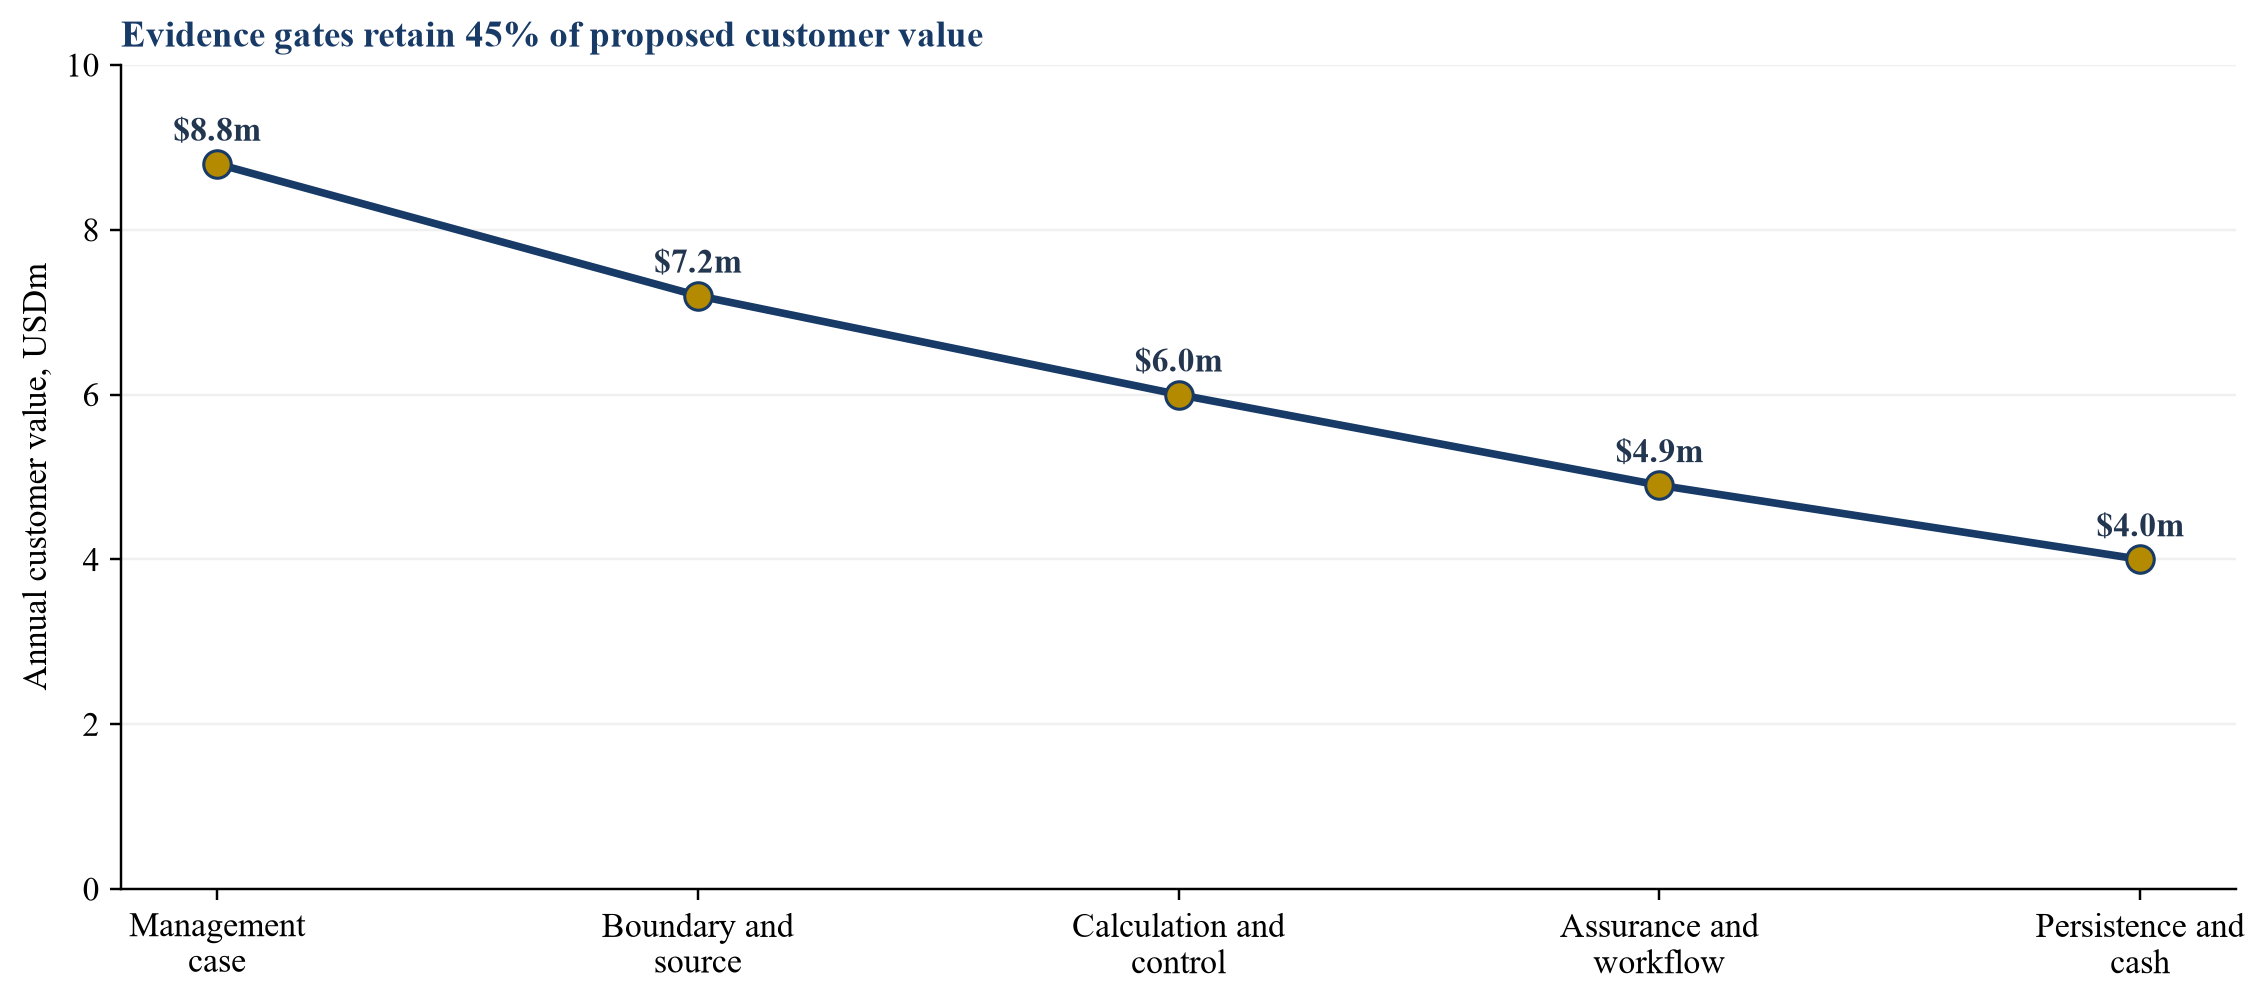
Values in USD millions are illustrative management assumptions.
References
- Greenhouse Gas Protocol. A Corporate Accounting and Reporting Standard. https://ghgprotocol.org/corporate-standard
- Greenhouse Gas Protocol. Scope 2 Guidance. https://ghgprotocol.org/scope-2-guidance
- Greenhouse Gas Protocol. Corporate Value Chain Scope 3 Standard. https://ghgprotocol.org/scope-3-calculation-guidance-2
- Greenhouse Gas Protocol. Scope 3 Calculation Guidance. https://ghgprotocol.org/scope-3-calculation-guidance-2
- IFRS Foundation. IFRS S2 Climate-related Disclosures. https://www.ifrs.org/issued-standards/list-of-standards/ifrs-s2-climate-related-disclosures/
- IFRS Foundation. Greenhouse Gas Emissions Disclosure Requirements Applying IFRS S2, May 2025. https://www.ifrs.org/content/dam/ifrs/supporting-implementation/ifrs-s2/ghg-ifrs-s2-educational-material.pdf
- International Auditing and Assurance Standards Board. ISSA 5000. https://www.iaasb.org/standards-pronouncements
- International Auditing and Assurance Standards Board. Understanding ISSA 5000. https://www.iaasb.org/focus-areas/understanding-international-standard-sustainability-assurance-5000
- IFRS Foundation. Amendments to Greenhouse Gas Emissions Disclosures, December 2025. https://www.ifrs.org/content/dam/ifrs/publications/amendments/english/2025/issb-2025-1-amendments-ifrs-s2.pdf
- European Commission. European Sustainability Reporting Standards. https://finance.ec.europa.eu/capital-markets-union-and-financial-markets/company-reporting-and-auditing/company-reporting/corporate-sustainability-reporting_en
- IFRS Foundation. IFRS 15 Revenue from Contracts with Customers. https://www.ifrs.org/issued-standards/list-of-standards/ifrs-15-revenue-from-contracts-with-customers/
- IFRS Foundation. IAS 38 Intangible Assets. https://www.ifrs.org/issued-standards/list-of-standards/ias-38-intangible-assets/
- IFRS Foundation. IFRS 13 Fair Value Measurement. https://www.ifrs.org/issued-standards/list-of-standards/ifrs-13-fair-value-measurement/
- International Organization for Standardization. ISO 14064-1 Greenhouse gases. https://www.iso.org/standard/66453.html
- International Organization for Standardization. ISO 14064-3 Verification and validation. https://www.iso.org/standard/66455.html
- International Organization for Standardization. ISO/IEC 42001 Artificial intelligence management system. https://www.iso.org/standard/81230.html
- National Institute of Standards and Technology. AI Risk Management Framework. https://www.nist.gov/itl/ai-risk-management-framework
- Partnership for Carbon Accounting Financials. Global GHG Accounting and Reporting Standard. https://carbonaccountingfinancials.com/standard
- IFRS Foundation. GRI 102 and IFRS S2 equivalence for GHG emissions disclosures, 2025. https://www.ifrs.org/news-and-events/news/2025/06/gri-102-ifrs-s2-reporting-and-equivalence/
- IAASB. ISSA 5000 Fact Sheet, 2025. https://www.iaasb.org/publications/issa-5000-fact-sheet
About the Author
Chennakeshav (CK) is a corporate finance and investment banking executive with 25+ years of global experience in deal origination, structuring and execution across M&A, growth capital and corporate strategy. He has led value-creation mandates for founders, corporates and funds — bridging the boardroom view to hands-on execution and close.
His career spans Morgan Stanley, HSBC, Lloyds Banking Group, EWEC, ADQ portfolio companies and Emirates Growth Fund, across TMT, real estate, fintech, deeptech, cleantech, infrastructure and energy. He has partnered with C-suite leaders, private equity and venture funds, sovereign wealth funds and family offices to finance complex fund raises and scale-up ventures, and has led M&A due diligence, post-merger integration and business-transformation initiatives to create value.
At Matchpoint Partners he is Managing Partner, leading the firm's corporate finance, M&A and capital-raising practice. He holds an MBA from London Business School, an engineering degree from VTU and a Master of Laws (LLM, in progress) from UCL London.
An active start-up mentor, CK mentors at Techstars, DIFC FinTech Hive, Startup Grind, Founder Institute and IN5, serves as Entrepreneur Mentor in Residence (EMiR) at London Business School, and judges the Entrepreneurship World Cup.
https://www.linkedin.com/in/ckadya/
https://www.matchpoint-partners.com/team/ck-adya.html
This paper is part of a continuing series on the structure of private and alternative markets. The views expressed are the author's own. The paper is for information only, describes market structure in general terms, and does not constitute investment, legal, tax or regulatory advice or a recommendation in respect of any security, vehicle or counterparty.
