

1. Define the valuation decision
The transaction decision is how much value an acquirer or investor can assign to a physical-risk AI platform. The relevant asset is not a coloured map. It is a governed decision system that combines scientific data, geospatial identity, vulnerability models, customer workflow and evidence of financial consequence. The same hazard score can be useful for portfolio screening and unsuitable for engineering design or insurance pricing.
The valuation should begin with named decisions. A lender may use the platform to prioritise collateral review. An insurer may use it to triage underwriting. An infrastructure owner may use it to sequence adaptation capital. A corporate may use it to assess site selection or supplier continuity. Each decision has a different materiality, time horizon, tolerance for error and requirement for human review.
The framework tests six propositions. The platform identifies the relevant asset. Hazard and exposure data are suitable for the stated horizon. Vulnerability and loss functions are validated for the asset class. Uncertainty is communicated at the point of use. Customers act within a governed workflow. The resulting action creates or protects cash flow. Failure at any layer reduces the amount, timing or certainty of transaction value.
Table 1. Evidence required before a physical-risk platform receives transaction value
| Evidence layer | Core question | Minimum record | Valuation consequence |
|---|---|---|---|
| Asset identity | Is the correct property or operating asset represented? | Geocode, footprint, use and version | Defines the addressable population |
| Hazard validity | Does the model represent the relevant peril and horizon? | Method, observations and scenario lineage | Supports scientific fitness |
| Vulnerability | Does hazard intensity translate to asset-specific damage or disruption? | Asset taxonomy and damage function | Connects hazard to consequence |
| Decision use | Does the output enter a governed customer workflow? | User, threshold, action and override log | Establishes adoption |
| Outcome | Does the decision change loss, cost, capital or revenue? | Baseline, action and finance record | Supports customer value |
| Revenue durability | Can the platform retain customers at scalable service cost? | Contract, renewal and effort data | Supports transaction value |
Evidence should be assessed for each material hazard, geography, asset class and customer decision.
2. Define the product stack
A physical-risk platform can include address matching, building footprints, elevation, land cover, climate observations, reanalysis, remote sensing, catastrophe models, machine learning, vulnerability curves, loss functions, scenario engines, APIs, dashboards and professional services. The same brand may deliver different components to different customers. Diligence should identify the deployed stack by contract and use case.
The acquirer should separate proprietary capability from licensed data and public sources. A vendor may create value through asset resolution, feature engineering, workflow integration and user experience while relying on external climate models. That can be a durable business if rights, quality, continuity and differentiation are clear. Marketing language about proprietary climate intelligence provides limited evidence without a dependency register.
Revenue classification also matters. Subscription invoices may include substantial analyst interpretation, asset cleaning, bespoke scenario work and customer support. Implementation may recur when portfolios change. The transaction model should allocate staff effort and gross margin to each product component and customer cohort.
3. Establish the asset denominator
Portfolio coverage begins with the asset denominator. An enterprise may provide addresses, coordinates, polygons, facility names, legal entities, property types and replacement values. Records can be duplicated, stale, incomplete or mapped to a postal centroid rather than the actual footprint. A platform cannot produce asset-level risk when it has not resolved the asset.
The register should reconcile contracted records, matched assets, resolved footprints, complete attributes, scored hazards, decision-ready outputs and customer-approved records. It should identify confidence and exception reasons. Counts should not mix buildings, parcels, sites, policies, loans and companies because these units support different economic claims.
Identity drift should be monitored. Facilities expand, properties are redeveloped and portfolios change ownership. A stable identifier should preserve history while recording new footprints, use and occupancy. Transaction diligence should sample high-value and high-risk records against authoritative customer or cadastral sources.
4. Map the hazard chain
Physical climate risk combines hazard, exposure and vulnerability. Hazard describes a potentially damaging physical event or trend. Exposure identifies people, assets or activities in harm's way. Vulnerability describes susceptibility to damage or disruption. Financial consequence depends on adaptation, insurance, operational dependency and the customer's response.
The platform should document the chain for each output. A flood score may combine rainfall, river flow, terrain, drainage and defence assumptions. A heat score may use air temperature while the decision depends on wet-bulb conditions, equipment derating or worker exposure. A water-stress index may represent basin conditions and provide limited evidence about a site's legal access, storage or process demand.
IPCC material provides a traceable scientific basis for regional and sectoral climate information [1][2]. The platform should show how its methods use, transform or depart from that evidence. The acquirer should avoid treating a broad climate scenario as a precise asset-loss forecast.
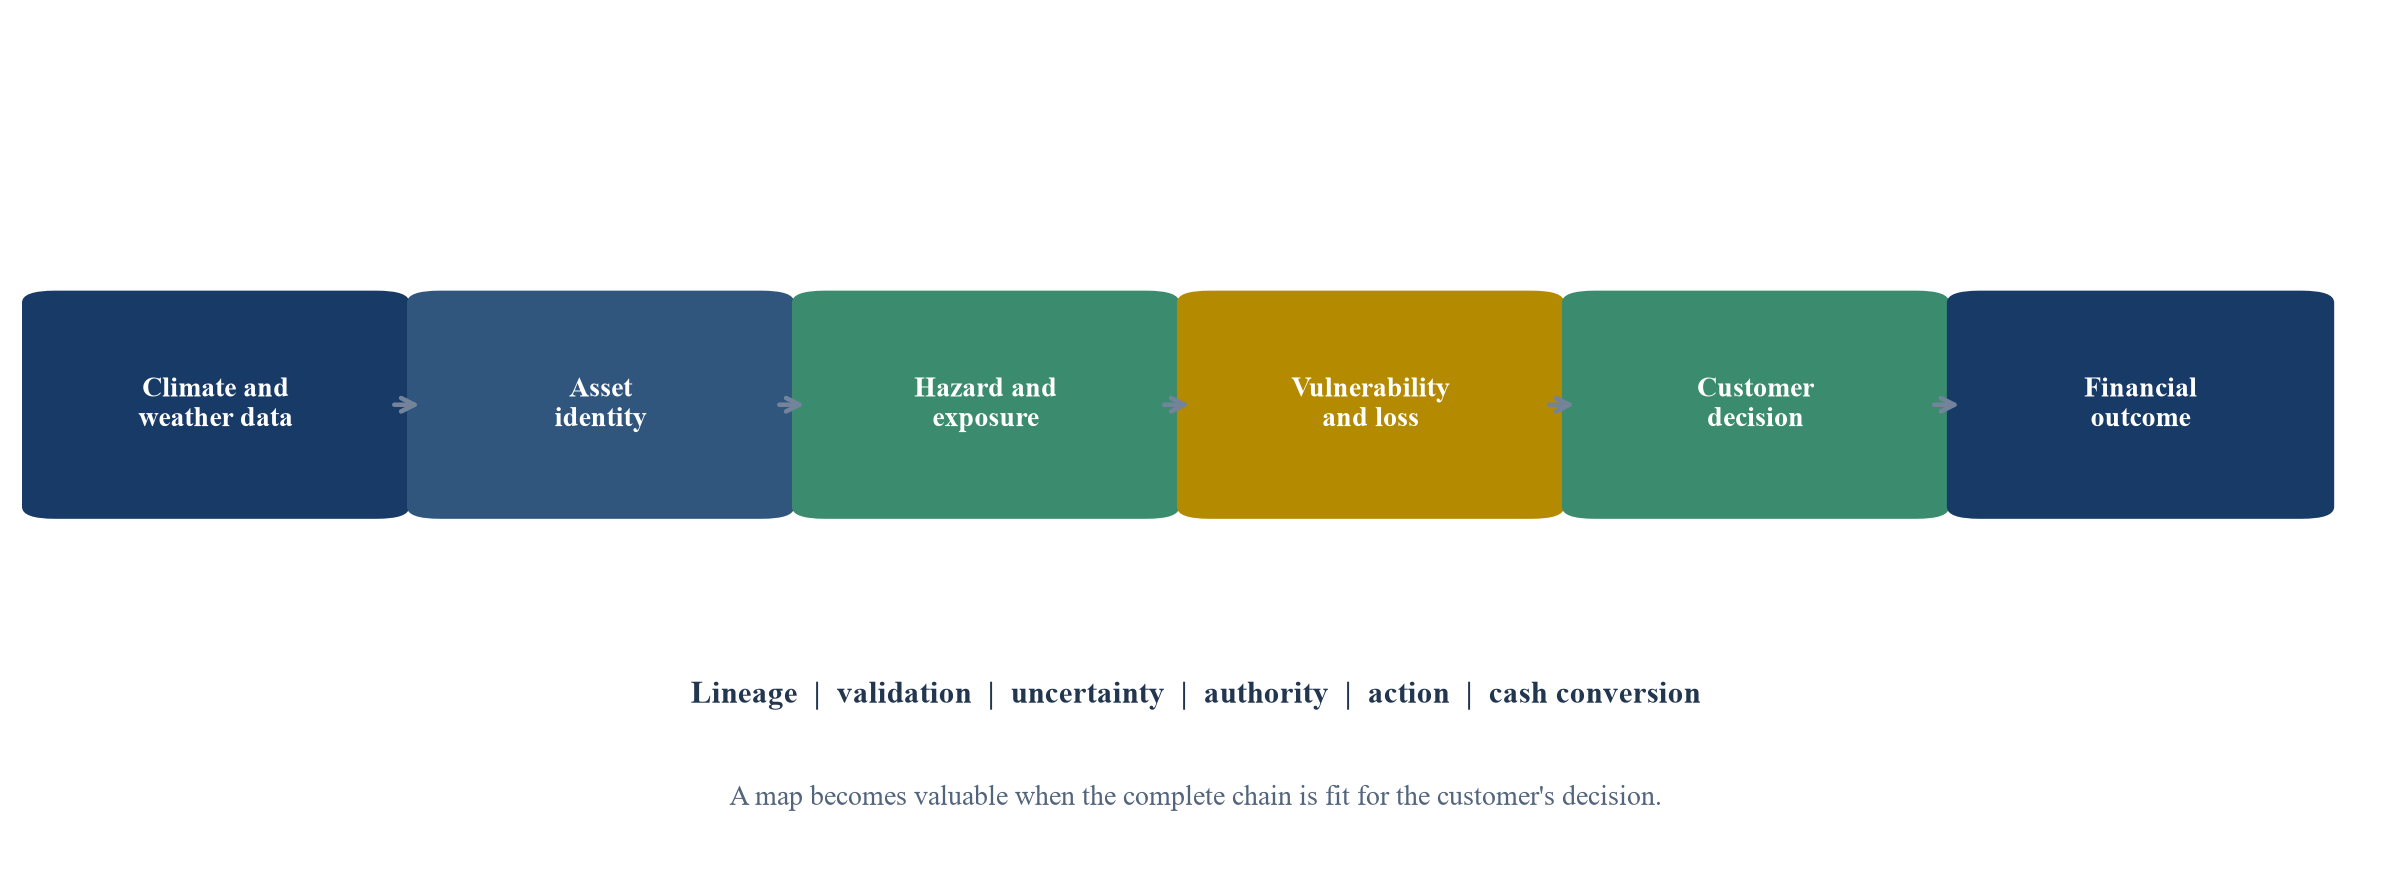
Transaction value requires traceability through each scientific and commercial layer.
5. Distinguish observations from projections
Observations, reanalysis, hindcasts and projections answer different questions. Observations describe measured conditions at stations or through remote sensing. Reanalysis combines observations with models to create consistent historical fields. Projections describe possible future conditions under scenarios and model assumptions. Mixing these layers can make a model appear more precise than its evidence.
The data register should identify source, version, spatial resolution, temporal resolution, coverage, update frequency, bias correction, downscaling and quality control. The World Meteorological Organization emphasises quality management and traceability for climate information and services [3]. The platform should preserve these attributes when data move through proprietary pipelines.
Customers need to understand what an output means. A return period, percentile, expected annual loss and scenario change are not interchangeable. The interface should show the relevant time basis and limitations. The acquirer should test whether sales material, APIs and reports use consistent definitions.
6. Test spatial resolution honestly
High nominal resolution can result from interpolation or statistical downscaling rather than dense local observation. A one-metre raster does not establish one-metre predictive accuracy. The platform should distinguish computational grid size from effective information content and explain which local features are represented.
Asset decisions can depend on elevation, drainage, construction, terrain, coastline, vegetation and urban form. Small geocoding errors may move a property across a flood boundary or place a rooftop asset on the ground. Validation should therefore include spatial alignment, footprint accuracy and sensitivity to plausible location error.
The acquirer should compare performance across urban, rural, coastal, mountainous and data-sparse regions. A global product may have uneven quality because underlying observations and local models differ. Geographic expansion should be valued after region-specific validation and customer acceptance rather than from map coverage alone.
7. Define the time horizon
Physical-risk decisions operate across horizons. Weather operations may require hours or days. Insurance and working-capital decisions may use annual horizons. Mortgage, infrastructure and real-estate decisions can extend for decades. Climate adaptation may span the remaining useful life of an asset.
The platform should map each model and scenario to the customer's decision horizon. A long-term shift in average conditions provides limited guidance for next year's claim frequency without additional modelling. A short historical record can underrepresent tail events. The horizon should also align with maintenance cycles, refinancing, lease expiry and planned capital works.
NGFS scenarios provide structured pathways for financial risk analysis, including chronic and acute physical-risk components, while documenting limitations and areas not captured [4][5]. The platform should present scenario outputs as conditional analysis, with uncertainty and alternative pathways visible.
8. Separate hazard from loss
Hazard intensity does not directly equal financial loss. Flood depth affects different buildings differently. Heat can reduce labour productivity, equipment efficiency or occupancy depending on design and operation. Wildfire exposure depends on vegetation, ignition, defence and construction. Vulnerability functions translate physical intensity into damage or disruption.
The acquirer should review the empirical basis, asset taxonomy, engineering assumptions, adaptation features and transferability of every material vulnerability model. Curves derived from one country, construction type or insurance portfolio may not transfer to another. Where data are sparse, expert judgement should be explicit and subject to challenge.
Loss outputs should identify direct damage, business interruption, supply-chain effects, insurance recovery and adaptation cost separately. Aggregating these effects without dependency modelling can double count or conceal material assumptions. Customer decisions require the component that they can influence.
Asset condition and operation can dominate the difference between hazard and loss. Two neighbouring facilities can face the same heat or flood intensity and experience different outcomes because of elevation, construction, maintenance, backup power, drainage, inventory placement and recovery planning. A platform that lacks these attributes should present a hazard view and avoid labelling the output as asset loss. The acquirer should test whether customer-supplied attributes are validated, updated and used consistently.
9. Validate against realised events
Event validation should begin with events that occurred after model development or were held out from calibration. The platform should reproduce the asset population and data available before the event, generate predictions and compare them with observed intensity, damage, disruption or claims. Retrospective use of revised data can overstate performance.
Validation should measure discrimination, calibration and decision utility. A model can rank high-risk assets correctly while overstating absolute probabilities. It can match regional losses while misclassifying individual properties. Metrics should reflect the customer threshold and consequence of false positives and false negatives.
The outcome record should include missing observations and uncertain claims. Reported loss data can be affected by insurance terms, reporting delays, repair choices and exposure value. Validation should state what was observed and what was estimated. Independent review is particularly important when the vendor selects events and metrics.
Back-testing should cover quiet periods as well as disasters. A model that correctly identifies damaged assets while flagging most of the portfolio creates costly false positives. Calibration should compare predicted and observed frequencies across risk bands. Decision analysis should estimate the cost of review, missed risk and unnecessary intervention at the customer's threshold. This connects statistical performance to operating value.
10. Test stability and sensitivity
Physical-risk models can be sensitive to climate dataset, scenario, downscaling, terrain, defence assumptions, vulnerability curve and asset attributes. The acquirer should vary material inputs and observe changes in rank, score, loss and customer action. Large unexplained changes indicate a fragile decision system.
Model updates also create discontinuity. A scientifically improved model can materially change asset scores, customer reports and portfolio trends. The platform should version outputs, explain changes and support restatement where customers need comparable history. Commercial teams should not present methodological change as evidence that physical risk suddenly changed.
The 2026 US interagency model-risk guidance emphasises risk-based validation, limitations, monitoring and appropriate use, including third-party models [9][10]. These principles provide a useful diligence frame even when a climate platform serves non-bank customers.
11. Govern model uncertainty
Uncertainty arises from emissions pathways, climate response, natural variability, observations, downscaling, hazard representation, vulnerability and customer data. A single score can hide these sources. The platform should show which uncertainty matters for the decision and avoid implying a level of precision that the evidence cannot support.
Useful communication may include ranges, confidence categories, scenario comparison, sensitivity and model agreement. The format should fit the user's expertise and workflow. A portfolio manager may need prioritisation bands. An engineer may need underlying intensity and assumptions. A board may need financial ranges and decision triggers.
Uncertainty should affect commercial claims. A platform should not guarantee avoided loss or exact future damage. The transaction model should distinguish revenue supported by decision utility from benefits that depend on precise predictions. Strong uncertainty governance can support customer trust and renewal even when outcomes remain probabilistic.
12. Control data and model lineage
The platform should maintain lineage from original data through cleaning, feature engineering, model execution, overlay, score and customer report. Every production output should be reproducible from versioned sources and code. Data licences, geographic restrictions and retention obligations should attach to the relevant layer.
Lineage becomes especially important when several vendors contribute hazard, building and economic data. A customer may have a contractual right to use a report while lacking a right to redistribute underlying data. A change of control may trigger consent or new fees. Diligence should map these dependencies to each material product and contract.
The acquirer should sample lineage for high-value customer decisions. It should confirm that the report, API and dashboard used the approved production model and the stated asset attributes. Manual corrections and expert overlays should remain visible with approver, reason and effect.
13. Classify the customer decision
Customer adoption should be measured by decision category. Screening identifies records for further review. Prioritisation ranks assets or counterparties. Underwriting changes terms or acceptance. Capital allocation changes investment. Adaptation changes physical assets or operations. Disclosure communicates exposure without necessarily changing action.
These uses have different value. A platform can be successful as an efficient screening tool even when its output is not suitable for engineering design. A lender may use it to request additional information rather than to decline credit. Valuation should follow the contracted and governed use rather than the most ambitious use shown in marketing.
The application register should record user, threshold, action, override, review and evidence. It should also record cases in which customers receive data without integrating it. Licence activation, login and report download provide limited evidence of decision use.
14. Observe the workflow
The acquirer should observe how customers use the platform. A risk team may export scores into a spreadsheet, combine them with asset value and send exceptions to local managers. An insurer may route high-risk locations to an underwriter. An owner may link scores to maintenance and capital planning. Each handoff can preserve or weaken the model's meaning.
Workflow diligence should test whether users understand thresholds, limitations and updates. It should inspect access rights, approvals, audit logs, exception queues and service response. Repeated manual intervention may be necessary and valuable, although it changes scalability and margin.
The platform should capture feedback. Customer corrections to asset identity, defences or operating conditions can improve the model. Rights and quality controls should govern this information. A closed feedback loop can become a durable advantage when it is systematic rather than dependent on individual analysts.
Workflow integration should survive personnel change. Diligence should test documentation, training, role coverage and automated interfaces. A product may appear embedded because one senior champion manually interprets reports. If that person leaves, renewal and decision use can decline. Evidence of distributed users, repeatable queues, system integration and management reporting supports a stronger retention case.
Table 2. Customer decisions and evidence of adoption
| Decision | Typical user | Required output | Strong adoption evidence |
|---|---|---|---|
| Screening | Portfolio risk team | Comparable hazard and confidence | Documented referral or review |
| Underwriting | Lender or insurer | Asset-level risk and limitations | Term, price or approval change |
| Site selection | Corporate development or operations | Multi-hazard comparison | Site shortlist or rejected option |
| Adaptation | Asset owner or engineer | Hazard, vulnerability and options | Approved project and completion |
| Capital planning | Finance and asset management | Financial exposure and timing | Budget allocation or sequencing |
| Disclosure | Sustainability and finance | Material exposure and methodology | Controlled reporting process |
Usage evidence should show a governed action, not only platform access.
15. Preserve human accountability
Climate models can support consequential decisions involving credit, insurance, employment, housing and infrastructure. The customer should retain authority and understand the basis for action. The platform should identify which decisions require human review and which outputs cannot support an automated adverse decision.
Override governance should capture reason and outcome. Frequent overrides may reveal missing local information, weak thresholds or limited trust. No overrides can also be concerning when users treat scores as authoritative without challenge. The acquirer should review a sample of accepted, rejected and overridden recommendations.
ISO/IEC 42001 provides an AI management-system framework [15]. The platform should connect its model inventory, risk classification, validation, incident handling and change control to actual customer uses. Governance that exists only in a policy document provides limited transaction evidence.
16. Translate risk into adaptation
The commercial value of physical-risk information increases when customers can identify feasible actions. Adaptation options can include drainage, flood barriers, cooling, water storage, vegetation management, equipment relocation, redundancy, insurance, supplier diversification and operating changes. The platform should separate risk identification from engineering recommendation.
ISO 14090 addresses principles and requirements for climate adaptation, while ISO 14091 covers vulnerability, impacts and risk assessment [13][14]. These standards support a structured process. They do not establish that a specific intervention is technically effective or economically justified.
The platform should record the decision owner, option, cost, implementation, residual risk and review date. A recommendation engine can add value through consistent prioritisation. Engineering design and assurance may require qualified specialists. Contracts and user interfaces should preserve this boundary.
17. Verify adaptation outcomes
Adaptation value should be tested against a defined baseline and mechanism. A flood barrier changes expected damage only when it has the right height, location, maintenance and closure procedure. Cooling investment changes heat exposure only when it operates during relevant conditions. Insurance transfers part of financial loss and does not remove physical disruption.
Outcome validation can use engineering acceptance, operational tests, event performance, avoided downtime and insurance evidence. Long return periods mean a lack of loss after installation does not prove effectiveness. Where direct observation is unavailable, the platform should state the modelled basis and uncertainty.
The transaction model should avoid counting the same benefit as avoided damage, lower insurance cost, increased availability and higher asset value without reconciliation. The finance-approved outcome should identify cash timing and the party receiving value.
18. Connect to financial reporting
IFRS S2 requires disclosures about climate-related risks and opportunities that could reasonably affect prospects, including physical risks, governance, strategy, risk management, metrics and targets [6]. It also requires climate-related scenario analysis to inform resilience assessment. Platform outputs can support these processes when methodology, assumptions and uncertainty are transparent.
A software output does not determine materiality or satisfy reporting obligations by itself. Management remains responsible for the entity's assessment, controls and disclosures. The acquirer should test whether customers use the platform as one evidence source or present its results without effective challenge.
The platform should support connections to financial position, performance and cash flow. Asset-level scores need aggregation rules, exposure values and time horizons. Disclosures should distinguish measured data, estimates and scenarios. Customer dependence on bespoke reporting can create revenue and service obligations that should be reflected in margins.
Consistency controls are important when outputs feed several reports. The same asset population, scenario and method should reconcile across board risk papers, financial disclosures, lender submissions and adaptation budgets unless differences are documented. The platform should preserve reporting snapshots and methodology versions. This capability can support auditability and customer retention, while creating storage, support and change-management obligations.
19. Support lending and insurance decisions
Lenders and insurers need physical-risk information that fits underwriting, pricing, limits, collateral review, portfolio monitoring and stress testing. The EBA's final ESG-risk guidelines require institutions to identify, measure, manage and monitor ESG risks across relevant horizons [7]. The ECB's economy-wide climate work illustrates the integration of address-level physical-risk information with firm and financial data [11].
The platform should show how its outputs enter policy and authority. A high-risk score may trigger inspection, additional data, insurance requirements, covenant changes or pricing. It should not silently determine a credit or coverage decision beyond its validated purpose.
Validation should reflect the institution's portfolio, geography and product. Vendor models remain subject to customer governance. The acquirer should assess whether regulated customers can obtain sufficient documentation, monitoring and audit access to meet their obligations.
20. Protect customer and geospatial data
Asset portfolios can reveal strategic locations, values, security exposure, supplier networks and investment plans. The platform should classify customer data, limit access and control exports. Critical infrastructure and defence-related records may require enhanced restrictions. Personal data can arise through property ownership, tenancy or employee-location records.
Security diligence should cover cloud architecture, identities, encryption, logging, incident response, backup, recovery, subcontractors and development practices. Geospatial APIs and bulk exports require rate and entitlement controls. A breach can affect customers even when the underlying climate data are public.
The transaction model should include data-licence, security and localisation costs. Customer contracts should define permitted use, derived outputs, retention, return and deletion. Product analytics should avoid reusing confidential portfolio information without an agreed basis.
21. Measure recurring service intensity
Physical-risk products often require asset cleansing, hazard interpretation, scenario workshops, portfolio aggregation and customer-specific reporting. These services can improve outcomes and retention. They also affect gross margin, capacity and the meaning of recurring revenue. Diligence should allocate delivery hours by customer, product and renewal period.
The acquirer should distinguish standard onboarding, recurring support, professional services and product development. Work performed by climate scientists or senior analysts may be difficult to scale. A high subscription margin can be overstated when implementation and interpretation costs are recorded elsewhere.
Service intensity can become a competitive advantage if it produces reusable tools, training and workflow integration. Evidence includes declining hours per asset, standard playbooks, customer self-service and stable outcome quality. The valuation should reflect demonstrated operating leverage rather than assumed automation.
22. Test revenue quality
Revenue quality depends on contract scope, renewal, usage, expansion, concentration, price, collection and delivery obligation. Multi-year contracts can provide visibility while containing termination, data-availability or methodology clauses. Customers may purchase climate analytics for a disclosure cycle and reduce use after the initial project.
Cohort analysis should compare contracted annual recurring revenue, recognised revenue, cash, gross retention, net retention and service cost. It should separate regulated financial institutions, insurers, corporates, real estate, infrastructure and government because buying cycles and validation demands differ.
The acquirer should trace expansion to a customer decision. More assets can reflect portfolio growth, product adoption or simple data loading. Cross-sell into adaptation or monitoring has stronger evidence when customers integrate the output and renew after use.
Price analysis should distinguish access, assets, hazards, users, API volume and advisory work. Discounting can hide weak willingness to pay when marginal data cost is low but service effort is high. Renewal discussions, competitive replacements and procurement records can reveal which capabilities customers value. The acquirer should also test whether new regulation accelerated temporary demand or established a continuing control requirement.
23. Govern third-party dependencies
Climate platforms depend on public agencies, academic datasets, commercial vendors, cloud services, mapping providers and specialist models. The dependency register should identify licence, territory, purpose, derivative rights, service level, update cycle, cost, substitution and change-of-control terms.
A critical dataset can be freely available today and change access or format later. A commercial model can prohibit benchmarking or redistribution. The acquirer should test whether outputs can continue if a supplier ends service and whether replacement changes customer reports.
Vendor concentration should enter the integration plan. Combining the target with a buyer's existing data stack may create savings, coverage gaps or contractual conflicts. Synergy should include migration, revalidation and customer notification costs.
24. Address scientific and commercial change
Climate science, observations, regulation and customer needs continue to evolve. Model governance should define update triggers, validation, release approval and customer communication. Material changes should preserve historical outputs or provide a controlled restatement.
Commercial teams need discipline when science changes. A new hazard dataset can improve accuracy and alter risk ranks. Customers should receive an explanation of methodology, effect and required action. Silent changes weaken trust and can create reporting inconsistency.
The product roadmap should connect research to customer decisions. Experimental models can be valuable, although they should remain labelled and outside production authority until validated. The acquirer should separate research capability from contracted production readiness.
25. Apply accounting and valuation discipline
IFRS 13 defines fair value using market-participant assumptions [18]. A platform valuation should assess identifiable technology, data rights, customer relationships and contracts alongside workforce and integration capability. Map coverage and model count provide weak evidence without legal rights and cash conversion.
IAS 38 governs intangible assets and distinguishes research from development [17]. Proprietary methods, software and databases require evidence of control, future economic benefits and measurement. Public data can support a valuable product without itself becoming an owned intangible asset.
IFRS 15 governs revenue from customer contracts [16]. Subscriptions, licences, data, implementation and services may have different performance obligations. Estimated customer loss reduction is not platform revenue. The transaction model should reconcile contract entitlement, delivery, recognition and cash.
Valuation scenarios should separate the installed customer base, evidenced expansion, validated new geographies and research pipeline. Each layer has a different probability, investment requirement and time to cash. Synergy should account for data migration, model validation, customer consent, product integration and retained specialist staff. A gross cross-sell assumption without these costs overstates accessible value.
Table 3. Hypothetical valuation bridge for a physical-risk AI platform
| Stage | Annual customer value | Buyer revenue and synergy | Principal adjustment |
|---|---|---|---|
| Management case | 9.6 | 6.4 | Full scored population and proposed use |
| Asset and data gate | 8.1 | 5.5 | Identity, rights and data completeness |
| Scientific validation | 6.7 | 4.4 | Hazard, vulnerability and uncertainty |
| Workflow adoption | 5.4 | 3.5 | Decision integration and human review |
| Persistence and cash conversion | 4.5 | 2.7 | Outcome, service cost, renewal and collection |
Values in USD millions are illustrative management assumptions created only to demonstrate evidence gates.
26. Construct a hypothetical platform
Consider a wholly hypothetical physical-risk AI business with 2.4 million scored assets, 86 enterprise customers and USD 14.8 million of annual recurring revenue. Management identifies USD 9.6 million of annual customer value and USD 6.4 million of buyer revenue and synergy from expanded distribution, product integration and lower data cost.
The asset gate retains 1.8 million records with reliable identity and attributes. Scientific validation retains 1.4 million records across supported hazard, geography and asset combinations. Workflow review identifies 1.1 million decision-ready assets and 49 customers with traceable action. The remaining population may still support screening or future development, although it does not support the same valuation claim.
After outcome, persistence, service-cost and cash-conversion adjustments, the framework retains USD 4.5 million of customer value and USD 2.7 million of buyer revenue and synergy. Every amount is a hypothetical management assumption. The case demonstrates method and does not describe an actual company, transaction or market benchmark.
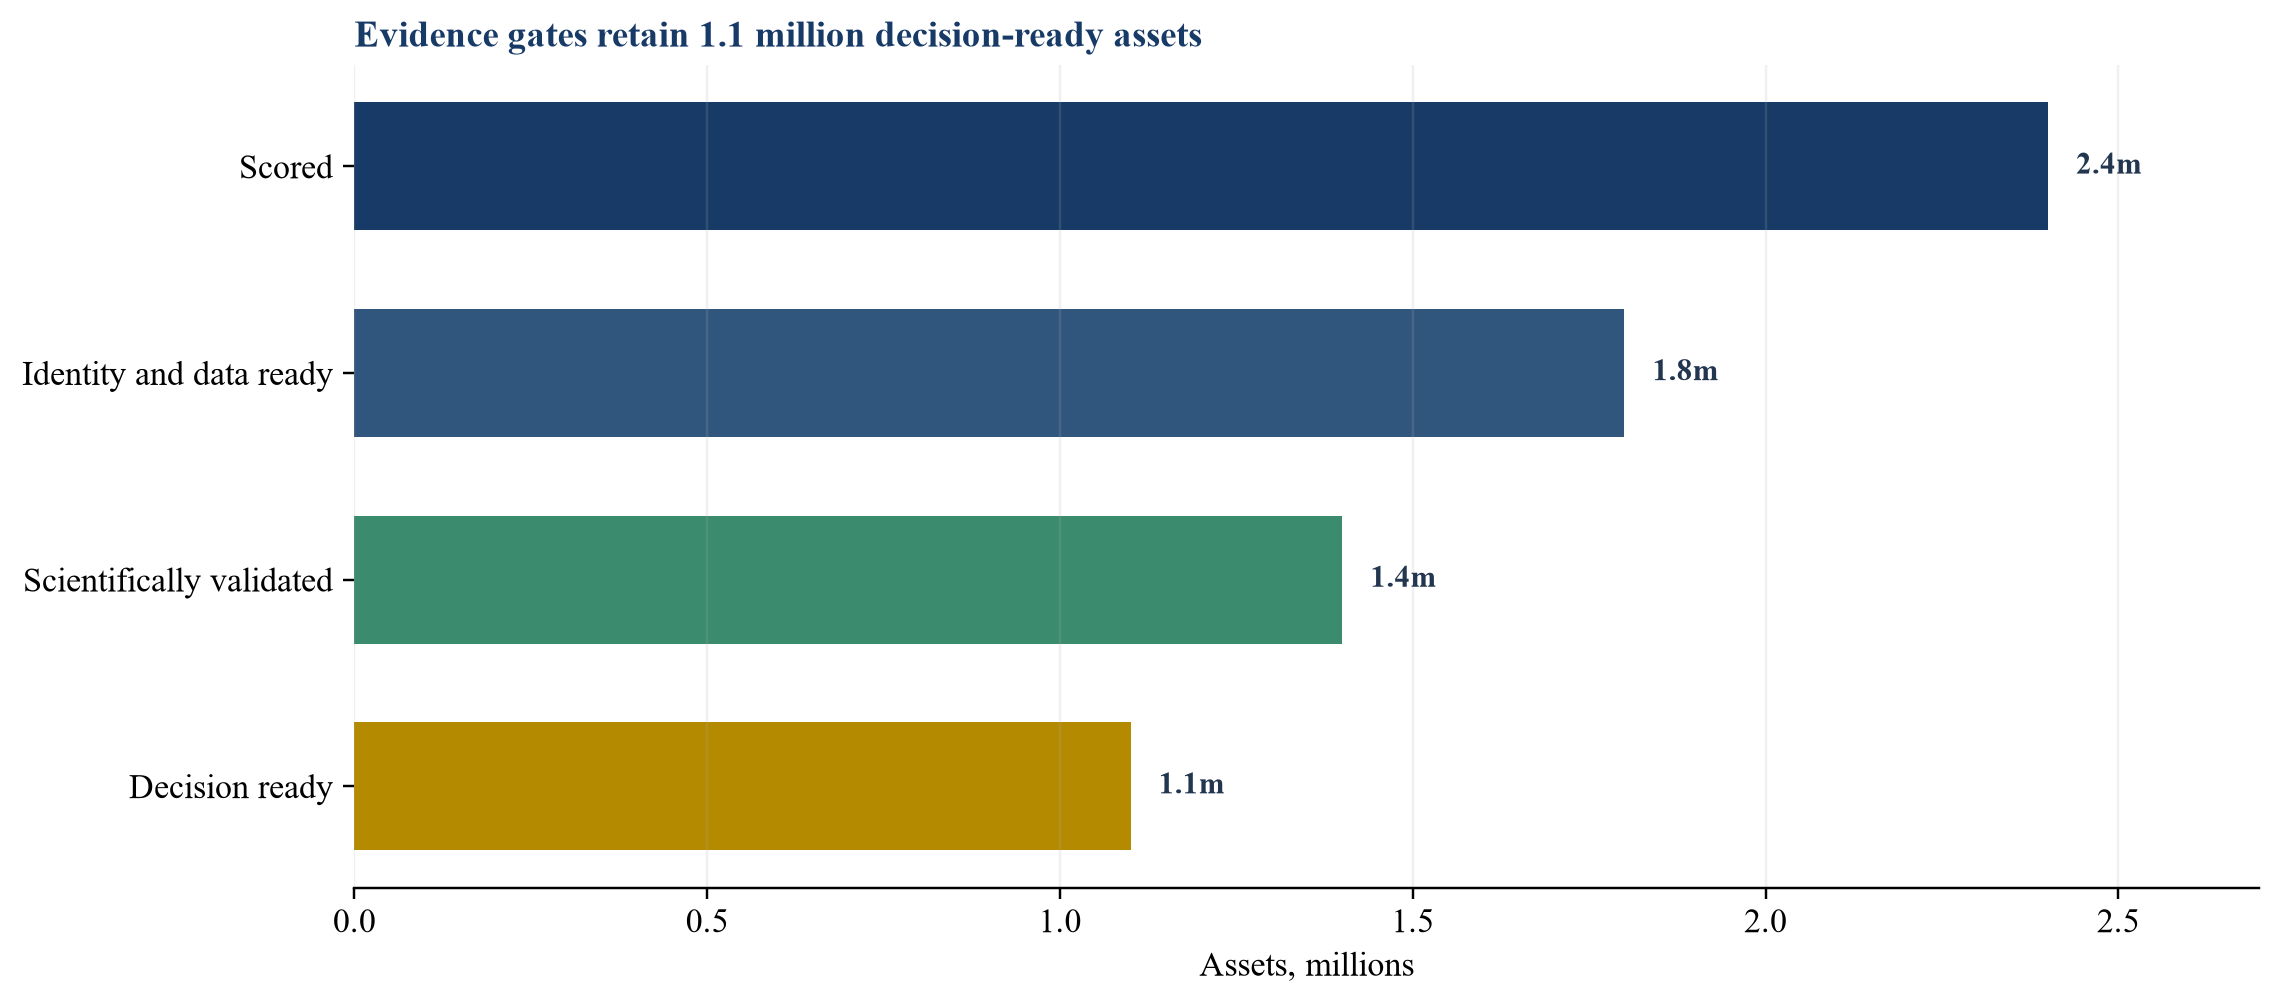
Counts in millions are illustrative management assumptions.
27. Translate evidence into price and terms
Validated production capability can support value at signing. Unvalidated geographic expansion, new hazards and proposed customer decisions can be funded through milestones. This allocation aligns consideration with the evidence needed to realise the plan.
Milestones can reference asset matching, independent validation, regulated-customer approval, workflow adoption, renewal, gross margin and cash collection. They should avoid metrics that management can increase without customer value, such as raw scored-asset counts or model releases.
Representations should address data rights, methodology, validation, customer use, incidents, intellectual property, dependencies and regulatory claims. Holdbacks, escrows and indemnities can address defined exposures. The buyer should retain investment capacity for data replacement, model revalidation and integration.
28. Build the diligence request
The diligence request should include product architecture, source and licence register, model inventory, validation reports, event back-tests, asset-matching metrics, vulnerability methods, uncertainty policy, customer workflows, override logs, outcome studies, contracts, cohorts, service hours, security assessments and financial model.
Sampling should follow value and risk. The team should inspect the largest customers, highest-value decisions, least-observed geographies, material hazards and models supporting regulated use. It should reproduce selected scores from source data and trace them through customer action.
Exceptions should record owner, consequence, remediation, cost, timing and deal response. A missing licence may be a condition precedent. Weak validation may require a milestone. Bespoke service intensity may reduce margin. The investment committee should see these effects in the valuation model.
Customer reference work should test decision use rather than satisfaction alone. Questions should cover the original problem, alternatives considered, implementation, model limitations, overrides, actions, outcomes, renewal rationale and switching cost. References selected by management can be supplemented with contract and support evidence across the broader cohort. Confidentiality obligations should be respected throughout the process.
Table 4. Physical-risk platform diligence and deal response
| Workstream | Priority evidence | Typical exception | Possible response |
|---|---|---|---|
| Asset data | Match confidence and footprint audit | Postal centroid used for site | Restrict use; remediate population |
| Hazard model | Method, observations and back-test | Weak local validation | Milestone before geography value |
| Vulnerability | Asset taxonomy and loss function | Curve transferred across asset class | Recalibrate; adjust benefit |
| Workflow | Decision, authority and override log | Scores downloaded without action | Reduce adoption case |
| Revenue | Contracts, cohorts and service hours | Subscription depends on bespoke work | Recast margin and capacity |
| Dependencies | Rights and continuity register | Critical vendor lacks change-of-control right | Consent, replacement or holdback |
Each exception should connect to a decision, cash-flow effect and owner.
29. Execute the first one hundred days
Days one to thirty should establish control. The buyer should freeze uncontrolled model changes, confirm data and licence rights, inventory production models, reconcile customer assets and identify critical continuity dependencies. High-risk customer claims should receive immediate review.
Days thirty-one to sixty should validate the highest-value decisions. The team should reproduce asset identity, model output, customer threshold, action and financial outcome for selected cohorts. It should reconcile service hours, renewal and cash and remove unsupported value claims.
Days sixty-one to one hundred should implement the target operating model. Priorities include model governance, update communication, customer workflow controls, security, feedback, adaptation evidence and board reporting. Management should report decision-ready assets, adopted workflows, validated outcomes, revenue quality and unresolved limitations separately.
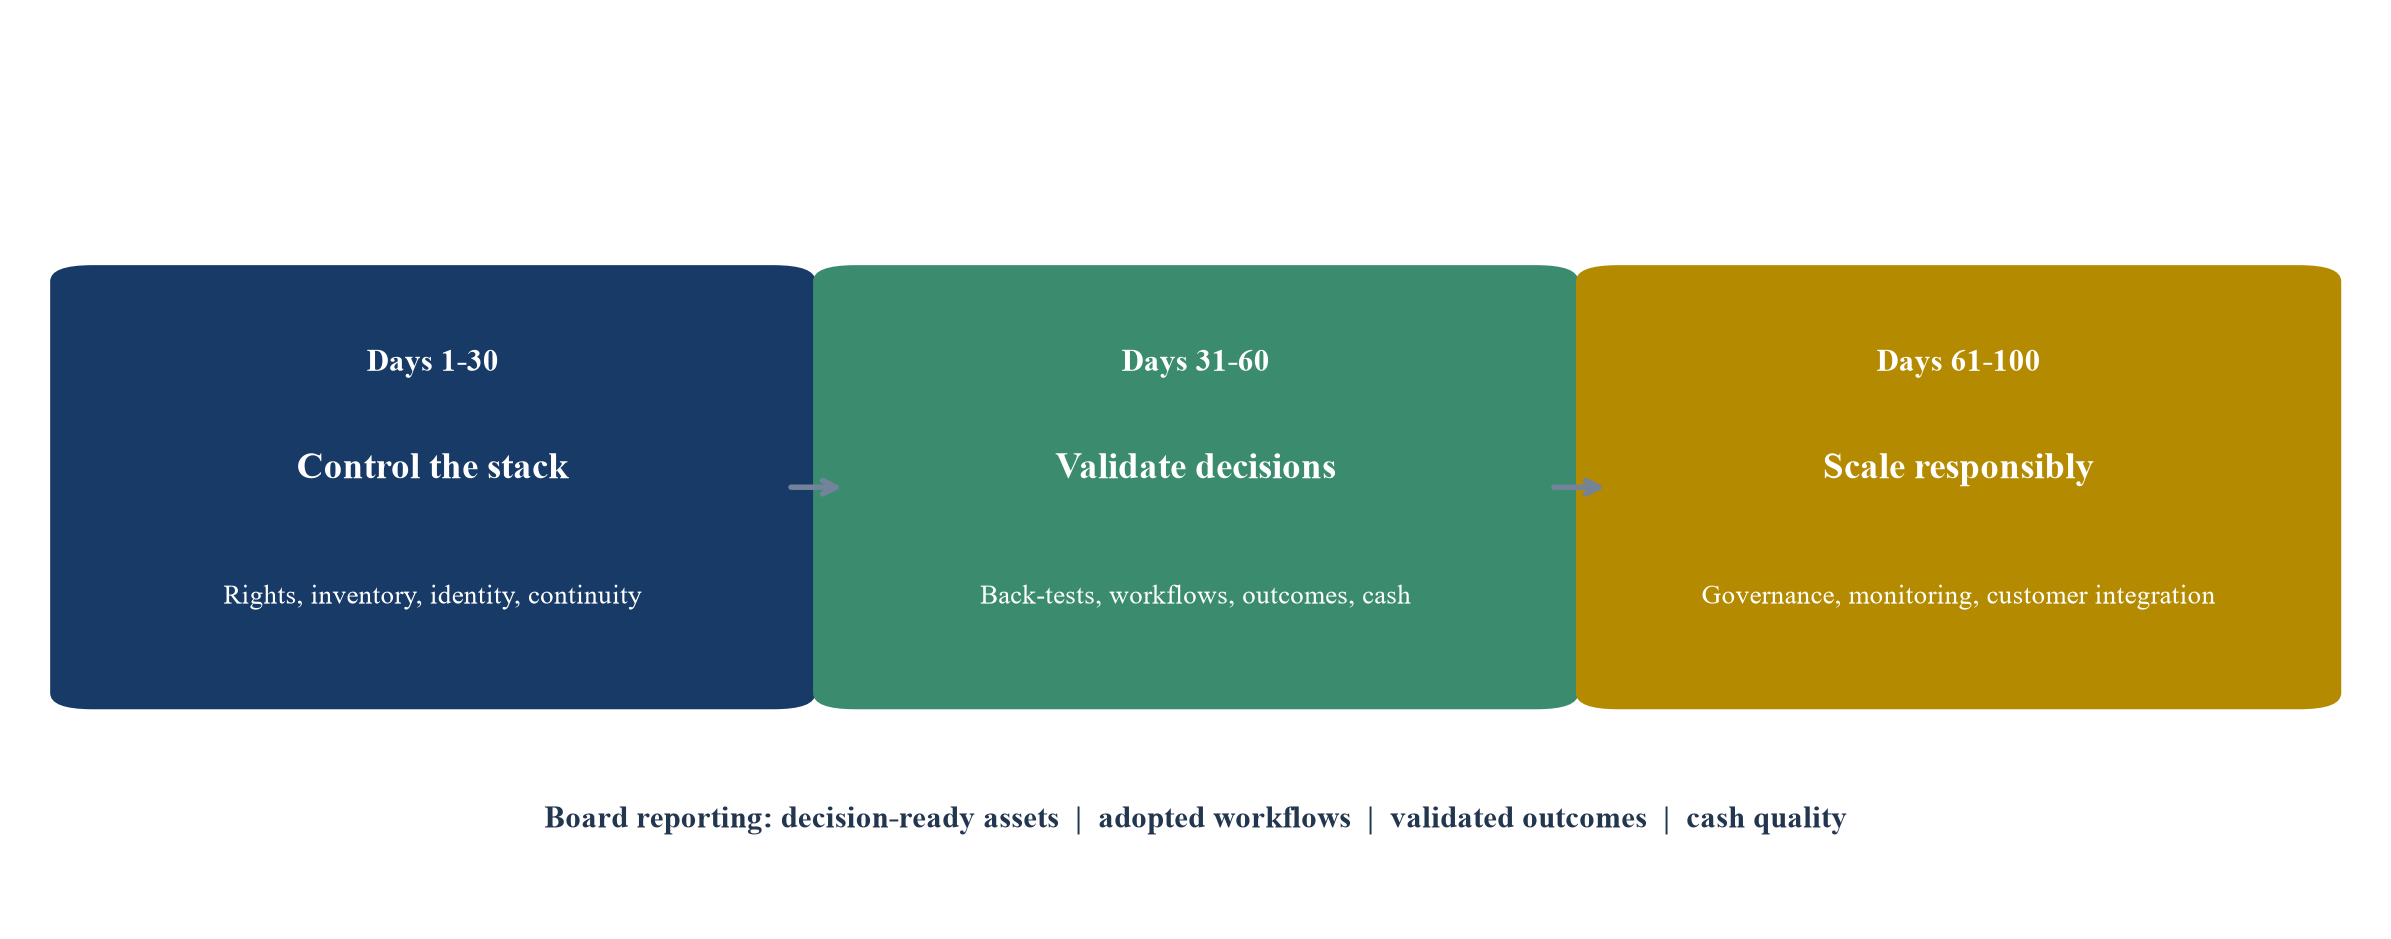
The sequence establishes evidence and control before product expansion.
30. Recognise limitations and conclude
This framework does not validate a specific climate model, platform or transaction. Fitness depends on hazard, geography, asset class, time horizon, customer decision and available evidence. Climate models describe uncertain futures and can change as science and observations improve. Current specialist advice is required for scientific, engineering, legal, regulatory, accounting and valuation decisions.
The hypothetical case does not estimate market demand, likely loss reduction or transaction value. Customer outcomes can be affected by weather, asset condition, adaptation, insurance, operating behaviour and external events. An absence of loss does not prove model accuracy or adaptation effectiveness.
The available evidence will remain uneven. Dense observations, insurance claims and detailed building attributes exist in some markets and are limited or commercially restricted in others. Validation techniques should adapt to the evidence while preserving disclosure of limitations. A platform can still create decision value in a data-sparse market through screening, uncertainty-aware prioritisation and structured information collection. The permitted claim should match the evidence actually available.
Buyers should also recognise the organisational dimension of model risk. Scientific teams, product managers, customer specialists and commercial staff may use different language for the same output. A shared model inventory, decision taxonomy and exception process can reduce miscommunication. Board reporting should identify where models support a decision, where expert review remains necessary and where evidence is insufficient for the proposed use.
Long-term physical risk does not remove the need for near-term commercial evidence. Renewal, adopted workflow, customer reference, service effort and collected cash can be observed today. These measures should be connected to scientific quality without using them as substitutes for it. A strong valuation case demonstrates both technical fitness and customer willingness to keep paying for the decision capability.
The practical conclusion is that transaction value sits beyond the climate map. A defensible platform identifies assets correctly, uses appropriate science, validates vulnerability and uncertainty, integrates with governed customer decisions and demonstrates durable economic outcomes at scalable service cost. That evidence allows an acquirer to distinguish a useful decision system from a visually persuasive dataset.
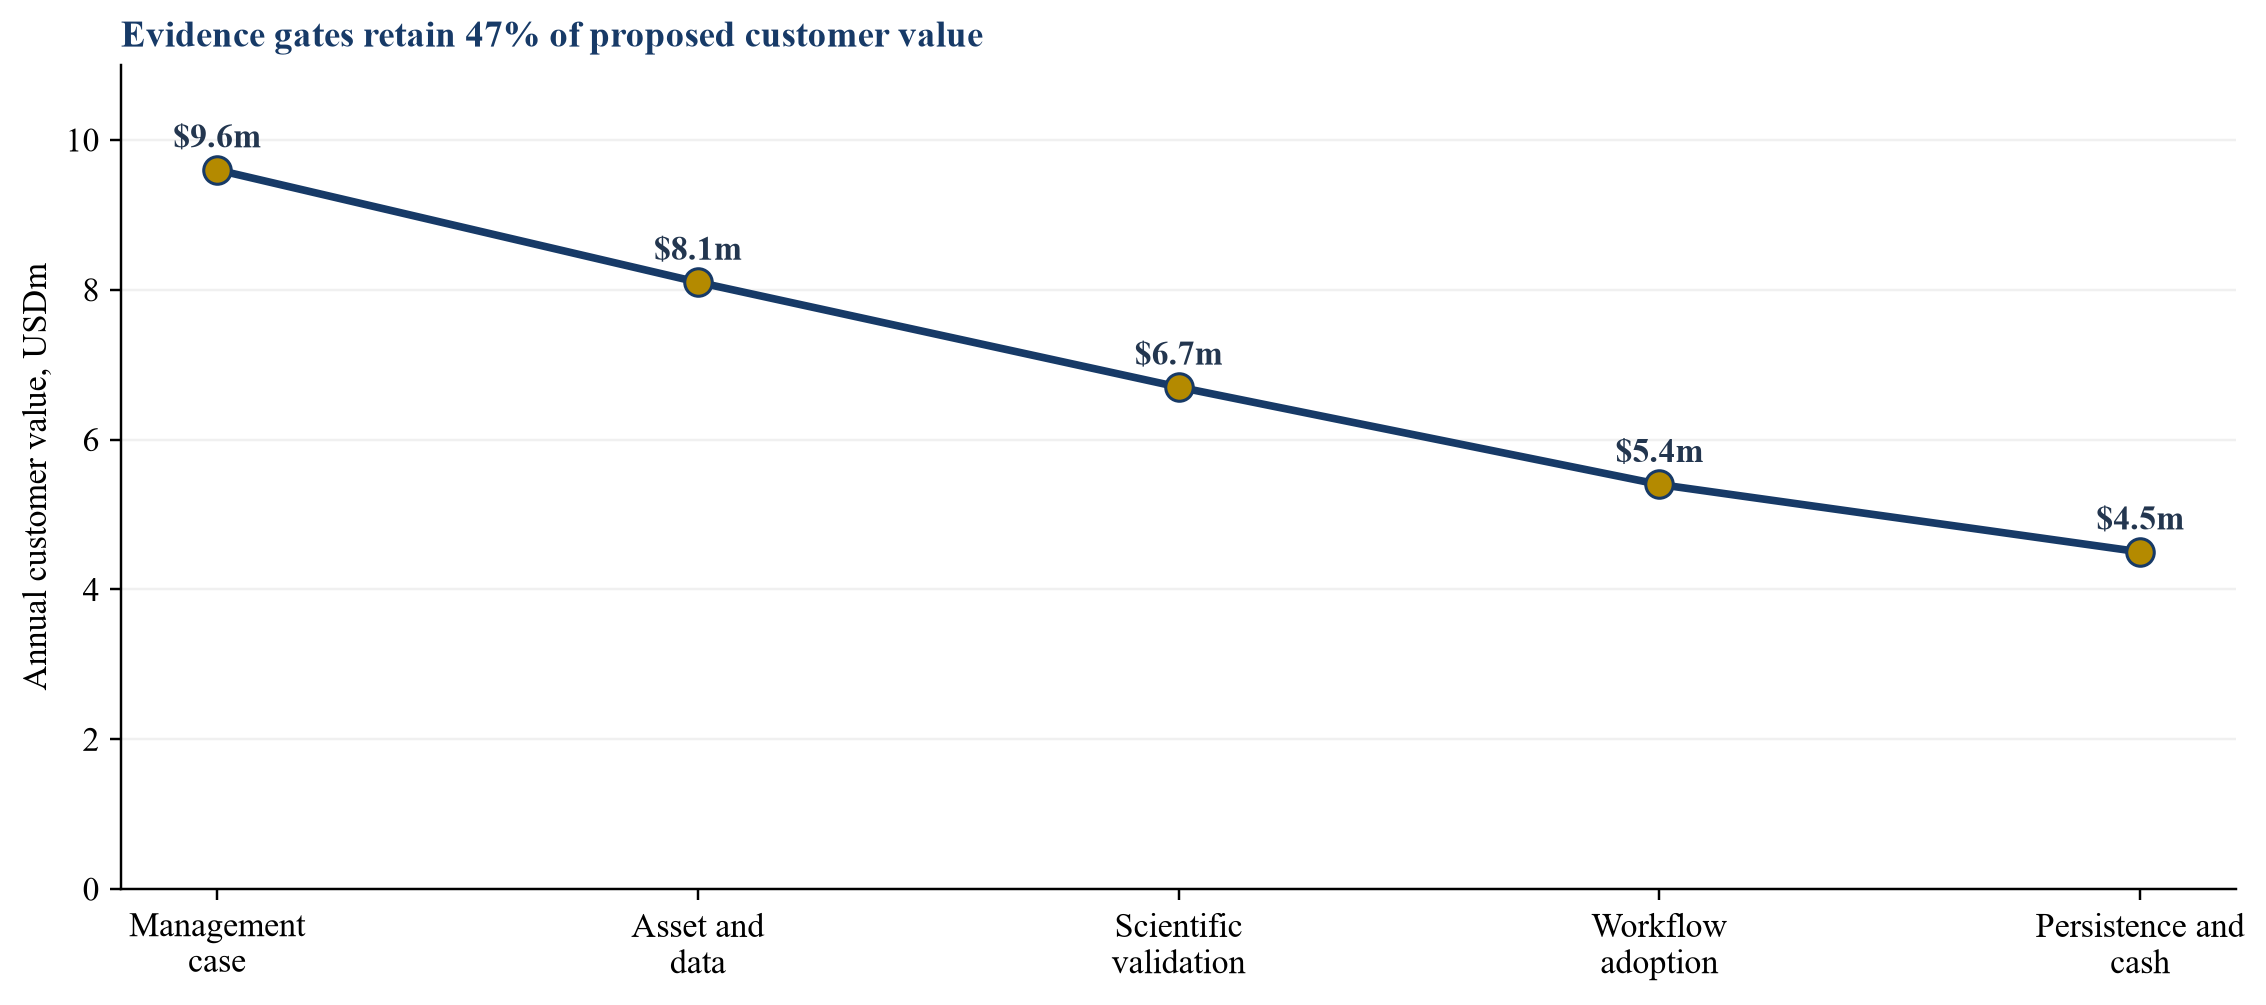
Values in USD millions are illustrative management assumptions.
References
- Intergovernmental Panel on Climate Change. Sixth Assessment Report Working Group I Fact Sheets. https://www.ipcc.ch/report/ar6/wg1/resources/factsheets/
- Intergovernmental Panel on Climate Change. AR6 Synthesis Report. https://www.ipcc.ch/report/ar6/syr/
- World Meteorological Organization. Technical Regulations and climate-information quality principles. https://library.wmo.int/
- Network for Greening the Financial System. Climate Scenarios Technical Documentation, 2024. https://www.ngfs.net/system/files/2025-01/NGFS%20Climate%20Scenarios%20Technical%20Documentation.pdf
- Network for Greening the Financial System. Physical risks in the updated Climate Impact Explorer, 2025. https://www.ngfs.net/system/files/2025-11/Physical%20risks%20in%20the%20updated%20Climate%20Impact%20Explorer.pdf
- IFRS Foundation. IFRS S2 Climate-related Disclosures. https://www.ifrs.org/issued-standards/list-of-standards/ifrs-s2-climate-related-disclosures/
- European Banking Authority. Final Guidelines on the management of ESG risks, 2025. https://www.eba.europa.eu/sites/default/files/2025-01/fb22982a-d69d-42cc-9d62-1023497ad58a/Final%20Guidelines%20on%20the%20management%20of%20ESG%20risks.pdf
- European Environment Agency. European Climate Risk Assessment, 2024. https://www.eea.europa.eu/en/analysis/publications/european-climate-risk-assessment
- Board of Governors of the Federal Reserve System. Revised Guidance on Model Risk Management, SR 26-2, 2026. https://www.federalreserve.gov/supervisionreg/srletters/SR2602.htm
- Board of Governors of the Federal Reserve System. Supervisory Guidance on Model Risk Management. https://www.federalreserve.gov/frrs/guidance/supervisory-guidance-on-model-risk-management.htm
- European Central Bank. ECB economy-wide climate stress test. https://www.ecb.europa.eu/pub/pdf/scpops/ecb.op281~05a7735b1c.en.pdf
- Copernicus Climate Change Service. Climate Data Store and documentation. https://cds.climate.copernicus.eu/
- International Organization for Standardization. ISO 14090:2019 Adaptation to climate change. https://www.iso.org/standard/68507.html
- International Organization for Standardization. ISO 14091:2021 Vulnerability, impacts and risk assessment. https://www.iso.org/standard/68508.html
- International Organization for Standardization. ISO/IEC 42001:2023 Artificial intelligence management system. https://www.iso.org/standard/81230.html
- IFRS Foundation. IFRS 15 Revenue from Contracts with Customers. https://www.ifrs.org/issued-standards/list-of-standards/ifrs-15-revenue-from-contracts-with-customers/
- IFRS Foundation. IAS 38 Intangible Assets. https://www.ifrs.org/issued-standards/list-of-standards/ias-38-intangible-assets/
- IFRS Foundation. IFRS 13 Fair Value Measurement. https://www.ifrs.org/issued-standards/list-of-standards/ifrs-13-fair-value-measurement/
- National Institute of Standards and Technology. AI Risk Management Framework. https://www.nist.gov/itl/ai-risk-management-framework
- National Oceanic and Atmospheric Administration. Climate data and services. https://www.noaa.gov/climate
About the Author
Chennakeshav (CK) is a corporate finance and investment banking executive with 25+ years of global experience in deal origination, structuring and execution across M&A, growth capital and corporate strategy. He has led value-creation mandates for founders, corporates and funds — bridging the boardroom view to hands-on execution and close.
His career spans Morgan Stanley, HSBC, Lloyds Banking Group, EWEC, ADQ portfolio companies and Emirates Growth Fund, across TMT, real estate, fintech, deeptech, cleantech, infrastructure and energy. He has partnered with C-suite leaders, private equity and venture funds, sovereign wealth funds and family offices to finance complex fund raises and scale-up ventures, and has led M&A due diligence, post-merger integration and business-transformation initiatives to create value.
At Matchpoint Partners he is Managing Partner, leading the firm's corporate finance, M&A and capital-raising practice. He holds an MBA from London Business School, an engineering degree from VTU and a Master of Laws (LLM, in progress) from UCL London.
An active start-up mentor, CK mentors at Techstars, DIFC FinTech Hive, Startup Grind, Founder Institute and IN5, serves as Entrepreneur Mentor in Residence (EMiR) at London Business School, and judges the Entrepreneurship World Cup.
https://www.linkedin.com/in/ckadya/
https://www.matchpoint-partners.com/team/ck-adya.html
This paper is part of a continuing series on the structure of private and alternative markets. The views expressed are the author's own. The paper is for information only, describes market structure in general terms, and does not constitute investment, legal, tax or regulatory advice or a recommendation in respect of any security, vehicle or counterparty.
