
1. The investment decision covers a system
The labels blue and green hydrogen describe broad production routes. Blue hydrogen usually refers to hydrogen made from natural gas with carbon capture and storage. Green hydrogen usually refers to electrolysis using renewable electricity. The labels do not specify the actual gas source, methane emissions, capture boundary, electricity provenance, operating profile, transport route, storage system or product delivered to the buyer.
An investment committee therefore needs a common unit of comparison. That unit should be one kilogram of hydrogen delivered at an agreed pressure, purity, location and reliability, with lifecycle emissions calculated under the same methodology and cost measured over the same period. Comparing a plant-gate estimate for one route with a delivered estimate for another creates a false ranking.
The decision also has a time dimension. A project can satisfy a standard at financial close and face tighter rules later. Gas and electricity prices can move differently. CO2 transport and hydrogen networks can arrive late. The analysis should show how each route performs during construction, early operation, steady state and contract renewal.
2. Colour is an incomplete risk descriptor
Blue hydrogen has several technical configurations. Steam methane reforming and autothermal reforming create different process-emission profiles and capture opportunities. Capture can cover concentrated process CO2, combustion emissions, or both. The plant can use pipeline gas, liquefied natural gas or a dedicated supply. Each choice affects emissions, cost and infrastructure.
Green hydrogen also has several configurations. An electrolyser can use co-located renewable generation, a portfolio of power purchase agreements, grid electricity with qualifying attributes, or a hybrid. Solar, wind and firm low-carbon electricity produce different operating profiles. Storage and grid access determine whether hydrogen deliveries can remain stable.
Investors should replace colour-based assumptions with measurable variables. The blue route requires measured gas-chain methane intensity, actual capture rate by emission source, residual combustion emissions and permanent CO2 storage. The green route requires hourly electricity source, delivered power price, electrolyser efficiency, compliant utilisation and treatment of grid imports. Both routes require evidence for water, compression, hydrogen leakage, transport and buyer use.
3. Official standards increasingly use lifecycle boundaries
The European Commission's renewable-hydrogen framework requires lifecycle greenhouse-gas savings and sets additionality, temporal-correlation and geographic-correlation conditions for qualifying electricity [1, 2]. The Commission's 2025 methodology for low-carbon fuels considers upstream methane emissions and actual carbon capture rates, rather than relying on the production label [3].
The United Kingdom Low Carbon Hydrogen Standard version 4 requires supported producers to calculate emissions to the point of production, meet an emissions-intensity threshold of 20 grams of carbon dioxide equivalent per megajoule on a lower-heating-value basis, and maintain data and monitoring procedures [4]. The standard supplies separate calculation routes for electrolytic production and fossil-gas reforming with carbon capture.
The United States section 45V framework uses the 45VH2-GREET model to calculate well-to-gate emissions and tiers support by carbon intensity [5, 6]. These systems differ in boundary, eligibility and accounting detail. Their common direction is important for finance: project value depends on auditable emissions performance, not a colour name.
4. The common boundary begins before the plant
A blue-hydrogen analysis begins with natural-gas production, processing and transport. Methane can be released through leaks, venting, incomplete flaring and equipment operation. The emissions factor depends on the producing basin, operator performance, processing, pipeline distance and any liquefaction and regasification.
A green-hydrogen analysis begins with electricity generation and delivery. The relevant emissions depend on the generating asset, commissioning date, location, time of production, grid interaction and applicable certificate rules. An annual renewable certificate can produce a different lifecycle result from hourly matched generation.
Both routes also need construction materials, water treatment, auxiliary power, compression and hydrogen handling. A decision model can group minor sources when the governing methodology permits, while keeping every material and eligibility-critical source visible. The boundary should be documented before cost or emissions are calculated.
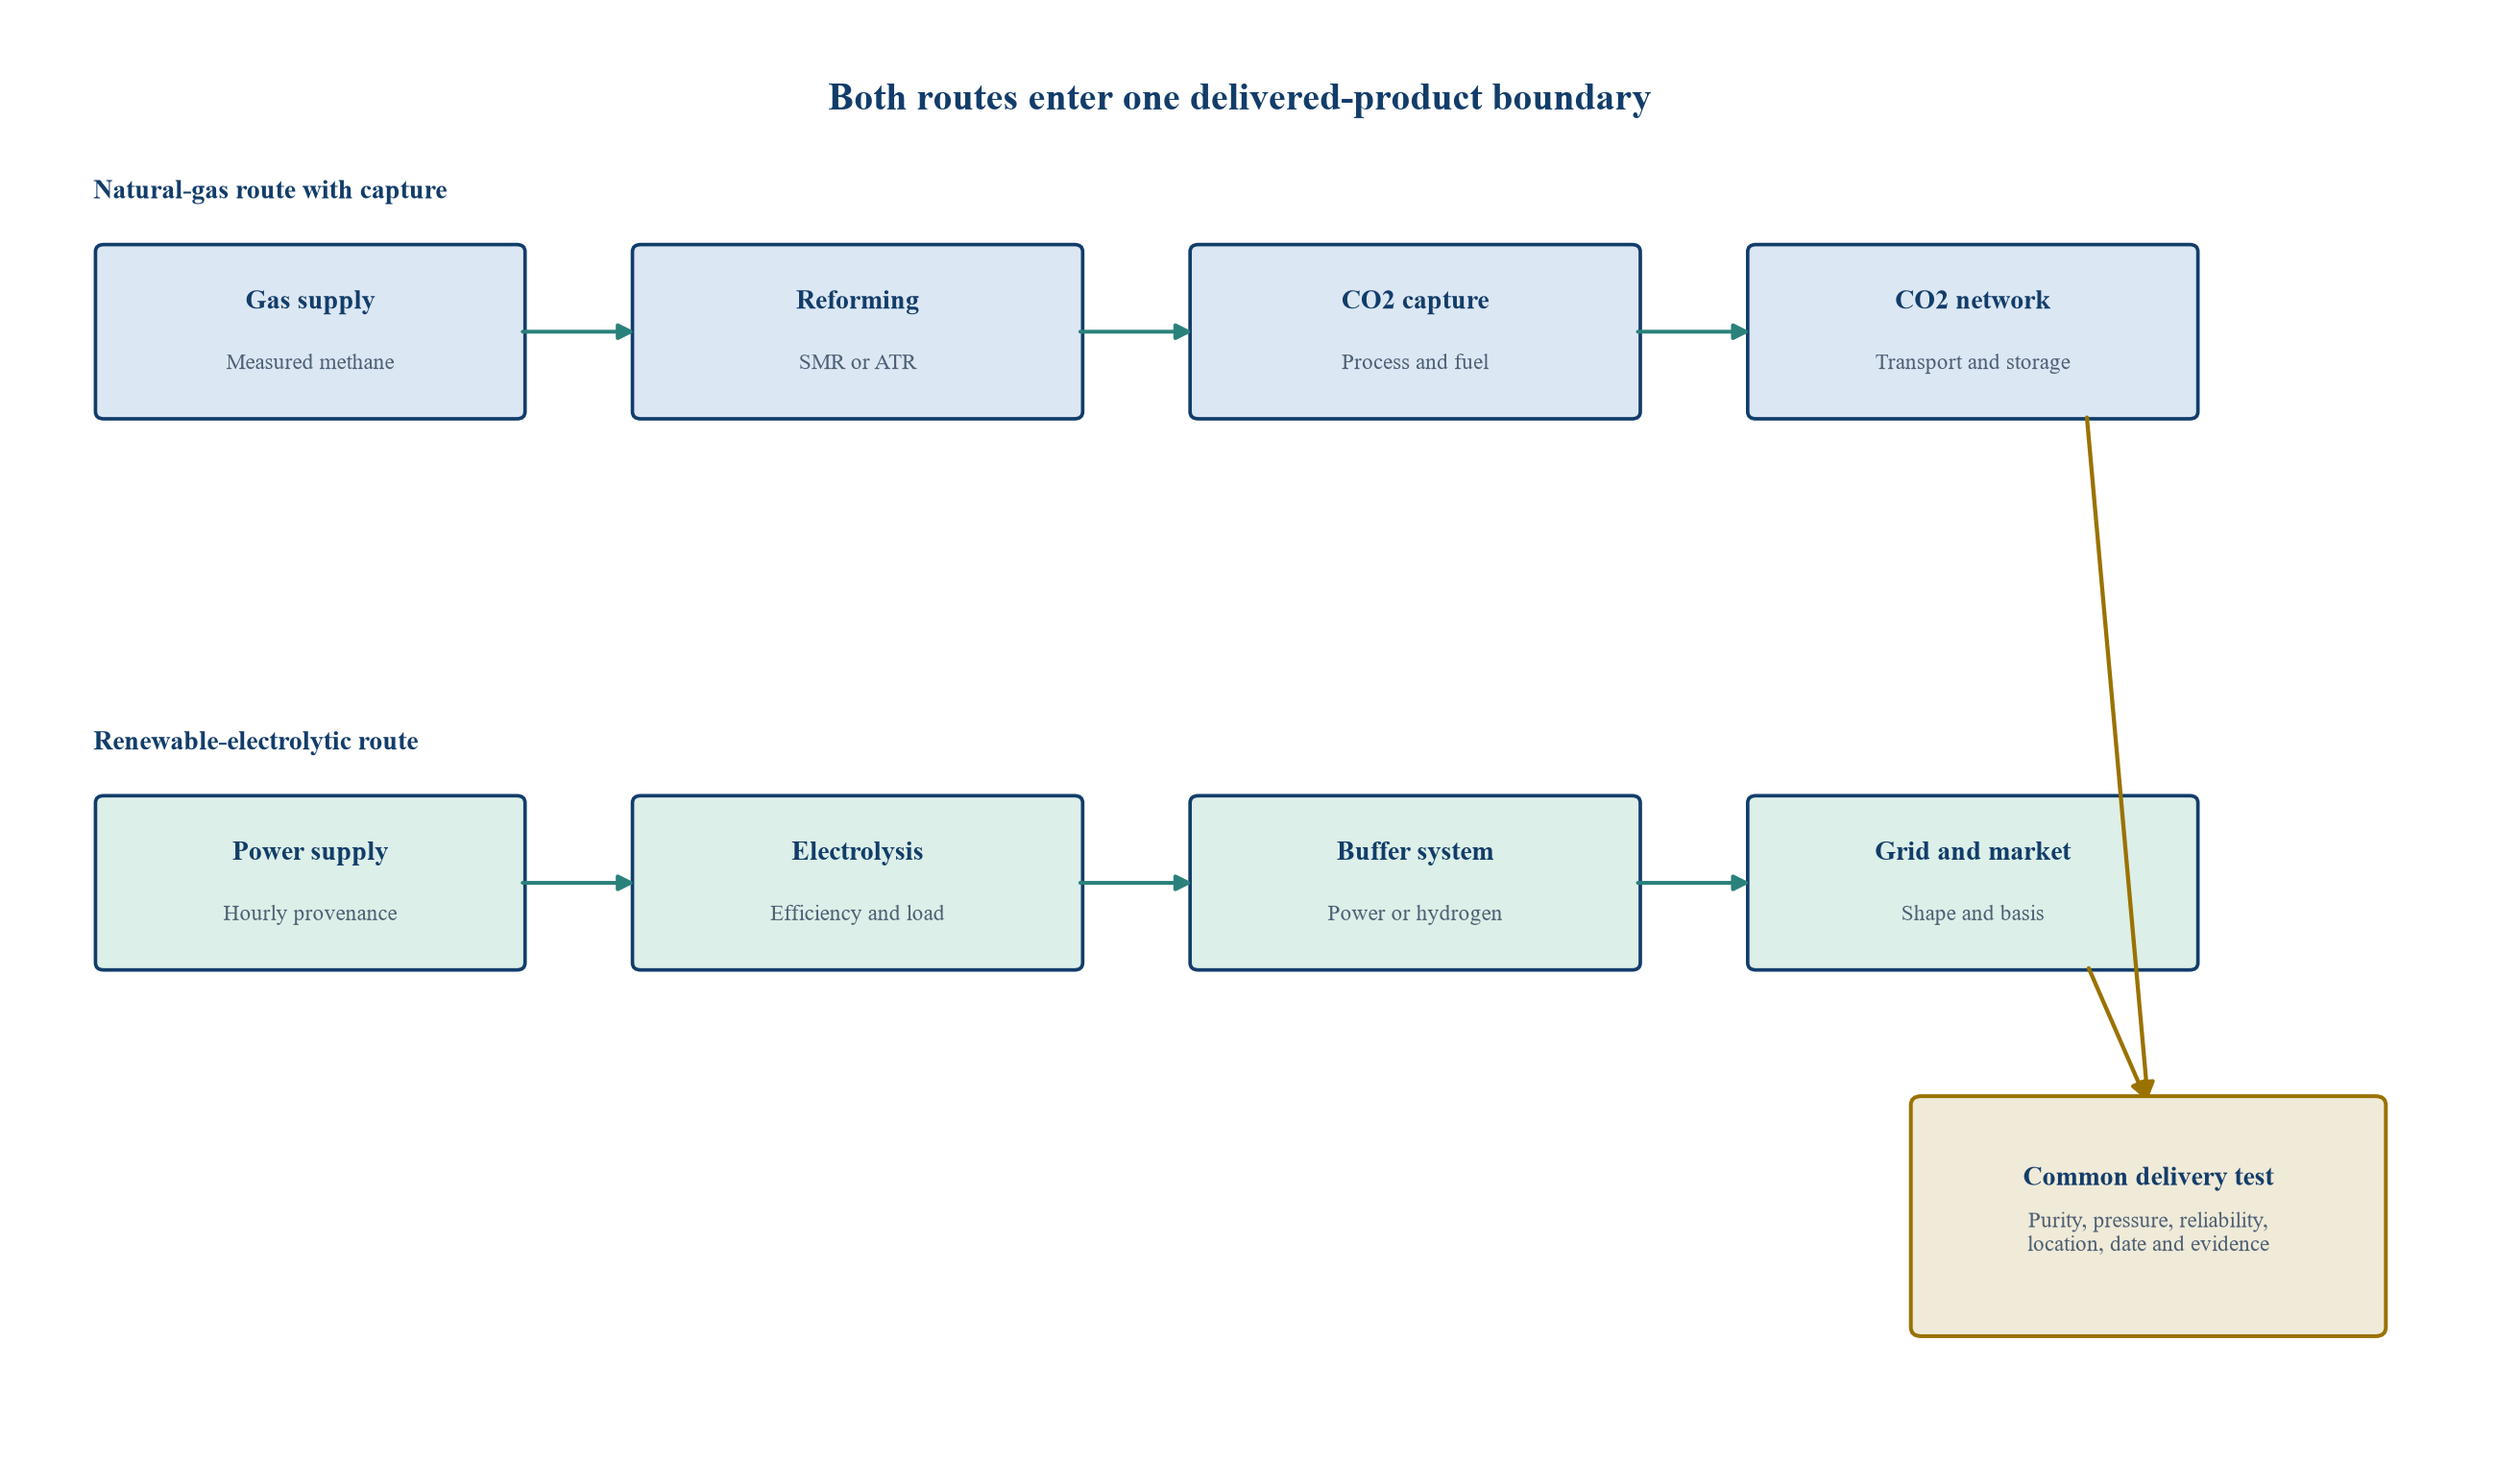
The diagram identifies material upstream, production, infrastructure and delivery components. Project-specific legal methodologies determine the final accounting boundary.
5. Methane intensity can determine the blue route's emissions result
Methane has a high warming effect, and gas-chain emissions vary widely across producers. The IEA's Global Methane Tracker 2026 estimates that upstream oil and gas methane intensity differs by more than two orders of magnitude between the best and worst performers. It reports a global upstream average near 1 percent in 2025 and identifies a technically achievable level below 0.2 percent if available measures are deployed [7].
A project should use measured and independently assured data from its contracted supply chain where available. National or global averages can serve as sensitivities, but they do not prove the performance of a specific gas source. A supply portfolio can change over time, and liquefied-natural-gas delivery adds processing and transport stages.
The commercial consequence is direct. Higher methane intensity can move hydrogen into a weaker regulatory category, reduce tax or subsidy value, impair offtake pricing and create covenant breaches. The gas contract should therefore address measurement, reporting, substitution, audit, remediation and the financial consequences of excess methane intensity.
6. Carbon capture requires a source-by-source denominator
A capture percentage is meaningful only when the denominator is defined. A reformer may capture a high share of concentrated process CO2 while leaving combustion emissions uncaptured. Plant-wide capture can be materially lower than the advertised rate for one stream.
The investment model should list every material carbon source: feedstock conversion, furnace or heater fuel, auxiliary electricity, start-up, flaring and any imported steam or hydrogen. It should show gross CO2 generated, captured volume, capture energy, compression, transport losses and stored volume. Availability and ramping should be reflected over the full operating year.
Performance guarantees should use the same denominator as the emissions model. A technology provider can guarantee capture-unit efficiency while the project remains exposed to upstream methane and uncaptured combustion. Debt protection requires integrated emissions and production tests, not a component test alone.
7. Permanent storage is part of the product claim
Captured CO2 creates value only when it reaches an eligible and durable storage destination under the relevant methodology. The chain includes dehydration, compression, pipeline or shipping, injection, monitoring and long-term stewardship. Each interface can limit hydrogen production or increase cost.
A shared CO2 network can lower unit cost, but it creates queue, completion and counterparty exposure. A hydrogen plant can be mechanically complete while the transport system or storage site remains unavailable. Venting captured CO2 during an outage may preserve hydrogen production and destroy the intended emissions performance.
The financing documents should define minimum CO2 availability, injection specifications, outage rights, capacity priority, take-or-pay charges and remedies. The base case should not assume continuous network service without contractual and technical evidence. Liquidity and alternative operating plans should cover commissioning and prolonged interruptions.
8. Renewable electricity quality determines the green route's result
Electrolysis has no direct carbon emissions at the stack, but electricity can carry substantial lifecycle emissions. The investment analysis should distinguish dedicated renewable generation, qualifying contracted supply, grid imports and storage losses.
The EU renewable-hydrogen framework requires additionality and temporal and geographic correlation for qualifying grid electricity, with hourly matching becoming the general requirement from 2030 under the stated rules [1, 2]. The US section 45V final rules also move toward hourly matching from 2030 [5]. These requirements can lower compliant electrolyser utilisation when renewable output does not match the operating profile.
Green hydrogen therefore needs two utilisation measures: total operating utilisation and compliant utilisation. The first drives equipment output. The second drives premium, support and debt-eligible revenue. The financial model should show both and prevent unmatched production from being sold under a qualifying label.
9. Electricity price and utilisation form one cost equation
Electricity is commonly the largest operating input for electrolysis. The UK Energy Innovation Needs Assessment states that renewable electricity can account for about 70 percent of green-hydrogen production cost in its cited context [8]. The exact share varies by power price, electrolyser cost, efficiency and capacity factor.
Low utilisation spreads fixed capital over fewer kilograms. High utilisation can add expensive or non-qualifying operating hours. A flat capacity-factor input conceals this interaction. The model should dispatch the electrolyser against chronological renewable output, price, equipment limits, storage and offtake.
Power-purchase agreements also create shape, basis, imbalance and curtailment exposure. A fixed generator price does not fix the delivered price at the electrolyser. Debt sizing should use delivered compliant electricity cost after network charges, losses and settlement differences.
10. Gas price and capture energy form the blue route's cost equation
Natural gas supplies feedstock and, depending on design, process energy. The quantity required per kilogram depends on conversion efficiency and recovery. Carbon capture adds capital, steam or electricity consumption, compression and CO2 transport and storage charges.
Blue-hydrogen cost therefore responds to gas price, carbon price, capture availability and infrastructure tariffs. A low plant capital estimate can be overwhelmed by high or volatile gas cost. A fixed gas contract can improve visibility while creating take-or-pay and credit requirements.
The base case should separate gas commodity, transport, reforming capital, capture capital, operating cost, CO2 transport and storage, hydrogen compression and common infrastructure. This enables a board to see which risk is hedged, passed through to the buyer or retained by equity.
11. One product specification prevents an artificial comparison
Hydrogen can leave the plant at different pressures and purity levels. A pipeline buyer, refinery, ammonia plant and transport application can require different treatment. Delivery reliability also affects storage and back-up requirements.
The two routes should be compared at the same delivery flange. If green hydrogen needs additional compression and storage to match the blue route's steady output, those costs belong in the comparison. If blue hydrogen needs a longer gas or CO2 connection, those costs also belong inside.
The buyer contract should define quantity, hourly or daily profile, pressure, purity, carbon-intensity evidence and remedies. The model should price the exact product obligation. A plant-gate levelised cost is insufficient when the buyer purchases a delivered service.
12. Policy eligibility can outweigh a small production-cost difference
Official support schemes use emissions thresholds, production categories and evidence conditions. The United States clean-hydrogen production credit provides different tiers based on well-to-gate emissions calculated under 45VH2-GREET [5, 6]. The UK standard defines a qualifying emissions threshold and monitoring obligations [4]. EU rules distinguish renewable and low-carbon fuels through separate methodologies and savings requirements [1, 3].
A project near a threshold can lose more value from a small emissions miss than it gains from a marginal operating-cost saving. The model should calculate project value by policy category and show the distance to each threshold. That margin should be stressed for data uncertainty, equipment degradation, energy-source changes and methodology updates.
Support should also be matched to tenor and volume. A credit or premium may expire before debt maturity or apply only to qualifying output. Debt service should rely on support after haircuts for eligibility, verification delay and volume uncertainty.
13. Infrastructure can reverse a headline cost ranking
A blue-hydrogen plant may benefit from existing gas infrastructure and industrial operating skills. It can require new CO2 transport and storage, capture equipment and long-term liability arrangements. A green-hydrogen plant may benefit from modular electrolysers and renewable resources. It can require large power connections, new generation, grid reinforcement and hydrogen storage.
The cost of shared infrastructure depends on scale and utilisation. A CO2 network or hydrogen pipeline built for several users can lower unit tariffs if users arrive. Delayed users can leave the first mover carrying excess capacity. A dedicated asset gives control and concentrates capital.
The investment test should model infrastructure as separate assets with their own construction, tariff and credit risks. The plant should pay only for contracted service in the base case. Speculative future users and tariff reductions should be treated as upside until binding commitments exist.
Table 1. Whole-system comparison of blue and green hydrogen
| Dimension | Natural-gas route with capture | Renewable-electrolytic route | Common investment evidence |
|---|---|---|---|
| Feedstock | Gas commodity, transport and measured methane intensity | Electricity source, delivery and qualifying attributes | Binding supply rights, price formula and volume profile |
| Production | Reforming efficiency, capture boundary and plant availability | Electrolyser efficiency, load range and compliant utilisation | Guaranteed performance under intended operating duty |
| Emissions | Upstream methane, uncaptured process and combustion emissions, CO2 chain | Electricity carbon intensity, matching, auxiliary power and losses | Auditable lifecycle model under applicable methodology |
| Infrastructure | Gas connection, CO2 transport and permanent storage | Renewable generation, grid connection, storage and balancing | Commissioning alignment, capacity rights and outage remedies |
| Cost exposure | Gas and carbon price, capture energy, CO2 tariff | Electricity price, shape, basis, electrolyser utilisation | Base, downside and combined stress cash flows |
| Policy value | Low-carbon threshold and captured-volume evidence | Renewable or clean-power qualification and temporal evidence | Threshold margin, verification process and change-in-law plan |
| Delivery | Stable production with gas and CO2 network dependency | Variable production requiring portfolio or buffer flexibility | Same product pressure, purity, location and reliability |
The table identifies decision variables. It does not rank technologies without project-specific evidence.
14. Technology readiness should be assessed at system level
Reforming, electrolysis, compression and industrial hydrogen use are established technologies in different settings. Commercial readiness for a new project depends on scale, duty, integration and support infrastructure. A proven component can sit inside an unproven operating system.
For blue hydrogen, the integration question covers high-rate capture across relevant streams, flexible operation, CO2 specification and storage availability. For green hydrogen, it covers large-stack performance under variable load, renewable dispatch, grid services, compression and storage. Common risks include water, safety systems, controls and product quality.
The diligence package should map reference plants against the proposed size and duty. It should distinguish operating evidence from vendor targets. Scale-up factors, first-of-a-kind interfaces and untested operating modes should receive contingency, staged guarantees and independent technical review.
15. The cost comparison should use transparent hypothetical assumptions
Public cost estimates often use different years, regions, financing assumptions, energy prices and boundaries. They can inform ranges, while a specific investment requires a reconciled project model. The IEA notes that low-emissions hydrogen remains more expensive than unabated fossil routes in most regions and that cost gaps continue to impede deployment [9]. The US Department of Energy's 2024 Clean Hydrogen Liftoff update cites electrolytic production estimates of USD 5 to 7 per kilogram before section 45V support in its assessed context [10].
The scenario below uses hypothetical assumptions to illustrate sensitivities rather than forecast a market price. It assumes the same delivery specification and excludes grants and production credits. Values can be replaced with project data without changing the framework.
The model calculates operating output, delivered energy inputs, capital recovery, operating cost, infrastructure tariff and a contingency for evidence and working capital. It then calculates lifecycle emissions separately. Cost and emissions are connected through the same physical assumptions but remain distinct metrics.
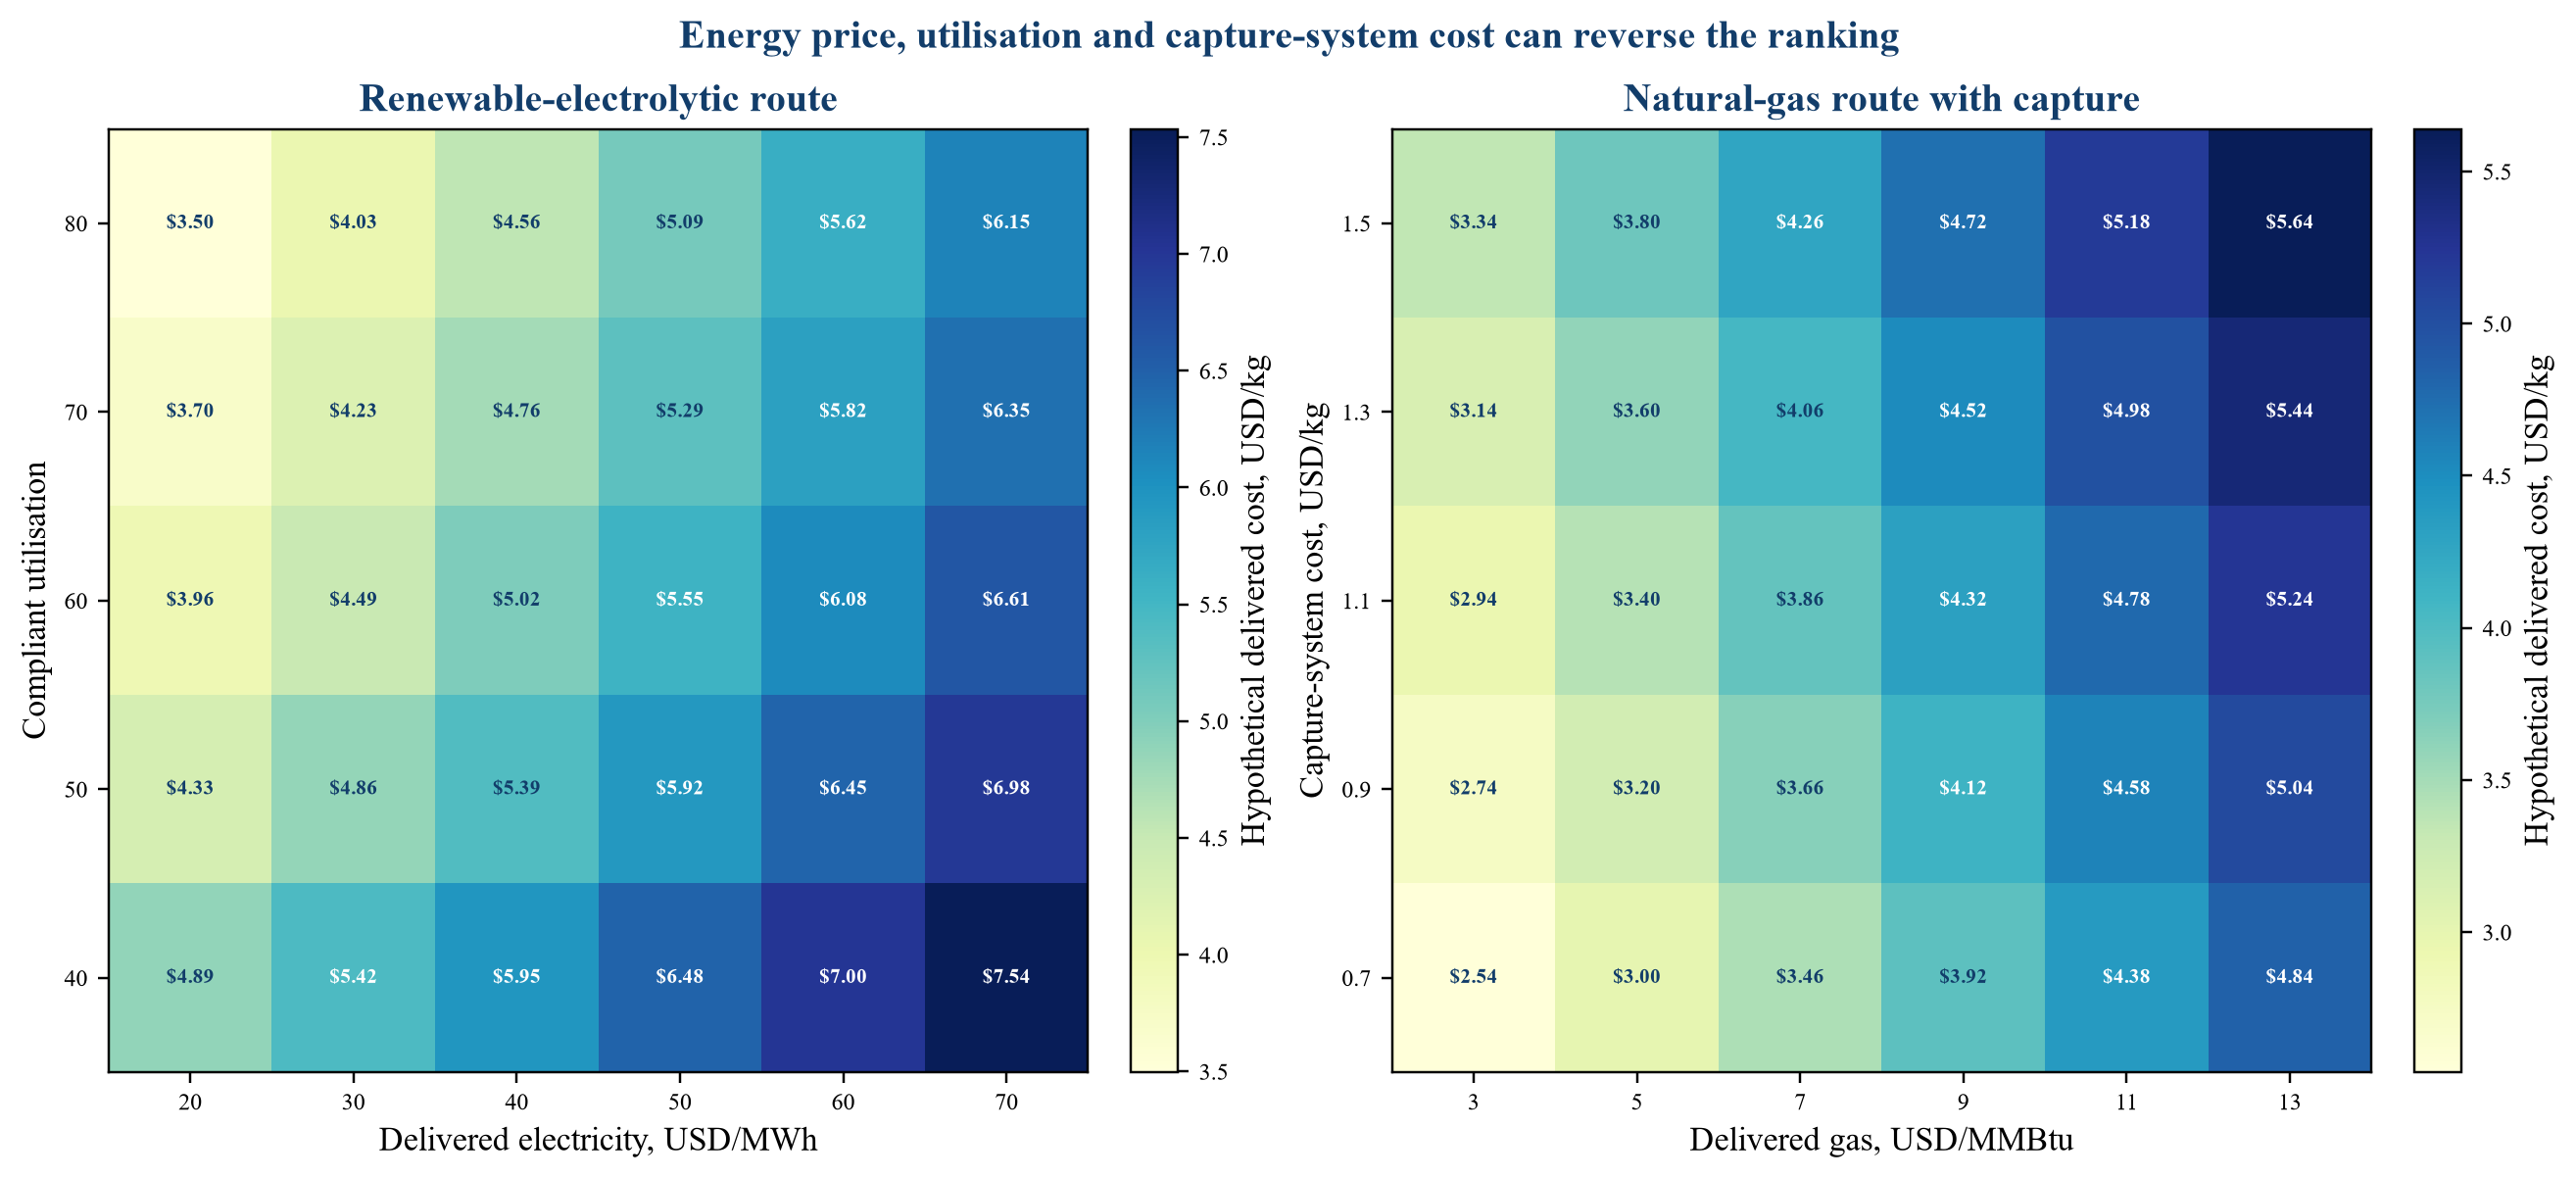
Values are analytical assumptions in USD per kilogram. They are not project forecasts or market quotations. Green cost varies with delivered electricity price and compliant utilisation. Blue cost varies with delivered gas price and integrated capture-system cost.
16. Emissions sensitivity needs measured operating inputs
Blue-hydrogen emissions respond strongly to methane intensity and integrated capture performance. Green-hydrogen emissions respond strongly to electricity carbon intensity, efficiency and the treatment of unmatched power. A single central estimate hides the threshold risk in both routes.
The model should retain the source data behind each factor. Methane estimates should state whether they come from direct measurement, operator inventory or regional default. Capture data should reconcile gross generation, captured volume and stored volume. Electricity data should identify the generating asset and time interval.
Uncertainty should be valued. A project with a low central estimate and weak measurement can carry more policy and reputational risk than a project with a slightly higher estimate and strong evidence. Verification cost and potential restatement belong in operating budgets and covenants.
17. Methane and capture performance interact
Reducing methane emissions improves the blue route before the reformer. Raising capture improves it at the plant. Neither measure substitutes fully for the other. High plant capture cannot erase severe upstream methane emissions, and low-methane gas cannot eliminate uncaptured plant CO2.
The IEA estimates that available measures could reduce global upstream oil and gas methane intensity below 0.2 percent from around 1 percent in 2025 [7]. That is a technical potential, not proof that any contracted supplier has achieved it. Project claims should use supplier-specific measurement and contractual assurance.
Capture performance should be measured over the operating year. Start-up, partial load and capture outages can lower the annual result. The financial model should calculate emissions and support value during those periods instead of applying a nameplate percentage to all output.
18. Electricity provenance and efficiency interact
An electrolyser using dedicated qualifying renewable power can achieve a strong emissions result, subject to the applicable lifecycle factors and rules. Grid electricity can produce a different result if the marginal or average generation is carbon intensive. The model should follow the methodology that governs the product claim.
Efficiency determines electricity required per kilogram. Degradation, auxiliary loads, compression and variable operation can increase that requirement. Supplier guarantees should specify whether consumption is measured at the stack, rectifier, electrolyser package or complete plant boundary.
Hourly provenance can reduce compliant utilisation. The project can respond through a diversified renewable portfolio, flexible offtake, storage or separate product classes. Each response adds cost or contract complexity. The investment case should value the compliant product and disclose the treatment of remaining output.
19. A two-axis emissions test reveals threshold exposure
The blue route should be tested across measured methane intensity and annual integrated capture. The green route should be tested across delivered electricity carbon intensity and complete-plant electricity consumption. The scenario grid should also identify the product-standard threshold that applies in the target market.
The calculation must use the correct global-warming potential and boundary under the governing methodology. Results from one framework cannot be transferred automatically to another. The purpose of the grid is to reveal which operating variables can move the project across a value threshold.
The test also directs diligence. A project that remains compliant across a broad range can tolerate measurement noise and operational variation. A project that qualifies only at the best methane, capture, electricity or efficiency assumptions needs stronger contracts, larger headroom and a funded remediation plan.
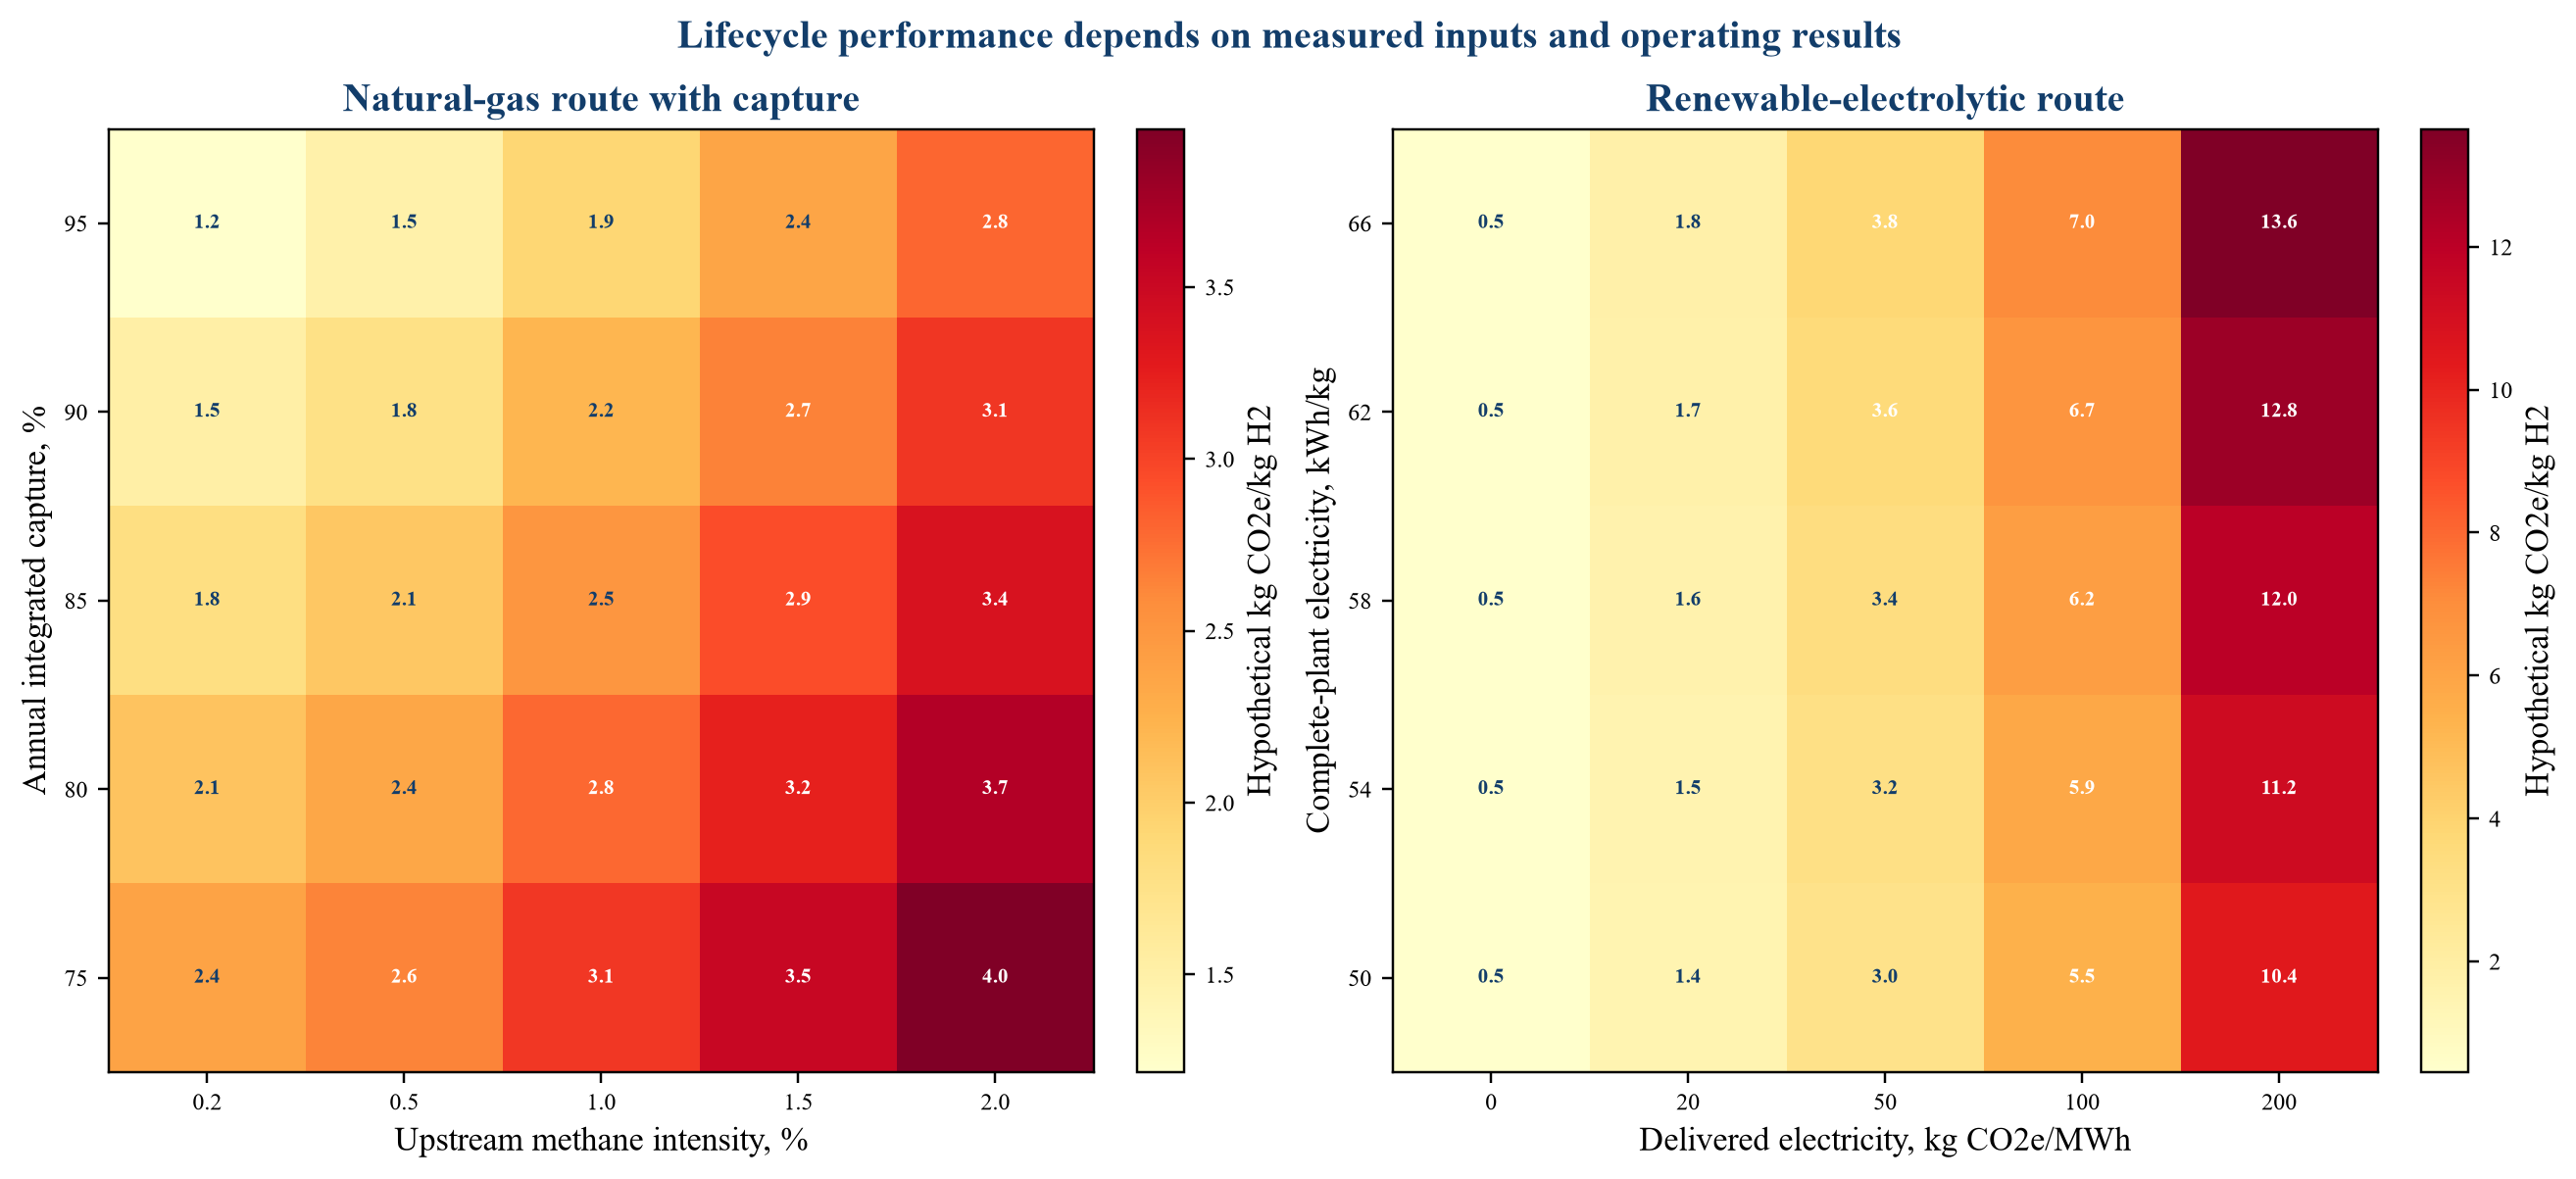
Values are illustrative analytical outputs in kilograms of carbon dioxide equivalent per kilogram of hydrogen. They do not represent a named project or substitute for the applicable legal methodology.
20. Contract design should follow the variables that control value
The gas supplier controls upstream production practices and can provide measurement, reporting and remedy rights. The reformer and capture suppliers control equipment performance within stated conditions. The CO2 network controls transport and injection availability. Their contracts should align with the emissions and delivery obligations in the hydrogen offtake.
The renewable generator controls production within resource and equipment limits. The power intermediary controls settlement and attribute transfer. The electrolyser supplier controls guaranteed efficiency, availability and operating range. The project company integrates the system and should not accept obligations that its upstream contracts leave unsupported.
Change-in-law allocation also matters. A stricter methane, capture or electricity-matching rule can change product eligibility without stopping the plant. The contract suite should specify adaptation duties, cost-sharing, price adjustment, termination and alternative product routes.
21. Measurement quality carries financial value
Lifecycle claims rely on meters, sampling, emissions factors, mass balance, certificates and calculation models. A weak evidence chain can delay support payments or buyer acceptance even when the physical plant operates well.
The project should maintain a data architecture that traces feedstock and electricity to hydrogen output and, for the blue route, captured and stored CO2. Data owners, frequencies, retention periods, assurance rights and correction processes should be contractual. Manual spreadsheets can support development but are fragile at operating scale.
Lenders can require independent verification, timely reporting and a cure process. Payment reserves should cover verification delays. Material restatements should trigger a review of support, offtake and covenant compliance. Cybersecurity and continuity plans are part of the evidence system because loss or manipulation of data can impair revenue.
22. Reliability should be priced separately from production cost
A buyer may value stable hydrogen more than the lowest average production cost. Gas reforming can provide a steadier output when gas and CO2 networks are available. Electrolysis can provide flexibility and rapid response, while variable renewable supply may require storage or grid support to meet a flat delivery profile.
The comparison should calculate the cost of firm delivery. For blue hydrogen, this can include gas storage, capture outage provisions and CO2-network redundancy. For green hydrogen, it can include renewable overbuild, portfolio diversity, grid access and hydrogen buffer storage.
The buyer's own flexibility can reduce system cost. An industrial process with inventory, substitute fuel or production scheduling can accept variable hydrogen. The offtake price and nomination rules should reflect the value of that flexibility. A project should not build expensive firmness that the buyer does not need.
23. Downside cases should combine energy, emissions and infrastructure
Independent single-variable sensitivities can understate risk. Gas price can rise while methane performance deteriorates. Renewable output can fall while grid basis widens. A CO2 network delay can coincide with interest during construction. The project should use combined cases that correspond to plausible contractual and physical events.
The hypothetical cases below apply to a common delivered product and use index values rather than market forecasts. The base case assumes contracted infrastructure and a policy margin. The downside case combines weaker energy and operating performance. The stress case adds infrastructure delay and partial loss of policy value.
The model should calculate debt service, minimum liquidity, covenant headroom and sponsor funding for each route. A route with a lower base cost can require more equity if its downside is concentrated or difficult to hedge.
Table 2. Hypothetical base, downside and stress cases
| Variable | Base case | Downside case | Stress case |
|---|---|---|---|
| Blue route delivered gas cost versus budget | 100% | 125% | 155% |
| Blue route upstream methane intensity | 0.5% | 1.0% | 1.8% |
| Blue route annual integrated capture | 93% | 87% | 78% |
| CO2 transport and storage availability | 98% | 90% | 72% |
| Green route delivered power cost versus budget | 100% | 120% | 145% |
| Green route compliant electrolyser utilisation | 68% | 53% | 38% |
| Green route complete-plant efficiency versus guarantee | 100% | 95% | 89% |
| Hydrogen sold under target qualifying category | 100% | 82% | 55% |
| Completion delay | 0 months | 6 months | 15 months |
| Policy or premium value versus base | 100% | 75% | 35% |
| Illustrative project DSCR | 1.55x | 1.16x | 0.76x |
Every value is an analytical assumption. The cases illustrate combined risk and are not market forecasts, engineering estimates or financing quotations.
24. Debt should follow compliant contracted output
Senior debt depends on predictable cash flow. Nameplate hydrogen capacity does not prove repayment. The debt case should use output that meets the contracted product specification and emissions category after outages, evidence delays and infrastructure constraints.
For the blue route, lenders should test gas and CO2 contracts, methane assurance, integrated capture, storage capacity and operating restrictions during CO2 outages. For the green route, they should test power procurement, compliant utilisation, electricity-price exposure, storage and flexible offtake.
Support and carbon value should be credited only for the qualifying period and verified volume. Merchant hydrogen, oxygen sales, grid services and future infrastructure users can enhance equity returns when evidenced. Conservative debt sizing can exclude them or use a limited cash-sweep mechanism.
25. Completion tests should reproduce commercial operation
Mechanical completion proves that equipment has been installed. Commercial completion should prove the system that generates the contracted cash flow. The blue route needs an integrated test of hydrogen output, plant-wide capture, CO2 specification, transport, injection and emissions measurement.
The green route needs an integrated test of power sourcing, dispatch, electrolyser performance, compression, storage, product delivery and certification data. A steady full-load test can miss the ramping and matching duty that determines actual revenue.
Delay and performance damages should correspond to the financial loss. Aggregate caps and exclusions should be compared with debt-service exposure and replacement cost. Final debt draw or conversion can require tests that demonstrate the actual product category and delivery service.
26. Carbon and electricity networks create common-completion risk
Large hydrogen projects often depend on infrastructure developed by separate owners. A CO2 pipeline, storage site, renewable plant, transmission connection or hydrogen network can sit outside the project company's direct control. Different permitting and construction schedules can create stranded assets.
The integrated schedule should identify every interface, critical-path date and commissioning dependency. Cross-project governance can include a common schedule, information rights, aligned long-stop dates and escalation. Contract remedies should preserve interim operating routes where technically and legally feasible.
Equity should fund only the residual risk it has agreed to bear. If a public or regulated infrastructure provider controls the delay, tariff relief, capacity priority or compensation may be more effective than a private-project liquidated-damages claim. The bankability analysis should examine the enforceability and credit behind each remedy.
27. Portfolio strategies can reduce technology and policy concentration
An industrial hub can use more than one production route. A blue asset can provide firm early volume while renewable generation and electrolysers scale. A green asset can reduce exposure to gas and methane performance. Shared hydrogen compression, storage and offtake can support both, subject to product tracking.
A portfolio is not automatically lower risk. Common infrastructure can create correlation. Product blending can complicate certification. Capital can be stranded if one route loses policy value. The operating and accounting system should preserve route-specific emissions and costs.
The option to add, repower or retire modules has value. Investment stages should identify which shared assets remain useful under alternative production mixes. Long-term contracts should avoid locking the project into an uneconomic route when policy and input markets change.
28. Valuation should separate contracted value and optionality
The contracted core consists of hydrogen volume, price, support and infrastructure capacity supported by enforceable agreements. Its valuation should use realistic qualifying output, operating costs, financing and tax. Uncontracted upside should be valued separately.
Options can include expansion, additional buyers, renewable overbuild, grid services, lower-methane gas, higher capture, heat integration and future pipeline access. Each option requires probability, investment, timing and control rights. A high terminal value should not compensate for weak contracted economics.
Comparable-company and transaction multiples require caution. Projects differ in emissions category, support, infrastructure ownership, contract tenor and construction status. A dollar per kilogram of capacity or enterprise value per megawatt can obscure those differences. Discounted cash flow and scenario analysis should remain anchored to the project system.
29. Commercialisation should proceed through evidence gates
Development capital should fund uncertainty reduction in sequence. Early work defines product, boundary and site. The next stage secures measured feedstock or power data, infrastructure capacity and buyer terms. Front-end engineering then converts these into guaranteed performance and a financeable contract package.
Final investment approval should follow independent technical, market, legal, environmental and emissions review. The project should demonstrate threshold headroom and combined downside liquidity. Construction draws should follow verified milestones, and operating distributions should depend on compliant delivery and data.
The sequence protects capital by making unresolved dependencies visible before the next commitment. It also creates a clear basis for strategic partnership, joint venture or sale. A buyer can assess which risks have been retired and which remain with future capital.
Table 3. Staged commercialisation and financing roadmap
| Stage | Decision | Required evidence | Capital instrument | Principal failure test |
|---|---|---|---|---|
| Boundary and concept | Select product, location and route set | Common delivery specification, lifecycle boundary, preliminary resource and infrastructure map | Sponsor development equity | No credible qualifying product or buyer need |
| Resource and infrastructure | Reserve gas, power, CO2 and hydrogen interfaces | Measured profiles, capacity rights, tariff principles, route studies and schedule | Development equity or strategic funding | Essential capacity unavailable or misaligned |
| Commercial formation | Establish revenue and risk allocation | Buyer term sheet, support eligibility, feedstock or power contract, interface remedies | Convertible or staged strategic capital | Unhedged input and output obligations remain incompatible |
| Front-end engineering | Fix scope, performance and cost | FEED, guarantees, integrated emissions model, permits, contingency and execution plan | Equity plus pre-FID facilities | Threshold headroom or completion plan remains weak |
| Final investment decision | Commit construction capital | Executable contracts, independent reviews, funded base and downside cases, committed debt and equity | Project debt and sponsor equity | Combined stress cannot preserve liquidity or cure |
| Operations and expansion | Protect compliance and add capacity | Integrated completion, verified data, covenant compliance and proven buyer demand | Operating cash, expansion debt or refinancing | Product evidence, infrastructure or demand fails in operation |
Gate evidence should be adapted to the project's jurisdiction, route, scale and contract structure.
30. Risk allocation should follow control and financial capacity
The party that controls a risk should manage it where practical. The gas supplier can control specified methane practices. Technology and EPC providers can control guaranteed plant performance. Infrastructure operators can control capacity and availability within stated events. Buyers can control nominations and payment.
Control alone is insufficient when a party lacks financial capacity. Credit support, insurance, reserves and direct agreements should sit behind contractual obligations. A small supplier should not receive unlimited exposure that it cannot fund. The project should price the remaining risk and allocate it transparently to debt or equity.
Residual correlation matters. Gas supply, capture and CO2 storage failures can occur together. Renewable output, price and grid congestion can also correlate. The financing plan should evaluate the combined residual instead of adding isolated contingency percentages.
31. Investment committee requirements
Before commitment, the board should receive one model with linked mass, energy, emissions and cash-flow schedules for both routes. Every cost and emissions line should map to a physical quantity, contract, evidence source and responsible party. The comparison should use the same product specification and date.
The diligence package should include measured gas or electricity evidence, technology references, infrastructure rights, certification advice, integrated completion tests, buyer credit and a complete data architecture. It should show base, downside and combined stress cases for cost, emissions, timing and support.
Approval should identify threshold headroom, uncontracted value and sponsor obligations. It should state which route is preferred for the current project and which facts would change that decision. A colour label should never substitute for the decision record.
32. Limits of the analysis
Hydrogen rules and calculation methodologies differ across jurisdictions and can change. A project must verify the legal text, scheme guidance, certificate rules and contract requirements in force when investment and production occur. This paper does not determine eligibility for a named project.
The numerical figures and tables are hypothetical analytical assumptions. They do not represent observed performance, an engineering quotation, a market forecast, a financing offer or a valuation of a named asset. Actual results depend on site, technology, resource, infrastructure, contracts, tax, policy, financing and operations.
Lifecycle results depend on boundary and data quality. Methane measurement remains uneven across producing regions, and electricity emissions can vary by hour and location. A decision model should preserve uncertainty and update inputs as verified project evidence becomes available.
33. Conclusion
Blue and green hydrogen can be compared credibly when both enter the same delivered-product boundary. The comparison must include upstream energy, production, infrastructure, certification, delivery reliability and the cash flows attached to verified emissions performance.
The decisive variables are measurable. The blue route depends on gas price, methane intensity, integrated capture, CO2 transport and permanent storage. The green route depends on electricity price, provenance, compliant utilisation, efficiency, grid exposure and storage. Either route can lose its expected advantage when a critical assumption changes.
A financeable project creates headroom around policy thresholds, aligns upstream contracts with the hydrogen offtake, tests integrated performance and sizes debt to compliant contracted output. Optional expansion and portfolio benefits remain with equity until evidence supports them.
The investment question is which system can deliver the required hydrogen, at the required time and reliability, with verified emissions and cash margin that survive the combined downside. One investment test makes that question answerable.
References
- European Commission. Renewable hydrogen. https://energy.ec.europa.eu/topics/eus-energy-system/hydrogen/renewable-hydrogen_en
- European Commission. Commission Delegated Regulation (EU) 2023/1184 on renewable fuels of non-biological origin. https://eur-lex.europa.eu/legal-content/EN/TXT/?uri=CELEX:32023R1184
- European Commission. Delegated act specifying a methodology for assessing greenhouse gas emissions savings from low-carbon fuels. 8 July 2025. https://energy.ec.europa.eu/document/download/3d3d0214-75f4-4e79-805e-3240526e2082_en
- United Kingdom Department for Energy Security and Net Zero. UK Low Carbon Hydrogen Standard, version 4. January 2026. https://www.gov.uk/government/publications/uk-low-carbon-hydrogen-standard-emissions-reporting-and-sustainability-criteria
- United States Department of the Treasury. Final rules for the section 45V Clean Hydrogen Production Tax Credit. 3 January 2025. https://home.treasury.gov/news/press-releases/jy2768
- United States Department of Energy. GREET and 45VH2-GREET resources. https://www.energy.gov/cmei/greet
- International Energy Agency. Global Methane Tracker 2026, Key findings. https://www.iea.org/reports/global-methane-tracker-2026/key-findings
- United Kingdom Department for Energy Security and Net Zero. Energy Innovation Needs Assessment: Hydrogen. 2025. https://assets.publishing.service.gov.uk/media/69449d32143d960161547edd/einas-2025-hydrogen.pdf
- International Energy Agency. Global Hydrogen Review 2026. https://www.iea.org/reports/global-hydrogen-review-2026
- United States Department of Energy. Pathways to Commercial Liftoff: Clean Hydrogen, 2024 Update. https://www.energy.gov/sites/default/files/2025-07/LIFTOFF_DOE_Clean-Hydrogen-2024-Update.pdf
- International Energy Agency. Demand, Global Hydrogen Review 2026. https://www.iea.org/reports/global-hydrogen-review-2026/demand
- International Energy Agency. Production, Global Hydrogen Review 2026. https://www.iea.org/reports/global-hydrogen-review-2026/production
- International Energy Agency. Cost acceptability, Global Hydrogen Review 2026. https://www.iea.org/reports/global-hydrogen-review-2026/cost-acceptability
- International Energy Agency. Trade and infrastructure, Global Hydrogen Review 2026. https://www.iea.org/reports/global-hydrogen-review-2026/trade-and-infrastructure
- International Energy Agency. Investment and innovation, Global Hydrogen Review 2026. https://www.iea.org/reports/global-hydrogen-review-2026/investment-and-innovation
- International Energy Agency. Global Methane Tracker 2025. https://www.iea.org/reports/global-methane-tracker-2025
- International Energy Agency. Understanding methane emissions, Global Methane Tracker 2025. https://www.iea.org/reports/global-methane-tracker-2025/understanding-methane-emissions
- International Energy Agency. Accelerating industry action, Global Methane Tracker 2025. https://www.iea.org/reports/global-methane-tracker-2025/accelerating-industry-action
- European Union. Regulation (EU) 2024/1787 on reducing methane emissions in the energy sector. https://eur-lex.europa.eu/eli/reg/2024/1787/oj
- United States Department of Energy. Clean Hydrogen Production Tax Credit resources. https://www.energy.gov/articles/clean-hydrogen-production-tax-credit-45v-resources
- United States Department of Energy. Clean Hydrogen Production Cost Scenarios with PEM Electrolyzer Technology. 2024. https://www.hydrogen.energy.gov/docs/hydrogenprogramlibraries/pdfs/24005-clean-hydrogen-production-cost-pem-electrolyzer.pdf
- United States Department of Energy. Hydrogen Shot Water Electrolysis Technology Assessment. 2024. https://www.energy.gov/sites/default/files/2024-12/hydrogen-shot-water-electrolysis-technology-assessment.pdf
- United States Department of Energy. Hydrogen Production: Natural Gas Reforming. https://www.energy.gov/cmei/fuels/hydrogen-production-natural-gas-reforming
- United States Department of Energy. Hydrogen Production: Electrolysis. https://www.energy.gov/cmei/fuels/hydrogen-production-electrolysis
- International Renewable Energy Agency. Green Hydrogen Cost Reduction. 2020. https://www.irena.org/publications/2020/Dec/Green-hydrogen-cost-reduction
- United Kingdom Department for Energy Security and Net Zero. Hydrogen production delivery roadmap. https://www.gov.uk/government/publications/hydrogen-production-delivery-roadmap/hydrogen-production-delivery-roadmap
About the Author
Chennakeshav (CK) is a corporate finance and investment banking executive with 25+ years of global experience in deal origination, structuring and execution across M&A, growth capital and corporate strategy. He has led value-creation mandates for founders, corporates and funds — bridging the boardroom view to hands-on execution and close.
His career spans Morgan Stanley, HSBC, Lloyds Banking Group, EWEC, ADQ portfolio companies and Emirates Growth Fund, across TMT, real estate, fintech, deeptech, cleantech, infrastructure and energy. He has partnered with C-suite leaders, private equity and venture funds, sovereign wealth funds and family offices to finance complex fund raises and scale-up ventures, and has led M&A due diligence, post-merger integration and business-transformation initiatives to create value.
At Matchpoint Partners he is Managing Partner, leading the firm's corporate finance, M&A and capital-raising practice. He holds an MBA from London Business School, an engineering degree from VTU and a Master of Laws (LLM, in progress) from UCL London.
An active start-up mentor, CK mentors at Techstars, DIFC FinTech Hive, Startup Grind, Founder Institute and IN5, serves as Entrepreneur Mentor in Residence (EMiR) at London Business School, and judges the Entrepreneurship World Cup.
LinkedIn: https://www.linkedin.com/in/ckadya/
Profile: https://www.matchpoint-partners.com/team/ck-adya.html
