
Introduction
Cooling determines how much computing capacity a data centre can deliver during the hours when ambient conditions, customer load and infrastructure constraints are most demanding. It also connects the asset to local water supply, electricity, discharge, land, network and environmental systems. Site selection therefore requires an integrated capacity and valuation decision.
The central question is the value of deliverable computing capacity at each candidate location. Installed megawatts, a grid offer or a land title provides only part of the answer. The investor needs evidence that the site can remove heat at the required rack density, preserve redundancy, meet customer and regulatory conditions, and operate within secured water and power rights throughout the investment period.
Global water-risk maps can identify candidate basins that need deeper review. The World Resources Institute explains that baseline water stress measures competition for water relative to natural availability and that local conditions can differ from global screening results.[10][11] The location process should therefore move from global screen to basin review, utility evidence, site engineering and binding rights.
This paper addresses greenfield site selection, phased campus development and portfolio capital allocation. A related Matchpoint paper examines the acquisition valuation of an operating Gulf facility. The present analysis focuses on comparing alternative locations before capital becomes difficult to reverse.
1. Define the site-selection decision
State the computing product, customer region, latency requirement, data-residency constraint, target rack density, initial capacity, expansion plan and required service date. Define whether management is choosing one site, allocating capacity among several sites, or preserving a reserve location.
Record the valuation date and the capital decision at issue. Early decisions can concern option payments, land deposits, utility studies or design funding. Later decisions can commit to substations, water connections, cooling equipment and customer construction. Each stage should have an evidence threshold and a maximum capital-at-risk limit.
The comparison set should contain feasible sites rather than convenient names. A site without credible electricity, network, planning or customer access should remain outside the base case even if land and water appear attractive. A site with scarce water can remain viable where dry or closed-loop cooling performs through the required weather envelope and the associated power demand is secured.
2. Measure one comparable unit of capacity
Compare sites using customer-qualified, billable computing megawatts available through design weather. Nameplate power can overstate value when cooling, redundancy, auxiliary load, commissioning, customer fit-out or grid conditions reduce usable output.
The capacity bridge should begin with grid import and permitted onsite supply. Deduct cooling and facility load, reserve requirements, redundancy, maintenance and contractual limits. Apply the rack-density and thermal design. Then identify commissioned, customer-qualified and billed capacity. Repeat the bridge for the hottest credible operating interval, water interruption, equipment outage and expansion stage.
This common unit permits a coherent comparison of land, power, water and cooling. A location with higher electricity cost can create more value when it delivers capacity sooner or with lower construction risk. A low-water location can lose value if dry cooling consumes electrical headroom that would otherwise support revenue-generating computing equipment.
3. Build the facility water balance
Reconcile incoming potable, desalinated, recycled and process water to cooling make-up, humidification, cleaning, sanitary use, treatment losses, drift, evaporation, blowdown and discharge. Obtain monthly meter records and hourly data for peak months. Tie volumes to invoices, laboratory results, chemical-treatment logs and discharge records.
Water Usage Effectiveness divides annual site water use by information-technology energy. It creates a comparable intensity measure, subject to boundary and source definitions. A transaction review should retain absolute volume because a low WUE applied to a very large computing load can still require material water infrastructure. [5][6]
Reconcile design values with actual operating mode. Cooling towers can cycle concentration and blowdown differently as source-water chemistry changes. Leaks, bypasses, failed sensors and manual overrides can produce material variance from design. Calculate WUE by month and by hall, then bridge the result to weather, load and maintenance events. This creates an auditable baseline for retrofit savings and identifies whether the forecast assumes correction of current operational defects.
4. Separate withdrawal, consumption and discharge
Withdrawal measures water taken from a source; consumption measures the portion not returned to the same watershed or system; discharge measures water released after use. Evaporative cooling can have high consumption because water leaves as vapour. Once-through systems can have lower consumption but high withdrawal and significant discharge obligations.
These distinctions affect tariffs, permits, public reporting and stakeholder claims. The buyer should reconcile each metric to the relevant regulator and contract. A sustainability statement based on withdrawal reduction should not be modelled as a consumption reduction unless the measured boundary supports it.
5. Screen the water source hierarchy
Classify each source by legal right, capacity, pressure, quality, treatment need, interruption risk, tariff, escalation, carbon and energy intensity, connection capex and emergency substitutability. Potable or desalinated water may offer quality and reliability while carrying scarcity and energy implications. Recycled water can reduce demand on potable supply but may require treatment, storage and separate distribution infrastructure.
Abu Dhabi's district-cooling policy expressly evaluates recycled, desalinated and seawater alternatives against technical and commercial feasibility and discharge standards. Its sector evidence is relevant to data-centre diligence because both applications operate heat-rejection assets; asset-specific permits and engineering remain decisive. [11][12][13]
6. Test water rights and utility capacity
Obtain the executed connection agreement, allocated capacity, tariff schedule, meter class, curtailment provisions, quality specification, notice rights and change-of-control terms. Confirm that stated capacity is reserved for the asset and not shared informally across a campus. Compare contracted daily volume with design-day demand and emergency storage.
A utility letter, construction drawing and paid bill prove different things. Build an evidence ladder from indicative availability through binding allocation, completed connection and paid operation. Value should increase only when the evidence supports the relevant stage.
7. Move from global water screen to local evidence
Use a consistent global dataset to identify basins requiring deeper diligence. Keep individual indicators visible because baseline stress, depletion, variability, drought and quality describe different exposures. The World Resources Institute states that its global tools support prioritisation and should be supplemented by local and regional analysis.[10][11]
The local review should identify the physical source, legal right, utility system, competing users, seasonal capacity, drought rules, planned investment, water quality, tariff, treatment, storage, interruption history and emergency substitute. Interview evidence and management statements should remain separate from executed agreements, meter records and regulatory approvals.
Map the chain from basin to facility. A low-stress basin does not prove capacity at a particular connection. A high-stress score does not prove that an engineered reclaimed-water or seawater system is unavailable. The model should translate each local fact into capacity, cost, timing or risk rather than applying a general premium or discount.
8. Value the water source hierarchy
Classify potable, surface, groundwater, reclaimed, desalinated, seawater and closed-loop inventories separately. For each source, record withdrawal and consumption, quality, treatment, connection capex, fixed and volumetric tariff, energy intensity, discharge, reliability and transferability.
Reclaimed water can reduce competition for potable supply where quality and delivery are dependable. Desalination can expand supply while creating electricity, infrastructure and brine-discharge dependencies. Dry cooling can reduce operational water consumption while increasing power during hot conditions. Site valuation should retain these linked effects.
Treat an indicative utility letter, reserved capacity, completed connection and paid operation as different evidence states. The site earns value as rights become binding, infrastructure is completed and performance is demonstrated. Unfunded public investment and unexecuted supply discussions belong in probability-weighted development cases.
9. Evaluate recycled-water feasibility
Recycled water can reduce potable-water demand, yet availability, quality and network proximity may be uncertain. Review source plant capacity, seasonal supply, pipeline route, storage, treatment specification, corrosion potential, biological control, customer restrictions and discharge compatibility. Identify the party funding connection and pretreatment.
Model recycled water as an operating input only after confirming binding supply, quality and completion. Before that point it is a development option with probability-weighted capex and schedule. The Abu Dhabi policy framework supports technical and economic evaluation of this source. [10][11][15]
10. Establish the hourly computing-load profile
Cooling demand follows actual processor load, rack density and operating mode. Obtain interval information-technology power, total facility power, coolant temperatures, pump loads and external ambient data. Separate installed, commissioned, occupied, reserved and billed capacity. Test the ramp schedule for each customer and hall.
AI workloads can change thermal density faster than building occupancy. A 60 MW facility operating at 70 per cent average load produces a different water and power profile from a fully loaded facility with the same nameplate. The cooling model should use hourly load and credible customer ramps.
11. Reconcile WUE, PUE and useful computing
Water Usage Effectiveness and Power Usage Effectiveness can move in opposite directions. Evaporation can reduce mechanical-cooling electricity; dry rejection can reduce water while increasing compressor or fan energy. Compare both metrics under the same weather, workload and boundary.
Add a useful-computing denominator where hardware and workload data permit. ASHRAE's AI data-centre framework identifies WUE, Water Usage Impact, PUE, carbon metrics and information-technology work capacity. The investment committee should avoid rewarding an intensity improvement caused by lower utilization or a shifted boundary. [5]
12. Model ambient temperature and humidity
Use hourly dry-bulb and wet-bulb weather data, including design extremes and projected hotter cases. Evaporative systems depend on wet-bulb conditions; air-cooled chillers and dry coolers lose efficiency as dry-bulb temperature rises. Record the number of hours at which the plant approaches design limits.
Model coincident heat and computing peaks. A cooling design that performs efficiently on annual averages may constrain capacity during the most valuable hours. Test degradation, fouling, sand, salt, dust and air-filter loading where relevant to the site.
Climate scenarios should inform sensitivity rather than become a single deterministic forecast. Use observed weather for the operating baseline, design weather for equipment capacity and a hotter stress case for investment resilience. Record which weather station, period and percentile supports each input. Where a site depends on coastal air or seawater, include humidity, salinity and corrosion implications alongside temperature.
13. Classify liquid-cooling readiness
Inspect rack manifolds, piping, cooling distribution units, heat exchangers, leak detection, water chemistry, controls and redundancy. Confirm which ASHRAE liquid-cooling temperature class the system can support and which customer hardware has been qualified. Review warranties and responsibility at the facility-to-equipment boundary.
ASHRAE identifies W17, W27, W32, W40, W45 and W+ classes, named for maximum facility liquid-supply temperature. Higher-temperature systems can create more opportunities for chiller-free operation, subject to equipment and climate. The target's design and acceptance tests determine value. [5][6]
14. Compare four cooling architectures
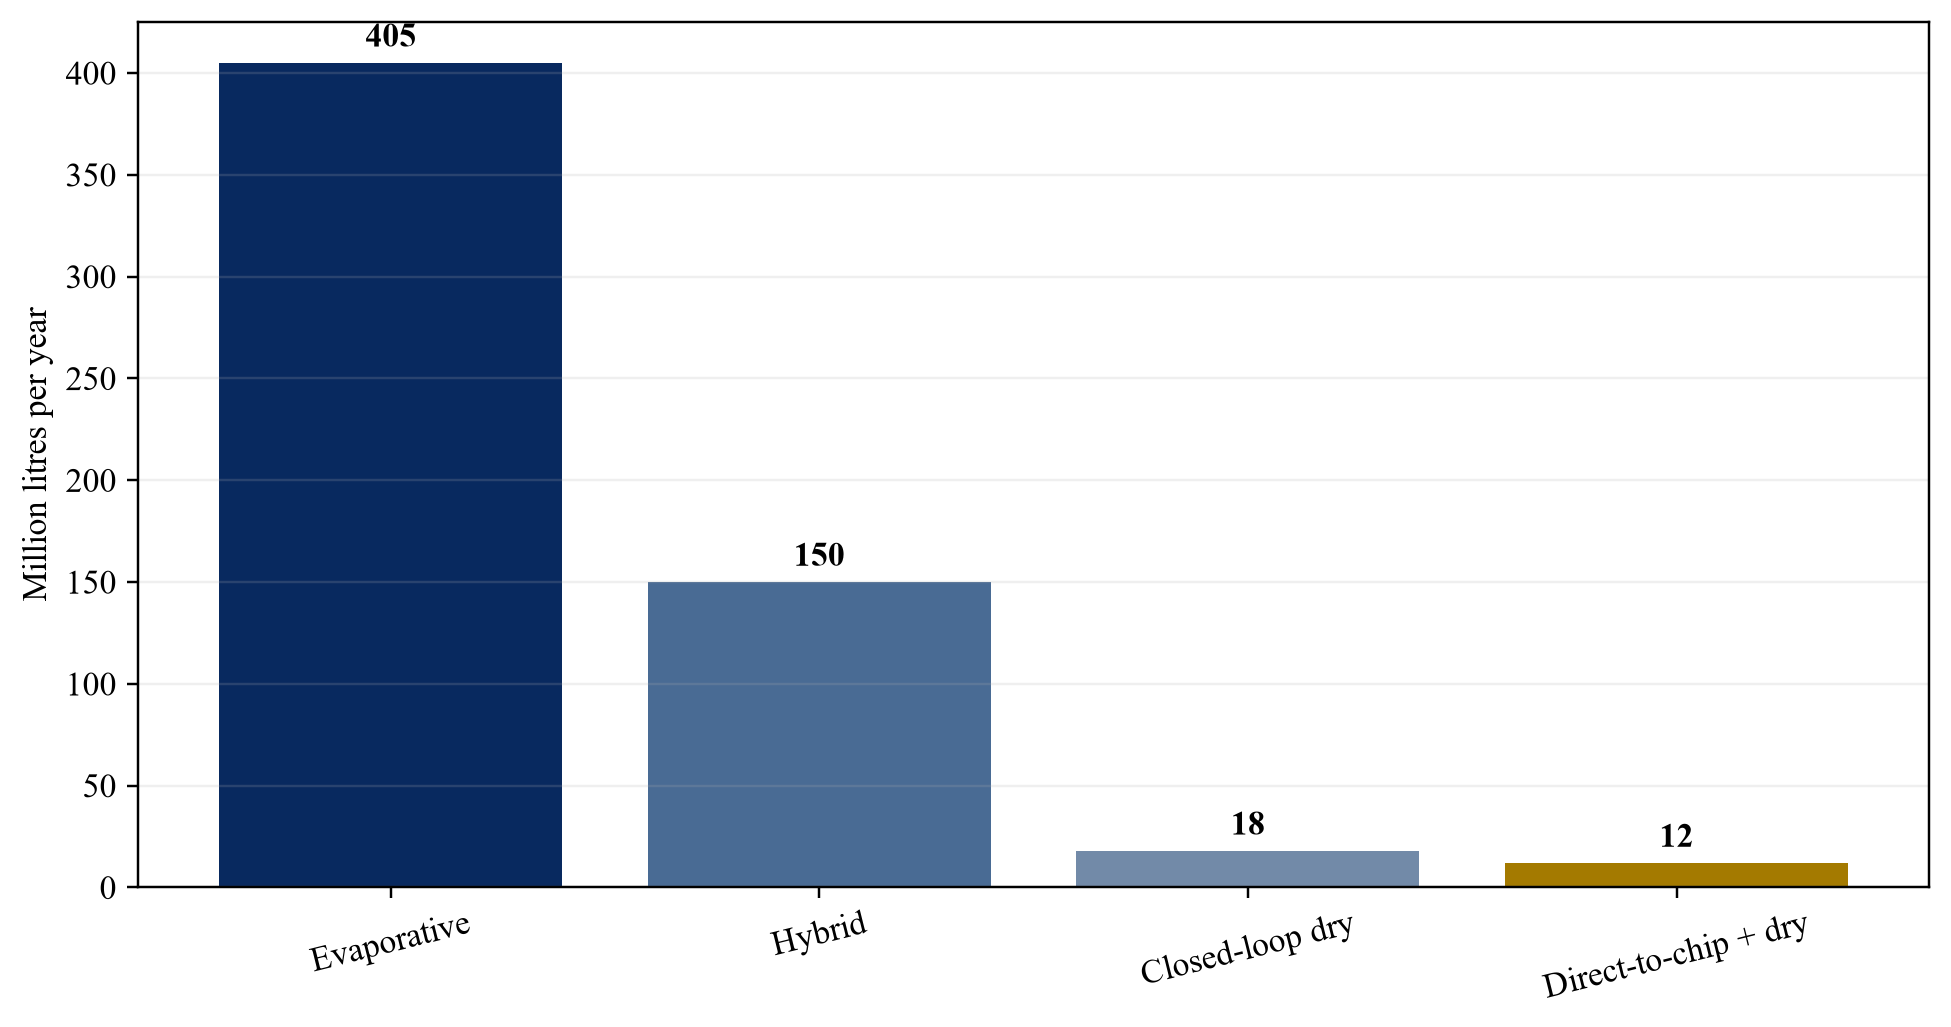
Compare conventional evaporative rejection, hybrid towers, closed-loop air-cooled chillers and direct-to-chip liquid cooling with dry rejection. Score each against water use, peak power, rack density, capex, maintainability, redundancy, vendor concentration, retrofit disruption and customer acceptance.
Architecture labels can conceal mixed systems. A direct-to-chip facility may retain evaporative towers for heat rejection; a hybrid plant may consume water only above a threshold. Model actual modes by hour rather than assigning one annual marketing label.
15. Test the zero-water claim
Microsoft describes a new design that recirculates water in a closed loop and avoids operational water evaporation, with expected savings exceeding 125 million litres per year per data centre relative to its fiscal-year 2024 average. It also states that mechanical cooling can increase power use and that warmer liquid temperatures help mitigate the penalty. [7][8]
Use this as evidence of technical direction. For a target asset, verify make-up water, humidification, cleaning, leaks, commissioning, sanitary use and heat rejection. Define whether zero applies to cooling consumption, cooling withdrawal or the whole facility.
16. Quantify the power penalty
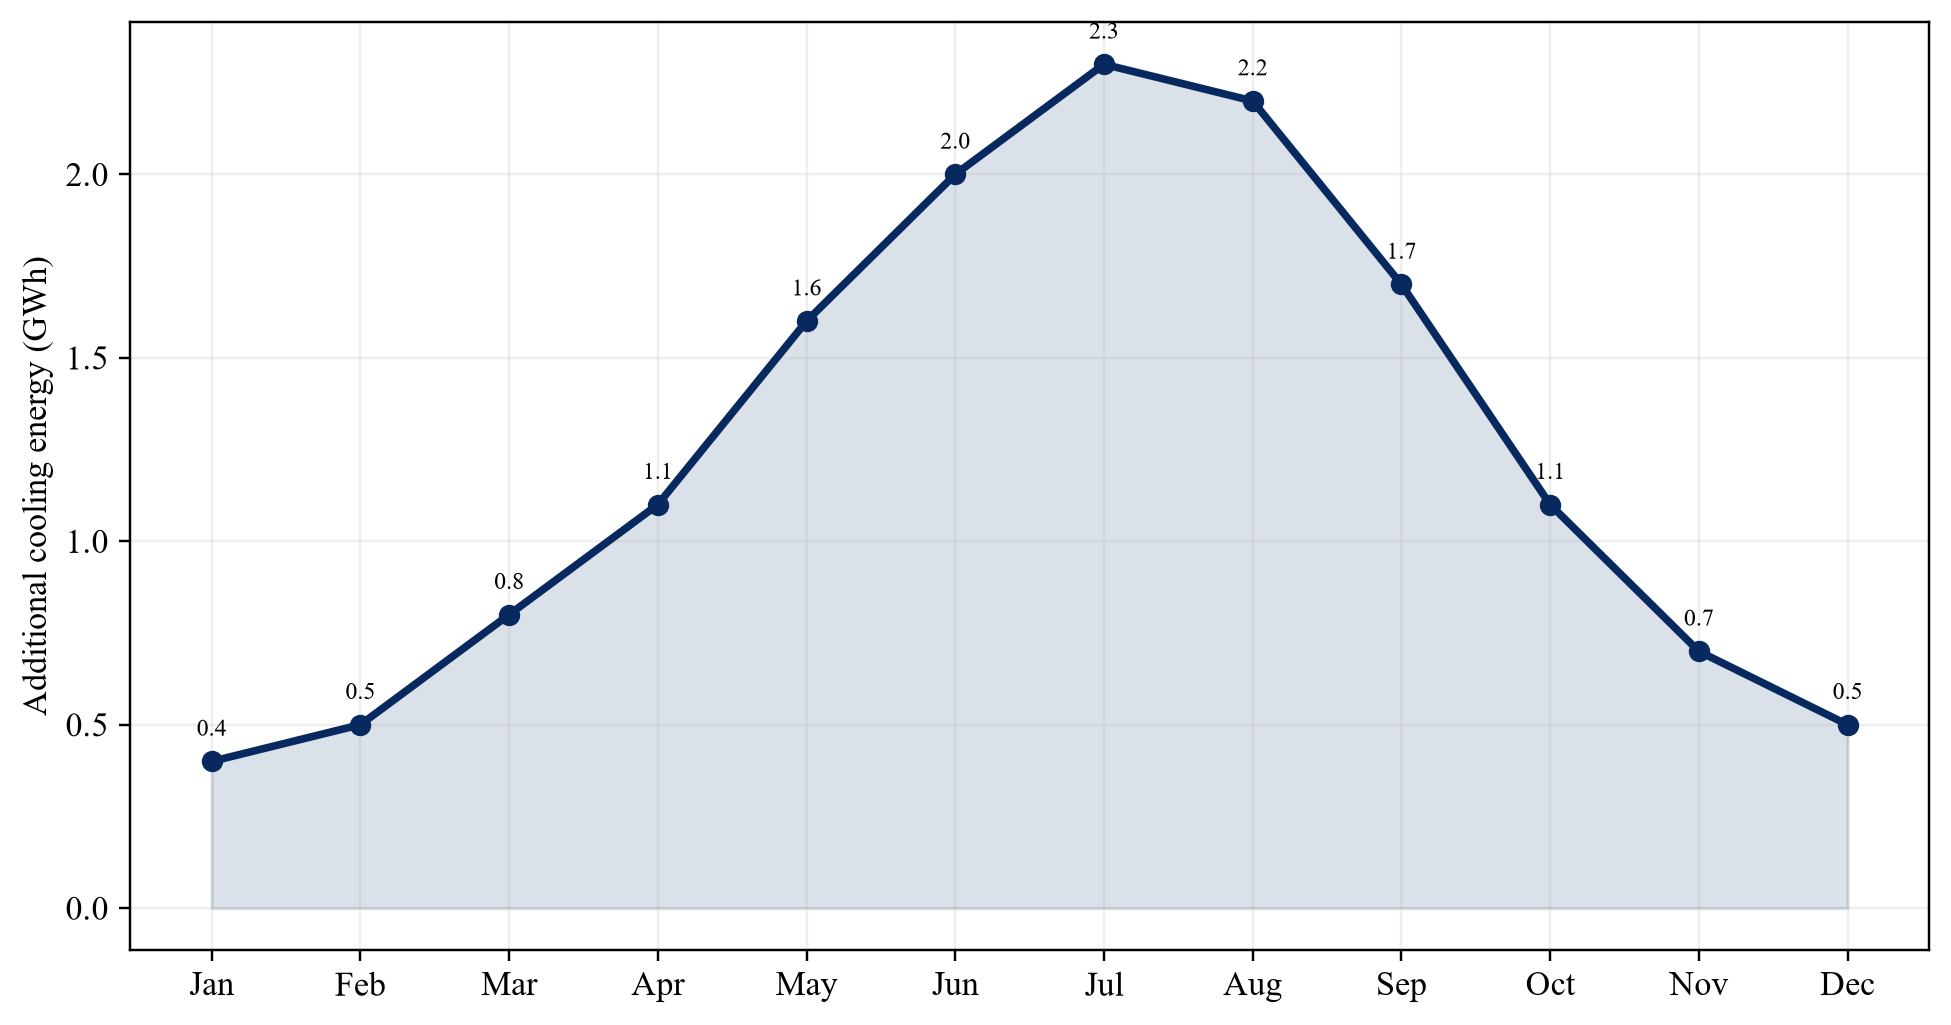
Build an hourly cooling-power model for pumps, fans, chillers, towers, cooling distribution units and controls. Test tariff periods, demand charges, grid constraints and backup-generation implications. A water-saving retrofit can reduce deliverable information-technology capacity if the electrical connection cannot support the added load.
Calculate marginal PUE and incremental megawatt-hours for each cooling mode. Link power assumptions to the signed tariff and meter history. Include degradation and part-load performance rather than relying only on design efficiency.
Test whether cooling power competes with computing load under a capped grid connection. The economic cost can exceed the electricity bill when an additional cooling megawatt displaces billable information-technology capacity. Model both outcomes: purchased energy where headroom exists, and lost or deferred customer capacity where it does not. Include the capex and timing of any grid reinforcement required to preserve load.
17. Value peak-capacity preservation
Cooling creates value when it preserves contracted computing output during the hottest hours. Map thermal headroom to customer service levels, liquidated damages, credits and termination rights. Determine whether the facility can derate workloads, shift them, use redundant equipment or tolerate higher inlet temperatures.
Avoid assigning a general resilience premium. Value the expected avoided cash loss under evidenced contracts, outage history and probability. Record any customer-specific capacity reservation or qualification that depends on the cooling design.
18. Review AI customer qualification
Obtain technical schedules for rack density, coolant temperatures, water chemistry, pressure, redundancy, maintenance and telemetry. Confirm whether target customers have accepted the architecture through design review, factory tests, commissioning and operating history. Unqualified cooling capacity is development inventory rather than contracted operating capacity.
Customer concentration can magnify design risk. A system optimized for one accelerator generation or vendor may require retrofit for another. Review change provisions and who funds customer-driven upgrades.
19. Map permits, discharge and environmental obligations
Compile water connection, abstraction, recycled-water, chemical storage, blowdown, discharge, noise, refrigerant, construction and environmental permits. Reconcile permit limits to design-day operation. Confirm monitoring, sampling, reporting and renewal obligations.
Abu Dhabi's water-management policy references water-quality, recycled-water, trade-effluent, marine-discharge and district-cooling technical rules. A data-centre transaction requires its own legal mapping; this policy demonstrates the range of interfaces that can affect heat-rejection infrastructure. [11][15]
20. Test physical resilience and redundancy
Review N, N+1 or 2N configuration for chillers, towers, pumps, cooling distribution units, heat exchangers, pipes and controls. Test common-mode dependencies such as one water main, one treatment plant, one control system or shared electrical switchgear. Inspect isolation, bypass and black-start procedures.
Compare design redundancy with maintenance records and actual failover tests. A redundant component adds little value when valves, controls or electrical supply create a single point of failure.
21. Build the lifecycle capex schedule
Separate remaining construction cost, deferred maintenance, expansion capex, customer-fit-out capex and technology-conversion capex. Record equipment age, operating hours, maintenance cycles, refrigerants, spare parts, vendor support and replacement lead times.
Model towers, chillers, dry coolers, pumps, heat exchangers, cooling distribution units, controls and water-treatment assets separately. Cooling assets can have different useful lives from the building and customer lease. Use evidence from condition assessments and service contracts.
22. Model the retrofit pathway
Define phases by hall, load and customer window. Identify shutdown requirements, temporary cooling, design approvals, procurement, commissioning tests and rollback plans. Link expenditure to objective milestones and retained contract capacity.
Retrofit value depends on execution while the facility earns revenue. A theoretically superior system can destroy value through downtime, schedule delay or lost customer qualification. Include owner engineering, contingency, interest during construction and revenue interruption.
Create a hall-by-hall migration plan with temporary cooling and reversible cutover points. Link payments to design approval, factory acceptance, delivery, installation, integrated systems testing and sustained performance. Confirm access to long-lead equipment and specialist labour. The acquisition agreement and financing documents should use the same milestone definitions so that completion risk does not fall between contractual regimes.
23. Compare candidate locations on consistent boundaries
Build a site matrix with the same valuation date, capacity definition, weather standard, customer product and funding horizon. Compare delivered computing capacity, service date, total development cost, operating cost, water withdrawal, water consumption, cooling electricity, network performance, data-residency compliance, expansion rights and terminal options.
Scores can support screening, but the investment decision should retain physical units and cash. A weighted score can hide a fatal constraint or compensate for missing electricity with attractive land. Use pass-or-fail gates for essential rights, then value the sites that remain.
The base case should use the current design and binding rights. The development case can include approved but incomplete infrastructure with probability, timing and capital. A strategic option can recognise a future source, technology or network route only where the company controls a practical path to exercise it.
24. Test alternative cooling architectures by location
Compare evaporative, hybrid, closed-loop dry, direct-to-chip and immersion configurations using the same computing load and reliability requirement. Model seasonal operating modes rather than one annual efficiency number. A hybrid design can use dry rejection during cooler periods and water during hot periods. Direct-to-chip cooling can reduce internal heat-transfer losses while the final heat-rejection stage still determines water and power demand.
Technology selection should reflect hardware qualification, coolant temperature, rack density, serviceability, leak detection, redundancy, vendor support and customer acceptance. A technically efficient design can delay revenue when long-lead equipment or specialist commissioning extends the programme.
Site and architecture choices should be evaluated together. A temperate site can support economisation while increasing latency to a customer region. A hot inland site can need more cooling power but provide superior network or electricity access. A coastal site can have seawater or district-cooling options with specific corrosion, intake, discharge and environmental duties.
25. Price the electricity and water trade-off
For each hour or representative interval, calculate information-technology power, pumps, fans, cooling distribution units, chillers, towers, treatment and other facility loads. Calculate water withdrawal, consumption and discharge on the same interval. Apply the relevant tariffs, demand charges, scarcity conditions and contractual minimums.
The economic cost of cooling electricity can exceed the energy bill when the site has a capped grid connection. One additional megawatt of cooling can displace one megawatt of billable information-technology capacity. The model should show purchased-energy cost where headroom exists and capacity opportunity cost where it does not.
Indirect water use from electricity generation can also vary by location and supply portfolio. Lawrence Berkeley National Laboratory identifies grid water-consumption factors among the determinants of workload-level water use.[2] Report direct facility water and indirect electricity-related water separately so that a boundary change is visible.
26. Preserve network and regulatory feasibility
A physically attractive site has limited value when customers cannot use it. Confirm fibre routes, carrier diversity, latency, cloud-region architecture, data-residency requirements, export controls, customer contracts and cyber conditions. Map which workloads can move and which must remain in a defined jurisdiction or availability zone.
The European Union requires reporting of specified data-centre energy and water information under its reporting framework.[6][7] Other jurisdictions use different environmental, planning and utility rules. The location model should record current obligations and avoid applying one jurisdiction's requirements to another.
Alternative-location value should be limited to transferable workloads and rights. Moving a training task, internal batch process or backup workload can be easier than moving latency-sensitive inference or regulated data. The model should identify the revenue and capacity that each location can actually serve.
27. Model service date and capital irreversibility
Cooling equipment, water connections, electrical infrastructure and customer fit-out have different lead times. Build a schedule from land control and permits through utility studies, detailed design, procurement, construction, commissioning, customer qualification and paid operation.
Capital becomes progressively harder to reverse. Early options can preserve several locations at modest cost. Bespoke substations, pipelines and cooling plants create location-specific sunk capital. The board should use staged commitments, termination rights and evidence gates to keep choices open until the decisive constraints are proven.
Delay has several costs. It can defer customer revenue, extend development overhead, increase equipment price and consume a reserved grid or land position. It can also allow a better technology or utility solution to mature. The model should calculate delay rather than treating the earliest site as automatically superior.
28. Allocate capacity across a portfolio
A portfolio can diversify basin, climate, utility, regulatory and customer exposure. Diversification requires independent infrastructure. Two campuses dependent on the same watershed, transmission corridor, carrier route or equipment supplier can share a failure mode despite geographic distance.
Allocate workloads according to latency, residency, hardware, network and customer requirements. Preserve spare capacity and migration paths where the expected benefit exceeds the cost. A reserve site provides option value only when power, cooling, network and operating arrangements can support timely activation.
Portfolio optimisation should avoid double counting. The same workload cannot support full revenue at two locations. The same reserve capacity cannot be sold to several customers with simultaneous rights. Report active, committed, reserved and optional capacity separately.
29. Convert site evidence into cash flow
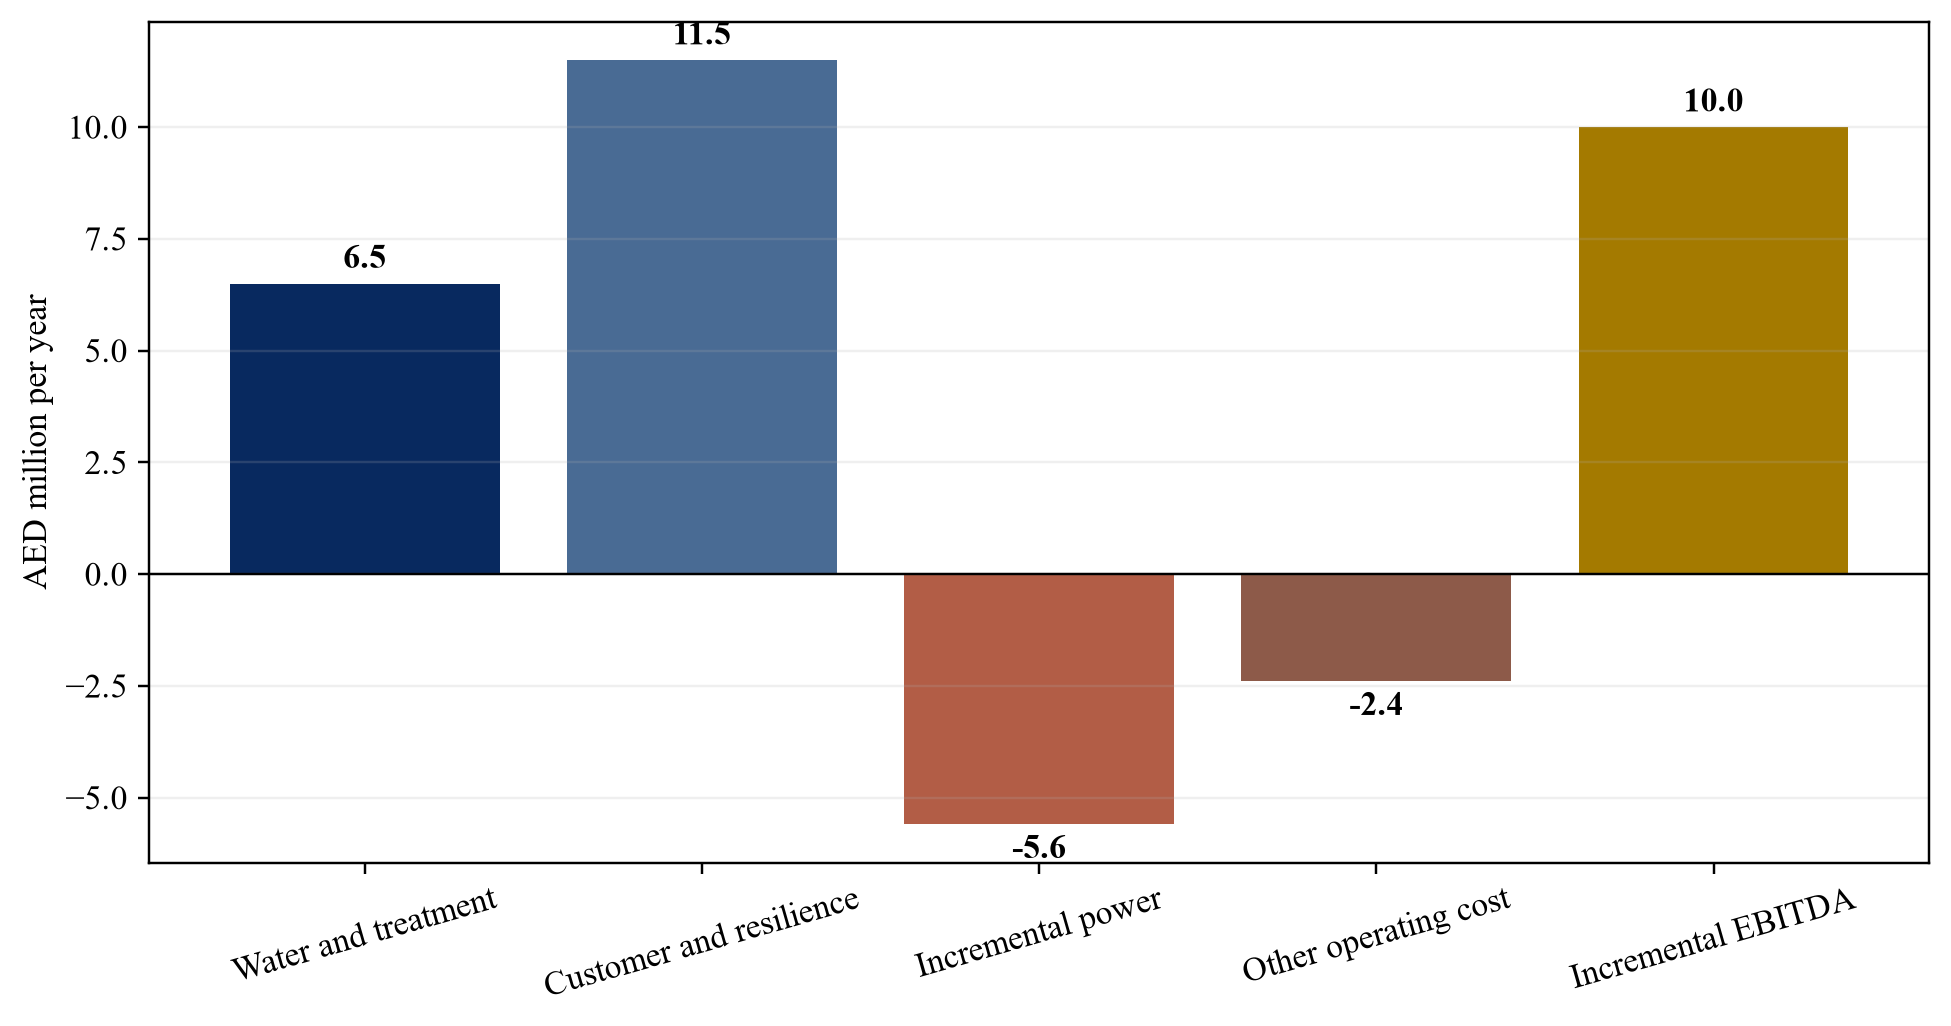
Model customer capacity revenue, electricity, water, treatment, chemicals, maintenance, network, land, taxes, insurance, permits, sustaining capex, expansion capex and financing. Use monthly periods through construction and ramp. Separate legal entities and currencies where relevant.
Link each material line to an evidence source. Customer revenue should trace to executed terms or a clearly labelled commercial scenario. Utility cost should trace to current tariffs or contracts. Cooling performance should trace to engineering and test evidence. Construction cost should trace to comparable scope and supplier proposals.
The site model should retain a no-build case and alternative-location cases. A site earns value through controlled rights and deliverable capacity. Land appreciation, future scarcity and strategic importance should not enter the approved base case without a supportable market-participant basis.
30. Value development stages and location options
Value the project at successive states: controlled land, feasible utilities, permitted design, funded construction, commissioned capacity, customer-qualified capacity and paid operation. Apply probability and discounting to future states using assumptions that reflect the evidence available at the valuation date.
The cost approach can test replacement and remaining expenditure. Discounted cash flow can value contracted or supportable operating cash. Market evidence can provide a reasonableness check where transactions have comparable location, rights, maturity, cooling and customer characteristics. Do not apply a stabilized multiple to conditional development capacity.
Location options can include expansion land, additional water source, dry-cooling conversion, district connection, workload relocation or a second campus. An option requires control, feasible exercise and an economic use. General market growth does not create an asset-specific option by itself.
31. Structure financing around proven capacity
Debt should follow completed rights, construction certainty, tested performance and contracted cash. Development facilities can fund land, studies and early works with sponsor support and draw conditions. Construction debt can use cost-to-complete tests, contingency, completion guarantees and objective commissioning milestones. Operating debt can recognise cash after capacity is available and customer obligations are effective.
Water and cooling covenants should use measurable quantities: secured source capacity, minimum storage, operating WUE boundary, maximum cooling power under design conditions, temperature compliance, availability, maintenance and funded lifecycle capital. Cure rights should preserve customer service.
Financing documents should reconcile security and step-in rights over land, utilities, cooling plant, control software and customer contracts. A lender should understand whether essential cooling equipment is leased, subject to vendor title or dependent on a non-transferable service agreement.
32. Use a hypothetical portfolio decision
Consider three hypothetical candidate sites for a 48 MW first phase. Site A is hot and water-stressed, with strong network access and dry-cooling power headroom that remains conditional on a grid upgrade. Site B has moderate climate and a binding reclaimed-water allocation, but a later customer-ready date. Site C offers early electricity and coastal heat-rejection options, with additional environmental permitting and data-residency limits for part of the target demand.
Management assigns no market price or forecast to the illustration. It models only the decision mechanics. Each site receives a capacity bridge, construction schedule, water and power profile, customer-eligible workload set, capital plan and downside case. The board can fund limited option and design work at more than one site while deferring major irreversible capital.
The preferred first phase depends on verified customer demand and the binding constraints. Site A can lead where grid reinforcement and dry-cooling performance become firm. Site B can lead where the later date remains compatible with customer commitments and reclaimed supply proves reliable. Site C can lead for workloads permitted in that jurisdiction after environmental approvals are complete.
The portfolio can retain a second site for expansion or resilience. Its value equals the cash and risk benefit of the controlled option after the cost of land, studies, network, staffing and idle infrastructure. Every numerical result should remain tied to explicit hypothetical assumptions.
33. Test community and public-infrastructure exposure
Large water and electricity requirements can affect public acceptance, planning conditions and infrastructure cost allocation. The diligence process should identify competing municipal, agricultural, industrial and environmental uses; planned utility investment; consultation requirements; public disclosure; and the basis on which project costs are shared.
Community exposure should be translated into specific scenarios. These can include a later permit, reduced allocation, required reclaimed-water connection, additional storage, revised discharge conditions, restricted operation during drought or a contribution to network reinforcement. A general reputation discount provides little decision value. The model should show the cash, timing and capacity consequence of each supportable condition.
Public statements and sustainability commitments can create their own obligations. Confirm which water boundary, source and period a target uses, and whether a claim covers owned facilities, leased capacity or the electricity supply chain. A site-selection decision should preserve the data needed for later reporting and customer assurance.
34. Stress correlated failures
Water, electricity and cooling risks can become correlated. Extreme heat can raise computing and cooling demand, reduce dry-cooling performance, increase water consumption and strain the grid during the same period. Drought can affect hydropower or thermal generation as well as facility water. A construction delay can leave both a grid reservation and a customer commitment exposed.
The downside analysis should combine these drivers. Test hot weather, lower utility allocation, higher power price, delayed connection, cooling underperformance, customer-ramp changes and capex overrun in one coherent case. Preserve physical relationships when adjusting assumptions. Lower water use may require higher electricity. Lower customer load may reduce water and revenue together.
The committee should see the liquidity required to complete, resize or stop the project under each combined case. It should also see whether another portfolio site can absorb eligible demand, the time required to activate that option and the incremental network and operating cost.
35. Establish the investment decision
The committee should approve a site, a staged capital amount and a defined evidence package. State which power, water, network, permit and customer rights are binding; which cooling performance has been demonstrated; which construction commitments are fixed; and which benefits remain contingent.
Present the selected site against credible alternatives using the same capacity and valuation boundaries. Explain the decisive constraints, unresolved conditions, downside funding and exit options. Assign engineering, legal, commercial, finance and operating owners to the evidence they control.
The decision record should preserve the valuation date, source documents, assumptions and model version. Reopen the site decision when a utility right, customer requirement, cooling technology, environmental obligation or service date changes materially.
36. Limitations and conclusion
Water availability, cooling technology, electricity systems, customer requirements, equipment, regulation and construction markets can change. Global risk tools, national statistics and company disclosures provide screening and comparative evidence. They do not establish the rights, performance or value of an unidentified site.
The investment case depends on local evidence. Obtain current utility, engineering, customer, network, environmental, legal, supplier and financing records. Use measured performance when available. Label every management estimate and scenario in the model.
Water scarcity affects value through capacity, cost, timing and optionality. A site can remain investable with low-water cooling when electrical headroom, customer acceptance and performance are proven. A water-secure site can lose value when network, data or construction constraints prevent revenue. The chosen location should maximise supportable risk-adjusted cash from deliverable computing capacity.
37. Confirm governance and monitoring
The committee should approve a price and funded operating plan, not a cooling slogan. State which water and power rights are proven, which capacity is customer-qualified, which retrofit is committed and which benefits remain contingent. Present central, downside and no-retrofit cases.
The final record should identify evidence, assumptions, legal advice, engineering reliance, conflicts, open conditions and monitoring owners. Where water or cooling evidence is incomplete, reduce base value and preserve the option through contingent consideration or staged capital.
The committee paper should show a clean bridge from physical capacity to cash. Begin with installed information-technology capacity, reduce it for commissioning, redundancy and thermal constraints, then identify customer-qualified and billable capacity. Reconcile the resulting load with annual water withdrawal, electricity demand, cooling operating cost and customer revenue. Show the retrofit as a separate investment with its own capex, completion date, performance test and financing. This prevents a buyer from paying for both unproven capacity and the capital required to make that capacity usable.
Decision rights should match exposure. Engineering should sign the thermal design and performance evidence. Legal advisers should identify the enforceability and transferability of water, power, discharge, customer and vendor rights. Finance should own the cash-flow reconciliation, valuation bridge and funding plan. Operations should own commissioning, maintenance and contingency procedures. The investment committee should approve the unresolved-risk treatment and the maximum capital at risk before each gate. A single named executive should be accountable for the integrated outcome because water, power, customers and financing can fail together.
Decision exhibits
Wholly hypothetical; Matchpoint Partners analysis.
Table 1. Cooling-architecture decision matrix
| Architecture | Water profile | Power profile | Principal transaction issue |
|---|---|---|---|
| Evaporative rejection | high operational consumption | lower in favourable wet-bulb conditions | water right and escalation |
| Hybrid rejection | seasonal water use | mode-dependent | controls and design thresholds |
| Closed-loop dry | low cooling water | higher peak fan and chiller load | electrical headroom |
| Direct-to-chip plus dry | low cooling water and high density | design-dependent | customer and hardware qualification |
Proposed framework unless stated otherwise.
Wholly hypothetical; Matchpoint Partners analysis.
Table 2. Water-right evidence ladder
| State | Minimum evidence | Valuation treatment |
|---|---|---|
| Indicative availability | utility correspondence | feasibility only |
| Allocated capacity | binding agreement and tariff | contracted input, subject to completion |
| Connected supply | commissioned pipeline and meter | operational capacity |
| Proven operation | bills, quality tests and peak history | operating cash flow |
| Substitutable supply | tested backup source and storage | resilience value |
Proposed framework unless stated otherwise.
Wholly hypothetical; Matchpoint Partners analysis.
Table 3. Hypothetical retrofit capex perimeter
| Asset | Hypothetical cost | Diligence focus |
|---|---|---|
| Rack and hall liquid loop | AED 18m | customer qualification and leaks |
| Cooling distribution units | AED 11m | redundancy, controls and vendor support |
| Dry heat rejection | AED 15m | peak power and ambient performance |
| Electrical and controls | AED 5m | grid headroom and cybersecurity |
| Commissioning and contingency | AED 3m | outage window and completion evidence |
Figures describe no identified asset.
References
- International Energy Agency. Energy and AI, Energy demand from AI. 2025. https://www.iea.org/reports/energy-and-ai/energy-demand-from-ai
- Lawrence Berkeley National Laboratory. The water use of data center workloads: A review and assessment of key determinants. 2025. https://datacenters.lbl.gov/publications/water-use-data-center-workloads
- Lawrence Berkeley National Laboratory. 2024 United States Data Center Energy Usage Report. 2024. https://datacenters.lbl.gov/publications/2024-lbnl-data-center-energy-usage-report
- United States Department of Energy. Cooling Water Efficiency Opportunities for Federal Data Centers. https://www.energy.gov/cmei/femp/cooling-water-efficiency-opportunities-federal-data-centers
- ASHRAE. AI Data Center Energy Performance Framework: Introduction and Purpose. https://www.ashrae.org/technical-resources/ai-data-center-framework/introduction-and-purpose
- European Commission. Energy performance of data centres. https://energy.ec.europa.eu/topics/energy-efficiency/energy-efficiency-targets-directive-and-rules/energy-efficiency-directive/energy-performance-data-centres_en
- European Commission. Commission Delegated Regulation (EU) 2024/1364. https://eur-lex.europa.eu/eli/reg_del/2024/1364/oj/eng
- European Commission. Strategic Roadmap for the digitalisation and artificial intelligence of the energy sector. 3 June 2026. https://energy.ec.europa.eu/document/download/fbe97b7a-20ff-4361-a8b2-9a4055695f3a_en
- Infocomm Media Development Authority of Singapore. Tropical Data Centre Standard. Updated 23 September 2025. https://www.imda.gov.sg/how-we-can-help/green-dc-roadmap/tropical-dc-standard
- World Resources Institute. Aqueduct Water Risk Indicators. https://www.wri.org/aqueduct/help-center/water-risk-indicators
- World Resources Institute. Grounding Global Water Risk Assessments in Local Data. 10 July 2025. https://www.wri.org/technical-perspectives/grounding-global-water-risk-assessments-local-data
- Microsoft. 2025 Environmental Sustainability Report. https://cdn-dynmedia-1.microsoft.com/is/content/microsoftcorp/microsoft/msc/documents/presentations/CSR/2025-Microsoft-Environmental-Sustainability-Report.pdf
- Microsoft. Inside Microsoft's two-decade push to cut water intensity while scaling for growth. 24 June 2026. https://blogs.microsoft.com/blog/2026/06/24/inside-microsofts-two-decade-push-to-cut-water-intensity-while-scaling-for-growth/
- IFRS Foundation. IFRS 13 Fair Value Measurement. https://www.ifrs.org/issued-standards/list-of-standards/ifrs-13-fair-value-measurement/
- IFRS Foundation. IAS 36 Impairment of Assets. https://www.ifrs.org/issued-standards/list-of-standards/ias-36-impairment-of-assets/
- International Valuation Standards Council. International Valuation Standards. https://www.ivsc.org/standards/
About the Author
Authored by Chennakeshav Adya Independent Researcher
Chennakeshav (CK) is a corporate finance and investment banking executive with 25+ years of global experience in deal origination, structuring and execution across M&A, growth capital and corporate strategy. He has led value-creation mandates for founders, corporates and funds — bridging the boardroom view to hands-on execution and close.
His career spans Morgan Stanley, HSBC, Lloyds Banking Group, EWEC, ADQ portfolio companies and Emirates Growth Fund, across TMT, real estate, fintech, deeptech, cleantech, infrastructure and energy. He has partnered with C-suite leaders, private equity and venture funds, sovereign wealth funds and family offices to finance complex fund raises and scale-up ventures, and has led M&A due diligence, post-merger integration and business-transformation initiatives to create value.
At Matchpoint Partners he is Managing Partner, leading the firm's corporate finance, M&A and capital-raising practice. He holds an MBA from London Business School, an engineering degree from VTU and a Master of Laws (LLM, in progress) from UCL London.
An active start-up mentor, CK mentors at Techstars, DIFC FinTech Hive, Startup Grind, Founder Institute and IN5, serves as Entrepreneur Mentor in Residence (EMiR) at London Business School, and judges the Entrepreneurship World Cup.
Matchpoint profile: https://www.matchpoint-partners.com/team/ck-adya.html LinkedIn: https://www.linkedin.com/in/ckadya/
