

Introduction
Data-centre location decisions combine power, fibre, latency, land, water, skills, tax, regulation, customer proximity and resilience. Electricity deserves a separate model because its cost and availability affect both operating margin and the pace at which revenue-producing capacity can be installed. A small error in price applied to a large continuous load can outweigh differences in land or construction cost.
Average market data provide context. They do not reproduce a project bill. A data centre may buy wholesale energy, pay a regulated utility tariff, negotiate a special contract, procure renewable power, own generation or combine several routes. The final cost can include fixed customer charges, metered energy, billing demand, system peak, capacity, transmission, distribution, losses, balancing, ancillary services, taxes, environmental attributes and project-specific network investment.
This paper addresses the investment-location decision. It creates a common tariff architecture, tests several operating profiles, distinguishes price from service and connects the result to land acquisition, financing, customer contracts and public policy.
1. Define the location decision
State the decision date, candidate markets, required initial load, expansion path, service start, investment horizon and approval authority. Define whether management is selecting one campus, a regional portfolio or a primary and secondary pair. The appropriate tariff comparison depends on the decision perimeter.
Fix the counterfactual. A campus in one market may replace two smaller campuses elsewhere, or it may add capacity to an existing portfolio. Include migration, network, customer and resilience consequences. A narrow utility-bill comparison can favour a location that creates higher end-to-end cost.
Define the threshold for proceeding. The investment committee may require a maximum risk-adjusted electricity cost, a minimum dependable capacity, a delivery date, renewable-energy attributes, credit support and customer margin. These criteria should be set before commercial offers are ranked.
2. Specify the electricity service
Describe the electrical product required. State voltage, import capacity, firm and interruptible tranches, power quality, redundancy, outage allowance, restoration, ramp rate, commissioning profile and expansion option. Add any export, storage, backup generation and demand-response capability.
The same nominal megawatt can represent different service. A firm dual-feed arrangement with defined restoration differs from non-firm capacity subject to frequent curtailment. A lower tariff can reflect a lower service level. Compare price only after normalising service.
Record operating obligations. Utilities and system operators may require telemetry, ride-through, minimum power factor, staged energisation, load forecasting, security and flexible operation. Compliance capital and operating restrictions belong in the location model.
3. Use one common load profile
Create an hourly or representative-period profile for information-technology load, cooling, losses, offices, batteries and commissioning. Model seasonal temperature effects, workload growth, equipment refresh and utilisation. Use the same profile across candidate locations before applying local adjustments.
Separate connected capacity from billing demand and energy consumption. A 100 MW connection does not imply 876 GWh of annual energy. It can also create charges based on contracted or ratcheted demand even when consumption is lower.
Document flexibility. Identify workloads that can shift, batteries that can reduce peaks and backup generation that can operate lawfully. Apply customer-service, equipment and regulatory constraints. Flexibility has value only when dispatch rights and measurement support it.
4. Decompose the tariff before comparing prices
Build a tariff stack with fixed charge; metered energy; time-of-use or real-time energy; maximum demand; coincident system peak; capacity or resource adequacy; transmission; distribution; losses; ancillary services; balancing; renewable or carbon charges; taxes; connection cost; minimum bill; security; and exit liability.
For each component, record unit, billing determinant, index, reset frequency, floor, cap, lag and authority. A cents-per-kilowatt-hour headline can omit material demand and network charges. A low energy rate can coexist with a high minimum bill or connection contribution.
Identify whether the component is regulated, market-based or bilateral. That classification informs forecast method, hedgeability and change risk. The result is a reproducible bill rather than a promotional quotation.
5. Separate wholesale energy from the delivered bill
Wholesale power prices reflect generation and market conditions at a node or zone. The customer bill can add network, capacity, losses, balancing, taxes and retail margin. A power-purchase agreement can hedge energy or environmental attributes while leaving delivery charges and basis exposure.
Model the settlement path. State the reference price, physical delivery point, shape, volume, imbalance, credit and curtailment. Reconcile hedge cash to utility invoices. A fixed renewable price at one node does not fix the cost of serving a constant load elsewhere.
Use historical prices to describe volatility, not to guarantee future cost. Build scenarios for fuel, carbon, congestion, renewable output and policy. Identify which risks the contract transfers and which remain with the campus.
6. Measure demand charges correctly
Demand charges can use the highest interval in a month, a contracted demand, a rolling ratchet or several time windows. Determine the measurement interval, applicable season, minimum percentage and treatment of outages or commissioning.
Calculate demand from the project profile. A short peak can set a full month's charge. A ratchet can preserve high billing demand after utilisation falls. Expansion can move the customer into another tariff class.
Test battery and workload controls against the exact billing rule. Peak reduction must occur in the relevant interval and remain available across repeated events. Include efficiency losses, degradation and opportunity cost.
7. Model coincident peak and capacity exposure
Some charges depend on demand during system peaks or on assigned capacity obligations. The campus may know the event only after it occurs or may forecast and respond. Model event uncertainty, notification, baseline and portfolio coordination.
A data centre with flat load can carry a material capacity allocation. Flexible operation may reduce exposure, subject to programme rules and customer constraints. The model should include both avoided charge and non-performance risk.
Do not combine coincident-peak value with separate demand-response revenue unless the same reduction is eligible for both. Maintain a rights and settlement ledger for each flexibility action.
8. Include transmission and distribution charges
Network charges recover shared and customer-specific infrastructure. They can be volumetric, demand-based, locational, postage-stamp, connection-specific or a hybrid. State the charging basis and expected reform path.
Large-load growth has intensified debate about cost allocation. In June 2026, FERC directed six regional operators to justify or reform large-load tariff rules, including transparency and protection against cost shifting.[6] The location model should therefore contain a tariff-change case rather than assuming current treatment lasts indefinitely.
Separate embedded network rates from direct project contributions. A customer can pay both a recurring tariff and upfront or staged upgrade cost. Compare present value and liquidity, not only annual expense.
9. Treat connection cost as part of electricity economics
Record application fees, studies, deposits, security, substations, lines, transformers, protection, metering, telecommunications and upstream reinforcement. Allocate engineering, owner cost, contingency, escalation and financing carry.
Classify each payment as refundable, creditable, reimbursable, depreciable or sunk. Document recovery timing and conditions. A low operating tariff can be offset by a high non-refundable connection contribution.
Link connection cost to capacity and delivery date. A phased arrangement can reduce early capital and match customer ramp. It can also produce higher unit cost if temporary facilities or repeated works are required.
10. Model minimum bills and take-or-pay commitments
Utilities can require payment for reserved capacity whether consumed or not. Review contracted demand, minimum energy, ramp schedule, service term, security, downgrade rights and termination charges. These commitments can protect ratepayers against stranded infrastructure and create a fixed cost for the sponsor.
Build the minimum bill into early years when campus utilisation is uncertain. Reconcile it with customer ramp and financing. A discount tied to high utilisation can become expensive when demand arrives late.
Negotiate staged reservations, capacity release, substitution or transfer where feasible. The model should value flexibility to reduce or redirect capacity after a downside event.
11. Price curtailment and interruptibility
An interruptible tariff can reduce price or accelerate connection in exchange for curtailment rights. Define trigger, notice, frequency, duration, seasonal limits, restoration and compensation. Determine whether the operator can curtail for emergency, economics, network work or forecast conditions.
Translate curtailment into computing effects. Some training or batch workloads can shift; latency-sensitive inference and customer commitments may not. Include restart, rebound, migration and equipment consequences.
Value the discount against expected and severe curtailment. Preserve backup supply only where technically, legally and environmentally feasible. A lower tariff should not be treated as a saving if service loss exceeds it.
12. Include losses, power factor and quality
Loss factors can apply between wholesale settlement and customer delivery. They vary by voltage, location and time. Include them in both energy volume and hedge reconciliation.
Tariffs may charge for reactive power, poor power factor, harmonics or other quality effects. Equipment and control systems may be needed to comply. A large electronic load can also face ride-through and modelling obligations.
Review measurement and dispute procedures. Power-quality events can affect both the bill and computing availability. The investment case should include monitoring, remediation and contractual recourse.
13. Separate taxes, levies and exemptions
List electricity taxes, value-added tax, environmental levies, public-service charges and local surcharges. Identify exemptions, rebates and eligibility periods. Confirm whether the project, legal entity or end use qualifies.
Avoid treating a temporary incentive as permanent tariff value. Model expiry, clawback, employment or investment conditions and change in law. Seek specialist tax and regulatory advice for the actual structure.
Compare after-tax cash. A low pre-tax energy price can rank differently after network charges and levies. Public support should remain a separate bridge so the board can see underlying economics.
14. Model indexation and tariff resets
Identify fuel, inflation, exchange-rate, carbon and regulatory indices. Record reset frequency, lag, cap, floor and rebasing. Singapore's regulated tariff, for example, contains fuel and non-fuel components and is revised quarterly; fuel cost reflects preceding gas-price observations.[8][9]
Run correlated scenarios. Fuel and exchange rates can move together. High demand can raise wholesale price, network investment and capacity charges. A single inflation sensitivity can miss these interactions.
Distinguish contractual indexation from discretionary regulatory review. A published formula can be modelled directly. A future rate case requires scenarios and governance, including the possibility of new large-load classes.
15. Compare market evidence at the correct scale
Official averages provide a benchmark, subject to consumption band and customer mix. EIA reported a 2025 U.S. average industrial electricity price of 8.62 cents per kilowatt-hour, while state averages across all customer types ranged widely.[2] Eurostat reported an EU non-household average of EUR 18.37 per 100 kilowatt-hours in the second half of 2025 for a specified consumption band.[3]
These figures should not be inserted as data-centre tariffs. A hyperscale campus consumes far more than the cited European band and can face bespoke connection and network terms. Use official averages to challenge plausibility and understand dispersion.
Obtain project-specific schedules and offers. Reconcile them to public tariffs and identify every deviation, concession, contribution and expiry.
16. Account for generation mix and procurement choice
The local generation mix affects wholesale volatility, carbon attributes, fuel exposure and availability. IEA projects data-centre electricity demand to grow materially through 2030, with renewables, natural gas, coal and nuclear contributing in different regional proportions.[1]
Compare utility service, retail supply, direct power purchase, virtual power purchase, onsite generation, co-location and storage. Each route changes basis, credit, operational and regulatory risk. Environmental attributes should be traced separately from physical service.
Model residual supply after renewable matching. A campus that claims annual renewable procurement can still depend on grid power during other hours. The investment case should state the chosen carbon-accounting boundary and evidence.
17. Price tariff stability as an asset
Stable, transparent rules can support financing even when the initial price is higher. Investors can model cash, customers can price service and lenders can size debt. Frequent retrospective changes or opaque discretion increase risk.
Assess the legal basis, regulator independence, consultation process, appeal rights, utility credit and history of change. Review whether special contracts require public approval or can be reopened.
Translate instability into scenarios, reserves, covenant headroom and customer pass-through. Avoid hiding it in an arbitrary discount-rate premium. The board should see the specific cash and liquidity effects.
18. Evaluate customer pass-through
Colocation and cloud contracts can pass electricity through, bundle it into service price, apply a power band or allocate it through a formula. Review measurement, index, timing, floor, cap, audit, disputes and termination.
Pass-through can protect margin while affecting competitiveness and demand. A customer may resist open-ended regulated charges or reject costs caused by another tenant. Shared infrastructure requires an allocation method.
Reconcile supplier invoices to customer billing and collections. Financeable recovery depends on contract enforceability, customer credit and timely settlement. Keep unrecovered electricity cost in the downside case.
19. Convert the tariff into unit compute economics
Translate electricity cost into the service unit used by management: rack, kilowatt of IT load, accelerator-hour, training run or customer contract. Include power-usage effectiveness, utilisation and equipment performance. This connects energy assumptions to revenue and margin.
Avoid assuming that the lowest electricity price creates the lowest compute cost. Cooling, server efficiency, network latency, utilisation and customer mix can dominate. Use the location model as one part of a full unit-economic comparison.
Show the electricity share of revenue and operating cost under central and downside cases. Identify the price or utilisation at which a location loses competitiveness.
20. Value time to power
A higher tariff at an available site can outperform a lower tariff behind a long connection queue. Model revenue start, customer commitments, carrying cost, equipment depreciation, escalation and competitive delay.
Use a probability-weighted energisation schedule supported by studies and construction evidence. Include temporary and phased service. Apply the tariff only to capacity that can operate.
Calculate the value of one year of earlier delivery and compare it with the present value of higher electricity cost. This trade-off often determines the rational location choice.
21. Integrate land and construction economics
Add land acquisition, planning, building, cooling, water, fibre, tax and labour to the location case. Keep electricity components visible so management can understand cross-subsidies and trade-offs.
Climate affects cooling and water. Geography affects equipment, construction and insurance. A low-energy-price desert location can require different cooling capital from a northern location. A hydro-rich market can have route or environmental constraints.
Build a common cost boundary and currency date. Convert cash at scenario exchange rates and identify local financing. Avoid comparing nominal totals with inconsistent escalation.
22. Build a risk-adjusted location score
Use decision criteria that reflect economics and execution: dependable capacity; energisation date; full tariff present value; connection capital; volatility; tariff stability; flexibility; renewable procurement; water; fibre; customer reach; regulation; and exit value.
Define weights before scoring. Show raw measures and scores. A weighted total supports discussion but should not conceal a fatal condition such as unavailable capacity or unacceptable data sovereignty.
Apply thresholds and vetoes. Then test whether reasonable changes in weights alter the ranking. A robust choice should remain attractive across several decision perspectives.
23. Build a tariff data room
Store tariff schedules, special contracts, regulator decisions, market data, invoices, interval load, network studies, connection agreements, tax opinions and incentive documents. Record source, date, owner and version.
Maintain a component dictionary so terms are comparable across jurisdictions. One market's capacity charge may resemble another market's demand charge while using a different determinant. Translate language without erasing legal distinctions.
Link every model input to evidence. Where a value is estimated by management, identify it and provide a range. The data room should allow an independent reviewer to reproduce the bill.
24. Negotiate the large-load agreement
The large-load agreement can allocate reserved capacity, upgrade cost, minimum term, security, ramp, flexibility, exit and stranded-asset risk. Negotiate it alongside the site and customer plan.
Align payment with delivered capacity. Define delays caused by the customer, utility and force majeure. Provide remedies for reduced capacity and missed dates. Address assignment and change of control.
FERC's 2026 large-load proceedings emphasise transparent cost allocation and protection against cost shifting.[6][7] Similar policy concerns can shape state and utility terms. A commercially attractive agreement should remain defensible to regulators and other customers.
25. Structure public incentives transparently
Governments may offer electricity discounts, tax relief, land, grants or network contributions to attract digital infrastructure. Record the granting authority, legal basis, duration, conditions, budget and clawback.
Separate incentive value from tariff fundamentals. Calculate gross location economics, public support and net economics. This helps authorities assess public value and helps investors understand expiry risk.
Link support to measurable outcomes such as investment, employment, training, grid contribution, renewable procurement or heat reuse. Avoid unsupported multiplier claims. Publishable policy analysis should distinguish programme terms from forecast benefits.
26. Evaluate portfolio diversification
A multi-campus strategy can diversify tariff, grid, climate, regulatory and customer risk. It can also duplicate fixed cost and reduce scale economics. Model portfolio value rather than assuming diversification is free.
Identify correlations. Neighbouring markets can share fuel, weather and network exposure. Currency and regulation can move independently. Customer workloads may be transferable only within residency and latency constraints.
Allocate primary, overflow, disaster-recovery and flexible-compute roles. The tariff model should reflect the load each location actually receives under normal and stressed conditions.
27. Finance the electricity obligation
Lenders should review supplier credit, tariff authority, connection completion, hedging, customer pass-through and minimum bills. Electricity cost can affect debt service even when revenue is contracted.
Build covenant cases for higher tariffs, delayed ramp and under-recovery. Size reserves and liquidity to billing cycles and collateral calls. Avoid assuming immediate customer recovery when contracts have lags or caps.
Where the project enters a long-term supply or hedge, match tenor and volume to financed demand. Include termination values and security. Excess contracted power can become a liability after a demand shortfall.
28. Apply a hypothetical three-location case
Consider a wholly hypothetical 120 MW initial campus expanding to 240 MW. Location North offers lower expected energy cost and high renewable availability but a four-year connection path. Location Gulf offers a two-year phased connection, a quarterly indexed tariff and higher cooling load. Location West offers a three-year connection, market exposure, demand charges and substantial upgrade security.
Using one load profile, the sponsor calculates annual energy, demand, network, tax and flexibility cash. It adds connection capital and delay cost. The initial quoted energy ranking changes after the full bill and timing are included.
The sponsor selects a primary location only after testing customer margin and downside liquidity. It preserves an option at a second location to manage connection and tariff risk. The values in the exhibits are illustrative.
29. Test energy-price sensitivities
Run fuel, wholesale, carbon, exchange-rate and regulated-network scenarios. Apply indices and reset lags. Include negative or low wholesale prices only where the contract and load can capture them.
Model volatility and annual averages. Two markets with the same expected cost can have different liquidity needs. A quarterly indexed tariff can lag fuel movements, while a real-time tariff passes them quickly.
Show unhedged and hedged outcomes. Deduct hedge premium, collateral, basis and imbalance. State residual exposure after each strategy.
30. Test load and efficiency sensitivities
Vary utilisation, power-usage effectiveness, ambient temperature, chip efficiency and workload mix. Lower energy use can reduce volumetric charges while leaving contracted-demand and minimum-bill exposure.
Test accelerated equipment refresh. More efficient hardware may increase compute per megawatt and change the value of capacity. Higher rack density can raise cooling and power-quality requirements.
Link efficiency investment to tariff structure. A project saves most when it reduces the billed determinant. Energy efficiency does not necessarily reduce a coincident-peak or fixed reservation charge by the same proportion.
31. Test tariff reform and stranded-asset cases
Create scenarios for a new large-load class, direct assignment of upgrades, higher security, minimum term, exit fee, flexibility obligation and network-cost reallocation. Use current proceedings and local regulatory powers to define plausible mechanics.
Model a demand shortfall after infrastructure is built. Identify which costs the campus, utility, customers and public bear. A clear allocation can support approval; ambiguity can delay investment.
Set transaction protections around change. Customer contracts can include pass-through; utility agreements can include defined review; investment documents can require re-approval above thresholds. Legal enforceability requires jurisdiction-specific advice.
32. Create a tariff governance cycle
At least quarterly, reconcile forecast, invoice, settlement and customer recovery. Explain differences by component. Update load, price, security and connection schedules.
Assign ownership across energy procurement, finance, operations, tax, regulatory and customer teams. Separate preparation, challenge and approval. Record exceptions and corrective actions.
Refresh location economics before expansion tranches. A market selected for the first 120 MW may cease to be optimal for the next 120 MW after tariff, network or customer changes.
33. Define the investment-committee decision
The committee should receive a common service specification, load profile, tariff stack, connection plan, full-life cash flow, customer recovery, base and downside cases, liquidity requirement and location score. Every material input should carry a source and date.
Approval should state location, capacity tranche, maximum land and connection commitments, tariff assumptions, required contracts, hedging authority, downside funding and re-approval triggers. Preserve exit and alternate-location options until critical evidence is secured.
The record should show why the selected location outperforms its counterfactual. It should also state which developments would reverse the decision.
34. Limitations
Tariffs, market rules, taxes, incentives and grid conditions change. Customer-specific offers may be confidential and depend on credit, size, voltage, timing and negotiation. This paper cannot determine the bill, legality or suitability of an identified project.
Official price datasets use defined customer classes and consumption bands. They may not represent hyperscale data centres. Project analysis requires current utility schedules, market data, network studies and specialist legal, regulatory, engineering, tax and accounting advice.
All numerical examples are hypothetical management assumptions used solely to demonstrate the framework. They are not observed tariffs, market quotations, forecasts or recommendations.
35. Conclusion
Electricity tariffs can redirect digital-infrastructure investment by changing margin, capital, liquidity and delivery timing. The relevant signal is the full risk-adjusted cost of dependable power under the project's actual load and contract profile.
A disciplined sponsor defines the service, applies one load profile, decomposes every charge, prices connection and delay, models customer recovery, tests reform and compares complete location economics. A disciplined authority makes charges transparent, aligns cost with causation and offers credible long-term rules.
Location follows the tariff when the tariff is understood as an economic and contractual system. The board should select the location whose complete power pathway supports customers, financing and long-term operation under evidenced downside conditions.
36. Run a 100-day location and tariff diligence programme
During days 1 to 15, establish the decision perimeter and evidence register. Confirm candidate sites, legal entities, required capacity, voltage, commissioning ramp, reliability, workload constraints and customer delivery dates. Issue a common data request to utilities, energy suppliers, land counterparties and internal operating teams. Freeze the reference load profile, currency date and evaluation horizon so that every offer is tested on the same basis.
During days 16 to 30, reconstruct each candidate tariff. Obtain the current rate schedules, special-contract drafts, market-access rules, connection studies, tax and incentive documents. Separate regulated and negotiated components. Calculate an independent bill for at least twelve representative months and reconcile the result to any utility or adviser model. Record unanswered questions and assumptions in an exception register with an owner and deadline.
During days 31 to 45, test the physical service. Validate firm and interruptible capacity, delivery date, network works, outage and restoration standards, power quality, metering, telecommunications, security and expansion. Review land, route, water, fibre and planning dependencies that could prevent use of the electrical service. Convert the connection schedule into a critical path and identify the capital committed before each de-risking milestone.
During days 46 to 60, build the commercial model. Apply the full tariff stack to the common load profile. Add connection capital, security, minimum bills, hedging, collateral, taxes, customer recovery and financing. Reconcile annual electricity cost to unit compute economics and customer margin. Produce central, downside and severe-liquidity cases with explicit tariff, utilisation and energisation assumptions.
During days 61 to 75, negotiate risk allocation. Align reserved capacity with the customer ramp. Seek staged delivery, transparent upgrade cost, objective completion tests, transferability and remedies for delay or capacity reduction. Match energy procurement and hedging to evidenced load. Draft customer pass-through and flexibility terms that use the same billing determinants as the utility arrangement.
During days 76 to 90, compare locations and challenge the result. Apply thresholds and a documented scorecard. Run sensitivities for weighting, exchange rates, regulation, connection delay, cooling and customer mix. Ask an independent reviewer to reproduce the tariff model from source documents. Investigate any result that depends on one unsupported assumption or a temporary incentive.
During days 91 to 100, prepare the investment decision. Present the selected location, alternate, maximum commitments, conditions, tariff and connection evidence, funding plan and re-approval triggers. Attach the model, tariff ledger, critical path, legal and technical reports, customer recovery analysis and exception register. Convert approval into a controlled execution plan with named owners, deadlines and reporting.
The programme should preserve decision options until the critical evidence is secured. Land deposits, connection security, equipment reservations and customer commitments should be released through coordinated gates. If a material tariff, connection or customer assumption changes, return the decision to the authorised committee before additional capital is committed.
37. Compare utility offers through a controlled bid sheet
Create one bid sheet that every utility, supplier and location team completes. Request the service boundary, voltage, capacity tranches, delivery dates, tariff schedule, connection works, security, minimum term, ramp, flexibility, assignment, renewal and exit terms. Require respondents to identify taxes and third-party charges outside their offer. Record the offer's validity period and approvals still required.
Convert each response into the common tariff dictionary. Where an offer uses a bundled price, request the underlying components or model the bundle as a separate contractual item. Where information remains confidential or unavailable, mark the gap and assign a range. Avoid filling a missing charge with zero.
Evaluate the response in three views. The cash view shows payments by month and funding source. The economic view shows present value and unit compute cost. The risk view shows volatility, discretion, delivery dependencies and maximum downside liquidity. A location can rank differently in each view; the investment committee needs all three.
Run clarification meetings against the bid sheet rather than accepting general presentations. Ask how the bill changes when utilisation is 50, 75 and 95 per cent; when the campus reaches a new demand band; when a system peak occurs; when construction is delayed; and when capacity is surrendered. Request worked invoices for representative months and reconcile every line.
Keep negotiation history. Record each revision, concession and condition. A price reduction linked to a longer term, greater security or higher minimum bill is a transfer of risk rather than a free saving. Update the full model after every material revision and preserve the prior version for approval audit.
Before signing, obtain confirmation that the final commercial schedule matches the regulated tariff, market rules and connection agreement. Resolve inconsistent definitions of capacity, energisation, demand, outage, curtailment and force majeure. The signed package should reproduce the approved location case within stated tolerances and identify the process for future tariff changes.
Decision exhibits
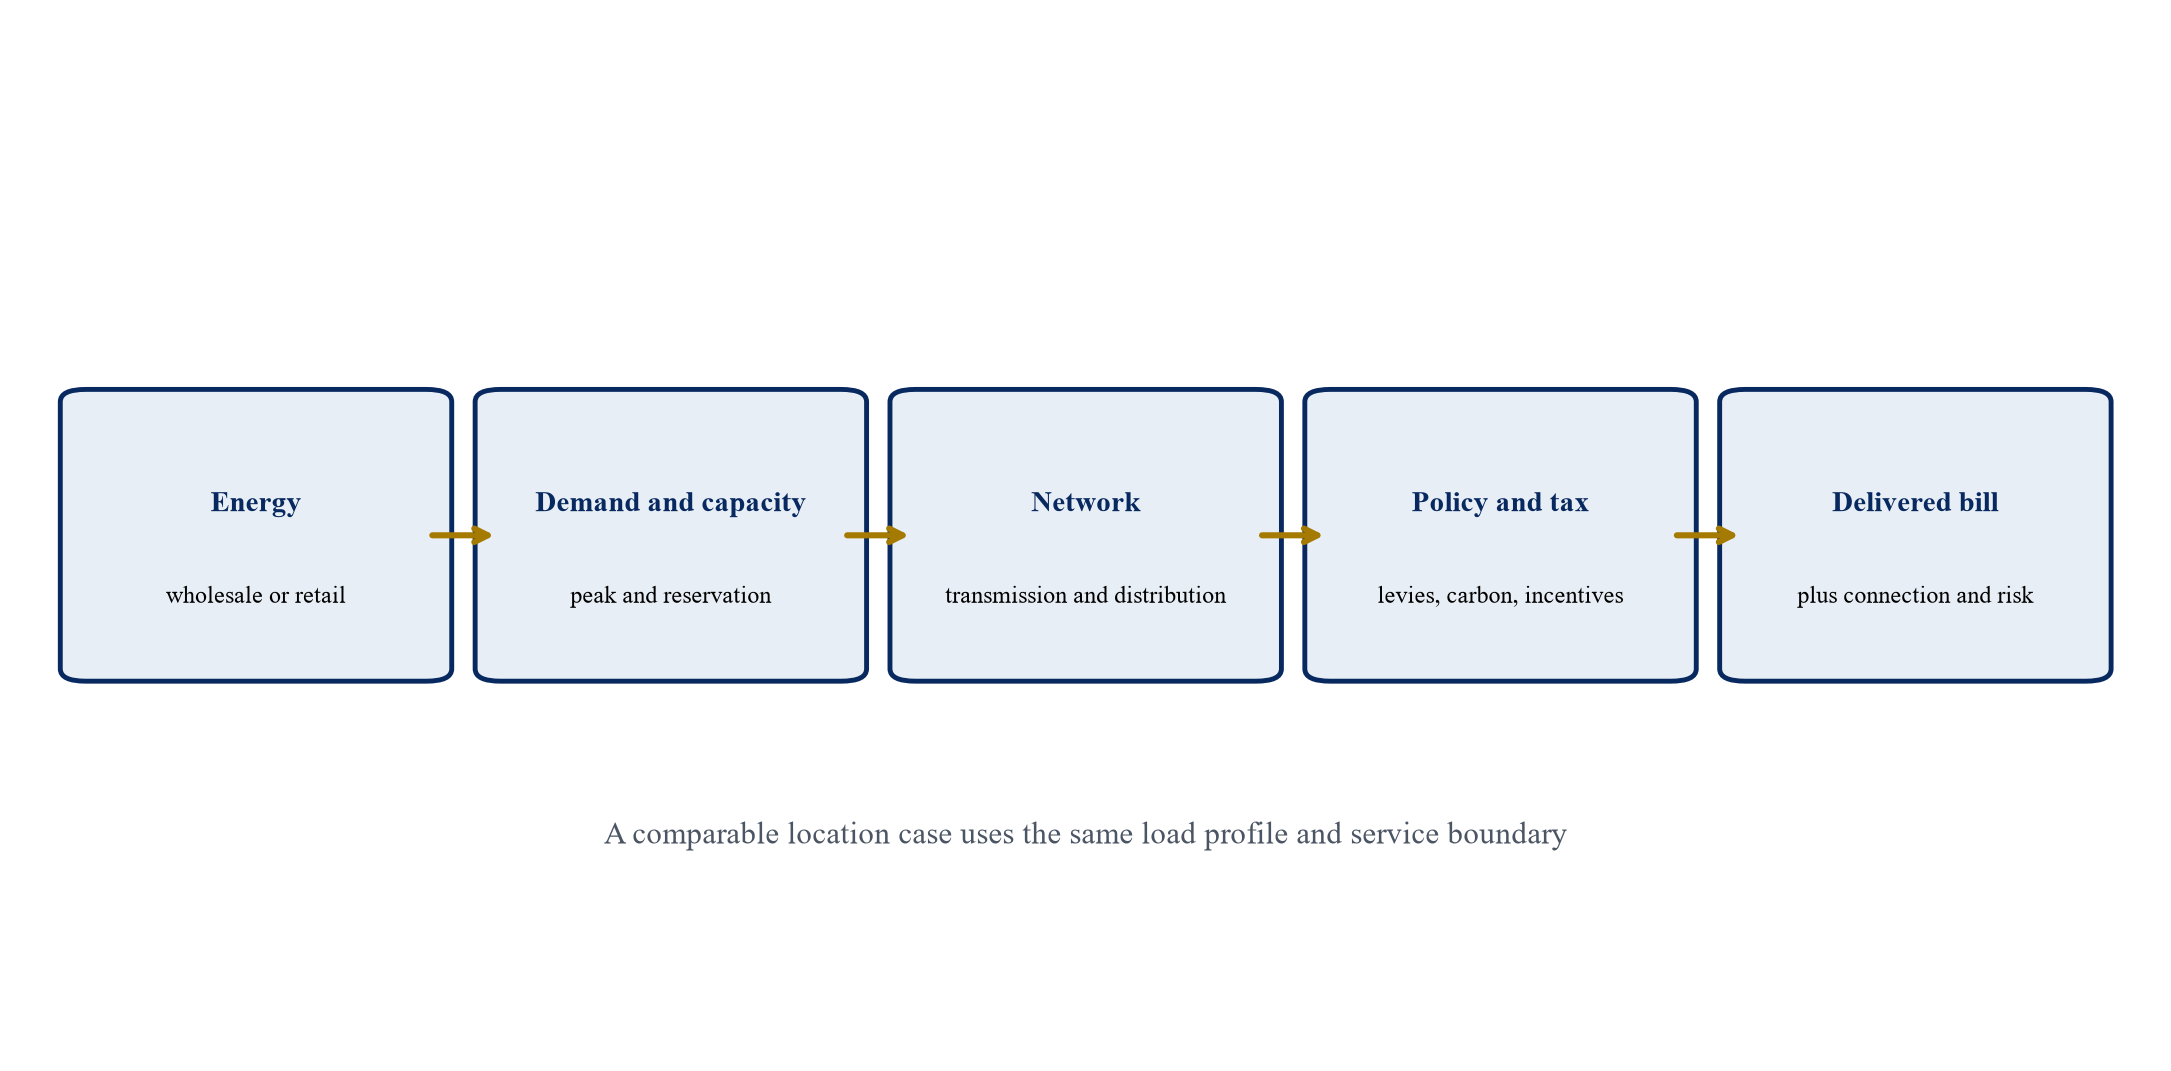
Proposed comparison architecture; actual tariff schedules and contracts control.
Table 1. Tariff comparison ledger
| Component | Billing determinant | Principal risk | Evidence |
|---|---|---|---|
| Energy | metered MWh by interval | fuel, market and basis | tariff or supply contract |
| Demand | maximum or ratcheted MW | short peaks and ramp | rate schedule and interval load |
| Capacity | system peak or assigned obligation | event uncertainty | market and utility rules |
| Network | energy, demand or locational basis | reform and upgrades | regulated tariff and studies |
| Minimum bill | contracted capacity or energy | delayed utilisation | large-load agreement |
| Taxes and incentives | statutory base | expiry or clawback | legislation and approval |
Proposed framework unless stated otherwise.
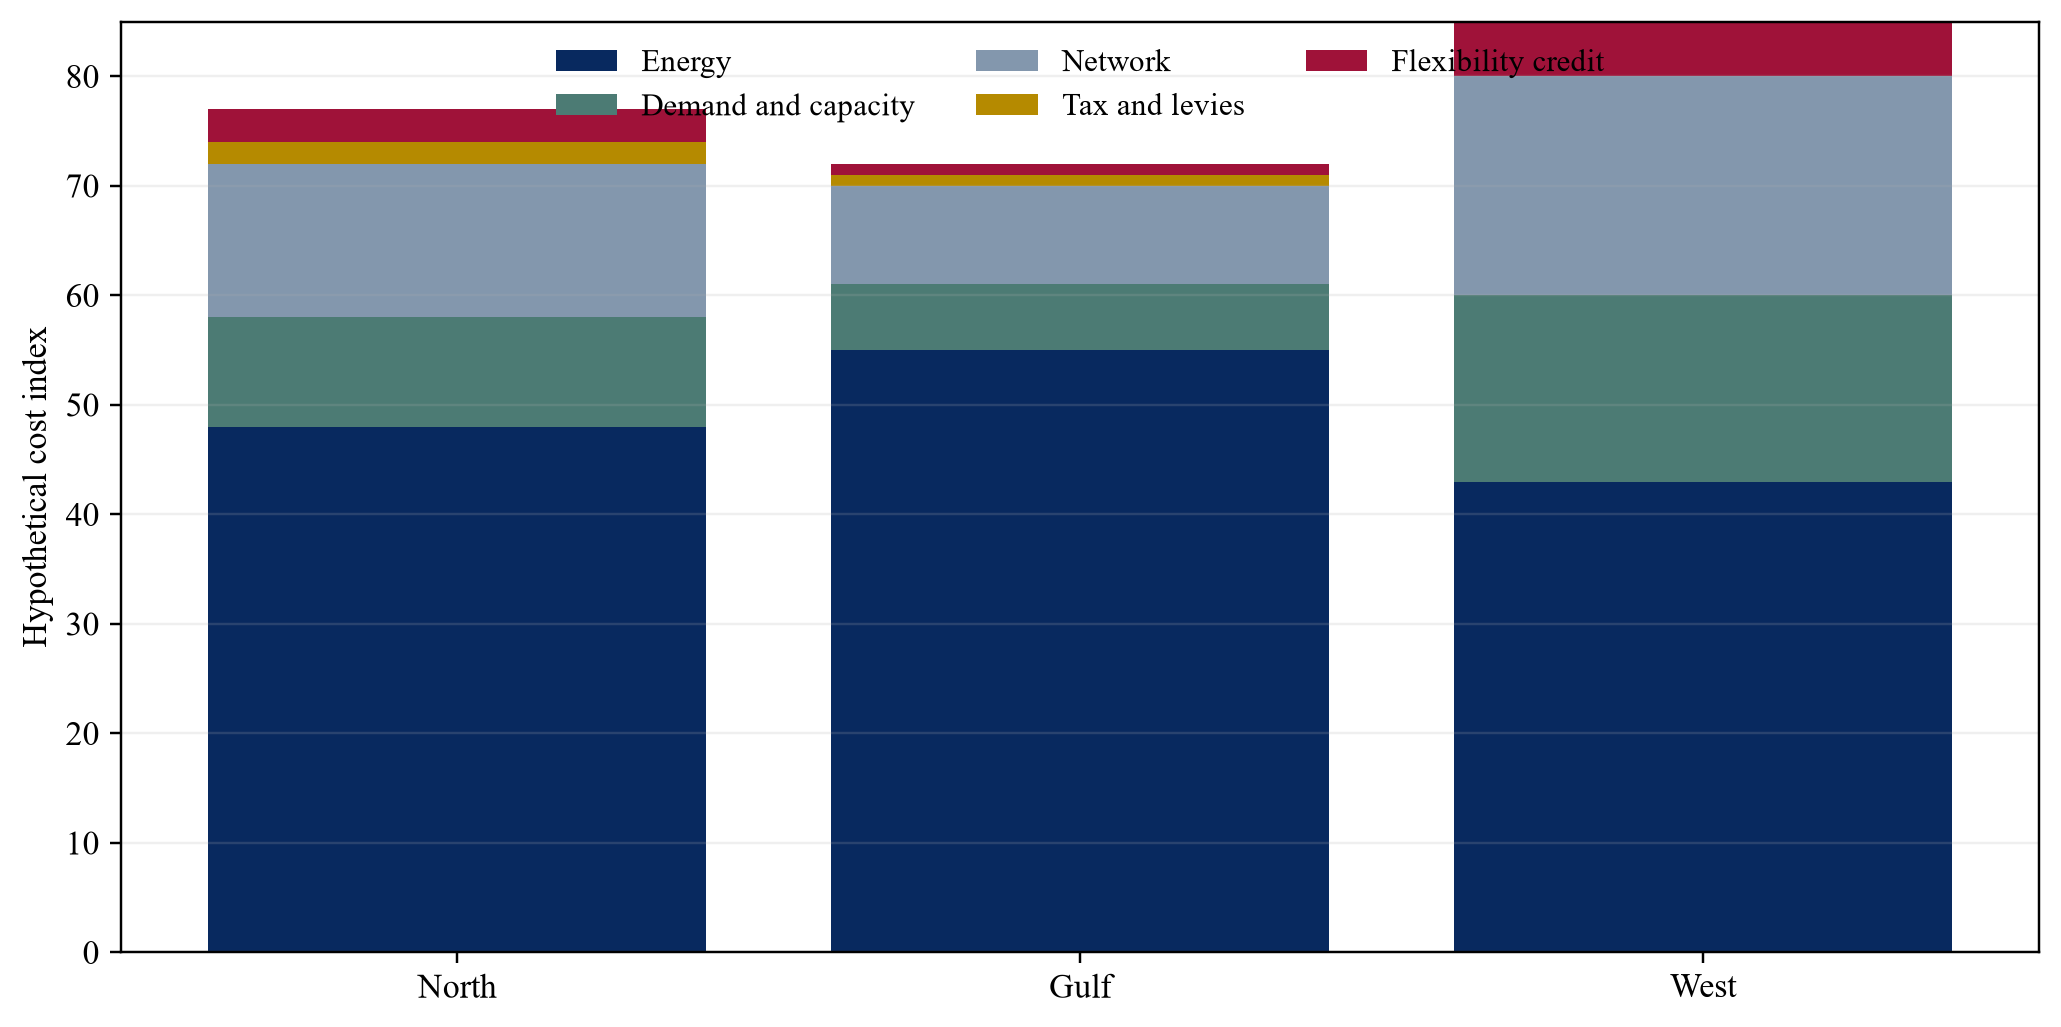
Wholly hypothetical; figures describe no identified tariff or project.
Table 2. Location risk and response matrix
| Exposure | Location question | Model response | Commercial response |
|---|---|---|---|
| Delivery date | when is usable capacity available? | delay and probability | staged land and customer commitments |
| Tariff reset | who changes which component? | reform scenarios | pass-through and re-approval |
| Minimum bill | what remains payable at low utilisation? | ramp downside | phased reservation |
| Curtailment | which load can be interrupted? | lost service and mitigation | defined limits and compensation |
| Connection works | who funds and delivers upgrades? | capital and schedule | milestones and remedies |
| Exit | what survives demand failure? | stranded-cost case | transfer, release or capped fee |
Proposed framework unless stated otherwise.
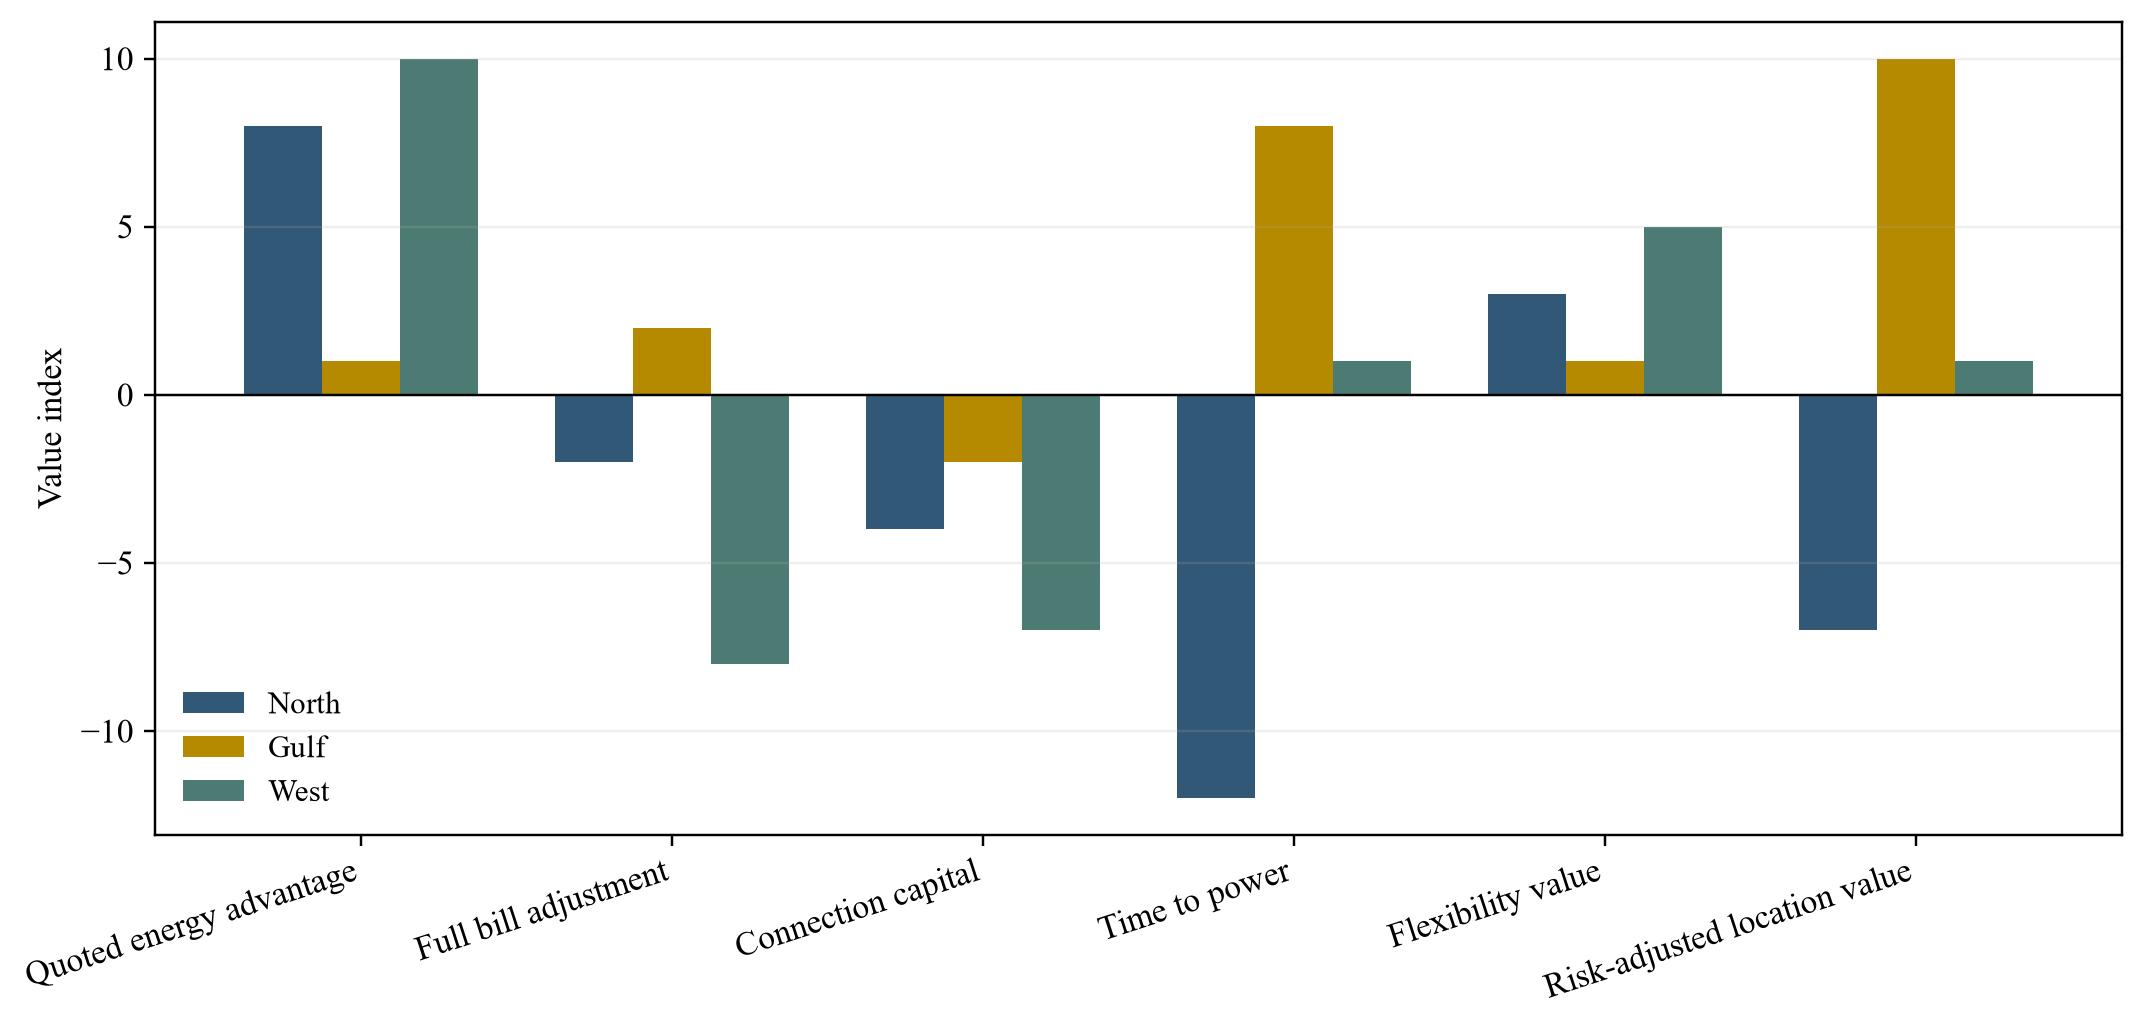
Wholly hypothetical; index values are illustrative and are not market evidence.
Table 3. Hypothetical investment gates
| Gate | Evidence required | Maximum new capital at risk | Decision |
|---|---|---|---|
| Market screen | common load and public tariff stack | AED 2m | shortlist |
| Utility engagement | service offer and network scope | AED 12m | secure options |
| Site control | land, fibre, water and tariff model | AED 45m | enter conditional contract |
| Final investment | executed power and customer agreements | AED 1,800m | build first tranche |
| Expansion | invoice history, utilisation and tariff update | AED 1,200m | build second tranche |
| Portfolio review | realised margin and resilience | lifecycle reserve | expand, hedge or relocate |
All amounts and outcomes are illustrative and describe no identified project.
Appendix A Questions for the investment committee
1. What electrical service and capacity profile does the campus require?
2. Which load profile is used consistently across candidate locations?
3. What components form the complete delivered electricity bill?
4. Which charges depend on energy, demand, peak, capacity or contracted reservation?
5. What connection capital and security sit outside the recurring tariff?
6. How are fuel, inflation, currency and regulatory changes passed through?
7. Which costs can be passed to customers and with what lag or cap?
8. What is the risk-adjusted energisation date for each location?
9. What flexibility revenue or charge reduction is evidenced and non-duplicative?
10. What minimum bills and exit liabilities remain in the downside case?
11. Which tariff reforms could materially change the ranking?
12. Which events require re-approval or activation of an alternate location?
References
- International Energy Agency, Energy and AI, 2025. https://www.iea.org/reports/energy-and-ai
- United States Energy Information Administration, Prices and factors affecting prices, updated 2026. https://www.eia.gov/energyexplained/electricity/prices-and-factors-affecting-prices.php
- Eurostat, Non-household electricity prices in the second half of 2025, 8 May 2026. https://ec.europa.eu/eurostat/web/products-eurostat-news/w/ddn-20260508-2
- Eurostat, Electricity price statistics, September 2026. https://ec.europa.eu/eurostat/statistics-explained/index.php?title=Electricity_price_statistics
- United States Energy Information Administration, Electric Power Monthly Table 5.3, 2026. https://www.eia.gov/electricity/monthly/epm_table_grapher.php?t=epmt_5_03
- Federal Energy Regulatory Commission, FERC Launches Aggressive Targeted Action to Speed Large Load Integration, 18 June 2026. https://www.ferc.gov/news-events/news/ferc-launches-aggressive-targeted-action-speed-large-load-integration
- Federal Energy Regulatory Commission, Interconnection of Large Loads to the Interstate Transmission System, Docket No. RM26-4-000. https://www.ferc.gov/rm26-4
- Energy Market Authority of Singapore, How is the electricity tariff determined?, accessed 2 October 2026. https://www.ema.gov.sg/resources/faqs/electricity/electricity-prices/how-is-the-electricity-tariff-determined
- Energy Market Authority of Singapore, Buying at Regulated Tariff, accessed 2 October 2026. https://www.ema.gov.sg/consumer-information/electricity/buying-electricity/buying-at-regulated-tariff
- Electric Reliability Council of Texas, Planning Guide Section 9: Large Load Interconnection or Modification, 1 June 2026. https://www.ercot.com/files/docs/2026/05/29/June-1-2026-Plannng-Guide.pdf
- National Energy System Operator, Connections Reform, accessed 2 October 2026. https://www.neso.energy/industry-information/connections-reform
- IFRS Foundation, IFRS 13 Fair Value Measurement, accessed 2 October 2026. https://www.ifrs.org/issued-standards/list-of-standards/ifrs-13-fair-value-measurement/
- International Valuation Standards Council, International Valuation Standards, effective 31 January 2025. https://www.ivsc.org/standards/
About the Author
Authored by Chennakeshav Adya Independent Researcher
Chennakeshav (CK) is a corporate finance and investment banking executive with 25+ years of global experience in deal origination, structuring and execution across M&A, growth capital and corporate strategy. He has led value-creation mandates for founders, corporates and funds — bridging the boardroom view to hands-on execution and close.
His career spans Morgan Stanley, HSBC, Lloyds Banking Group, EWEC, ADQ portfolio companies and Emirates Growth Fund, across TMT, real estate, fintech, deeptech, cleantech, infrastructure and energy. He has partnered with C-suite leaders, private equity and venture funds, sovereign wealth funds and family offices to finance complex fund raises and scale-up ventures, and has led M&A due diligence, post-merger integration and business-transformation initiatives to create value.
At Matchpoint Partners he is Managing Partner, leading the firm's corporate finance, M&A and capital-raising practice. He holds an MBA from London Business School, an engineering degree from VTU and a Master of Laws (LLM, in progress) from UCL London.
An active start-up mentor, CK mentors at Techstars, DIFC FinTech Hive, Startup Grind, Founder Institute and IN5, serves as Entrepreneur Mentor in Residence (EMiR) at London Business School, and judges the Entrepreneurship World Cup.
Matchpoint profile: https://www.matchpoint-partners.com/team/ck-adya.html LinkedIn: https://www.linkedin.com/in/ckadya/
