

Introduction
Fleet electrification changes the object being financed. A diesel fleet can often be analysed as vehicles, fuel and maintenance. An electric commercial fleet is a system comprising vehicles, traction batteries, chargers, grid connections, transformers, software, depots, operating schedules, energy contracts, maintenance capability and route demand. The system earns revenue only when each critical element is available at the required time.
The market is expanding. The International Energy Agency reports that electric truck sales more than doubled in 2025 and represented nine per cent of global truck sales; it also notes that electric trucks can remain two to three times more expensive to purchase than diesel trucks in some markets.[1] Depot charging dominates heavy-duty charging because vehicles often dwell overnight, while public and opportunity charging become important as routes lengthen.[2]
Higher purchase price and infrastructure spending create a financing need. Lower energy and maintenance costs can support repayment, but only when routes, charging and electricity tariffs work as expected. Residual value adds another uncertainty. Battery condition, technology change, warranty, software, parts support and second-life demand can affect the amount recoverable after a lease or loan term.
This paper addresses the lender and sponsor decision: how should debt be structured when fleet utilisation, charging-site performance and residual value interact?
1. Define the financed system
The financing perimeter should identify vehicles, batteries, chargers, switchgear, transformers, civil works, grid connection, energy storage, solar generation, software, spare parts, land rights and service contracts. It should also identify assets funded by the utility, landlord, customer, operator and financier.
Legal ownership can differ from operational control. A fleet operator may lease vehicles, rent a depot, own chargers and depend on a utility-owned connection. A charging-as-a-service provider may own equipment while the fleet bears minimum payments. The lender should map title, access, maintenance, insurance, transfer and step-in rights for each element.
The credit case should treat the financed system as an operating chain. A vehicle without charging cannot earn. A charger without vehicles may have no alternative revenue. A grid connection can retain site value when equipment changes. The model should recognise these differences.
2. Establish the fleet mission
Route and duty-cycle evidence should precede vehicle selection and financing. Record daily distance, payload, elevation, weather, dwell, shift pattern, return-to-base probability, seasonal peaks and service-level commitments. Use telematics and dispatch records where available.
Segment the fleet by operational suitability. Stable return-to-base routes with predictable dwell are different from long-haul or emergency operations. The IEA observes that current electric-truck growth is concentrated in applications with shorter distances and depot charging.[2]
The credit model should use vehicles and routes that meet the mission without relying on exceptional driver behaviour. Reserve capacity should reflect temperature, degradation, detours, congestion and charging losses. A technically possible route may still be commercially weak if it reduces payload or requires unproductive charging time.
3. Define utilisation precisely
Utilisation can mean days deployed, kilometres driven, productive hours, loaded trips, revenue hours or charger occupancy. Choose measures that connect assets to cash flow. A vehicle can travel many kilometres at a poor margin. A charger can show high occupied time while delivering little energy because vehicles remain connected after charging.
Define vehicle availability, dispatched utilisation, productive utilisation and revenue utilisation separately. Define charger technical availability, energy throughput, occupied time, simultaneous demand and successful session rate. Reconcile the metrics to invoices and energy bills.
Debt sizing should rely on the utilisation measure that generates cash. Minimum contracted kilometres or availability payments can support debt more directly than management forecasts. Uncontracted upside should remain outside the base case.
4. Map the decision clock
Vehicle delivery, depot construction and grid connection should complete in sequence. Misalignment can leave financed vehicles idle or completed chargers without vehicles. The US Department of Energy advises fleets to work with utilities early and notes that transformer upgrades can create long delays.[3]
Build an integrated schedule covering route validation, permits, utility study, connection agreement, civil works, equipment delivery, commissioning, vehicle delivery, driver training and commercial service. Assign dependencies and contractual responsibility.
Financing availability periods should follow this schedule. The lender can fund assets against completion evidence, while retaining commitments for later tranches. Long-stop dates, cost-overrun support and cancellation rights should address delays.
5. Separate vehicle and site risks
Vehicles are mobile, standardised to varying degrees and potentially remarketable. Site assets are fixed, dependent on land rights, grid capacity and local permits. Their useful lives and recovery processes differ.
Create separate sources, uses, draw conditions, security and amortisation for vehicles and infrastructure. Vehicle debt can track delivery and registration. Site debt can track engineering, utility and commissioning milestones. A common facility can include distinct sub-limits.
Cross-collateralisation may strengthen recovery while obscuring performance. Report asset and cash-flow coverage by pool. The lender should understand which pool supports a shortfall and under what conditions.
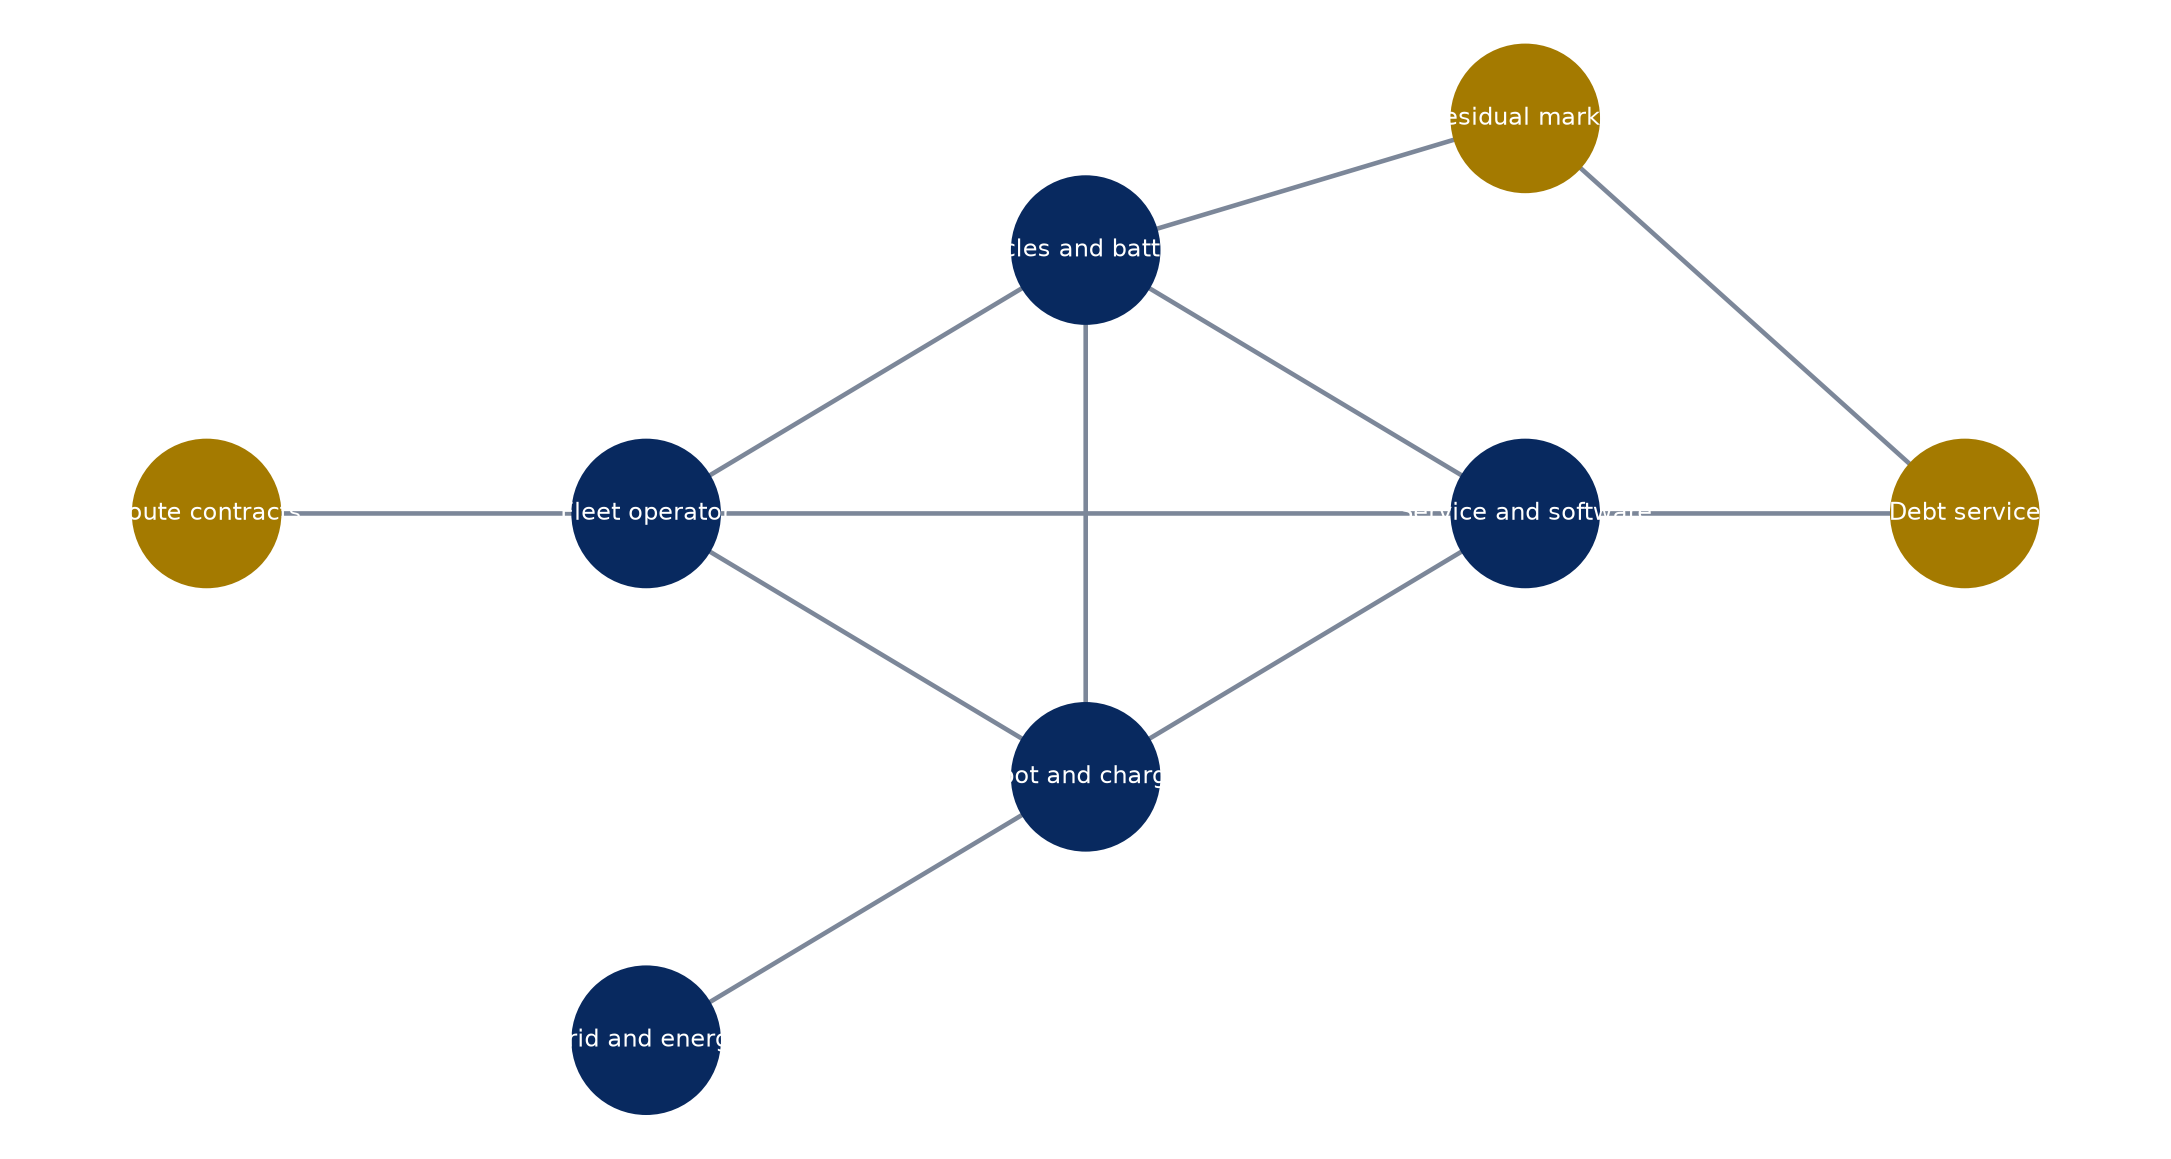
Proposed system map; legal ownership and risk allocation vary by transaction.
6. Build sources and uses
Uses should include vehicles, upfits, batteries, chargers, electrical equipment, civil works, utility contribution, design, permits, software, spares, training, taxes, fees, interest during construction, contingency, initial working capital and reserves. Identify refundable deposits and grants separately.
Sources can include sponsor equity, senior debt, vehicle lease, equipment finance, infrastructure debt, vendor credit, utility contribution, customer advance, grant and tax benefit. Match source tenor and security to the asset funded.
Contingency should reflect design maturity and grid uncertainty. Avoid using operating working capital to absorb construction overruns. The financing plan should identify the party responsible for costs above budget and the evidence required before lender funds are released.
Table 1. Hypothetical fleet and site sources and uses
| Uses | Amount | Sources | Amount |
|---|---|---|---|
| Vehicles and upfits | 72 | Senior vehicle facility | 48 |
| Depot chargers and software | 18 | Infrastructure facility | 20 |
| Grid, transformer and civil works | 16 | Sponsor equity | 34 |
| Development, permits and training | 5 | Utility or customer contribution | 6 |
| Contingency | 6 | Grant or incentive received | 5 |
| Reserves and fees | 7 | Vendor deferred payment | 5 |
| Total uses | 124 | Total sources | 118 |
| Funding gap or additional equity | 6 | Additional sponsor equity | 6 |
Wholly hypothetical; amounts are illustrative units and describe no identified financing.
7. Match funding to completion evidence
Vehicle funding conditions can include purchase contract, specification, title, delivery, registration, insurance, warranty and acceptance. Site funding conditions can include land rights, permits, fixed-price contracts, utility approval, equipment delivery, energisation and commissioning.
Use milestone certificates from qualified engineers for material infrastructure draws. Require invoices and evidence of sponsor contribution. Retain a completion holdback until the site passes load and interoperability tests.
The facility should address partial completion. A subset of vehicles and chargers may enter service while later phases continue. Debt service and covenants should follow the commissioned pool rather than the entire planned programme.
8. Model route revenue
Revenue can arise from per-kilometre contracts, per-trip pricing, availability payments, passenger fares, delivery fees or internal cost allocation. Separate contracted minimums, volume bands, indexation, penalties, termination and counterparty concentration.
For captive fleets, identify the avoided external transport cost or revenue supported by fleet activity. The credit should not rely on an accounting transfer price without evidence that the underlying business generates cash.
Stress route loss, lower volume, shorter shifts and customer default. Determine whether vehicles can be redeployed and how long redeployment takes. Route portability is a form of collateral value.
9. Model energy demand from operations
Calculate energy per kilometre or hour by vehicle, route, payload and season. Add charging losses and auxiliary loads. Reconcile modelled demand with pilot data where available.
Aggregate demand through dwell windows and charger constraints. Average daily energy does not reveal peak power. Simultaneous return can create demand charges or exceed connection capacity.
DOE fleet guidance recommends plotting vehicle electricity and charging-time needs to assess upgrades and charger selection.[4] The financing model should link route schedules to interval energy and demand.
10. Size charging for the mission
Select charger power, count and redundancy from energy requirement, dwell and contingency. Lower-power chargers can reduce capital and grid demand when dwell is long. Fast charging can support multiple vehicles and short dwell, while increasing equipment and connection cost.
The Alternative Fuels Data Center notes that Level 2 equipment often serves one vehicle overnight, while direct-current fast charging can serve multiple vehicles and may be needed for high daily mileage.[4] The appropriate design depends on the fleet.
Include cable reach, vehicle layout, queuing, accessibility, weather, safety and future phases. A nominal charger count is insufficient without operational layout.
11. Assess grid capacity and connection risk
Obtain utility data on available capacity, fault level, voltage, connection work, tariff, timeline and required contribution. Confirm who owns new equipment and who bears upgrade risk.
Model temporary solutions only when legally, technically and commercially credible. These can include lower initial power, managed charging, on-site storage or phased vehicle deployment. Temporary generation can create fuel, emissions and permit exposure.
The credit agreement should make connection delays visible through draw stops, long-stop dates and sponsor support. Vehicle deliveries should be adjustable where possible.
12. Use managed charging as a credit control
Managed charging schedules vehicles within grid capacity, tariff windows and route requirements. It can reduce peak demand and delay infrastructure upgrades. DOE guidance identifies operational schedules, dwell and required state of charge as core inputs.[5]
The lender should diligence software, communications, charger compatibility, cybersecurity and manual fallback. Savings depend on reliable control and tariff structure.
Create an operating covenant for successful charging, peak demand and route readiness. A managed-charging plan should be commissioned under representative fleet conditions before reliance in the base case.
13. Model electricity tariffs completely
Include energy, demand, capacity, network, time-of-use, taxes, losses and fixed charges. Tariffs can change when connection size or consumption crosses a threshold. Separate regulated and contracted elements.
Model price hedges, renewable contracts and pass-through. A lower energy price may come with volume commitment or imbalance exposure. A demand charge can dominate cost when site utilisation is low.
Calculate cost per delivered kilowatt-hour and per productive kilometre. The metric should reflect charger loss, battery loss and non-traction site load.
14. Define charger availability and uptime
Measure technical availability, successful sessions, energy delivery and operational availability during required dwell. A charger can be online yet unavailable because of payment, communication, cable or vehicle-interface failure.
Review maintenance response, spares, remote diagnostics, warranty and service-level credits. Identify single points of failure in transformer, switchgear, communications and software.
Financeable assumptions should use demonstrated uptime or conservative benchmarks. Create a maintenance reserve or service contract appropriate to the risk.
15. Integrate maintenance economics
Model preventive and corrective maintenance for vehicles, batteries, chargers and electrical assets. Include tyres, thermal systems, power electronics, cables, contactors, cooling and software support.
Lower powertrain maintenance may benefit electric fleets, while unfamiliar components and limited service networks can increase downtime. Review technician capability, parts lead time and roadside recovery.
Maintenance contracts should define scope, exclusions, response and replacement. Align contract term with debt tenor or include replacement rights.
16. Define battery health
Battery value depends on usable energy, power capability, thermal history, charging pattern, calendar age, cycles, warranty and safety. State of charge is different from state of health.
The EU Batteries Regulation requires access to battery-management-system data supporting state-of-health and expected-lifetime assessment and identifies state of certified energy for electric-vehicle batteries.[6] This improves the basis for residual-value diligence where the rules apply.
The lender should obtain data rights, periodic reports and inspection rights. Data should be portable after enforcement or sale. Proprietary access controlled by one service provider can weaken collateral recovery.
17. Build the residual-value framework
Residual value should begin with expected asset condition at the relevant date. Estimate vehicle body, drivetrain, battery, upfit and charger components separately where markets allow. Deduct transport, inspection, refurbishment, sales and disposal costs.
Use current market evidence for comparable age and condition, adjusted for specification, warranty and geography. Avoid applying a uniform percentage of original cost. New-vehicle price reductions and technology change can affect used values.
IFRS guidance defines residual value as the amount currently obtainable for an asset of the age and condition expected at the end of useful life, after disposal cost.[7] Credit valuation and accounting are distinct, while both benefit from condition evidence and periodic review.
18. Distinguish vehicle and battery residuals
The battery can have a different life and market from the vehicle. A commercial vehicle may remain useful after battery replacement. A battery may be repairable, repurposable or recyclable after traction use.
Determine whether the battery is owned, leased or warranted separately. Review serial numbers, module replacement, software locks, transport classification and second-life rights. Confirm the party entitled to recycling or repurposing proceeds.
The model should show combined vehicle value and component value, avoiding double counting. Component separation costs and legal constraints must be included.
19. Assess charger residual value
Charger value depends on power, standard, condition, software, site design, removal cost and alternative users. Installed civil and electrical works may have limited removal value but can support future charging at the site.
Confirm interoperability and whether licences, networking and warranties transfer. Equipment tied to one vehicle brand or back-end provider may have a narrow buyer pool.
The recovery model should distinguish equipment resale, continued site operation and scrap. Site access and grid connection may be more valuable than the charger hardware.
20. Protect site tenure
Debt tenor should fit the lease, concession or ownership of the depot. Review renewal, termination, rent, assignment, lender step-in, reinstatement and access after default.
If the landlord owns improvements, the lender may have limited recovery. Obtain landlord waivers or direct agreements where material. Confirm the right to remove equipment and the time available.
For customer sites, address contract termination and asset relocation. Relocation cost and re-commissioning should enter downside recovery.
21. Structure operating contracts
The route contract should align with debt tenor and asset life. Review minimum volume, availability payment, indexation, termination compensation, change in law, force majeure and assignment. Where the customer directs vehicle specification, consider residual-value support.
Charging and fleet-service contracts should define performance, data, maintenance, price and step-in. Interface risk between suppliers needs one accountable coordinator.
The lender may require direct agreements with material customers and providers. Notice and cure rights can preserve operations during stress.
22. Allocate technology risk
Technology risk includes range, degradation, charging compatibility, software obsolescence, safety and product support. Allocate risk to the party able to control or price it.
Use warranties, performance guarantees, buybacks, residual-value guarantees, service agreements and insurance selectively. Test guarantor credit and claim conditions. A guarantee has limited value when exclusions cover the likely failure.
Retain sponsor exposure for risks that cannot be transferred. Size debt after the retained risk rather than assuming complete contractual protection.
23. Allocate construction and completion risk
Use defined scope, price, schedule, liquidated damages, performance testing and security for site works. Confirm interface responsibility between utility, civil contractor, electrical contractor, charger supplier and software provider.
Completion should require energisation, charger interoperability, management-system integration, safety approval and representative load testing. Practical completion alone may not support fleet operations.
Cost-overrun support should remain available until the operating system is accepted. Contingency release should require evidence.
24. Allocate utilisation risk
Utilisation can be borne by the fleet operator, customer, lessor or service provider. Minimum payments can transfer volume risk while creating counterparty risk. Usage-based payment preserves flexibility while weakening fixed debt coverage.
Hybrid structures can combine availability payment, minimum kilometres and variable upside. Define measurement, exclusions and dispute process.
The lender should test utilisation below contract minimum and after contract expiry. Redeployment value and alternate customers matter.
25. Allocate electricity-price risk
Electricity price can pass through to customers, remain with the operator, or be hedged. Review formula, lag, caps, floors and taxes. Pass-through should be modelled net of volume and competitive effects.
Hedges should match load shape and tenor. A flat block can create imbalance when charging demand changes. On-site generation and storage require separate capital and operating assumptions.
The credit model should show break-even delivered electricity price and covenant sensitivity.
26. Choose debt instruments
Options include term loan, borrowing base, finance lease, operating lease, equipment facility, infrastructure loan, project finance, receivables facility and vendor finance. The structure should follow cash flow and collateral.
Vehicle leases can place residual exposure with the lessor, reflected in rent and return conditions. Infrastructure debt can amortise over a longer useful life when site tenure and cash flow support it. A borrowing base can adjust availability as vehicles enter and leave the pool.
Avoid financing long-lived site assets with debt that matures before operations stabilise. Avoid extending vehicle debt beyond credible use and warranty.
27. Size debt to resilient cash flow
Build cash flow from contracted revenue or verified operating savings. Deduct energy, maintenance, labour, insurance, software, rent, taxes, working capital, replacements and reserves. Include downtime and route penalties.
Calculate debt-service coverage under base, downside and severe cases. Use quarterly or monthly periods where seasonality matters. Lock-up and distribution tests should precede default thresholds.
Residual value can support balloon debt only after conservative haircuts, sale cost and timing. The lender should avoid using an optimistic terminal value to compensate for weak operating coverage.
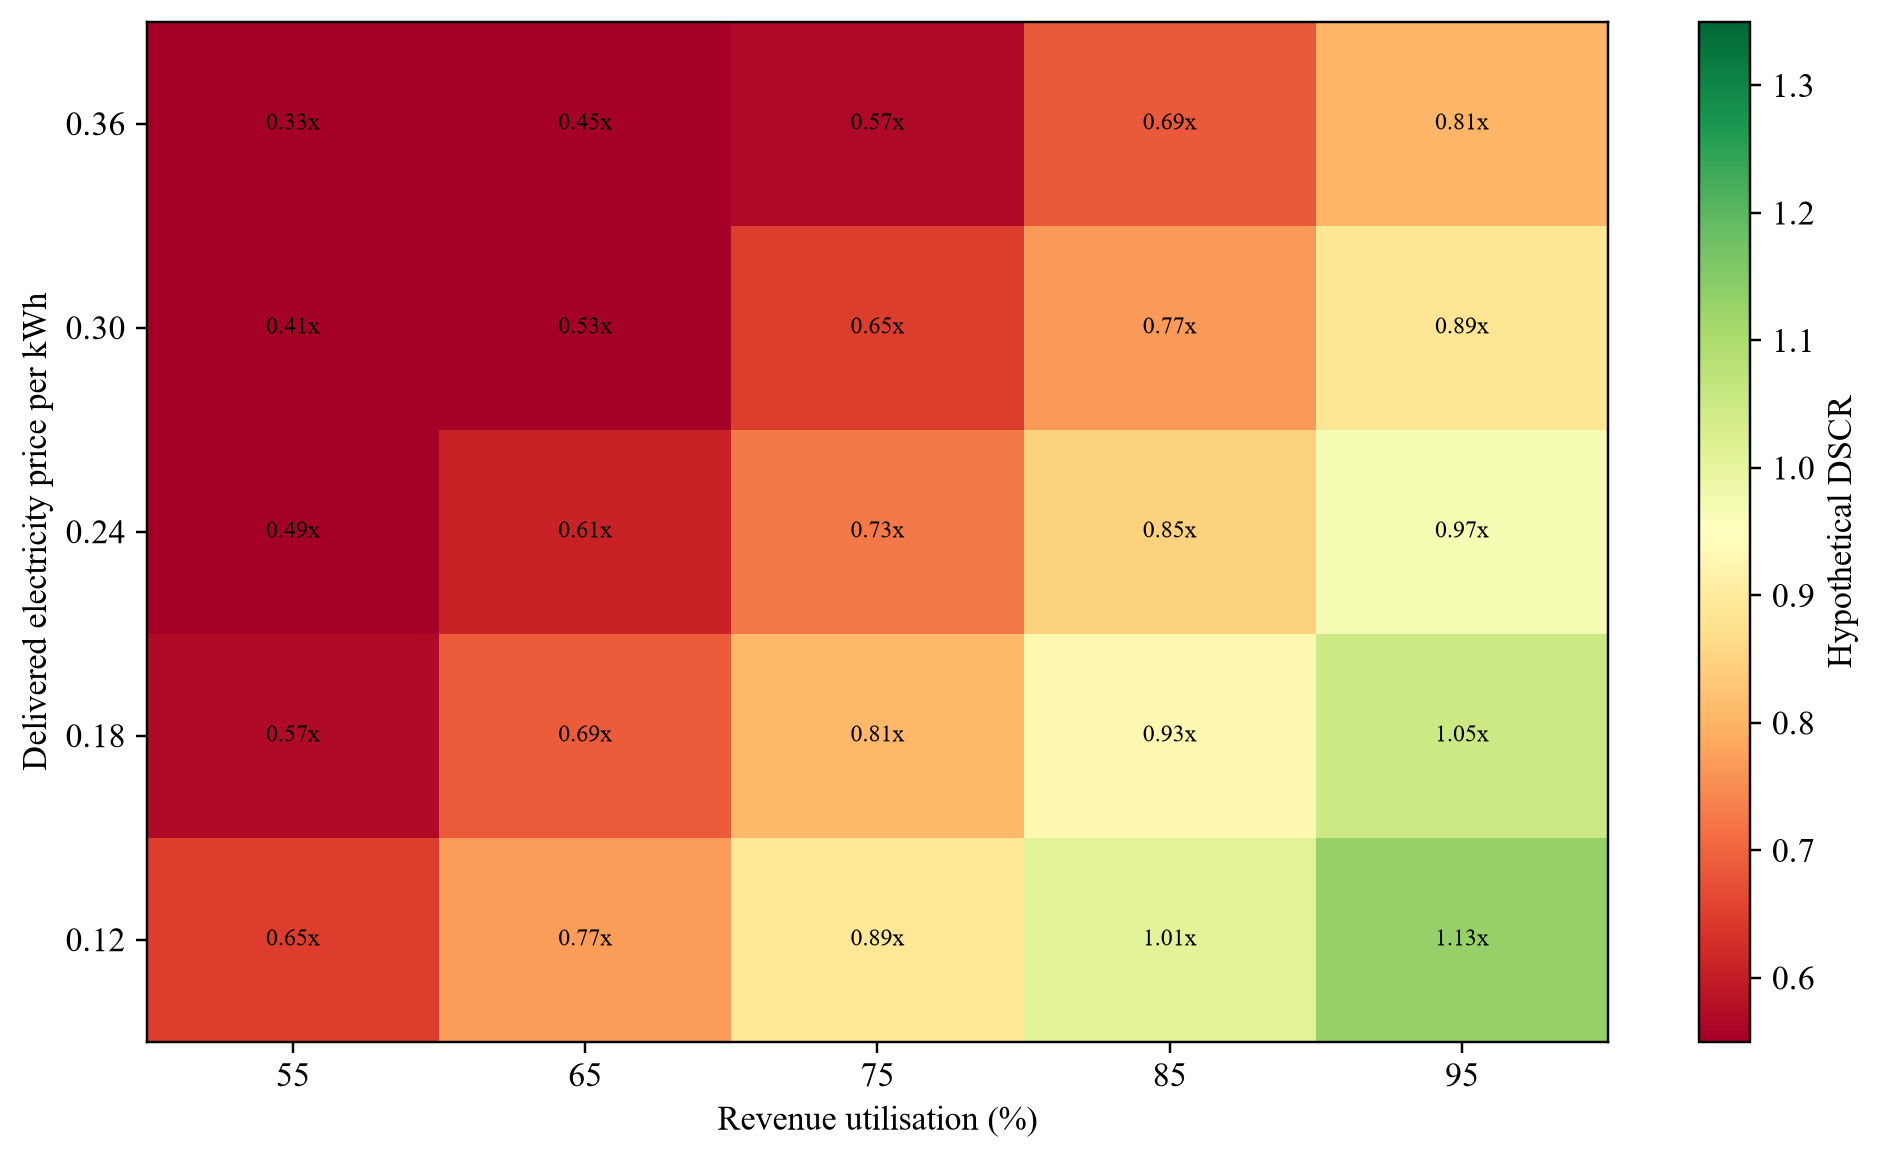
Wholly hypothetical; DSCR values describe no identified fleet or financing.
28. Build the borrowing base
An asset-backed facility can advance against eligible vehicles, batteries, chargers, receivables and cash reserves. Define eligibility by title, age, specification, warranty, location, insurance, condition and contract status.
Advance rates should differ by asset and maturity. Apply concentration limits by customer, vehicle model, battery chemistry, depot and provider. Exclude assets with liens, missing data or material defects.
Recalculate the borrowing base periodically. Cure shortfalls through repayment, additional collateral or cash reserve. Avoid forced sales where a temporary data or administrative issue can be cured safely.
29. Design amortisation and balloon
Amortisation should follow expected cash flow and value decline. Vehicle principal can amortise faster in early years where mileage and technology risk are high. Infrastructure can amortise over site tenure and useful life.
Balloon size should reflect conservative net sale proceeds across downside cases. Use independent market evidence and battery-health assumptions. Apply time and cost to remarket.
Create a cash sweep when utilisation or energy savings exceed base case. This reduces balloon exposure while preserving sponsor upside.
30. Establish reserves
Reserves can cover debt service, maintenance, battery replacement, insurance deductibles, charger spares, site reinstatement and taxes. Size each reserve to a defined risk rather than a generic percentage.
Fund completion and initial operating reserves at closing. Build replacement reserves through cash flow as assets age. Permit release only when evidence shows the risk has reduced.
Reserve accounts should be controlled under the security package and reflected in liquidity calculations.
31. Create covenants tied to the system
Financial covenants can include debt-service coverage, leverage, liquidity and borrowing-base coverage. Operating covenants can include vehicle availability, revenue utilisation, charger uptime, energy cost, battery health and contract concentration.
Set cure periods and escalation appropriate to the metric. One failed charging session should not trigger default, while a persistent decline should restrict distributions and require remediation.
Information covenants should provide telematics, charging, energy, maintenance, battery and contract data in a usable format.
32. Design the security package
Security can cover vehicles, batteries, chargers, receivables, bank accounts, insurance, warranties, contracts and shares in the project entity. Perfection depends on jurisdiction and asset type.
Obtain assignments or acknowledgements where contracts restrict transfer. Secure access to sites and data. Confirm that enforcement does not disable software or warranties.
The lender should plan recovery before closing. Identify storage, operator, remarketing and service arrangements that can preserve value after default.
33. Use special-purpose vehicles carefully
An SPV can isolate assets, contracts, debt and cash flow. It can also create dependence on sponsors for operations, licences and shared services. Review substance and insolvency risks.
The SPV should hold the assets and rights needed to operate, including site access, energy, software and customer contracts. Shared services should be documented with continuity and step-in provisions.
Cash waterfalls should fund operating cost, taxes, reserves and debt before distributions. Related-party payments need controls.
34. Address accounting and lease structure
IFRS 16 requires lessees to recognise right-of-use assets and lease liabilities for most leases longer than twelve months, subject to specified exemptions.[8] Contract economics and accounting presentation should both be understood.
For lessors, residual-value exposure can remain material. IFRS 16 requires regular review of estimated unguaranteed residual values in finance leases and disclosures concerning residual-asset risk.[9]
Accounting classification does not substitute for cash-flow and recovery analysis. Obtain advice on the proposed structure and model taxes and balance-sheet effects explicitly.
35. Revalue during the term
Update vehicle and battery values using mileage, condition, state of health, warranty, incident history, market price and disposal evidence. Update charger and site values using utilisation, interoperability, land rights and alternative use.
Set review frequency by volatility and loan-to-value sensitivity. Independent appraisal can supplement observable sales data. Use consistent definitions over time.
A downward revision can trigger cash sweep, additional collateral, accelerated amortisation or distribution restriction. The cure should fit the likely loss.
36. Plan remarketing and second life
Identify potential buyers, markets, certification, refurbishment, transport and sale channels before financing. Manufacturer or lessor buybacks can support value subject to credit and conditions.
Battery second life can create option value, while it requires testing, legal rights, safety, integration and customer demand. Keep speculative second-life proceeds outside the base case until supported.
Preserve service records and battery data. Transparent condition can reduce buyer discount and sale time.
37. Build the downside playbook
Downside actions can include redeploying vehicles, changing routes, resizing chargers, renegotiating tariffs, subleasing depot capacity, selling assets, enforcing guarantees or restructuring debt. Define triggers and authority.
Estimate time, cost and operational disruption. Asset sale value may fall when many similar fleets sell simultaneously. Liquidity assumptions should reflect market depth.
The security trustee and servicer need practical access to vehicles, sites, data and contracts. A paper security interest without operational control can recover poorly.
38. Stage deployment
Begin with a representative fleet and site phase large enough to test route, tariff, charger, software, maintenance and customer assumptions. Define acceptance evidence and expansion criteria.
Later phases can use measured energy, utilisation, uptime and battery data. Standardised equipment and contracts can reduce transaction cost, while each site still requires grid and land diligence.
Stage gates protect capital and create financeable operating history. They also preserve the ability to change vehicle, charger or commercial structure.
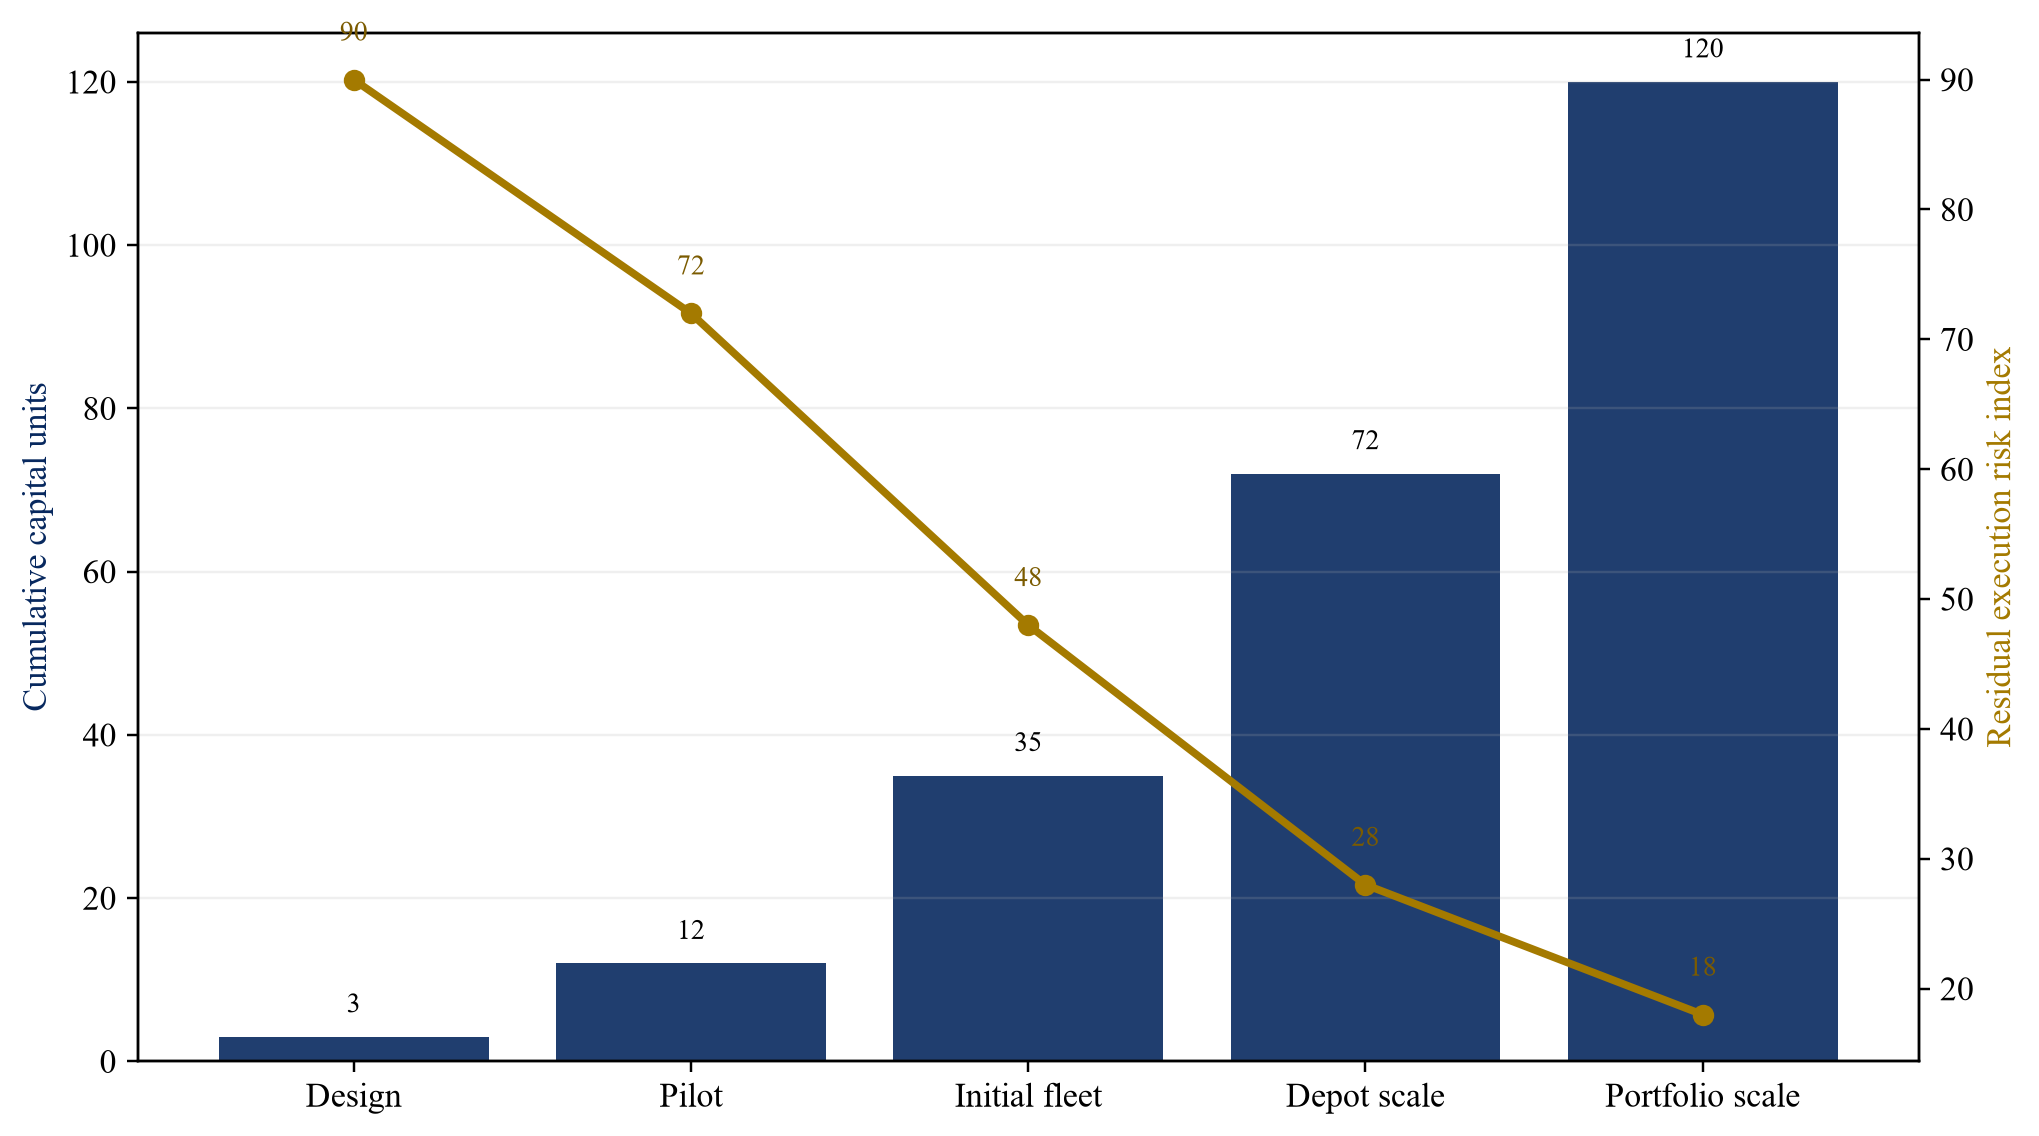
Proposed sequencing; cumulative exposure is illustrative.
39. Risk-allocation matrix
Assign each risk to the party that controls the outcome, can absorb it or can price it transparently. Shared or unallocated risk becomes lender exposure. Contract strength depends on enforceability and counterparty credit.
The matrix should connect risk, evidence, allocation, protection, covenant and remedy. Update it during diligence and before each expansion phase.
Table 2. Fleet and charging risk-allocation matrix
| Risk | Primary bearer | Evidence | Protection or control | Lender response |
|---|---|---|---|---|
| Route volume | operator or customer | contract and operating history | minimum volume or availability payment | utilisation covenant and cash sweep |
| Vehicle performance | OEM and operator | pilot and warranty | performance warranty and service | eligibility and reserve |
| Grid connection | sponsor and utility | connection agreement | long-stop date and cost support | draw condition |
| Charger uptime | provider and operator | SLA and operating data | spares, response and credits | uptime covenant |
| Electricity price | operator or customer | tariff and pass-through | hedge or indexed contract | price sensitivity and lock-up |
| Battery degradation | OEM, operator and lessor | state-of-health data | warranty, monitoring and reserve | advance-rate haircut |
| Residual value | sponsor, lessor and lender | market and condition data | buyback, guarantee and amortisation | LTV test and reappraisal |
| Site access | sponsor or landlord | lease and direct agreement | step-in and removal rights | condition precedent |
Proposed allocation framework; transaction documents and local law determine enforceability.
40. Monitoring dashboard
Report contracted volume, revenue utilisation, vehicle availability, energy intensity, charging success, charger uptime, delivered electricity price, maintenance cost, battery health, receivables, debt service, liquidity and borrowing base. Show actual, budget and covenant threshold.
Use source-system data and reconcile it to financial statements. Define exceptions and data-quality controls. Missing data should weaken eligibility until cured.
The dashboard should support action. Trend deterioration should trigger operational review before a payment default.
41. Investment committee framework
Approve financing only when the fleet mission is evidenced, the site and grid are deliverable, contractual cash flow supports downside debt service, collateral and data rights are enforceable, and residual value is conservative. Require a funded completion plan and operating reserves.
The committee pack should include system perimeter, route evidence, integrated schedule, sources and uses, contract map, tariff model, debt sensitivities, residual analysis, risk matrix, security, covenants and downside playbook.
State unresolved items and conditions. Do not convert missing evidence into a generic risk premium when it can invalidate the operating system.
42. Insure the recoverable risks
Insurance should cover the physical and operational exposures that can be transferred economically. Review motor, property, machinery breakdown, business interruption, cyber, environmental, construction and third-party liability. Confirm whether batteries, chargers, cables, transformers and software-related incidents fall within the policy definitions.
The insured value should reflect replacement and reinstatement cost, including specialised labour and lead time. Business-interruption periods should account for grid equipment and charger replacement. Deductibles and exclusions should fit available liquidity.
Name secured parties and establish loss-payee arrangements where appropriate. Insurance does not replace maintenance, safety or contractual controls. Claim history, insurer credit and local enforcement remain part of diligence.
43. Procure for financeability
Procurement documents should request lifecycle cost, performance data, warranties, service coverage, parts, software continuity, data access, residual support and financing cooperation. Price comparison alone can select an asset that is difficult to operate or recover.
Require vendors to identify dependencies, exclusions and change-of-control effects. Score technical compliance separately from commercial value. Test interoperability through demonstrations and references.
Where a vendor offers a buyback or residual-value guarantee, compare the guaranteed amount with restrictions on mileage, condition, maintenance, geography and return timing. Obtain credit support where the guarantee is material to debt sizing.
44. Scale a multi-site portfolio
Portfolio financing can diversify customer, route and site exposure while introducing correlation through vehicle models, battery chemistry, utilities and software. Report concentration across each dimension. Common equipment can simplify maintenance and create correlated defects.
Use a site admission process with standard technical, legal and credit criteria. Each site should satisfy land, grid, contract, completion and economics tests before entering the collateral pool. Apply limits where evidence is weaker.
Portfolio debt can include revolving commitments and delayed draws for approved sites. Maintain asset-level data so the lender can identify underperformance and recover individual pools without disrupting healthy operations.
The reporting system should connect every financed vehicle to its route, customer contract, depot, charger, electricity meter, maintenance record and battery-health history. This linkage allows the borrower and lender to distinguish a commercial-demand problem from a charging, grid, vehicle or operating problem. It also supports an orderly response: redeploy a vehicle, repair a charger, revise a charging window, enforce a service obligation or stop further draws. Aggregate fleet averages can conceal a weak site or an underused vehicle pool, so portfolio reporting should preserve asset-level and site-level detail.
Scale also changes procurement and refinancing choices. A larger platform may obtain better vehicle pricing, maintenance terms, insurance, energy procurement and software support. These benefits should enter the financing case only when evidenced by executed terms or a documented procurement process. The model should retain a case without the benefit so the credit decision does not depend on an uncommitted scale saving.
For refinancing, the lender should be able to separate completed, operating assets from construction-stage or underperforming pools. Eligibility criteria can require a minimum operating history, verified utilisation, charger availability, customer payment record and current battery data. A seasoned pool may then support longer tenor or lower pricing while newer sites remain in a controlled ramp-up facility. This separation preserves transparency and reduces cross-subsidy between strong and weak assets.
Table 3. Hypothetical debt sizing and covenant case
| Metric | Base case | Downside | Severe case | Proposed control |
|---|---|---|---|---|
| Revenue utilisation | 86% | 72% | 58% | 70% lock-up threshold |
| Charger operational availability | 98% | 94% | 88% | 95% remediation trigger |
| Delivered electricity cost per kWh | 0.18 | 0.25 | 0.34 | pass-through and hedge review |
| Minimum annual DSCR | 1.42x | 1.16x | 0.86x | 1.20x distribution test |
| Opening loan to conservative value | 62% | 71% | 84% | 75% cash-cure threshold |
| Balloon as share of original debt | 18% | 18% | 18% | annual residual reappraisal |
| Debt-service reserve | 6 months | 6 months | 6 months | controlled reserve account |
Wholly hypothetical; values describe no identified company or financing.
45. Conclusion
Electric fleet finance succeeds when vehicles, charging, grid, contracts and asset values are underwritten as one operating system. Utilisation creates cash only when the fleet performs the required mission and can charge at the required time and cost. Residual value creates support only when condition, battery health, market access and recovery rights are evidenced.
The financing structure should separate vehicle and site risks, match debt to asset life and cash flow, fund completion in stages, and size repayment to downside coverage. Borrowing-base controls, reserves, operational covenants, periodic revaluation and an executable downside plan can contain uncertainty.
The objective is a fleet that remains operational, financeable and recoverable through the term. The strongest credit case combines contracted demand, route suitability, reliable charging, manageable electricity cost, transparent battery data and conservative residual assumptions.
Appendix A Credit committee questions
1. Which assets, contracts, sites and rights are inside the financing perimeter?
2. Which routes and duty cycles support each vehicle specification?
3. What measure of utilisation generates cash and how is it verified?
4. Are vehicle delivery, grid connection and charging commissioning aligned?
5. What are the full sources and uses, contingency and cost-overrun support?
6. Which revenue is contracted and what termination or volume risk remains?
7. What electricity tariff, demand charge and pass-through apply?
8. What charger uptime and redundancy support operations?
9. Who owns each battery and who controls state-of-health data?
10. What evidence supports vehicle, battery and charger residual values?
11. Does site tenure cover debt tenor and enforcement?
12. Which risks are transferred by contract and to which creditworthy party?
13. How is debt sized under utilisation and energy-price stress?
14. Which covenants, reserves and revaluation triggers protect the lender?
15. What happens when the fleet, site or customer underperforms?
References
- International Energy Agency, Global EV Outlook 2026: Executive Summary, 20 May 2026. https://www.iea.org/reports/global-ev-outlook-2026/executive-summary
- International Energy Agency, Global EV Outlook 2026: Electric Vehicle Charging, 2026. https://www.iea.org/reports/global-ev-outlook-2026/electric-vehicle-charging-chap-6-and-10
- US Department of Energy, Electric Vehicles and Fleet Electrification Blueprint 4A How-To Guide, 2024. https://www.energy.gov/sites/default/files/2024-10/EECBG_Blueprint_4A%20How-to%20Guide_Final_5-31-24_508.pdf
- US Department of Energy, Alternative Fuels Data Center: Electric Vehicles for Fleets, accessed 2 October 2026. https://afdc.energy.gov/vehicles/electric-fleets
- US Department of Energy, Smart Charge Management Implementation for Federal Fleets, accessed 2 October 2026. https://www.energy.gov/cmei/femp/smart-charge-management-implementation-federal-fleets
- European Union, Regulation (EU) 2023/1542 concerning batteries and waste batteries, consolidated text accessed 2 October 2026. https://eur-lex.europa.eu/eli/reg/2023/1542/2025-07-31/eng
- IFRS Foundation, IFRIC Update September 2026: Estimating Residual Value under IAS 16, September 2026. https://www.ifrs.org/news-and-events/updates/ifric/2026/ifric-update-september-2026/
- IFRS Foundation, IFRS 16 Leases, accessed 2 October 2026. https://www.ifrs.org/issued-standards/list-of-standards/ifrs-16-leases/
- IFRS Foundation, IFRS 16 Leases issued standard, 2024 edition. https://www.ifrs.org/content/dam/ifrs/publications/pdf-standards/english/2024/issued/part-a/ifrs-16-leases.pdf
- European Union, Regulation (EU) 2023/1804 on alternative fuels infrastructure, 13 September 2023. https://eur-lex.europa.eu/legal-content/EN/ALL/?uri=CELEX%3A32023R1804
- National Renewable Energy Laboratory, Commercial Electric Vehicle Cost-of-Ownership Tool, 29 October 2024. https://www.nrel.gov/news/program/2024/nrels-commercial-electric-vehicle-cost-of-ownership-tool-is-best-in-class-and-free
- European Investment Bank, EIB and EMT Madrid sign EUR 50 million loan to expand zero-emissions urban bus fleet, 2 July 2024. https://www.eib.org/en/press/all/2024-238-eib-and-emt-madrid-sign-eur50-million-loan-to-expand-zero-emissions-urban-bus-fleet
- US Department of Energy, Managed EV Charging for Federal Fleets, accessed 2 October 2026. https://www.energy.gov/cmei/femp/managed-ev-charging-federal-fleets
- US Department of Energy, EVI-LOCATE Step by Step, 14 June 2024. https://www.energy.gov/cmei/femp/articles/evi-locate-step-step
About the Author
Authored by Chennakeshav Adya Independent Researcher
Chennakeshav (CK) is a corporate finance and investment banking executive with 25+ years of global experience in deal origination, structuring and execution across M&A, growth capital and corporate strategy. He has led value-creation mandates for founders, corporates and funds — bridging the boardroom view to hands-on execution and close.
His career spans Morgan Stanley, HSBC, Lloyds Banking Group, EWEC, ADQ portfolio companies and Emirates Growth Fund, across TMT, real estate, fintech, deeptech, cleantech, infrastructure and energy. He has partnered with C-suite leaders, private equity and venture funds, sovereign wealth funds and family offices to finance complex fund raises and scale-up ventures, and has led M&A due diligence, post-merger integration and business-transformation initiatives to create value.
At Matchpoint Partners he is Managing Partner, leading the firm's corporate finance, M&A and capital-raising practice. He holds an MBA from London Business School, an engineering degree from VTU and a Master of Laws (LLM, in progress) from UCL London.
An active start-up mentor, CK mentors at Techstars, DIFC FinTech Hive, Startup Grind, Founder Institute and IN5, serves as Entrepreneur Mentor in Residence (EMiR) at London Business School, and judges the Entrepreneurship World Cup.
Matchpoint profile: https://www.matchpoint-partners.com/team/ck-adya.html LinkedIn: https://www.linkedin.com/in/ckadya/
