

Introduction
Foundation models can support many downstream tasks and products. That breadth creates commercial option value, while it also makes the company perimeter difficult to define. A developer may train proprietary models, distribute them through its own application, sell access through an interface, licence capacity through cloud partners, provide custom models, operate consumer subscriptions and participate in strategic agreements with infrastructure providers. The same organisation can therefore resemble a research laboratory, cloud software business, consumer platform and capital-intensive infrastructure user.
Market evidence reinforces the need for scenario analysis. The UK Competition and Markets Authority identifies compute, data and talent as critical inputs and has examined an interconnected network of partnerships across the foundation-model value chain [7-9]. The US Federal Trade Commission reports that major cloud and AI partnerships can include equity, revenue-sharing, consultation, control, exclusivity, cloud-spend commitments and access to technical and financial information [7]. These relationships can finance growth and extend distribution. They can also create switching cost, concentration and claims on future economics.
Technical leadership is similarly dynamic. Stanford's 2026 AI Index describes a top tier in which several developers are closely grouped on human-preference measures, while open and closed model performance gaps can change over time [10,11]. Provider documentation shows multiple pricing mechanisms, including pay-as-you-go tokens, cached input, batch discounts, reserved throughput and model-specific capacity [12-19]. These mechanisms can materially alter a customer's cost without changing the nominal model family.
A valuation should therefore answer a narrower question than whether artificial intelligence is strategically important. It should determine which cash flows, assets, obligations and options belong to the company, how durable they are under alternative competitive states, and what capital is required to preserve them.
1 Define the company perimeter before selecting a method
The first task is to identify what the investor is valuing. The perimeter should include legal entities, model weights, training code, data rights, evaluation systems, inference stack, customer applications, contracts, cloud arrangements, facilities, people, safety systems, brand, distribution and financing obligations. Assets held by founders, affiliates, universities, cloud partners or open-source communities require separate treatment.
Revenue should be mapped to the product that produces it. Consumer subscriptions, enterprise seats, usage-based interfaces, reserved capacity, customisation, professional services and licensing are economically different. A consolidated growth figure can hide a declining model interface, a subsidised consumer product or a high-margin enterprise cohort. The valuation file should reconcile every material product to contract, usage, invoice, cash and direct cost.
The perimeter also needs a responsibility map. A cloud provider may supply accelerators, host inference, resell the model, provide customer identity and bundle access into a wider platform. The model company may retain product responsibility while lacking direct customer data or pricing control. The agreement must be read alongside operating telemetry and cash settlement.
Intellectual-property ownership should be tested at component level. Training data, code, weights, synthetic data, evaluation sets, fine-tunes, safety classifiers and customer adaptations can have different owners and restrictions. IAS 38 and relevant valuation standards provide useful accounting and valuation boundaries, while legal rights remain fact-specific [3,5].
2 Build a product and customer revenue ledger
Foundation-model revenue quality starts with a customer-product ledger. Each row should identify customer, product, contract, billing unit, committed minimum, usage, credits, price, renewal date, service level, region, model version, distribution channel, invoice, collection and direct delivery cost. Related entities and underlying end users should be aggregated where they create common exposure.
Usage deserves careful interpretation. High token volume can reflect customer value, inefficient prompts, free credits, internal testing or automated traffic. Low volume can coexist with a minimum commitment, although persistent underuse can weaken renewal. The ledger should connect consumption to an accepted customer workflow and a commercial outcome.
Contracted revenue should be distinguished from bookings, remaining obligations, annualised usage and management run-rate. IFRS 15 provides the applicable revenue-recognition framework for reporting entities [4]. Valuation analysis also needs the operational schedules behind recognised revenue: cancellation, service credits, ramp assumptions, minimums, usage tiers, price resets and customer acceptance.
Customer cohorts should follow the path from evaluation to production. The investor should see conversion time, retained usage, expansion, contraction, churn, gross revenue retention, net revenue retention and contribution by acquisition vintage. A model release can temporarily increase trials without improving paid retention. Cohort evidence shows whether technical interest becomes repeatable commercial behaviour.
3 Separate model capability from customer utility
Model benchmarks provide evidence about defined tasks under defined conditions. They do not directly establish enterprise value. A customer buys an outcome delivered by a system that can include retrieval, tools, workflow logic, safety controls, human review, integration, monitoring and support. The valuation should separate base-model capability from complete-system performance.
The product scorecard should include quality, reliability, latency, throughput, availability, security, safety, explainability, controllability and cost for representative workflows. MLCommons publishes reproducible inference benchmark methods that can support infrastructure comparisons [20,21]. Company-specific evaluation still needs customer data, production conditions and a controlled baseline.
Benchmark saturation and contamination can shorten the useful life of a reported lead. Stanford's technical review records rapid progress, close clustering on some measures and concerns about benchmark reliability [10]. The diligence team should inspect evaluation governance, version history, test-set access, independent replication and performance outside the public leaderboard.
Customer utility should be measured against the relevant alternative: a competing model, smaller model, open-weight model, deterministic software, employee process or no deployment. The economic measure can be accepted tasks per dollar, time saved with maintained quality, increased conversion, reduced loss or a controlled service improvement. Valuation credit belongs to the evidence that the company can capture part of that value through price and retention.
4 Model pricing as a portfolio of mechanisms
Public token prices are visible and incomplete. Commercial economics can include input, cached input, output, audio, images, tools, storage, fine-tuning, priority processing, batch, reserved throughput, regional deployment, support and minimum commitments. Enterprise contracts may use confidential discounts and credits. The pricing model should reproduce the actual invoice for every material cohort.
Provider documentation illustrates the available mechanisms. OpenAI describes pay-as-you-go, Batch and reserved or scale capacity structures [12-14]. Anthropic publishes model, cache and batch prices and maintains a documented model-lifecycle process [15,16]. Google publishes Gemini interface prices [17]. Amazon Bedrock publishes model-specific prices, batch discounts and caching mechanisms [18,19]. These schedules change and should be timestamped in diligence.
Price per token alone can mislead. A more capable model may require fewer calls, shorter prompts, less review or a higher acceptance rate. A cheaper model can increase remediation or latency. The customer-level price-volume bridge should combine effective price, consumed units, accepted outputs and service cost.
The investor should test four pricing actions separately: list-price change, negotiated discount, product-mix change and technical efficiency. A lower list price may stimulate usage. A discount may protect a strategic customer while reducing capture. Routing can move workload to a lower-cost model. Caching and batching can reduce cost for suitable workloads. Each mechanism has a distinct effect on revenue, cost and retention.
5 Estimate price elasticity and competitive pass-through
Pricing scenarios require explicit customer behaviour. Management should identify how demand changed after prior price, model or packaging changes. The analysis should control for model quality, product release, capacity, seasonality, customer mix and promotional credits. Where the company lacks observations, the scenario should remain an assumption.
Elasticity varies by workflow. Experimental workloads can expand quickly when cost falls. Regulated production workloads may be constrained by validation, integration and governance. Consumer usage can respond to subscription design and feature limits. A customer with an embedded application may have switching cost, while a developer using a standard interface may route traffic across providers.
Competitive pass-through determines whether falling compute cost creates margin or lower price. A company with differentiated quality, distribution or governance may retain part of the saving. A market with close substitutes and transparent prices may pass most savings to customers. The model should separate technical cost improvement from commercial capture.
Scenario design should avoid a single price forecast. A useful matrix crosses effective price with retained volume and customer contribution. It can then apply different probabilities by product and time period. Management should explain the evidence for each cell and identify which operating decisions can change the result.
6 Reconstruct inference unit economics
Inference cost should be measured from workload telemetry and supplier invoices. The bridge includes tokens or other compute units, model mix, accelerator time, utilisation, memory, storage, network, cache writes, cache reads, batch processing, failed requests, safety calls, retrieval, observability and human review. Shared commitments should be allocated using a documented rule.
Capacity can be bought on demand, reserved, provisioned, committed or indirectly through a strategic partner. The economic cost includes consumed and unused capacity. A company can report attractive cost per active request while carrying a large minimum spend that remains outside customer contribution. The model should show both marginal and fully allocated cost.
Efficiency initiatives should be evidenced through production results. Quantisation, distillation, routing, caching, batching, prompt reduction and improved kernels can lower cost. A larger context window, richer output, more reasoning or redundant safety checks can raise it. Provider documentation confirms that cache and batch prices can differ materially from standard calls [12-19]. Realised savings depend on workload eligibility and behaviour.
The unit should connect to customer value. Tokens per dollar are an operating measure. Accepted tasks per dollar, resolved cases per dollar or retained revenue per compute dollar connect the technical system to the commercial model.
7 Treat training as a capital cycle
Frontier training is a sequence of research, data, experiments, pre-training, post-training, evaluation, safety work, deployment and continuing improvement. The valuation should separate exploratory research, platform development, major training runs and product maintenance. Each category has different success probability and useful life.
Scaling-law research shows systematic relationships between compute, model size, data and performance, while compute-optimal training work demonstrates that allocation across model and data can materially affect results [31,32]. These findings support disciplined planning. They do not turn a training budget into a predictable asset.
The capital schedule should include accelerators, cloud commitments, data acquisition, preparation, specialist labour, failed runs, evaluation, security, red-teaming, launch capacity and contingency. It should show when cash is paid, when a model becomes commercially available, which predecessor it replaces and what incremental revenue or contribution it supports.
Management should preserve forecast vintages and experiment records. A valuation can then compare expected and realised cost, schedule, capability and adoption. Persistent overruns or weak commercial conversion should affect the probability, timing and capital charge applied to future training.
8 Estimate model economic life and replacement need
A model does not need to stop functioning for its economic value to decline. Competitors can improve, prices can fall, customers can migrate, a platform can retire the interface, regulation can change or the company's own successor can cannibalise demand. Anthropic's public deprecation record illustrates why model lifecycle belongs in product and valuation analysis [16].
The company should track revenue, usage, contribution and customer count by model version. It should record migration time, incentives, breakage, support cost and churn when a model is replaced. This evidence supports an economic-life estimate for the deployed model and its customer relationships.
The valuation should distinguish the current model asset from the organisation's ability to produce successors. Weights can have a short commercial life. Research systems, data rights, evaluation infrastructure, distribution and a proven team may retain value across generations. The required reinvestment to preserve that capability belongs in cash flow.
An investor can use an obsolescence reserve or explicit replacement schedule. The model should avoid capitalising every research dollar and avoid assuming that all research disappears immediately. Evidence determines which expenditure produces controlled and transferable capability.
9 Test compute access and infrastructure commitments
Foundation-model development and deployment require access to accelerators, networking, storage, power and specialised software. Public filings from Microsoft, Alphabet, Meta and Oracle describe substantial AI and data-centre investment and the effect of infrastructure on cost and capital expenditure [26-29]. These disclosures demonstrate industry capital intensity. They do not disclose the economics of a private target.
The target's compute register should list provider, region, accelerator, capacity, term, price, minimum spend, renewal, portability, security, data location, termination, assignment, change of control and service-level rights. Strategic investments and credits should be reconciled to legal agreements and usable capacity.
Concentration can create both advantage and risk. Preferential access may support model delivery. A tied cloud commitment can reduce switching flexibility and expose the company to one supplier's roadmap. The FTC and CMA reports provide a framework for examining these relationships [7-9].
The downside case should test delayed capacity, lower utilisation, stranded commitments, loss of credits, price changes, migration cost and inability to assign an agreement after a transaction. It should also test the capital required to move from experimental demand to reliable production.
10 Diligence data rights and provenance
Training and evaluation depend on data whose rights can differ by source and use. The register should cover licensed content, public data, customer data, synthetic data, employee contributions, purchased datasets, scraped material and generated outputs. For each source, the company should record owner, licence, permitted use, territory, term, attribution, confidentiality, privacy, deletion and model-output implications.
Legal analysis is jurisdiction- and fact-specific. The valuation consequence comes from operational dependence. If a material dataset cannot be renewed or used for a successor model, management should estimate replacement time, cost and performance effect. If customer data improves a product, the contract should support that use.
Data quality also matters. Provenance, deduplication, contamination, language coverage, safety filtering and refresh affect model performance and claims. The diligence team should trace key evaluation and training datasets into the reproducible pipeline.
Data option value should remain separate from current cash flow. A collection can support future products when rights, usability, uniqueness and demonstrated demand exist. Volume alone does not establish value.
11 Value talent and the research operating system
Foundation-model capability can depend on a small number of researchers, systems engineers, product leaders and safety specialists. An investor should identify critical teams through code, experiments, incidents, model releases, customer escalations and technical decisions. Job titles and publication counts provide context, while operating evidence shows dependency.
The research operating system includes experiment design, data pipelines, training orchestration, evaluation, review, documentation, security, launch and post-release learning. A repeatable system can retain value when a particular model ages. A founder-dependent process can lose value quickly after a transaction.
Retention analysis should include vesting, liquidity, compensation, immigration, location, non-compete enforceability, academic roles and mission alignment. Transaction structure can protect continuity through rollover equity, retention arrangements, governance and a funded research roadmap. Current legal and tax advice is required.
Knowledge transfer should be tested before attributing platform value. Another authorised team should reproduce a build, run an evaluation, diagnose a failure and execute a controlled release using documented systems.
12 Assess distribution power and customer ownership
Distribution can determine which technically capable model reaches customers. Routes include direct interfaces, consumer applications, cloud marketplaces, productivity suites, device platforms, developer ecosystems and systems integrators. Each route affects price, data, brand, support, working capital and the right to contact the customer.
The distribution register should show partner, product, territory, economics, exclusivity, placement, default status, bundling, customer identity, data access, renewal, termination and transition. The company's reported customer count should distinguish direct customers from end users reached through a partner.
Bundling can accelerate adoption while obscuring willingness to pay. A model included in a broader subscription may generate internal transfer economics rather than an arm's-length price. A marketplace can create broad availability without committed usage. The valuation should follow enforceable settlement and customer behaviour.
Strategic distribution option value belongs in a separate case. It should depend on rights, implementation, observed conversion and contribution. A partnership announcement alone is insufficient.
13 Reconcile governance safety and liability to economics
NIST's AI Risk Management Framework and generative-AI profile organise risk work through governance, mapping, measurement and management [22,23]. Secure-development guidance extends the evidence needed across software and model lifecycles [24]. The EU AI framework can create obligations based on role, system and use [25]. These sources provide diligence questions; the company's duties require current legal analysis.
Governance cost should appear in the operating model. Evaluation, red-teaming, incident response, abuse prevention, customer assurance, model documentation, security and regulatory work require people and systems. Weak controls can create delayed launches, customer loss, remediation and liability. Effective controls can support access to regulated or high-trust customers.
The target should maintain a claim register linking marketing, benchmark, safety, privacy, copyright, security and performance statements to evidence and an accountable owner. Customer contracts should align with product capability and upstream terms.
The valuation downside should include defined events: model withdrawal, material incident, regulatory restriction, data claim, security breach, customer remediation and service credits. Insurance, contractual limits and reserves should be evaluated against the exposure.
14 Construct four operating scenarios
The premium controlled-access case assumes differentiated performance, strong enterprise demand, limited discounting, reliable capacity and retained customer value. Volume grows more slowly because price remains high. Contribution supports research, and the company can finance part of its frontier programme from operations.
The competitive central case assumes several capable providers, measured differentiation in selected workflows, normal enterprise discounts and continued efficiency gains. Volume expands, while pricing and partner economics constrain capture. The company requires external capital to fund major training cycles.
The price-compression case assumes rapid reduction in effective price, customer routing across providers, larger contexts, high usage and significant pass-through of technical savings. Revenue grows weakly relative to volume. Contribution falls while the company maintains an expensive research programme.
The open-substitute case assumes customers adopt open-weight or lower-cost models for a large share of workloads. The company retains high-value regulated, safety-sensitive or specialised work, yet loses broad interface volume. Management reduces frontier expenditure and focuses on defensible cohorts. These scenarios are analytical states, not predictions.
15 Build an integrated financial model
The model should start with customer and workload cohorts. Revenue equals accepted billable units multiplied by effective price, adjusted for minimums, credits, service levels and channel economics. Direct cost follows the same workloads through model routing, compute, data, tools, support and human review.
Operating expenditure should separate product delivery, research, sales, general operations, governance and major training programmes. Cash flow should include capacity prepayments, minimum commitments, customer collections, capital expenditure, financing costs and taxes. Forecasts should reconcile to the opening balance sheet and liquidity.
Each scenario should show price, volume, revenue, gross contribution, research requirement, cash before financing and minimum funding. The model should preserve assumptions and source dates. Sensitivities should vary one driver and correlated groups.
The board should see which actions change outcomes. Routing and caching can affect unit cost. Enterprise packaging can affect price and retention. Distribution renegotiation can affect capture. A staged training programme can affect cash and option value. The model becomes a decision system when each lever has an owner, test and deadline.
16 Apply multiple valuation methods with discipline
Discounted cash flow can value cash-generating cohorts and explicit capital requirements. The forecast period should be long enough to capture training cycles and model replacement, while terminal assumptions should reflect continuing reinvestment and competition. A high terminal margin without continuing model and infrastructure investment is internally inconsistent.
Comparable-company analysis can provide market context. The peer set should align on product, customer, revenue model, growth, contribution, capital intensity, infrastructure obligations and risk. Cloud platforms, application software, data-centre operators and model developers have different economics. A broad software multiple can misstate value.
Replacement cost can inform the value of reproducible data, systems and capability. Historical expenditure is not automatically value. The analysis should adjust for failed work, obsolescence, unavailable rights, current efficiency and the time required to rebuild the team and platform.
Real-option analysis can value staged opportunities such as a new model, regulated market or distribution channel. The option requires a defined future decision, required investment, evidence gate and right to stop. Strategic importance without control or a decision path is not a financeable option.
IFRS 13 and IVS provide principles for fair-value and valuation analysis [1-3]. A transaction valuation remains purpose-, date- and fact-specific and requires qualified professional judgement.
Method selection should also follow the stage of evidence. A company with production cohorts and recurring contribution can support a detailed income approach. A pre-commercial laboratory may require a cost, milestone and option framework. A business with both can be valued in parts, provided shared research, capacity and distribution costs are allocated consistently and interdependencies are retained.
The discount rate should not become a substitute for explicit modelling. Price compression, customer churn, training failure, capital delay and model retirement affect cash flows through different mechanisms and dates. They should be represented in the scenarios before residual uncertainty is reflected in the rate. The same risk should not be charged twice without explanation.
Terminal value requires particular care. A model company that must undertake repeated training, migration and safety work cannot reach a steady state by stopping reinvestment. The terminal case should state the continuing research, infrastructure and governance required to sustain revenue. It should also show how much customer value is captured after expected price and cost changes.
A sum-of-the-parts analysis can separate existing enterprise cohorts, consumer products, model interfaces, data or tooling businesses and development options. Shared assets should be allocated once. Cross-product benefits should be supported by observed conversion or cost evidence and should not be added as an unconstrained synergy premium.
17 Illustrative scenario economics
Consider a wholly hypothetical foundation-model company serving enterprise and developer customers. The figures in this section are management assumptions for demonstrating the framework. They do not describe an actual company, current provider or investment opportunity.
In the competitive central case, annual revenue is assumed at USD 250 million. Direct inference and infrastructure cost is USD 70 million, customer support and safety operations are USD 20 million, and channel and delivery cost is USD 25 million. Contribution before central research, sales and administration is USD 135 million. The company undertakes USD 140 million of frontier training and research and produces negative USD 35 million of cash before financing after other operating cash items.
The premium controlled-access case assumes USD 300 million of revenue, USD 165 million of contribution, USD 120 million of frontier training and USD 20 million of cash before financing. The price-compression case assumes USD 210 million of revenue, USD 72 million of contribution, USD 160 million of frontier training and negative USD 118 million of cash before financing. The open-substitute case assumes USD 155 million of revenue, USD 45 million of contribution, USD 90 million of frontier training and negative USD 80 million of cash before financing.
These outcomes show why revenue growth, unit cost and research capital must be analysed together. Strong volume can coexist with weak cash generation. A smaller focused platform can remain valuable when it retains defensible customers and reduces the capital cycle.
18 Value evidence states separately
The illustrative valuation separates four evidence states. A technical option contains a credible team, controlled assets and promising evaluations without durable commercial economics. A paid platform has repeat customers and production use but remains capital intensive. Scalable economics combine retained cohorts, controlled contribution and financeable research. A category platform adds durable distribution, differentiated capability and strategic options.
For demonstration, the technical option is assigned an enterprise value of USD 250 million and a probability of 15 per cent. The paid platform is assigned USD 800 million at 35 per cent. Scalable economics are assigned USD 1,800 million at 35 per cent. The category platform is assigned USD 4,000 million at 15 per cent. The probability-weighted total is USD 1,547.50 million.
This calculation is not a substitute for a valuation. It forces the committee to identify the evidence needed for each state and to avoid embedding every strategic possibility in the base case. Probabilities, values and transitions should be developed from the specific company, transaction and valuation date.
19 Structure capital and consideration around evidence
Financing should match the company's evidence and cash cycle. Equity can fund uncertain research and option creation. Customer prepayments or minimum commitments can support production capacity when obligations and acceptance are clear. Asset or infrastructure finance may suit controlled equipment or contracted capacity. Debt requires credible cash service, covenants and downside resilience.
Transaction consideration can separate current value from future proof. Cash at closing can reflect controlled assets and existing cohorts. Deferred consideration can follow retained contribution, enterprise renewal, a successful model release or contracted capacity. Earnouts require precise definitions, operating covenants, accounting rules, audit rights and dispute mechanisms.
Cloud credits and strategic investment should be analysed as linked agreements. A headline investment can be offset by mandatory spend, revenue share, preferential rights or restrictions. The sources-and-uses schedule should show usable cash, committed capacity and obligations separately.
Capital release should follow evidence gates. A board can approve a research tranche after reproducibility, capacity and data-right tests; a deployment tranche after production acceptance; and a scale tranche after retained contribution. This structure preserves upside while limiting irreversible capital before the evidence exists.
20 Govern valuation after the transaction
Valuation should become an operating control after investment or acquisition. The board should receive a monthly bridge from price, volume and mix to revenue, contribution, research spend, cash and forecast variance. Product reporting should connect model releases to customer adoption, reliability, cost and retention.
The dependency register should track cloud, accelerators, data, models, software, distribution and critical people. Changes in price, terms, availability, rights or concentration should enter the forecast. The risk register should connect incidents and control findings to customer and financial exposure.
Management should preserve scenario history. Actual results should be compared with the assumptions used at investment, including pricing, volume, unit cost, migration, training schedule and capital requirement. This creates accountability and improves future decisions.
The decisive question is whether the company can repeatedly turn technical capability into customer value, retained contribution and financeable renewal. A valuation supported by that evidence can adapt as prices and competitors change.
Conclusion
Foundation-model company valuation requires an integrated view of product, customer, compute, research, distribution, rights, governance and capital. Public benchmarks and token prices provide important context. They do not replace company-specific evidence.
The framework developed in this paper values cash-generating cohorts, required reinvestment and strategic options separately. It uses alternative pricing and competition cases to expose the interaction among effective price, volume, compute cost, model replacement, distribution and financing. It ties transaction structure and capital release to observable operating evidence.
An attractive company can sustain customer utility as models change, capture a disciplined share of customer value, control its critical dependencies, finance its research cycle and preserve strategic flexibility. The investment case should be strongest where these attributes are documented through contracts, telemetry, reproducible systems, retained cohorts and collected cash.
Appendix A. Foundation-model valuation evidence register
The evidence register should include legal entities, asset ownership, model versions, training runs, data rights, evaluation records, customer contracts, usage, invoices, cash, pricing, capacity commitments, cloud credits, direct cost, distribution terms, incidents, governance controls, financing and forecast vintages. Every investment-committee claim should link to a dated source and accountable owner.
Appendix B. Pricing and workload file
The pricing file should reproduce customer invoices from workload telemetry. It should identify input, cached input, output, tools, storage, batch, reserved capacity, regional delivery, discounts, credits and service adjustments. It should retain the provider price schedule and contract version used for each period.
Appendix C. Model release and replacement dossier
The dossier should contain training scope, data, compute, evaluation, safety, launch criteria, capacity, customer migration, predecessor retirement, cost, schedule and realised commercial outcomes. Forecast and actual evidence should remain separate.
Appendix D. Scenario control sheet
Each case should state effective price, volume, customer retention, model mix, compute cost, utilisation, distribution share, research programme, working capital, financing and probability. Management should document correlations and operating responses.
Appendix E. Transaction evidence room
The evidence room should include corporate records, intellectual-property assignments, model and data documentation, customer and partner contracts, cloud agreements, financial reconciliations, security evidence, regulatory analysis, insurance, people arrangements, financing and the signed valuation model.
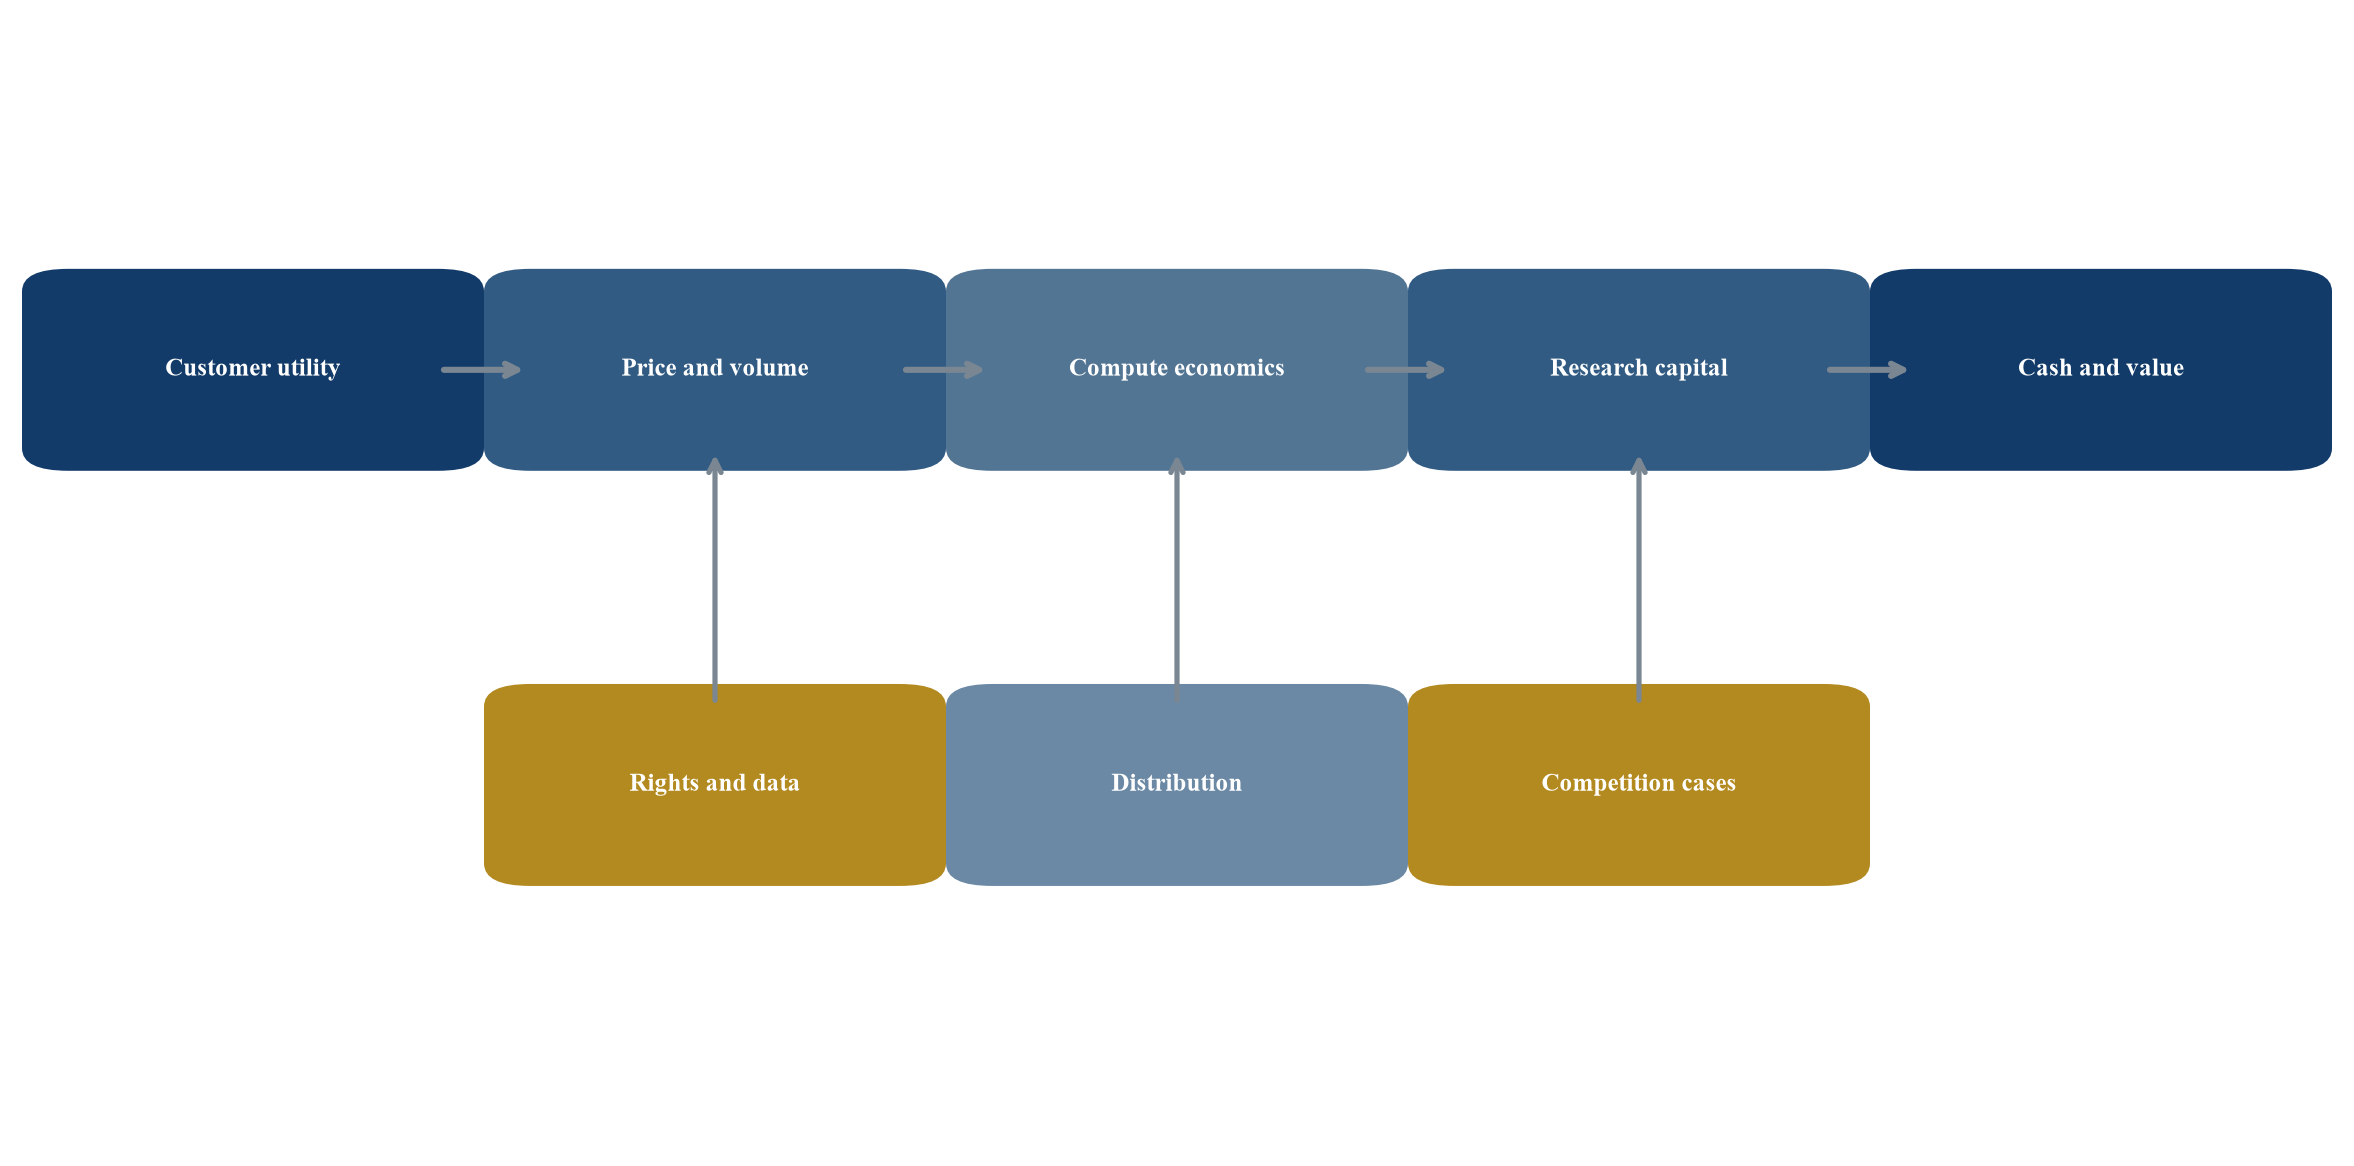
Proposed framework; every conclusion requires company-specific technical commercial and financial evidence.
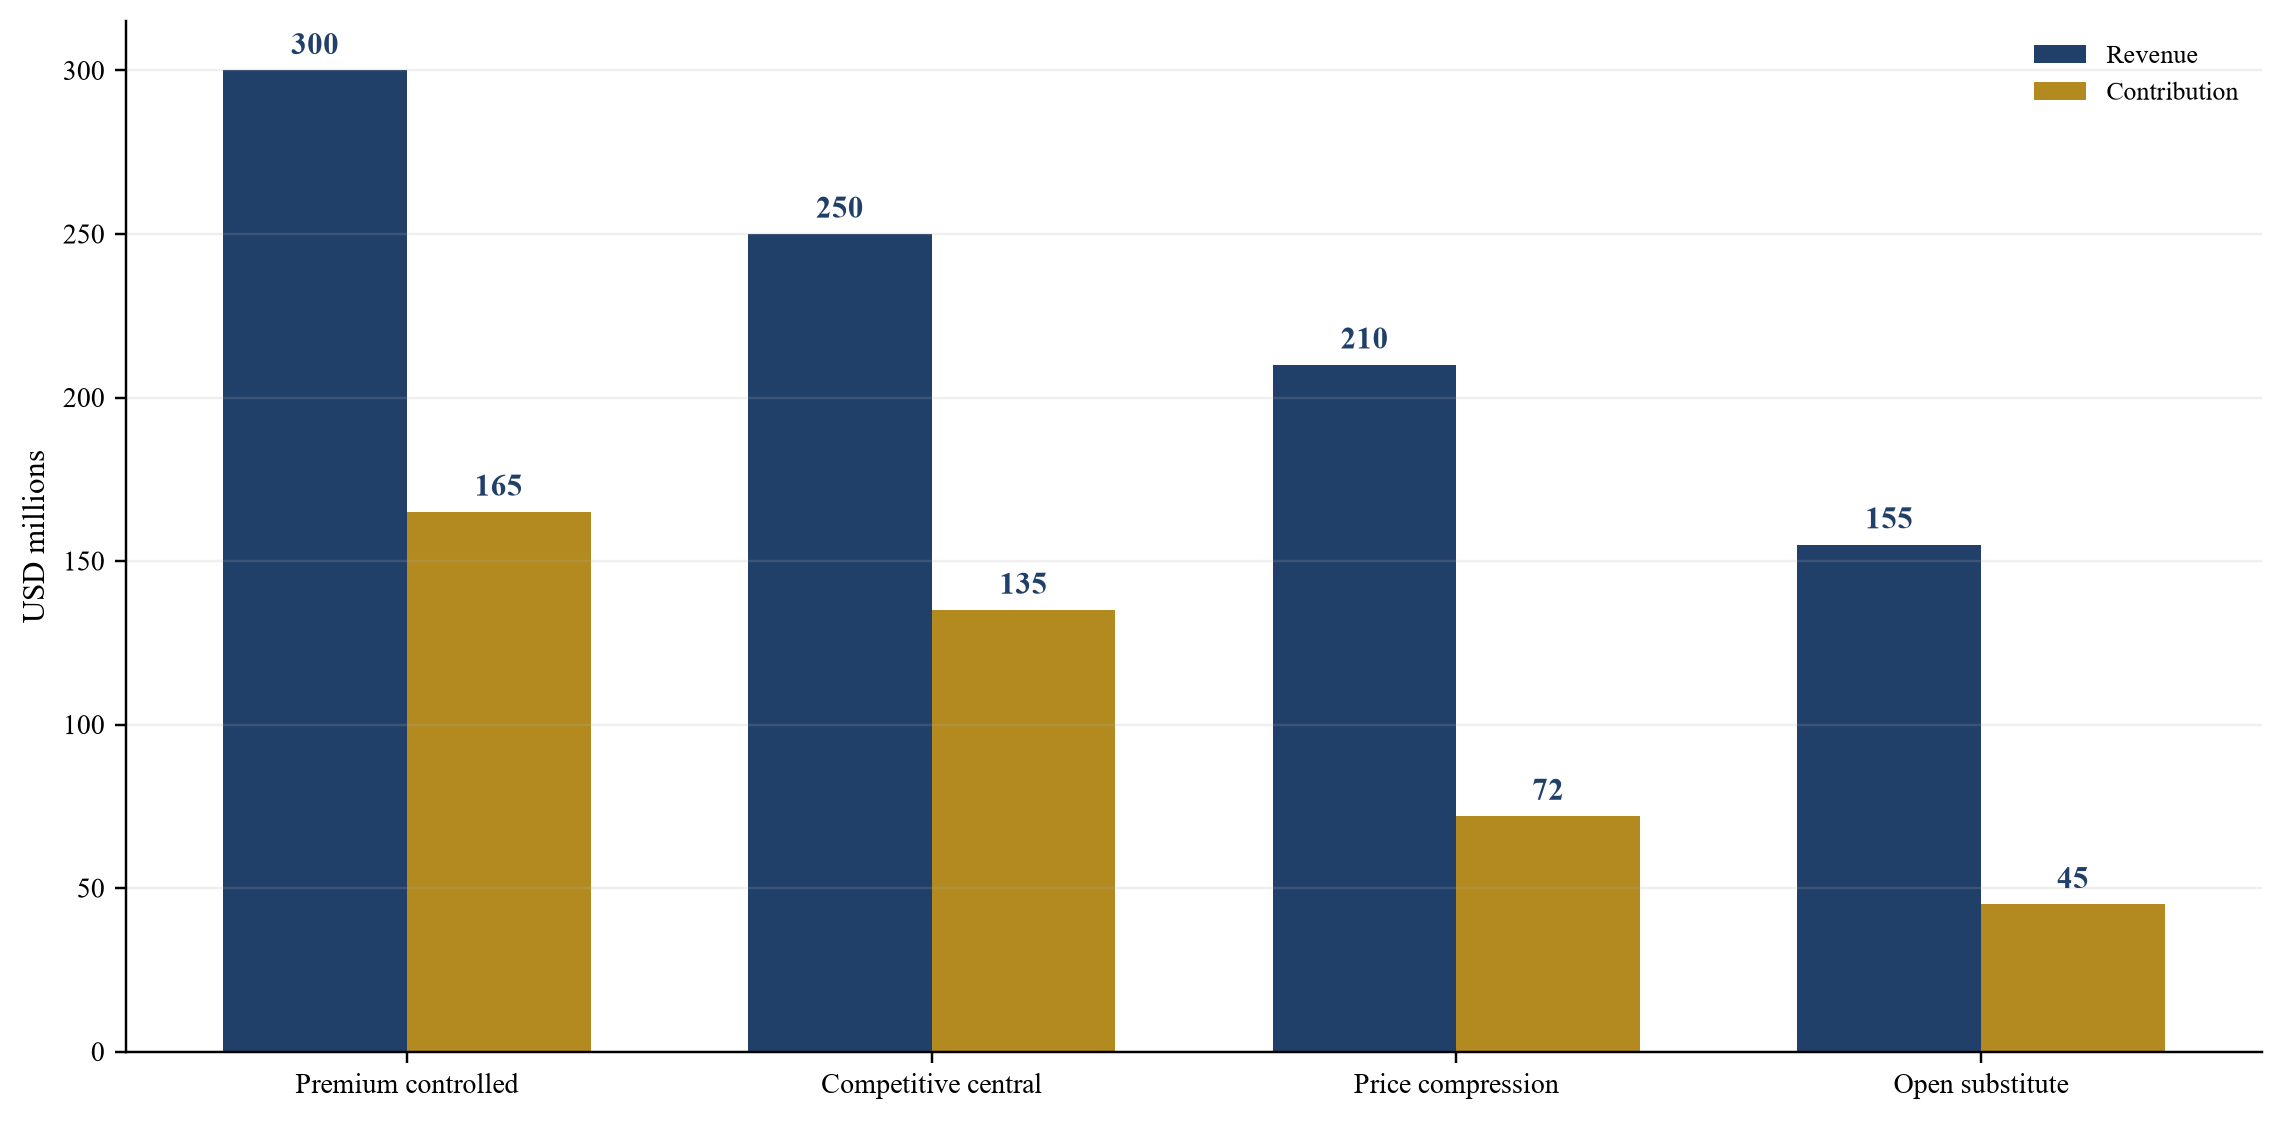
Management assumptions in USD millions; figures are not market observations forecasts or valuation conclusions.
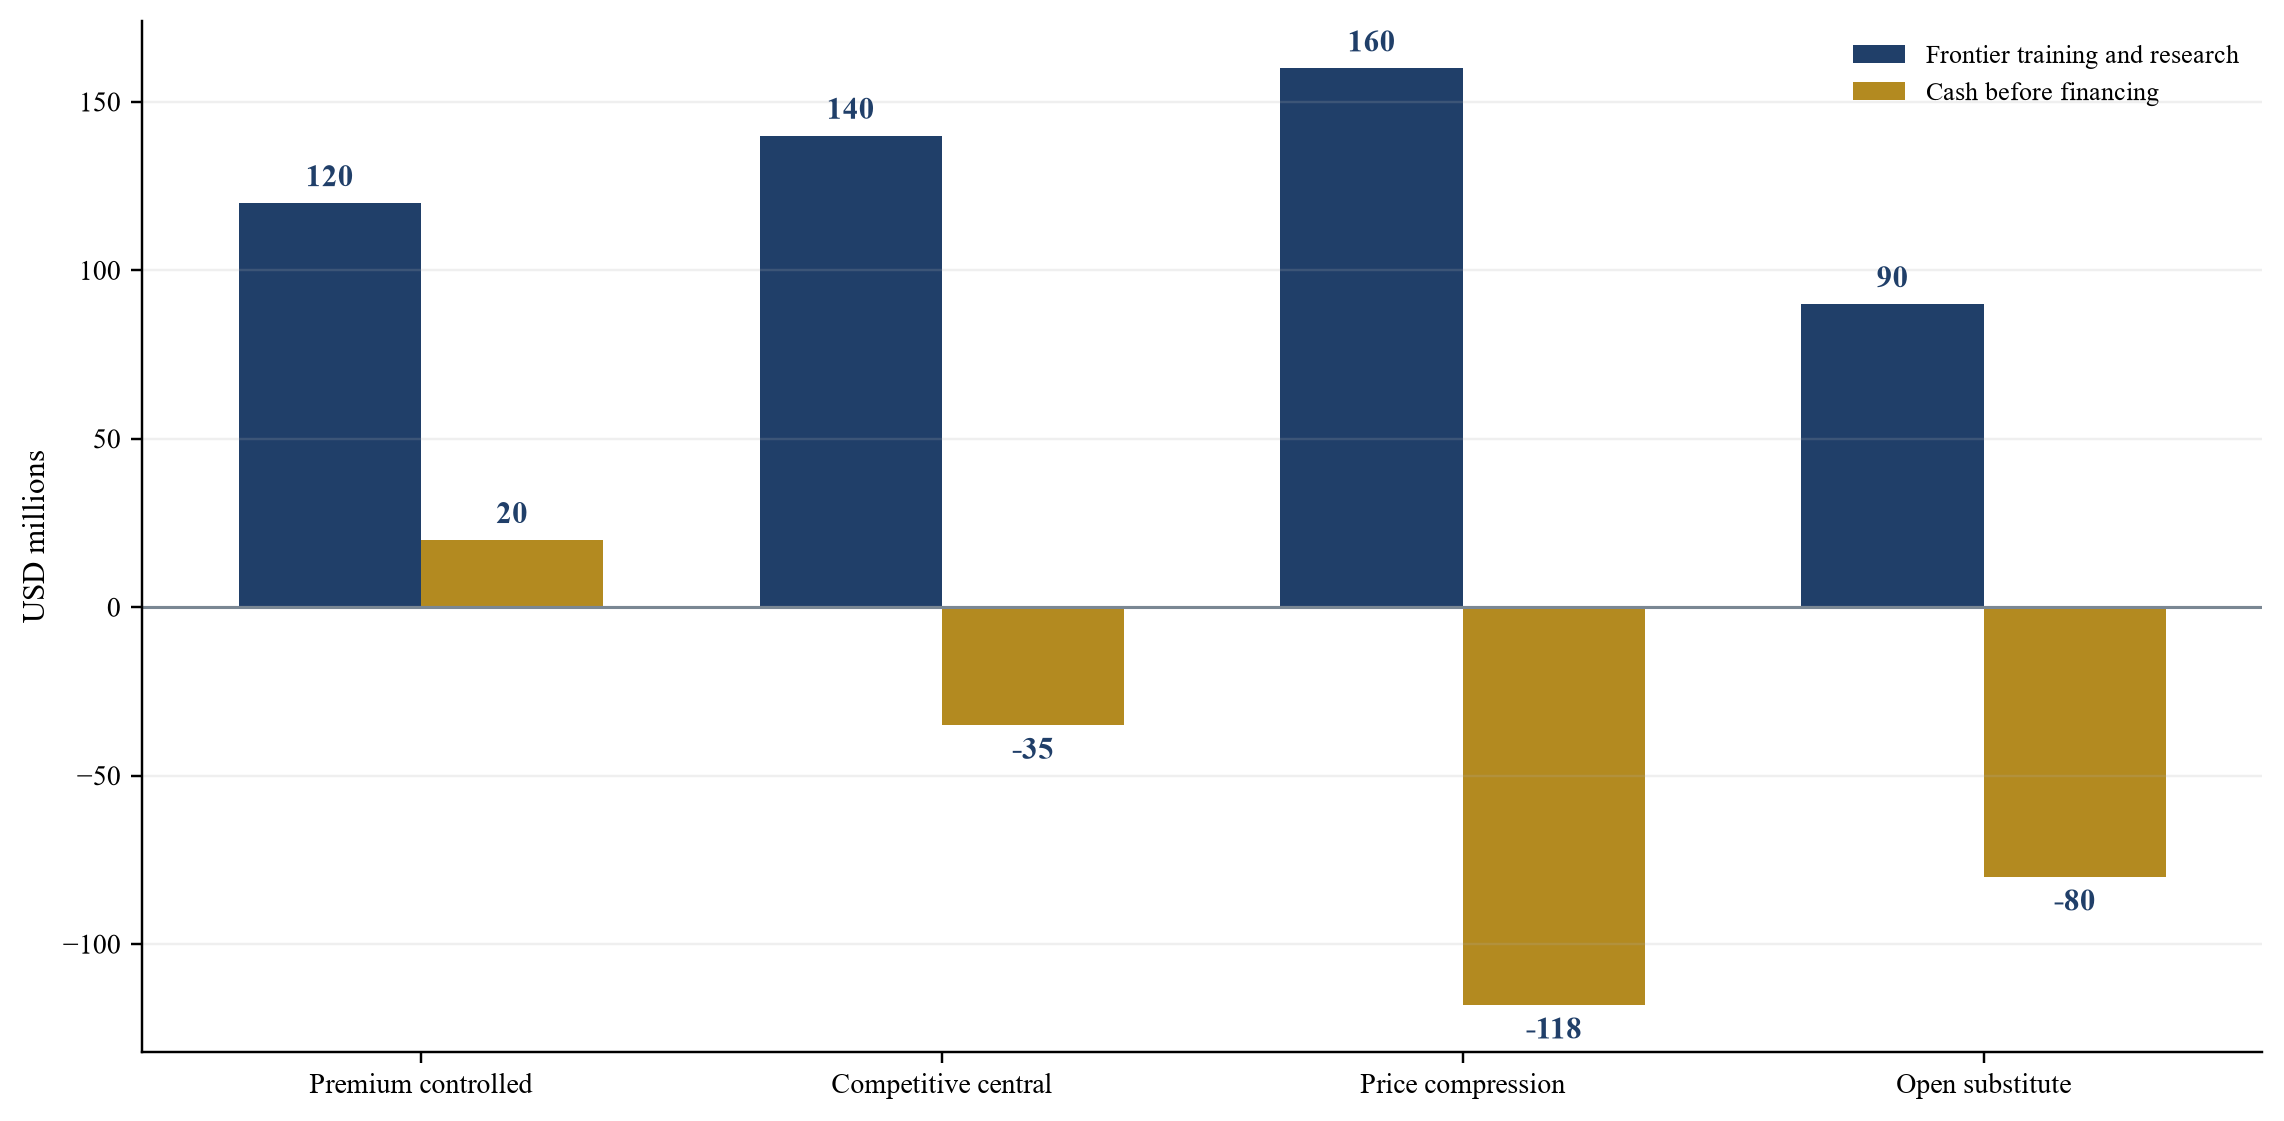
Management assumptions in USD millions; negative cash values indicate external funding need before any minimum liquidity reserve.
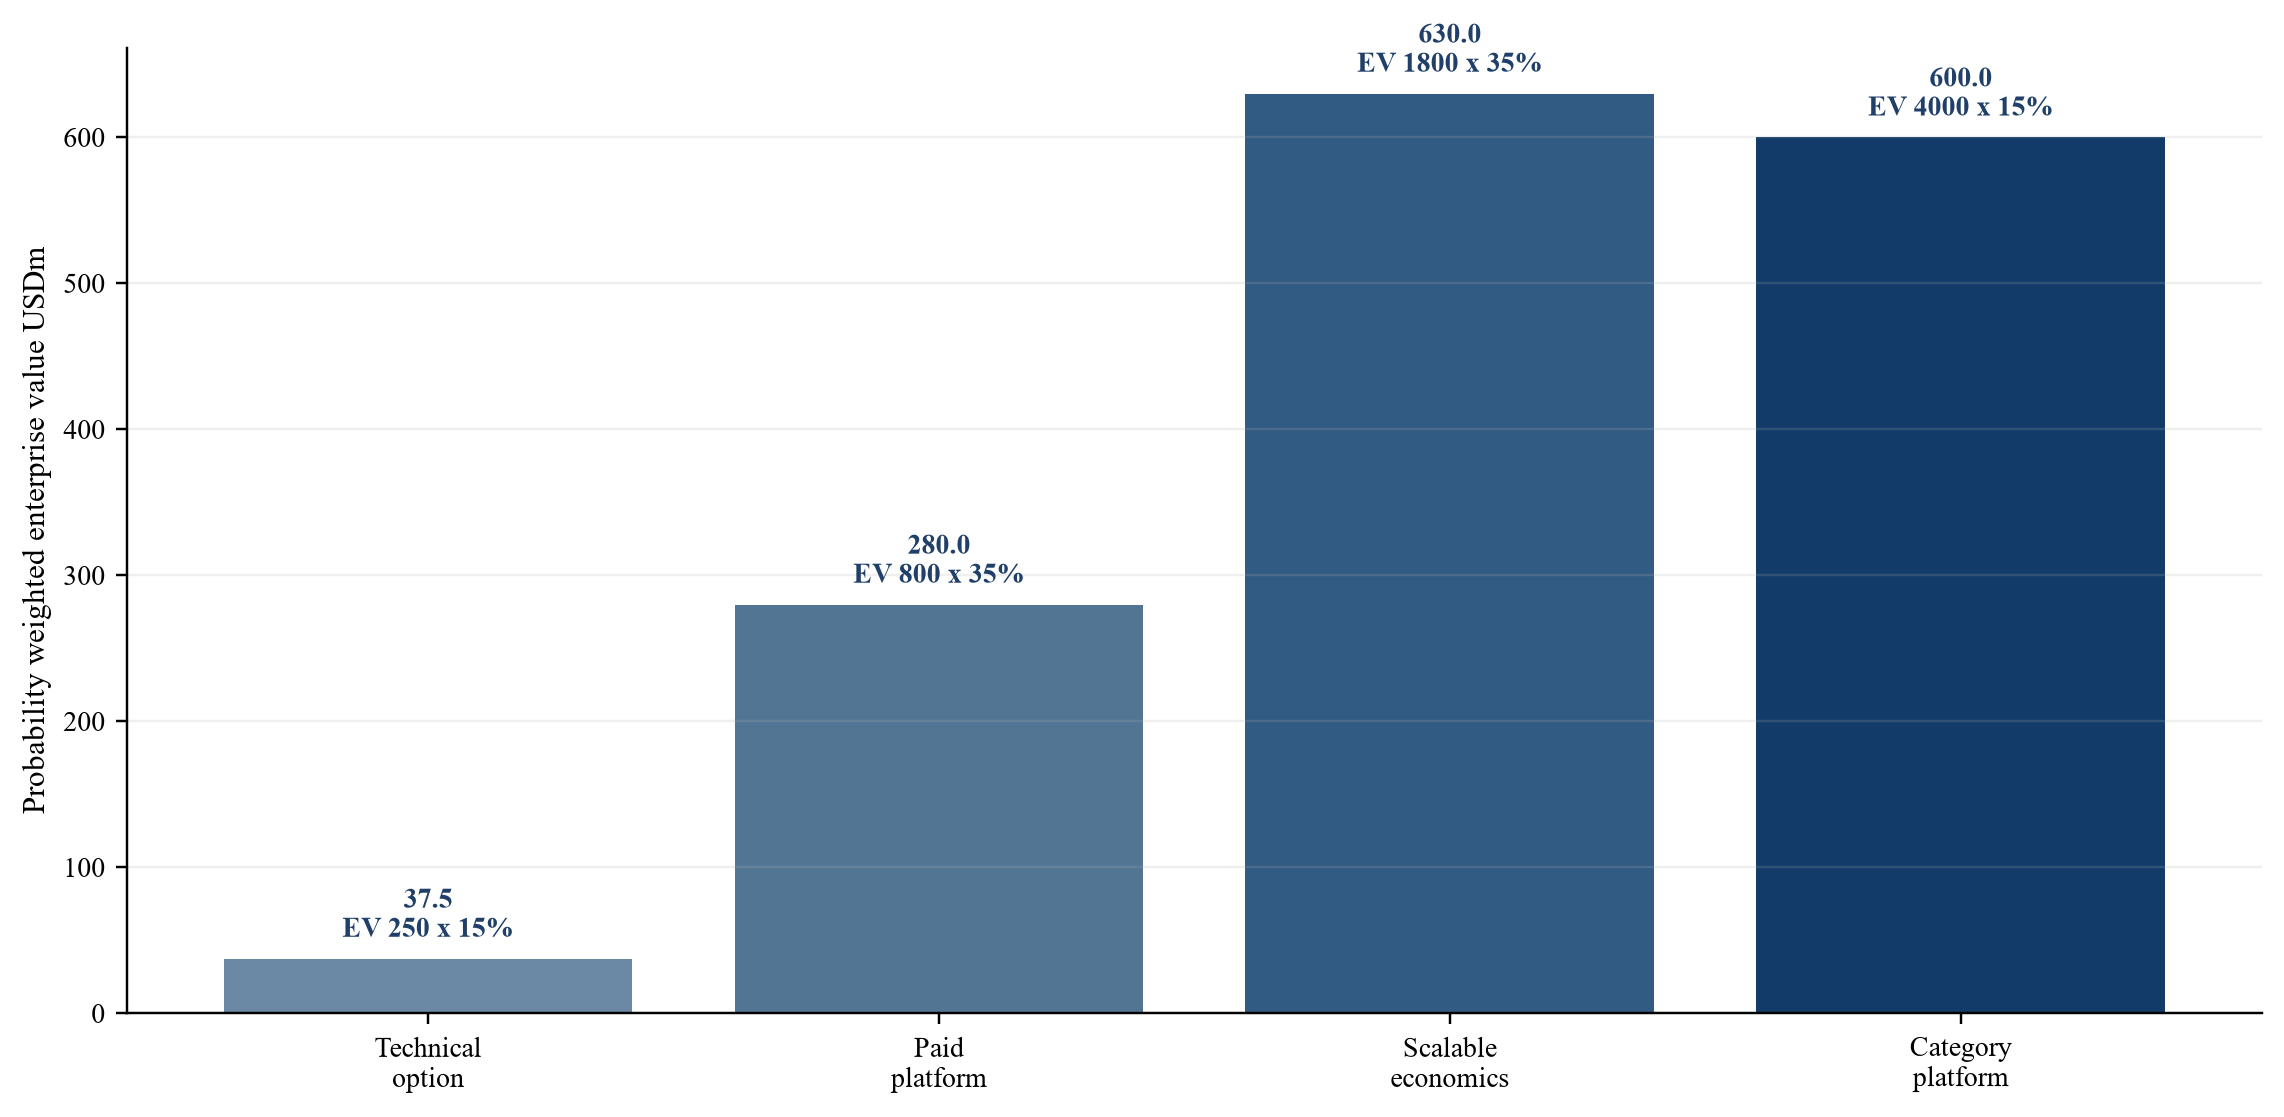
Management assumptions in USD millions; the chart is not a valuation conclusion.
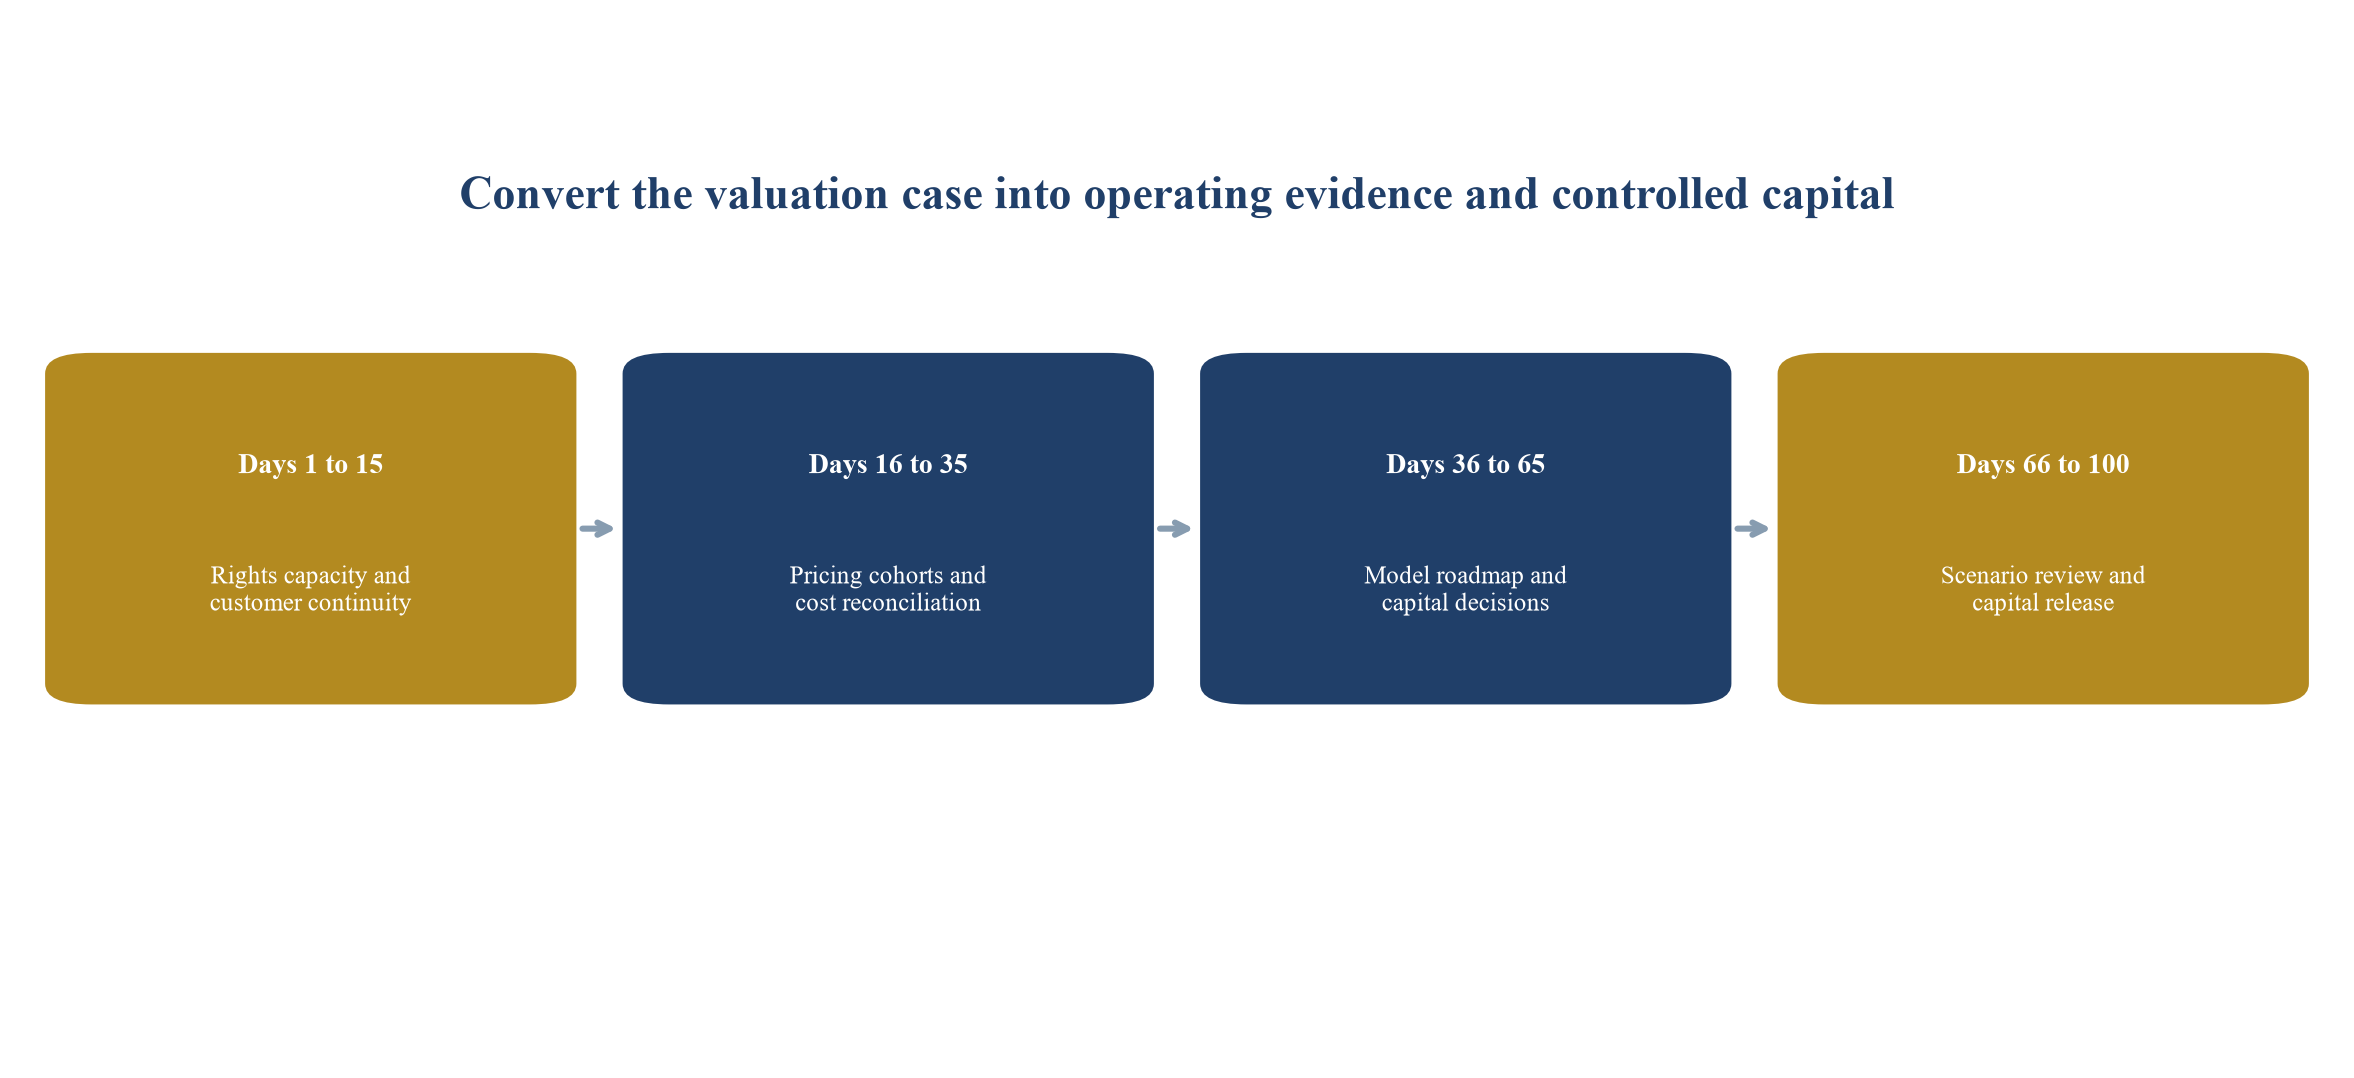
Proposed sequence; timing should follow transaction customer regulatory and financing constraints.
| Component | Evidence | Valuation question | Principal risk |
|---|---|---|---|
| Models and weights | repositories releases hashes and rights | what capability is controlled and transferable | short economic life or restricted rights |
| Data and evaluation | provenance licences pipelines and tests | can capability be reproduced and improved | unavailable rights contamination or weak evidence |
| Customer products | contracts telemetry invoices and cash | which workflows create retained contribution | trials credits or bundled usage mistaken for demand |
| Compute and capacity | agreements utilisation invoices and commitments | can delivery and training be financed | concentration unused capacity and change restrictions |
| Research system | experiments people processes and forecast history | can the company produce valuable successors | founder dependence and repeated overruns |
| Distribution | partner agreements placement economics and customer access | who controls demand and price | bundling termination and limited customer ownership |
Proposed diligence structure; evidence requirements depend on the company and transaction.
| Scenario | Effective price | Volume | Customer retention | Research posture |
|---|---|---|---|---|
| Premium controlled access | high and resilient | focused growth | strong in differentiated workflows | selective frontier investment funded partly from operations |
| Competitive central | declining with normal discounting | broad growth | mixed by cohort | continuing frontier programme with external capital |
| Price compression | rapid decline and high pass through | high usage growth | vulnerable developer traffic | expensive programme under funding pressure |
| Open substitute | weak broad interface price | lower proprietary volume | retained specialised cohorts | focused models and defensible workflows |
Analytical states; these are not forecasts.
| Field | Required evidence | Control | Decision use |
|---|---|---|---|
| Contract and billing | signed terms order invoice and recognition policy | reconcile product term and entity | contracted revenue and renewal |
| Workload and acceptance | telemetry workflow outcome and service evidence | versioned customer and model identifiers | price volume and utility |
| Effective price | list price discount credits channel share and adjustments | invoice reproduction | price realisation and elasticity |
| Direct cost | compute data tools support safety and review | invoice and allocation reconciliation | contribution and cash |
| Collection | receivable settlement and bank receipt | aged balance and exception owner | liquidity and customer quality |
Proposed minimum evidence fields for customer-level economic analysis.
| Case | Revenue | Contribution | Frontier training and research | Cash before financing |
|---|---|---|---|---|
| Premium controlled access | 300 | 165 | 120 | 20 |
| Competitive central | 250 | 135 | 140 | -35 |
| Price compression | 210 | 72 | 160 | -118 |
| Open substitute | 155 | 45 | 90 | -80 |
Management assumptions in USD millions; figures are not market observations forecasts or valuation conclusions.
| Item | USD millions | Evidence required |
|---|---|---|
| Revenue | 250 | customer product contract usage invoice and cash ledger |
| Direct inference and infrastructure | -70 | workload telemetry supplier invoice and commitment allocation |
| Customer support and safety operations | -20 | staffed effort incidents assurance and allocation |
| Channel and delivery cost | -25 | partner settlement implementation and customer support |
| Contribution before central cost | 135 | reconciled cohort schedule |
Management assumptions in USD millions; excludes central research sales administration financing and tax.
| Evidence state | Enterprise value | Probability | Weighted value |
|---|---|---|---|
| Technical option | 250.00 | 15% | 37.50 |
| Paid platform | 800.00 | 35% | 280.00 |
| Scalable economics | 1800.00 | 35% | 630.00 |
| Category platform | 4000.00 | 15% | 600.00 |
| Total | 100% | 1547.50 |
Management assumptions in USD millions; this is not a valuation conclusion.
| Gate | Required evidence | Capital or consideration response | Post decision measure |
|---|---|---|---|
| Rights and reproducibility | ownership data rights controlled build and evaluation | closing condition or protected tranche | reproduced release and rights exceptions |
| Customer utility | accepted workflows retained cohorts and collected cash | base value | retention contribution and collection |
| Compute economics | workload invoices commitments utilisation and portability | funding reserve or price adjustment | accepted task cost and capacity use |
| Model roadmap | scoped run budget capacity evaluation and launch plan | staged research capital | cost schedule capability and adoption |
| Strategic option | defined market right investment and evidence gate | deferred consideration or option budget | exercised right and incremental cash |
Proposed framework; actual instruments require current legal tax accounting and financial advice.
Sources
- IFRS Foundation. IFRS 13 Fair Value Measurement. Read the primary source
- IFRS Foundation. Educational material on measuring unquoted equity instruments within IFRS 13. Read the primary source
- International Valuation Standards Council. International Valuation Standards. Read the primary source
- IFRS Foundation. IFRS 15 Revenue from Contracts with Customers. Read the primary source
- IFRS Foundation. IAS 38 Intangible Assets. Read the primary source
- IFRS Foundation. IAS 36 Impairment of Assets. Read the primary source
- US Federal Trade Commission. Partnerships Between Cloud Service Providers and AI Developers. January 2025. Read the primary source
- UK Competition and Markets Authority. AI Foundation Models Update Paper. April 2024. Read the primary source
- UK Competition and Markets Authority. AI Foundation Models Technical Update Report. April 2024. Read the primary source
- Stanford Institute for Human-Centered Artificial Intelligence. AI Index Report 2026 Technical Performance. Read the primary source
- Stanford Institute for Human-Centered Artificial Intelligence. The 2026 AI Index Report. Read the primary source
- OpenAI. API model and pricing documentation. Read the primary source
- OpenAI. Batch API reference. Read the primary source
- OpenAI. Scale Tier for API customers. Read the primary source
- Anthropic. Claude Platform pricing documentation. Read the primary source
- Anthropic. Model deprecations and lifecycle documentation. Read the primary source
- Google. Gemini Developer API pricing. Read the primary source
- Amazon Web Services. Amazon Bedrock pricing. Read the primary source
- Amazon Web Services. Prompt caching for faster model inference. Read the primary source
- MLCommons. MLPerf Inference benchmarks. Read the primary source
- MLCommons. MLPerf Inference datacenter benchmark. Read the primary source
- National Institute of Standards and Technology. Artificial Intelligence Risk Management Framework. Read the primary source
- National Institute of Standards and Technology. Generative Artificial Intelligence Profile NIST AI 600-1. Read the primary source
- National Institute of Standards and Technology. Secure Software Development Practices for Generative AI and Dual-Use Foundation Models. Read the primary source
- European Commission. Regulatory framework for artificial intelligence. Read the primary source
- Microsoft Corporation. Annual Report on Form 10-K for fiscal 2026. Read the primary source
- Alphabet Inc. Annual Report on Form 10-K for 2025. Read the primary source
- Meta Platforms Inc. Annual Report on Form 10-K for 2025. Read the primary source
- Oracle Corporation. Annual Report on Form 10-K for fiscal 2026. Read the primary source
- Financial Accounting Standards Board. Accounting Standards Codification Topic 606. Read the primary source
- Hoffmann J and others. Training Compute-Optimal Large Language Models. 2022. Read the primary source
- Kaplan J and others. Scaling Laws for Neural Language Models. 2020. Read the primary source
- FinOps Foundation. FinOps Framework 2025. Read the primary source
- FinOps Open Cost and Usage Specification. Calculate unit economics. Read the primary source
- World Intellectual Property Organization. Artificial Intelligence and Intellectual Property. Read the primary source
- US Securities and Exchange Commission. AI Roundtable remarks. 27 March 2025. Read the primary source
