

1. The investment decision
The central decision is where to place capital across producing mines, brownfield expansions, development projects, recyclers and technologies that reduce copper intensity. Each route provides different exposure to price, execution, permitting, feedstock, technology and financing risk. A general copper shortage thesis cannot determine which route creates value.
The investor needs a common comparison framework. It should translate geology, metallurgy, infrastructure, operating capability, policy, customer need and capital structure into cash flows, milestones and downside cases. It should also show which risks are controllable and which remain external.
2. Why the grid changes the question
Grid expansion connects generation, storage, demand and resilience. Copper appears in conductors, transformers, substations, motors, cables, electronics and control equipment. The United States Department of Energy identifies copper and aluminium as material inputs across transmission and distribution networks [4].
Demand is therefore linked to the timing and design of electricity investment rather than a single technology. Delayed interconnection, changed voltage, network optimisation, local content and conductor substitution can shift the quantity, specification and location of metal required.
3. Current supply-demand evidence
The International Energy Agency's 2025 outlook projected total copper demand in its Stated Policies Scenario rising from 26.7 million tonnes in 2024 to 31.3 million tonnes in 2030 and 34.1 million tonnes in 2040 [1]. Its 2026 outlook continued to identify a projected 2035 supply deficit, while recording an improved project pipeline and a narrower gap than the prior edition [2].
These projections are scenarios based on policies, projects and assumptions. They establish a strategic planning problem. They do not establish a realised future shortage, a future price or the value of a particular company.
4. The copper investment system
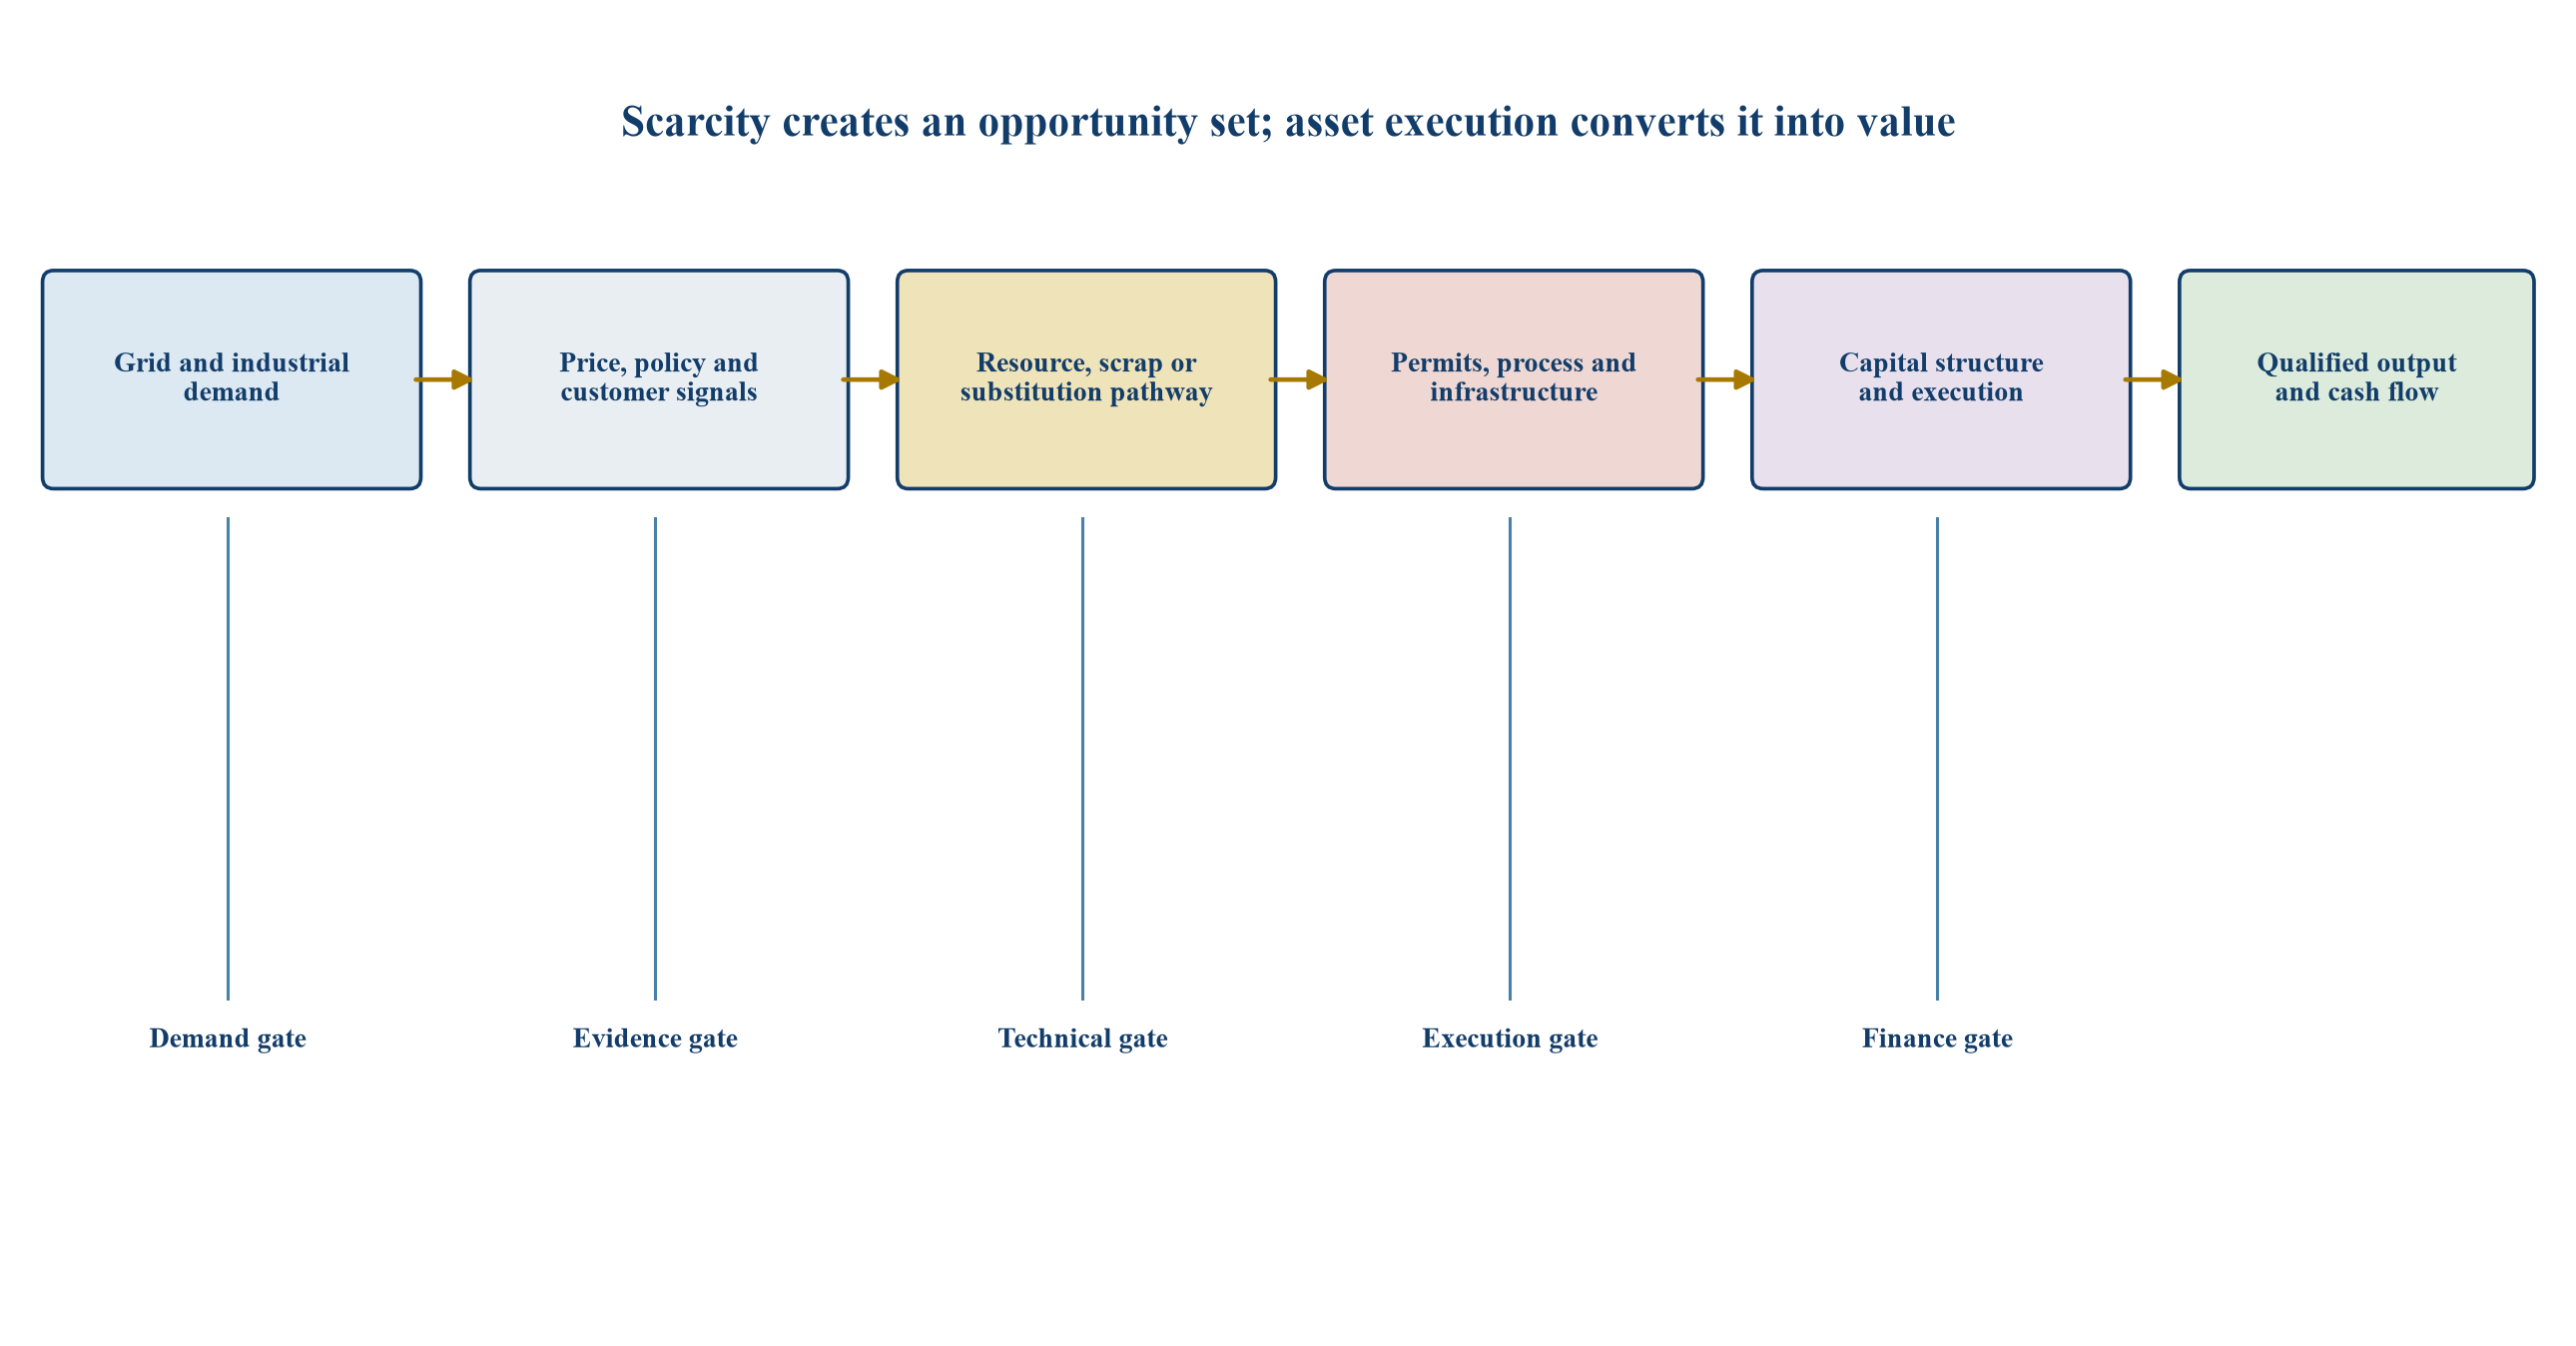
Generic framework; actual investment decisions require asset-specific technical, legal and financial evidence.
5. Segment the opportunity set
Producing mines offer current output and operating evidence. Brownfield expansions can use existing infrastructure but may encounter integration and ore-body constraints. Greenfield projects offer scale and optionality with greater permitting, construction and financing exposure. Recyclers depend on collection, sorting, processing yield and product qualification. Substitution technologies depend on engineering acceptance and application economics.
The segments should not be compared through headline resource tonnes or nameplate capacity alone. Each needs a pathway from input to saleable product and distributable cash.
6. Resources, reserves and inventories
The United States Geological Survey distinguishes resources from reserves and explains that reserves represent economically extractable material under current conditions [3]. A large resource can contain substantial geological potential while requiring further drilling, metallurgical work, engineering, permitting and economic demonstration.
Valuation should separate measured or indicated confidence, reserve conversion, inferred potential and exploration targets. The investor should avoid assigning reserve-like certainty to early-stage material. Reporting code, competent-person sign-off and effective date matter.
7. Grade is one economic variable
Ore grade affects material moved and processed for each unit of copper. It interacts with hardness, mineralogy, strip ratio, recovery, impurities, energy, water, labour and equipment. Declining grade can increase cost and environmental intensity, but a lower-grade body can still be competitive when scale, recovery and infrastructure are favourable.
A grade comparison should therefore normalise the full process route. Head grade without payable recovery and total site cost is an incomplete investment metric.
8. Metallurgical recovery
Recovery determines how much contained metal becomes a saleable product. Laboratory tests, variability programmes, pilot work and plant performance carry different evidential weight. Recovery may change by ore type, depth, blend, throughput and reagent regime.
The model should distinguish design recovery from demonstrated recovery. It should include ramp-up, variability and concentrate-quality constraints. A one-percentage-point recovery change can be material, but the effect must be calculated for the specific throughput and payable terms.
9. Product and payability
Copper can be sold through concentrate, cathode, blister, scrap grades or fabricated products. Revenue differs by copper content, treatment and refining charges, payable percentages, penalties, logistics and quotation periods. Impurities can restrict smelter access or reduce netback.
The investor should model the actual commercial product. Benchmark copper price multiplied by contained metal can overstate cash revenue when processing, penalties and transport are omitted.
10. Mine life and production profile
Mine life affects the duration over which fixed infrastructure and development capital can earn returns. The annual profile matters as much as total reserves. High early grades may support debt and payback while later declines affect terminal value.
The schedule should reconcile mining sequence, stockpiles, plant feed, recovery, maintenance and expansion. A smooth production curve needs supporting engineering and operating evidence.
11. Infrastructure dependency
Power, water, roads, rail, port, camp, communications and tailings facilities can determine viability. Shared infrastructure may reduce capital but create capacity, access and counterparty risk. Remote projects can require substantial enabling investment before revenue assets are built.
Each dependency should have an owner, permit, cost, schedule and contingency. A memorandum of understanding carries less certainty than a funded, permitted and enforceable service arrangement.
12. Power price and carbon exposure
Mining, crushing, grinding, pumping and refining consume energy. Power source, tariff, reliability, escalation and curtailment affect operating cost and emissions. Renewable supply can reduce exposure but may require firming, storage or grid upgrades.
The valuation should model energy as an operational system rather than a flat unit price. Connection timing, capacity charges, backup generation and fuel logistics can change both capital and production availability.
13. Water security
Water availability, rights, quality, competing users and climate variability influence project design. Desalination and long-distance pumping can create large capital and energy requirements. Recycling can reduce abstraction while increasing process complexity.
Water assumptions should link directly to throughput and recovery. Permitted volume does not by itself establish reliable supply. Community and ecological commitments may create operating constraints beyond legal allocation.
14. Tailings and closure
Tailings design, construction, monitoring, governance and emergency preparedness are central investment risks. Closure liabilities include physical stability, water treatment, rehabilitation, monitoring and social transition. These obligations can extend beyond production.
The financial model should include progressive rehabilitation, closure funding and post-closure cost. Technical diligence should test storage capacity against the production plan and future raises rather than treating tailings as a fixed background asset.
15. Jurisdiction and fiscal regime
Royalties, corporate tax, withholding, duties, state participation, export rules, foreign exchange and stabilisation provisions shape cash flow. Legal title, surface rights and community agreements influence continuity. Policy can change through general law, licence terms or negotiated arrangements.
The model should separate enacted terms from proposed policy. A high commodity-price case may trigger progressive royalties or political pressure. Fiscal stability should be valued through scenario analysis and enforceability, not broad country labels.
16. Permitting pathway
Permits often form a dependency chain covering exploration, environmental review, water, land, construction, power, tailings, explosives, heritage and operations. Schedule risk arises from studies, consultation, agency capacity, appeals and design changes.
A probability-weighted valuation should use observable milestones. Management target dates remain management estimates until supported by approvals and a credible critical path.
17. Community and Indigenous rights
Projects need durable relationships with affected communities and rights holders. Consultation, consent requirements, land access, livelihood effects, benefit sharing, local procurement and grievance mechanisms can affect timing and continuity. IFC Performance Standards provide a recognised framework for environmental and social risk management [8].
Investor diligence should assess implementation, staffing, commitments and unresolved grievances. A signed agreement is one milestone; operating legitimacy depends on continuing performance.
18. Responsible sourcing
Customers and financiers increasingly require traceability, human-rights diligence and supply-chain controls. OECD guidance sets out a risk-based due-diligence framework for mineral supply chains [9]. Requirements vary by market, product and counterparty.
Responsible-sourcing capability can protect market access and financing. It also creates cost, audit and data obligations. Claims should be supported by scope, standard, assurance and period.
19. Capital-cost architecture
Project capital should be decomposed into mine development, plant, infrastructure, owner costs, indirects, contingency, working capital, financing and escalation. Foreign and local currency exposure should be visible. Contingency should reflect maturity and risk rather than a round percentage.
The investor should reconcile engineering estimates with contracting strategy and market capacity. A technically defined scope can still exceed budget when labour, equipment, logistics or interface assumptions are weak.
20. Operating-cost architecture
Operating costs include mining, processing, maintenance, energy, water, labour, consumables, logistics, treatment charges, royalties and site administration. By-product credits should be modelled transparently because they can make reported net costs volatile.
Unit cost should be tested against production and grade. Lower output can increase unit cost even when total spending falls. Inflation and exchange-rate sensitivity should reflect where each cost is incurred.
21. Cost curve discipline
Industry cost curves can show relative exposure at a point in time. Their usefulness depends on consistent definitions, by-product treatment, exchange rates and source quality. They do not capture capital required to sustain production, reserve life or future ore changes.
Asset valuation should use site cash flow first. Cost-curve position is a supporting benchmark and a downside indicator.
22. Price deck
A price deck should distinguish spot, forward, consensus, incentive-price and stress cases. The base case should support the investment decision without relying on an extreme scarcity price. Long-dated assumptions deserve explicit reasoning because they often drive terminal value.
The investor should identify the price required for construction, debt service, payback and minimum return. This creates a break-even map rather than one valuation point.
23. Exchange rates and inflation
Copper may be priced in United States dollars while costs occur in local and global currencies. Currency can partly offset commodity movements, but correlations change. Imported equipment, contractor claims and local wages respond differently to inflation and exchange rates.
The model should apply currency and inflation by cost category. A single real-dollar assumption can conceal mismatches between revenue, operating cost and capital.
24. Discount rate and country risk
Discount rate should reflect currency, project stage, operating leverage, jurisdiction, financing and diversification. Adding broad premiums without adjusting cash-flow scenarios can double count risk. Leaving all uncertainty in the discount rate can hide specific failure modes.
A clearer method models major schedule, cost, production and fiscal risks in cash flow, then applies a rate consistent with residual risk. The investment committee should see both assumptions.
25. Valuation bridge
Table 1. Asset-specific copper valuation bridge
| Value layer | Core evidence | Principal adjustment | Decision question |
|---|---|---|---|
| In-situ material | Reporting code, drilling, geology | Confidence and recoverability | What material can support economic analysis? |
| Saleable production | Mine plan, metallurgy, schedule | Recovery, ramp-up and payability | What can be sold, when and at what quality? |
| Operating cash flow | Contracts, cost model, fiscal terms | Price, cost, currency and tax | What cash remains before growth and finance? |
| Free cash flow | Capital plan, closure and working capital | Overrun, sustaining capital and timing | What cash can service capital providers? |
| Equity value | Debt, streams, royalties and dilution | Priority claims and future funding | What portion belongs to current equity? |
| Strategic option | Expansion, exploration and infrastructure | Probability, capital and time | Which optionality merits present value? |
The bridge prevents contained copper from being treated as equity value. Every layer requires evidence and introduces deductions, timing or probability.
26. Producing-mine valuation
Producing mines provide operating data, customer history and current cash flow. Diligence should reconcile reserve depletion, sustaining capital, grade trend, maintenance backlog, recovery, contract terms, workforce and closure. Recent performance needs normalisation for outages, temporary grades and one-off costs.
The model should include the investment required to preserve output. EBITDA without sustaining capital and reserve replacement can overstate distributable value.
27. Brownfield expansion valuation
Brownfield projects can share infrastructure, permits, people and knowledge. They also create interfaces with live operations and may rely on existing systems near capacity. Shutdowns, tie-ins, ore blending and commissioning can affect current cash flow.
Valuation should separate base operation, expansion and interaction effects. The expansion should carry its own capital, schedule, ramp-up and incremental cash-flow case.
28. Greenfield development valuation
Greenfield valuation should be milestone based. Resource definition, feasibility, environmental approval, land, infrastructure, offtake, financing, construction and commissioning each reduce uncertainty. A single probability applied to a final net present value can conceal where value is created or lost.
Stage-gated valuation shows the capital needed to reach each decision and the conditions for further funding. It supports partnerships and staged acquisitions.
29. Exploration valuation
Exploration creates options rather than current production cash flow. Value depends on geological evidence, target scale, access, drilling cost, success probability, future development pathway and capital availability. Comparable transaction metrics need adjustment for stage and market conditions.
The investor should cap exposure by programme and decision gate. Success should trigger a new technical and commercial assessment rather than automatic development commitment.
30. Recycling investment thesis
Recycling can reduce primary supply requirements and shorten some development lead times. The IEA includes secondary supply and reuse explicitly in its copper outlook [1]. Economics depend on scrap availability, collection, sorting, contamination, yield, energy, product quality and customer qualification.
Installed recycling capacity does not establish utilisation or margin. Feedstock competition and working capital can become the binding constraint.
31. Scrap categories
New scrap arises during manufacturing and can be relatively clean and traceable. Old scrap comes from end-of-life equipment, buildings, vehicles and networks and can require collection, dismantling and sorting. Complex products contain mixed materials and hazardous components.
The plant should be matched to its feed. High-grade scrap and low-grade residues require different technology, environmental controls and commercial terms.
32. Feedstock security
Feedstock contracts should define grade, volume, pricing, contamination, title and delivery. Municipal systems, demolition networks, manufacturers and traders have different incentives. Export restrictions or local-content policy can change access.
The model should test utilisation against contracted and addressable feedstock, with double counting removed. Regional scrap estimates are not equivalent to available plant feed.
33. Recycling yield and quality
Mass balance should reconcile input, saleable copper, by-products, residues and loss. Yield varies with feed mix and process. Product must meet customer specifications; a nominal copper percentage may not establish acceptance.
Valuation should incorporate qualification time, discounts, reject risk and residue treatment. Environmental liabilities can arise from storage and disposal.
34. Substitution thesis
Aluminium and other design choices can reduce copper use in selected conductors and equipment. The Department of Energy notes application differences between copper and aluminium in grid systems [4]. Substitution depends on conductivity, weight, space, thermal performance, joining, reliability, standards and installed-system cost.
A copper-price signal alone does not cause immediate substitution. Engineering redesign, certification, manufacturing equipment and customer acceptance create thresholds and delays.
35. Demand destruction and efficiency
Higher prices can encourage material efficiency, smaller components, network optimisation and delayed consumption. Digital monitoring, advanced conductors and topology changes can alter copper intensity while enabling greater power transfer.
The investor should model demand elasticity by application. Some uses have ready alternatives; others value compactness, durability or conductivity enough to retain copper.
36. Market concentration
The IEA reports increasing concentration among major copper mining countries and sustained concentration in refining [1]. Concentration can create disruption risk and policy support for diversification. It can also produce scale advantages and established infrastructure in leading regions.
Diversification value should be linked to customer need, qualification, cost and finance. Location alone does not make an uneconomic project strategic.
37. Smelting and refining bottlenecks
Mine supply and refined supply are related but distinct. Concentrate quality, smelter capacity, treatment charges, energy, acid markets and environmental controls affect conversion. The IEA's 2026 analysis highlighted strategic pressure on smelters despite strong copper demand [2].
An integrated project may capture more value and more risk. A concentrate producer needs realistic access and terms across the expected product mix.
38. Policy support
Governments may use grants, loans, guarantees, tax credits, strategic-project designation, offtake or state equity. The European Union classifies copper as a strategic raw material and sets benchmarks across extraction, processing and recycling [5].
Support should be modelled only when eligibility, amount, timing and conditions are evidenced. Political priority may improve access while adding reporting, domestic-processing or delivery obligations.
39. Offtake structure
Offtake can support market access and financing. Terms may include volume, quality, pricing, prepayment, security, exclusivity, duration and termination. A strategic buyer can provide technical collaboration or restrict future flexibility.
The investor should calculate the value transferred through discounts, options and control rights. Headline funding can be expensive when embedded commercial terms are ignored.
40. Streaming and royalties
Streams exchange upfront capital for a share of future production at defined payments. Royalties create revenue claims linked to production or value. They can reduce near-term equity requirements while burdening future cash flow and expansion.
Valuation should model these claims before equity. Change-of-control, buyback, area-of-interest and security provisions can affect transaction flexibility.
41. Project debt
Project debt depends on reserve life, completion risk, price assumptions, cost position, contracts, jurisdiction and sponsor support. Lenders may require hedging, reserve accounts, completion guarantees and distribution tests. Tenor should fit the production and debt-service profile.
The debt case should use lender assumptions rather than the equity upside case. Funding certainty needs documented commitments and conditions precedent.
42. Corporate debt
Corporate facilities can diversify risk across assets and simplify funding. They can also expose healthy operations to development problems and covenant pressure. Acquisition debt may rely on synergies or price conditions that are not controllable.
The investor should map recourse, collateral, covenants, maturities and refinancing needs. Liquidity during construction and ramp-up is as important as opening leverage.
43. Equity funding
Equity absorbs development and commodity risk but can create substantial dilution. Rights issues, placements, strategic stakes, joint ventures and earn-ins allocate control and future capital differently. A lower nominal valuation can accompany better funding certainty or capability.
The model should include all expected funding rounds and option exercises. Current share count alone can overstate value per share.
44. Joint ventures
Joint ventures can combine resource ownership, operating skill, infrastructure, customer access and capital. Governance should cover budgets, programmes, dilution, default, deadlock, transfer, marketing and expansion. Minority protection can reduce abuse while delaying decisions.
The investor should value the actual economic and governance interest. Proportionate resource ownership does not guarantee proportionate cash distributions or control.
45. Acquisition diligence
An acquisition should reconcile technical reports, operating data, licences, environmental commitments, contracts, tax, litigation, people, cyber, community obligations and finance. Site evidence should reconcile with the model and data room.
Red flags need price, structure, condition precedent, indemnity, remediation or walk-away treatment. Warranty protection does not replace diligence where loss is difficult to recover.
46. Transaction structures
Structures include share purchase, asset purchase, farm-in, royalty, stream, joint venture, earn-out and staged option. The choice affects tax, liabilities, approvals, funding and control. Deferred consideration can align milestones while creating future disputes.
Structure should follow the identified risk. A seller retaining a contingent interest can signal confidence, but the payment definition still needs auditable measures.
47. Comparable transactions
Comparable multiples can provide market evidence when stage, jurisdiction, resource quality, infrastructure, date and transaction rights are aligned. Metrics based on resources, reserves, production or cash flow answer different questions.
The analysis should disclose selection and adjustments. A broad median applied to a unique early-stage asset can produce false precision.
48. Scenario matrix
Table 2. Hypothetical copper-asset scenario matrix
| Case | Copper-price index | Construction cost | Ramp-up | Recovery | Illustrative interpretation |
|---|---|---|---|---|---|
| Resilient downside | 80 | 125 | 24 months late | 3 points below design | Tests liquidity, covenant headroom and sponsor support |
| Execution downside | 100 | 130 | 18 months late | 2 points below design | Isolates project delivery and operating risk |
| Controlled base | 100 | 100 | Plan | Design less normal ramp-up | Supports the central investment decision |
| Market upside | 125 | 105 | 6 months late | Design | Tests value capture without perfect execution |
The index values are hypothetical and do not forecast copper prices or project outcomes. The matrix should be recalculated using asset-specific evidence.
49. Sensitivity map
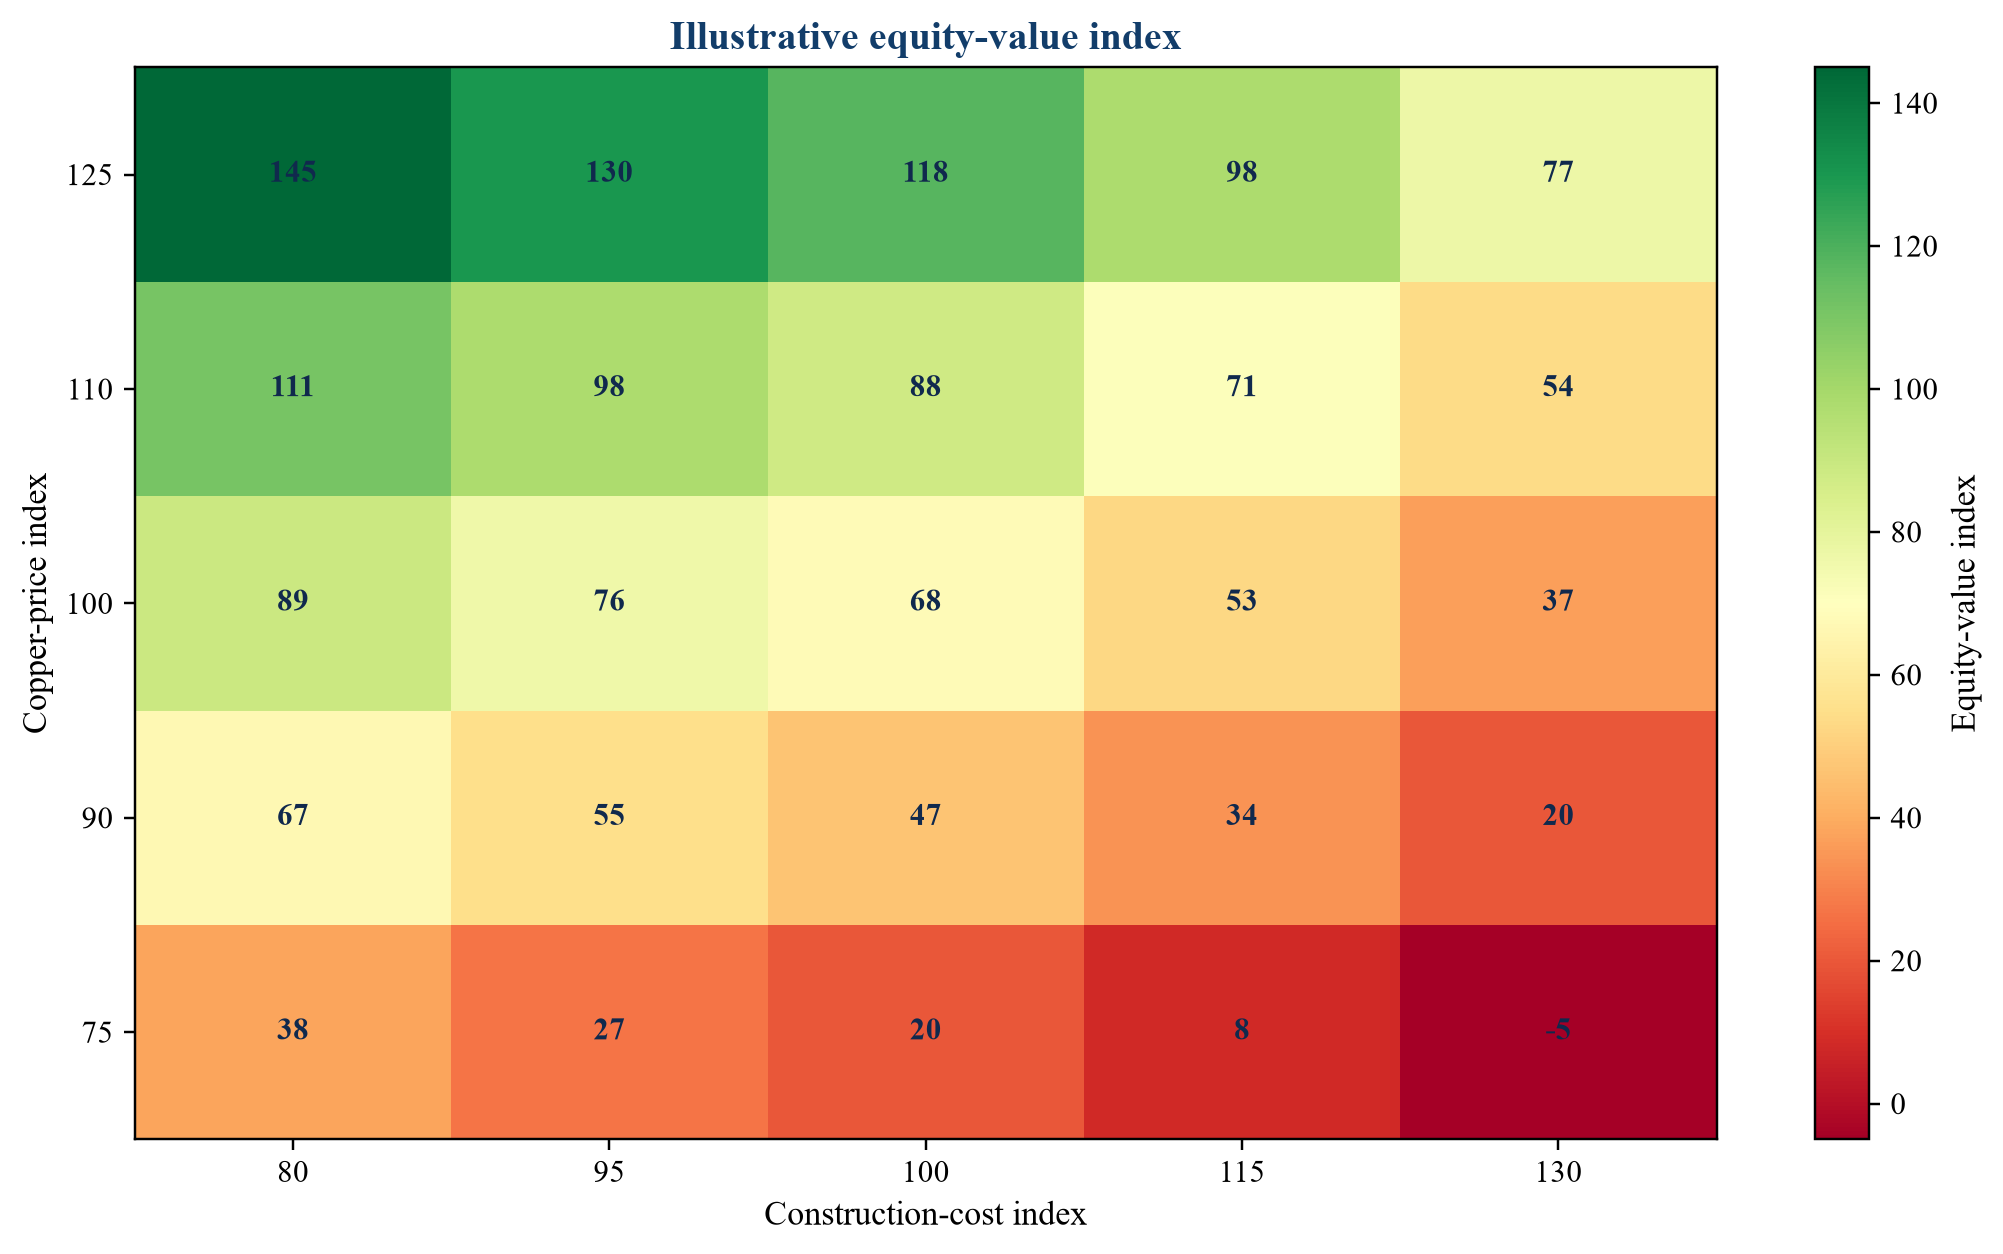
Indexed illustration only; values are not a forecast or valuation of any asset.
50. Break-even analysis
The model should calculate break-even price for operating cash, sustaining capital, debt service, full investment return and expansion. These thresholds differ. A mine can remain cash positive while destroying development capital or breaching debt terms.
Break-even should be shown across grade, recovery, exchange rate and cost. This identifies where management action can protect value and where the project remains exposed to market price.
51. Financing headroom
Funding should cover base capital, contingency, interest, working capital, ramp-up and required reserves. The sponsor should identify who funds overruns and under what terms. An unfunded contingency is a risk statement rather than a source of cash.
Liquidity should be tested monthly through construction and ramp-up. Annual models can hide temporary shortfalls that trigger default or dilution.
52. Hedging
Hedging can protect debt service and construction completion. It can also limit upside and create margin or delivery obligations. Volume should reflect reliable production, and tenor should fit the risk period.
The investment committee should see hedge counterparties, security, accounting and break costs. A hedge is part of the capital structure rather than proof that the project is economic.
53. Contracting strategy
Engineering, procurement and construction arrangements allocate design, interface, cost and schedule risk differently. Lump-sum labels can include exclusions, escalation and owner dependencies. Equipment lead times and contractor capacity matter.
The owner team should retain sufficient technical and commercial capability. Risk transfer is credible only when scope is defined, counterparties can perform and remedies are recoverable.
54. Commissioning and ramp-up
Commissioning moves individual systems into integrated operation. Ramp-up depends on ore availability, operator readiness, process stability, maintenance, supply chain and product acceptance. Early cash-flow forecasts should reflect these dependencies.
Completion tests for debt and contractor payment should align with sustainable performance. Short demonstration periods can certify temporary output without proving stable recovery or cost.
55. Operating model
Owner-operated, contractor-operated and hybrid models allocate people, equipment and risk differently. Contractor rates may reduce upfront capital while adding escalation, productivity and counterparty exposure. Core technical knowledge should remain accessible to the asset owner.
The model should reconcile workforce, maintenance and procurement with the production plan. Operating readiness needs named roles, systems, spares and procedures.
56. Digital and AI applications
Machine learning can support exploration targeting, ore sorting, predictive maintenance, recovery optimisation, energy management and supply-chain visibility. Value depends on data quality, integration, operating adoption and validated performance. Venture investment increasingly targets such applications, according to the IEA's 2026 outlook [2].
The business case should identify the controlled decision changed by the system. Vendor claims and pilot accuracy do not establish site-level cash value.
57. Data governance
Technical and commercial decisions use geological, assay, survey, plant, maintenance, environmental and market data. Ownership, lineage, access, calibration, cybersecurity and retention should be defined. Model changes need version control and approval.
Acquisition diligence should test whether reported performance can be reproduced from source data. Missing or altered data can affect reserves, payment and regulatory reporting.
58. Portfolio construction
Investors can diversify across geography, stage, cost position, product and capital structure. Correlations may rise during macroeconomic stress, and multiple assets can share the same price or policy exposure. Diversification should be measured at the cash-flow driver level.
A portfolio can combine producing cash flow with development optionality and recycling exposure. Capital calls and liquidity should be aggregated under common downside scenarios.
59. Strategic buyer perspective
Utilities, cable manufacturers, equipment producers and technology companies may value security, specification and location alongside financial return. Strategic value can support offtake, prepayment, joint investment or acquisition.
The buyer should quantify the avoided disruption or qualification benefit. Paying for strategic value without governance or supply rights can transfer value to the seller.
60. Public-sector perspective
Governments may pursue supply security, jobs, processing, infrastructure and regional development. Public support should have measurable additionality, risk limits and public benefits. The IEA records increased public-finance commitments for critical minerals while cautioning that disbursement determines impact [2].
Support terms should preserve accountability and avoid hiding project weakness. Independent technical and financial review remains necessary.
61. Investment-committee scorecard
Table 3. Copper investment-committee scorecard
| Dimension | Evidence required | Failure signal | Possible response |
|---|---|---|---|
| Resource and metallurgy | Current compliant report, variability tests, mine plan | Confidence or recovery exceeds evidence | Stage funding; further drilling or pilot work |
| Infrastructure and permits | Executable rights, approvals and critical path | Unfunded enabling works or unresolved dependency | Condition precedent; partner or redesign |
| Capital and operations | Estimate basis, contracts, readiness and contingency | Scope gaps, weak owner team or unsupported ramp-up | Rebase budget and schedule |
| Market and product | Specification, qualification, logistics and terms | Contained metal used as revenue | Model payable netback and customer pathway |
| ESG and stakeholders | Commitments, systems, grievances and closure plan | Material unresolved rights or liability | Remediate, structure protection or decline |
| Financing | Sources, conditions, headroom and overrun support | Funding gap or fragile covenant case | Resize, stage or add risk capital |
| Valuation | Asset cash flow, scenarios and claims waterfall | Scarcity narrative substitutes for economics | Reprice or reject |
62. Stage gates
The first gate confirms strategic fit and evidence access. The second establishes technical concept, resource confidence and fatal flaws. The third tests feasibility, permits, commercial route and finance. The fourth authorises construction against funded scope. The fifth releases completion support after sustained tests.
Each gate should specify evidence, decision rights and maximum capital at risk. Momentum is not evidence for proceeding.
63. Implementation roadmap
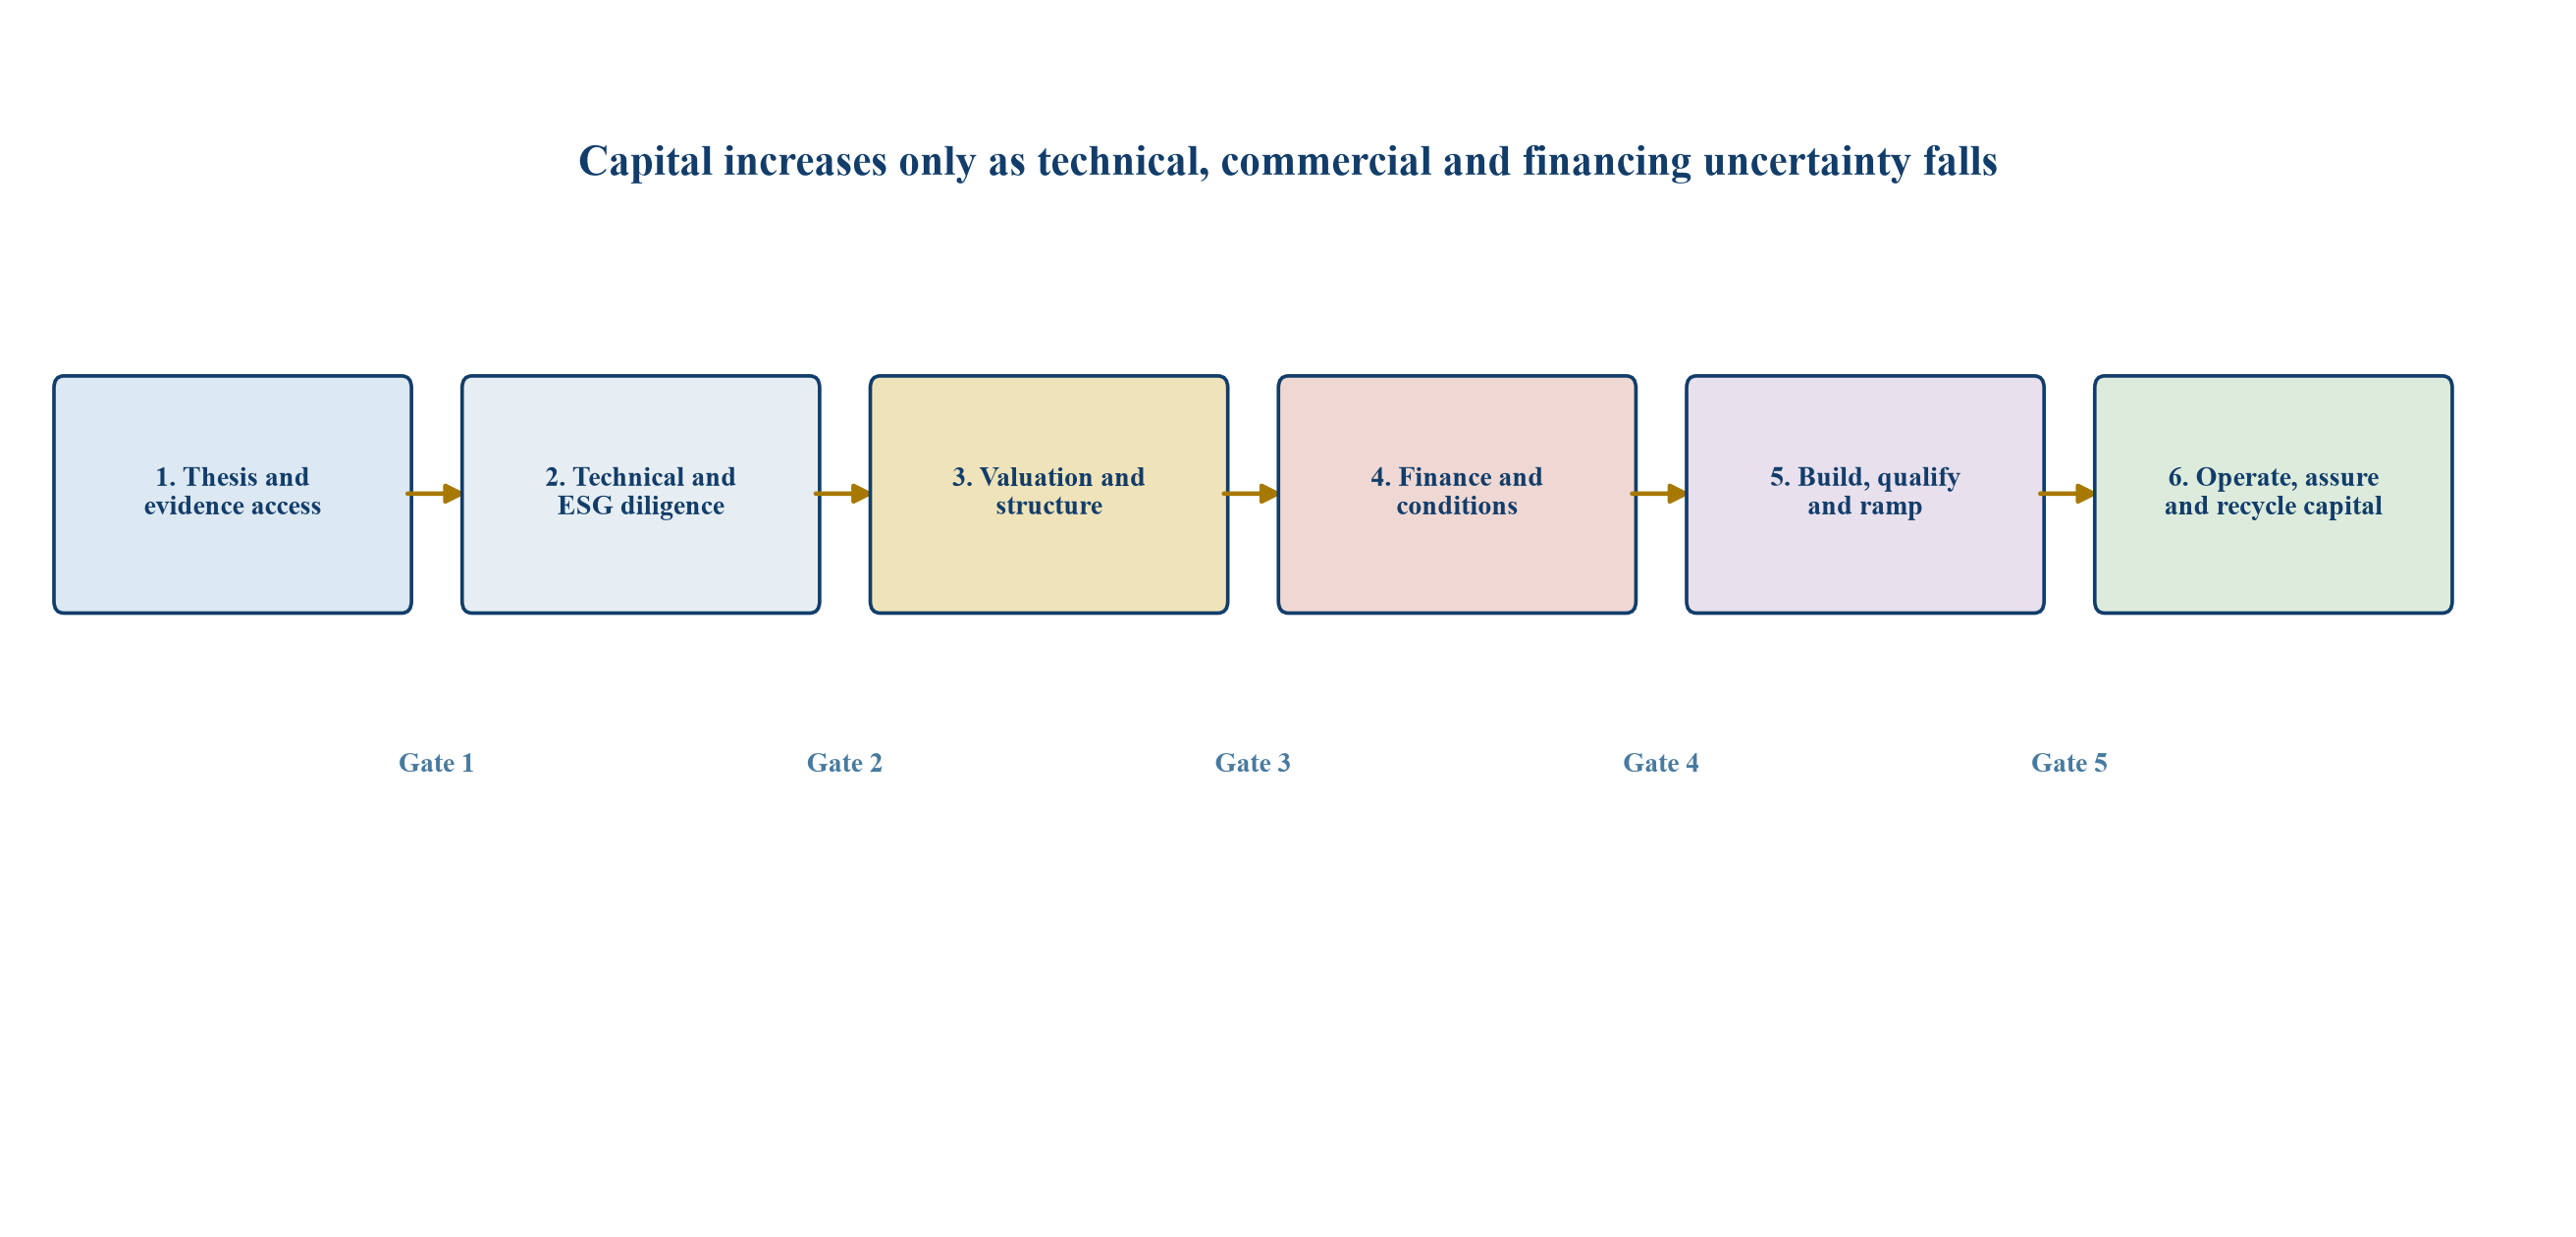
Generic sequence; actual approvals, permits and financing differ by jurisdiction and asset.
64. First 100 days after acquisition
The buyer should secure operational control, people, licences, data, cash, procurement and stakeholder continuity. It should validate the mine plan, maintenance backlog, stockpiles, recovery, contracts, closure provision and liquidity. Material assumptions in the acquisition model need accountable owners.
Immediate value creation should focus on controllable reliability and recovery before aggressive expansion. Any revised public guidance should follow verified evidence and applicable disclosure rules.
65. Benefits register
Benefits can include recovery improvement, throughput, availability, energy efficiency, procurement, working capital, by-products, exploration and financing. Each item should have a baseline, action, cost, owner, timing, risk and cash-flow effect.
Commodity-price movement should remain separate from operational value creation. This allows investors to assess management delivery.
66. Monitoring dashboard
The board should monitor safety, production, grade, recovery, availability, cost, capital, schedule, permits, water, energy, tailings, community commitments, liquidity, covenants and product quality. Leading indicators should sit beside financial outcomes.
Dashboard definitions need controlled sources and reconciliation. A favourable monthly result should not override a worsening reserve, closure or stakeholder position.
67. Trigger framework
Triggers can cover capital overrun, schedule delay, recovery shortfall, permit slippage, covenant headroom, contractor default, environmental incident and community disruption. Each trigger should identify escalation, funding and decision rights.
Early triggers preserve options. Waiting for insolvency or licence loss can eliminate restructuring value.
68. Exit pathways
Exit can occur through strategic sale, public market, royalty or stream monetisation, joint-venture sell-down, dividend recapitalisation or closure. The path depends on stage, market, evidence and buyer universe. A development asset may create more value after a permit or feasibility milestone.
The investment case should identify likely buyers and required diligence evidence. Exit multiples should remain scenarios rather than guaranteed outcomes.
69. What scarcity does and does not prove
Scarcity can support price, customer urgency, policy attention and strategic finance. It can also stimulate new supply, recycling, substitution, efficiency and demand delay. The IEA's changing projected deficit between annual outlooks illustrates how project and policy information can alter the balance [1][2].
The investor should update the thesis as evidence changes. A strong market cannot cure defective title, poor metallurgy, unfinanceable capital or loss of operating legitimacy.
70. Board decision record
The approval should record resource confidence, production pathway, permits, infrastructure, ESG obligations, price deck, capital, operating cost, financing, liquidity, scenarios, valuation, conditions and exit. Unresolved matters need owners and deadlines.
The record should distinguish observed data, third-party scenarios and management estimates. This supports later review and protects decision quality.
71. Reserve replacement and depletion
A producing mine consumes its economic inventory as it generates cash. Reserve replacement can come from drilling, conversion of resources, satellite deposits, acquisition or improved economics. Each route requires capital and evidence. Reported reserve growth should be reconciled with production depletion, price assumptions, cut-off grade and technical changes.
The valuation should distinguish cash harvested from a finite plan from cash reinvested to extend it. Exploration spending does not automatically replace reserves. A mature asset with strong current margins can still decline quickly when development access, stripping or drilling has been deferred.
72. Working capital and inventory
Concentrate, cathode, scrap and consumables create working-capital requirements. Shipment schedules, provisional pricing, assay settlement, customer credit, port delays and quotation periods can create cash volatility. Recyclers may pay for feed before product is processed and collected.
The model should connect physical inventory and receivables to production and price. Higher copper prices can increase revenue while also increasing feedstock funding, provisional adjustments and collateral needs. Working-capital facilities need sufficient tenor, borrowing base rules and liquidity headroom.
73. Treatment-charge and refining-charge exposure
Concentrate producers receive a netback after treatment, refining, penalties and other commercial deductions. Terms can respond to concentrate availability, smelter capacity and product quality. Benchmark movements may affect mines and smelters differently.
The investment case should show contracted, benchmark-linked and spot exposure. It should test whether deleterious elements restrict the buyer universe or create escalating penalties. Vertical integration can change this exposure while introducing smelter capital, energy, environmental and operating risk.
74. Technology readiness and scale-up
New extraction, leaching, sorting and recovery technologies may improve economics or unlock complex material. Evidence should progress from laboratory result to representative pilot, demonstration and sustained commercial operation. Feed variability, reagent supply, residue, maintenance and control requirements need testing.
Valuation should separate proven plant economics from future technology upside. Licensing rights, performance guarantees, intellectual-property access and vendor financial capacity can determine whether the technology remains available through construction and operation.
75. Climate resilience
Flood, drought, heat, wildfire and extreme weather can affect water, power, access, tailings, workforce and logistics. Historical averages may not represent the operating period of a long-life asset. Adaptation can require drainage, storage, redundant supply, revised design criteria and emergency capacity.
The investor should connect physical hazards to downtime, capital and insurance. A qualitative climate statement is insufficient when a single infrastructure corridor or water source can interrupt production.
76. Insurance and risk transfer
Insurance can cover selected property, construction, liability, cargo and interruption risks subject to exclusions, limits, deductibles and claims conditions. Availability and cost may change after incidents or as hazard assessment evolves. Political-risk and credit instruments can support specific financing structures.
The diligence team should map insured values, probable maximum loss, waiting periods and uninsured obligations. Insurance does not replace maintenance, contingency or liquidity; recoveries can be delayed and disputed.
77. Conclusion
Copper is central to expanding electricity systems, and current authoritative outlooks identify material long-term supply challenges. The investable conclusion remains asset specific. Mines, recyclers and substitution technologies convert the market signal into different cash-flow, execution and financing profiles.
The strongest investment combines defensible technical evidence, reliable infrastructure, credible permits, responsible operating practice, capital discipline, financeable contracts and downside endurance. Scarcity belongs in the scenario set; it should not replace due diligence or cash-flow valuation.
A stage-gated framework lets investors increase capital only as uncertainty falls. It also creates clear conditions for repricing, restructuring, partnership or withdrawal when the evidence changes.
References
- International Energy Agency. Copper: Global Critical Minerals Outlook 2025. 2025. https://www.iea.org/reports/copper-2
- International Energy Agency. Global Critical Minerals Outlook 2026: Executive Summary and Market Overview. 2026. https://www.iea.org/reports/global-critical-minerals-outlook-2026/executive-summary
- United States Geological Survey. Mineral Commodity Summaries 2026: Copper. 2026. https://pubs.usgs.gov/periodicals/mcs2026/mcs2026-copper.pdf
- United States Department of Energy. Critical Materials Assessment 2023. 2023. https://www.energy.gov/sites/default/files/2023-07/doe-critical-material-assessment_07312023.pdf
- European Commission Joint Research Centre. Raw Materials Information System: Critical and Strategic Materials. https://rmis.jrc.ec.europa.eu/critical-and-strategic-materials
- European Commission. Strategic Projects under the Critical Raw Materials Act: Copper. 2025. https://single-market-economy.ec.europa.eu/document/download/bed8602a-b289-47bc-a471-b7c487bc6e44_en?filename=RMSP_Copper_Factsheet_V2.pdf
- International Energy Agency. The Role of Critical Minerals in Clean Energy Transitions: Mineral Requirements for Clean Energy Transitions. 2021. https://www.iea.org/reports/the-role-of-critical-minerals-in-clean-energy-transitions/mineral-requirements-for-clean-energy-transitions
- International Finance Corporation. Performance Standards on Environmental and Social Sustainability. 2012. https://www.ifc.org/en/insights-reports/2012/ifc-performance-standards
- OECD. OECD Due Diligence Guidance for Responsible Supply Chains of Minerals from Conflict-Affected and High-Risk Areas. Third Edition. 2016. https://www.oecd.org/corporate/mne/mining.htm
- International Energy Agency. Copper prices have hit record highs, but smelters face mounting strategic pressures. 2026. https://www.iea.org/commentaries/copper-prices-have-hit-record-highs-but-smelters-face-mounting-strategic-pressures
About the Author
Chennakeshav (CK) is a corporate finance and investment banking executive with 25+ years of global experience in deal origination, structuring and execution across M&A, growth capital and corporate strategy. He has led value-creation mandates for founders, corporates and funds — bridging the boardroom view to hands-on execution and close.
His career spans Morgan Stanley, HSBC, Lloyds Banking Group, EWEC, ADQ portfolio companies and Emirates Growth Fund, across TMT, real estate, fintech, deeptech, cleantech, infrastructure and energy. He has partnered with C-suite leaders, private equity and venture funds, sovereign wealth funds and family offices to finance complex fund raises and scale-up ventures, and has led M&A due diligence, post-merger integration and business-transformation initiatives to create value.
At Matchpoint Partners he is Managing Partner, leading the firm's corporate finance, M&A and capital-raising practice. He holds an MBA from London Business School, an engineering degree from VTU and a Master of Laws (LLM, in progress) from UCL London.
An active start-up mentor, CK mentors at Techstars, DIFC FinTech Hive, Startup Grind, Founder Institute and IN5, serves as Entrepreneur Mentor in Residence (EMiR) at London Business School, and judges the Entrepreneurship World Cup.
LinkedIn: https://www.linkedin.com/in/ckadya/
Profile: https://www.matchpoint-partners.com/team/ck-adya.html
