
1. The investment decision
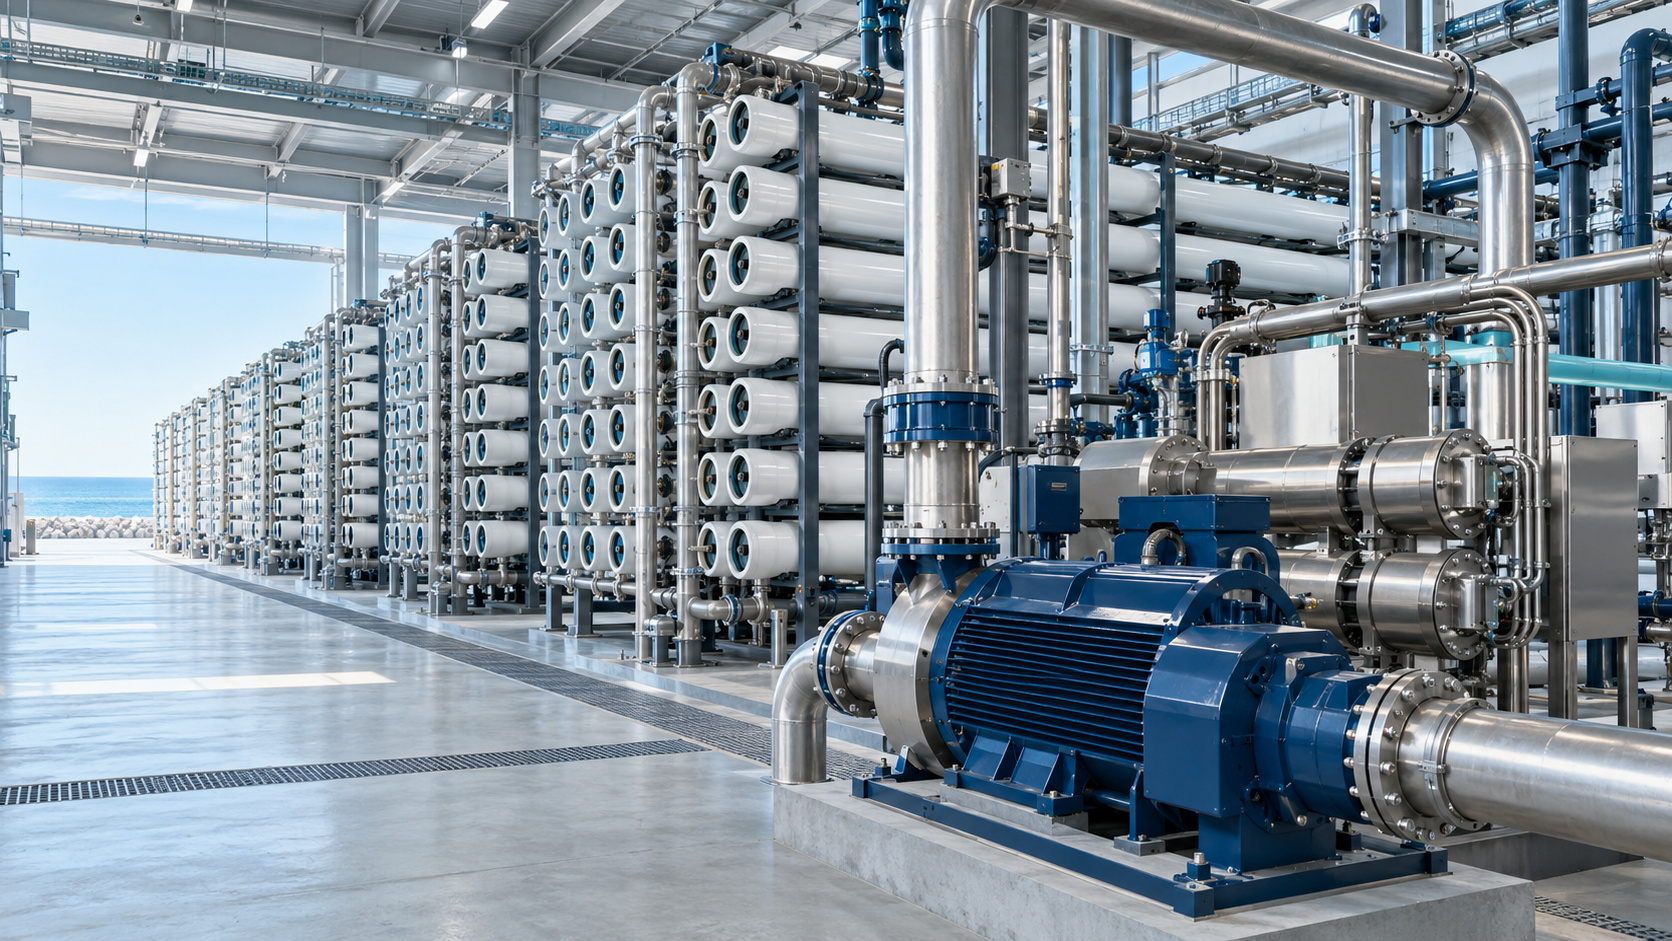
An operating desalination plant can consume more electricity, produce less water or require more cleaning than its original model assumed. The owner then faces a capital decision: repair the existing system, replace membranes, re-rate pumps, add variable-speed drives, upgrade energy recovery, improve pretreatment or combine several measures.
The decision should be expressed as an incremental investment case. The owner needs to know the present condition, the counterfactual without intervention, the expected post-upgrade operating envelope, the outage required, the warranty structure and the cash value of energy, capacity and reliability. Procurement begins after these elements are defined.
2. Why equipment efficiency is a system question
Reverse osmosis converts hydraulic pressure into permeate through a membrane. Intake, pretreatment, high-pressure pumps, motors, drives, membranes, pressure vessels, energy-recovery devices, post-treatment and discharge all influence the measured result. An efficient component can perform poorly inside a mismatched system.
The assessment should therefore follow power from the electrical meter to the delivery meter. Pump efficiency, motor efficiency, pressure losses, membrane permeability, recovery, energy transfer, product quality and plant availability interact. The financial model should value net compliant water and net electricity at the agreed boundary.
3. The evidence problem
Historical plant data often reflect changing water demand, feed salinity, temperature, membrane age, cleaning cycles, train availability and operator settings. A before-and-after average can misattribute weather, duty or maintenance effects to the retrofit.
A bankable case needs time-stamped measurements, calibrated instruments and a normalisation protocol. The baseline should identify which variables are observed, which are corrected and which remain commercial risks. The owner should preserve raw data and rejected operating periods so the result can be independently reproduced.
4. Reverse-osmosis energy use
The United States Department of Energy explains that RO uses high-energy pumps to pressurise feedwater across a membrane [1]. Its seawater-desalination bandwidth study used a representative state-of-the-art RO desalination-unit intensity of 2.70 kWh per cubic metre under defined salinity, recovery and product-quality assumptions [2].
That value is a reference point rather than a plant guarantee. Total delivered-water energy includes intake, pretreatment, boosting, post-treatment, storage and distribution within the chosen boundary. Salinity, temperature, recovery and pressure losses can move the result materially.
5. Upgrade points in the hydraulic system
The system map shows where an upgrade changes pressure, flow or loss. It also identifies the meters needed to verify performance.
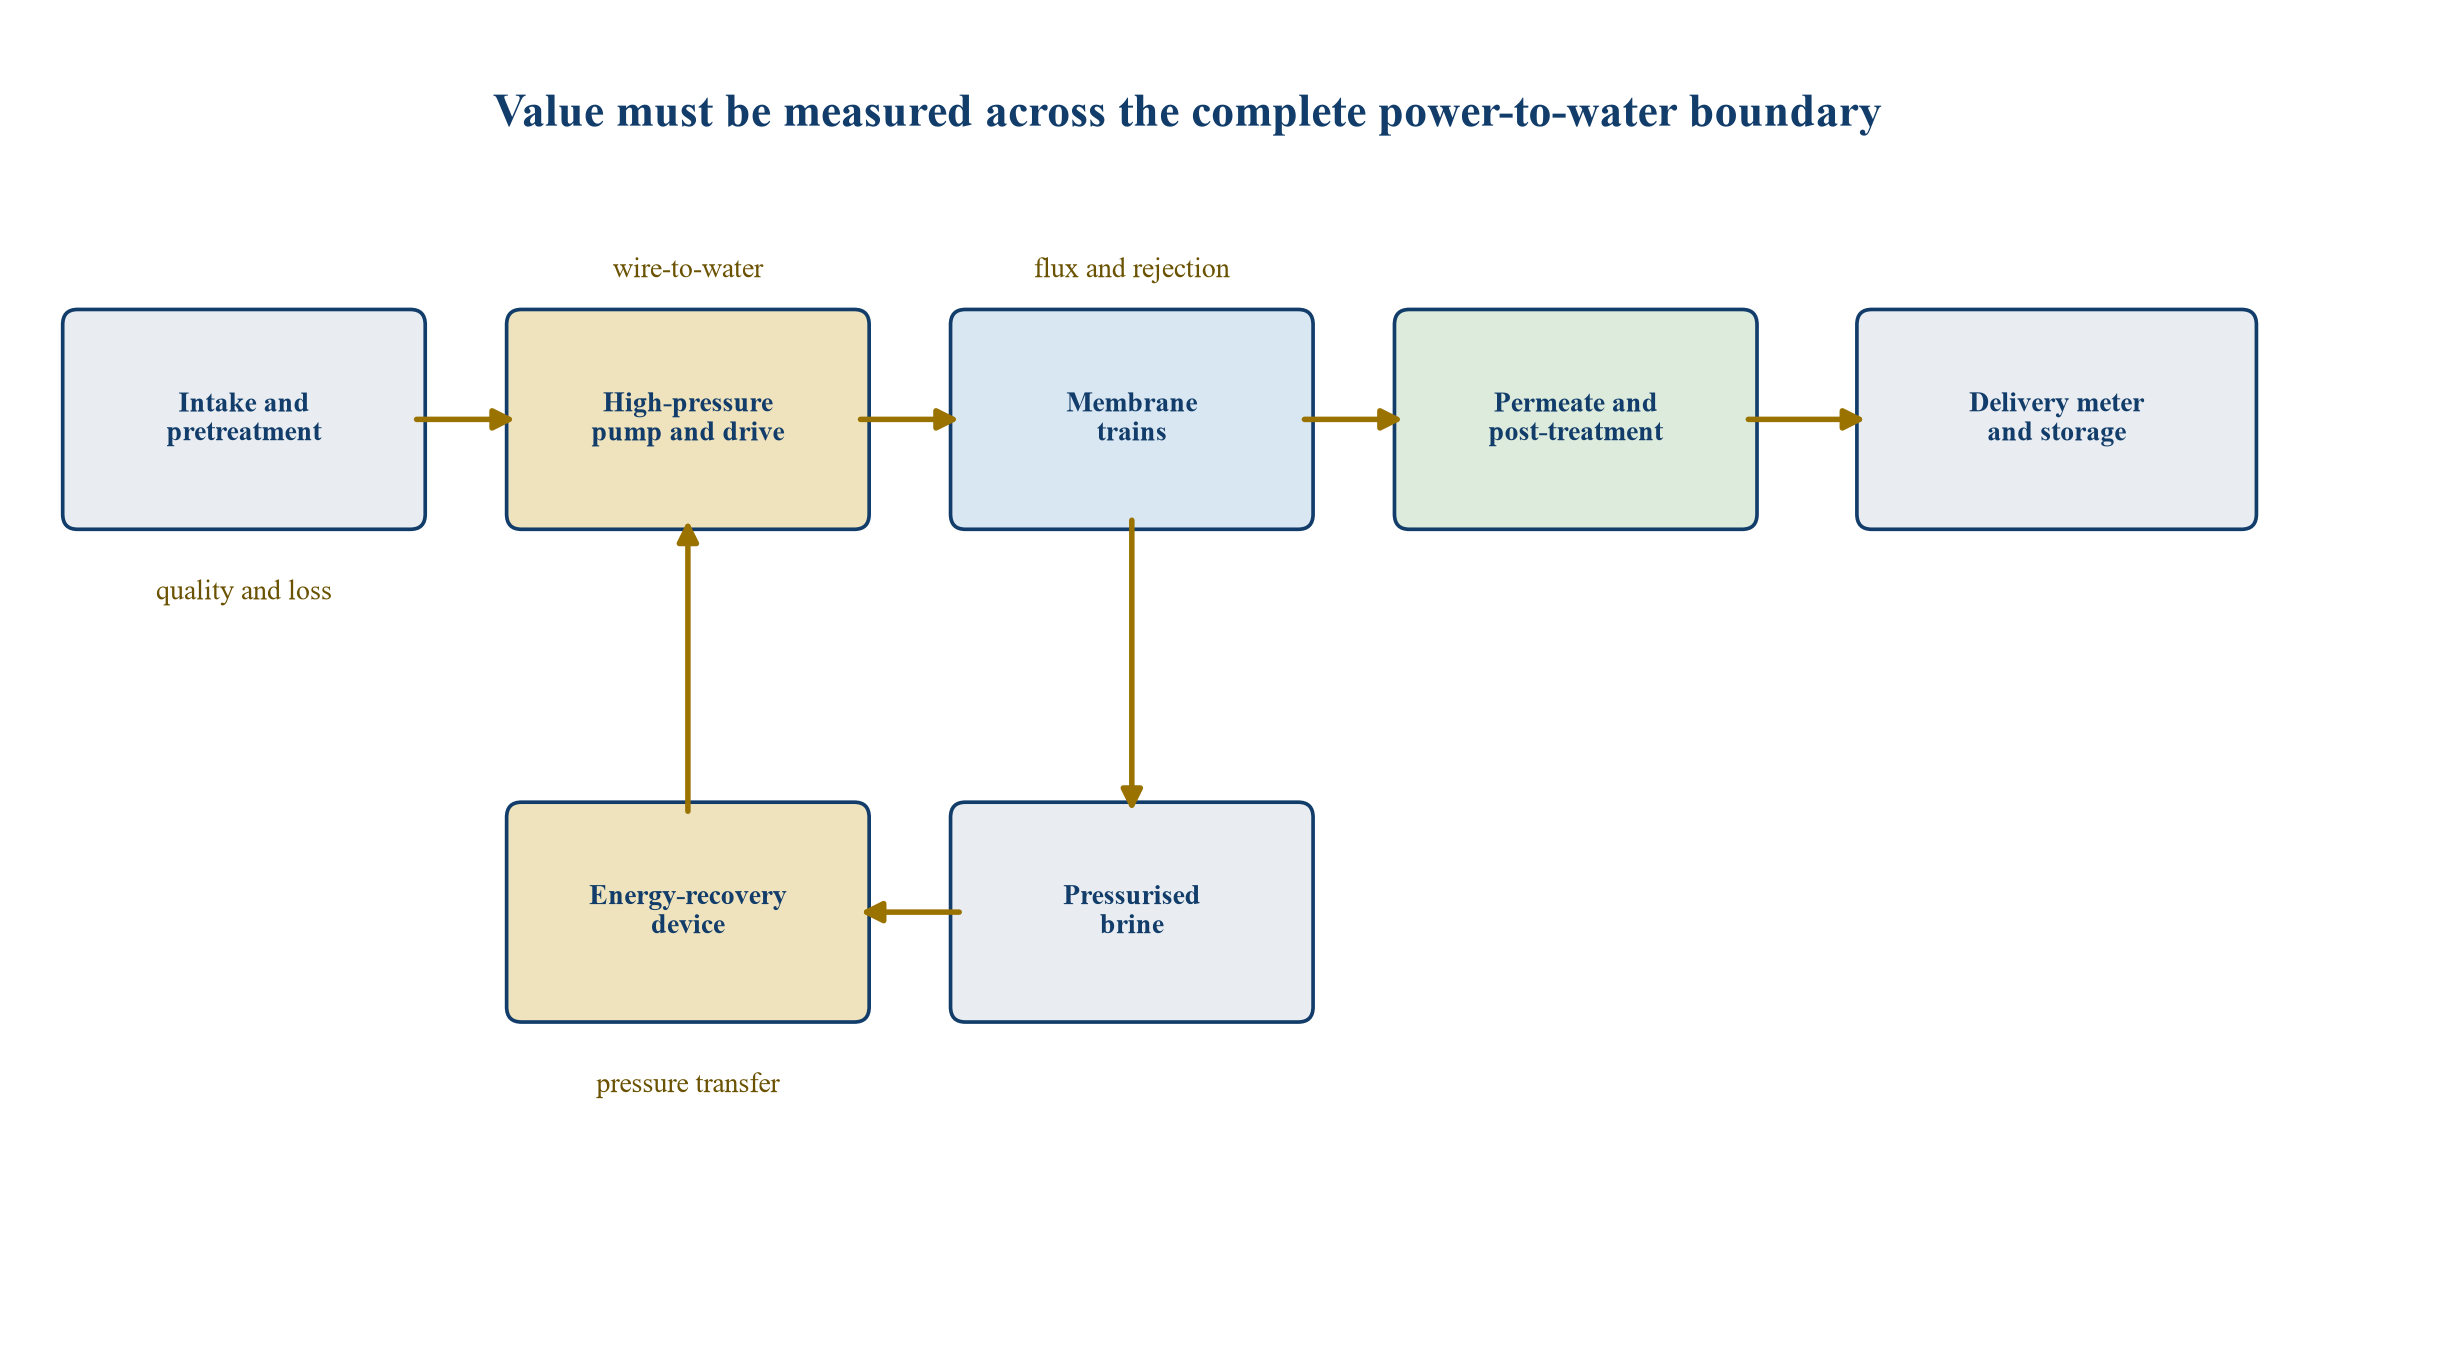
Generic architecture; actual trains, instruments and control boundaries depend on plant design.
6. Membrane condition
Membrane performance changes through fouling, scaling, compaction, chemical attack and physical damage. These mechanisms affect flux, salt rejection, pressure and cleaning frequency differently. The diagnostic should distinguish reversible loss from irreversible degradation.
Trend data should be normalised before comparing trains. Differential pressure, permeability, conductivity, recovery and clean-in-place response are more informative together than membrane age alone. Autopsy and laboratory analysis can identify a root cause where operating data remain ambiguous.
7. Replacement without root-cause correction
A Bureau of Reclamation-sponsored counter-flow RO demonstration reported that one membrane replacement did not restore flux because the new membranes fouled quickly; performance improved after fouling was mitigated and another replacement was installed [3]. The case illustrates the danger of treating a symptom as the asset.
The business case should include pretreatment, chemical regime, hydraulics and cleaning practice. A membrane purchase can destroy value when the operating environment remains unchanged. Root-cause work is part of the retrofit, even when the physical capital sits elsewhere.
8. Fouling and scaling
Fouling deposits suspended or biological material on the membrane. Scaling precipitates dissolved minerals. Both can reduce production and increase pressure. The DOE's RO technology material identifies fouling, scaling, degradation and feed pressure as principal performance factors [4].
The owner should quantify source-water events, pretreatment breakthrough, differential pressure and cleaning recovery. The model should convert lost permeability into incremental power, lost output, chemicals, labour, outage and membrane life. A lower-energy membrane can have inferior lifecycle economics if it is less robust under actual feed conditions.
9. Pretreatment as an upgrade alternative
Improved pretreatment can reduce fouling load, extend membrane life and stabilise operation. Options can include media filtration, dissolved-air flotation, ultrafiltration, cartridge improvements, dosing and control changes. Each has energy, chemical, sludge and maintenance implications.
The retrofit screen should compare a membrane-only case with pretreatment-led and combined cases. The best result may use the existing membrane longer. Capital approval should follow the total lifecycle effect rather than the ownership boundary between treatment packages.
10. Membrane selection
Membranes differ in permeability, salt rejection, boron performance, fouling resistance, pressure requirement and chemical tolerance. Selection should use the plant's feedwater and product specification. Catalogue performance is a starting point.
Pilot or train-scale testing should use representative seasonal conditions where feasible. The design should include element arrangement, flux distribution, pressure-vessel loading and compatibility with existing housings. A proprietary element can create supplier concentration and inventory risk that needs commercial treatment.
11. Cleaning economics
Cleaning restores part of membrane performance while consuming chemicals, labour, water and outage time. Aggressive cleaning can reduce element life. The optimum interval balances deterioration against cleaning cost and damage.
The Bureau of Reclamation has funded work to model cleaning frequency and scaling economics, reflecting the planning value of these variables [5]. The owner should model condition-based triggers and forecast the consequence of a delayed or ineffective clean.
12. High-pressure pumps
High-pressure pumps provide the head required to overcome osmotic pressure and system losses. Their efficiency depends on flow, head, speed, impeller, wear, clearances and operating point. A pump selected for the original duty may operate away from its best-efficiency region after plant modifications.
The assessment should measure electrical input, motor output or efficiency, pump differential head and flow. It should compare observed wire-to-water efficiency with an achievable reference under the same duty. The DOE's pumping resources and tools are designed around this system-level assessment [6][7].
13. Motor efficiency
Motor losses affect every operating hour. Replacement can be justified by efficiency, reliability, power factor, insulation condition or a changed duty. The case should include motor, starter or drive, cooling, harmonics, cabling and installation.
Nameplate efficiency does not prove field performance. Load, voltage balance, rewinding history and drive losses matter. A premium motor can create limited value if the pump remains throttled or hydraulically mismatched.
14. Variable-speed drives
A variable-speed drive can match pump output to changing flow or pressure and reduce throttling losses. It also introduces drive losses, harmonics, cooling and control complexity. DOE guidance cautions that drive efficiency varies with speed [7].
The retrofit should model the actual load profile and system curve. Savings at part load may be material, while a plant that operates near constant full load may gain less. Minimum membrane pressure and recovery constraints remain hard limits.
15. Pump re-rating and hydraulics
Impeller trimming, pump re-rating, parallel staging, pipe modification and valve changes can reduce loss without replacing the whole pump. These measures require a reconciled hydraulic model and field measurements.
The owner should examine suction conditions, cavitation margin, pressure-vessel limits and transient response. A local pressure reduction can shift risk to another train or reduce water quality. The integrated model should preserve compliant production.
16. Energy recovery
The brine leaves the membrane array at high pressure. Energy-recovery devices transfer or convert part of that pressure rather than dissipating it. The value depends on transfer efficiency, leakage, mixing, pressure drop, flow balance and availability.
Energy Recovery's 2025 Form 10-K describes pressure exchangers used in seawater RO and reports company performance claims, including high transfer efficiency and reduced main-pump flow [8]. These are supplier disclosures. A project decision requires site-specific guarantees and independent testing.
17. Retrofit fit
Adding or replacing an energy-recovery device can require booster pumps, piping, controls, foundations and changes to train hydraulics. Space and outage constraints can dominate equipment cost.
The feasibility study should map tie-ins, pressure ratings, commissioning sequence and fallback operation. A high-efficiency device can underperform when flow is outside its design range. The owner should model the complete operating envelope.
18. Baseline definition
The baseline is the expected future performance without the upgrade. It should reflect current degradation, planned maintenance and credible operating changes. Using the original design can overstate savings when the plant could recover performance through ordinary maintenance.
Baseline periods should exclude documented meter failure and abnormal events under a pre-agreed rule. They should retain normal variability. A frozen calculation and data archive protect both owner and supplier from later selection bias.
Table 1. Upgrade baseline and normalisation protocol
| Variable | Required evidence | Normalisation treatment | Commercial use |
|---|---|---|---|
| Feed salinity | Calibrated conductivity and laboratory checks | Correct osmotic pressure and expected energy | Separate equipment saving from feed change |
| Feed temperature | Continuous measurement | Correct membrane permeability | Compare flux across seasons |
| Product quality | Conductivity and required constituents | Apply compliant-water boundary | Exclude off-specification output |
| Recovery | Feed, permeate and concentrate flow | Hold or model agreed operating range | Separate water recovery from energy intensity |
| Throughput | Metered compliant volume | Use specific energy and capacity measures | Value recovered output and energy separately |
| Train availability | Event and outage log | Apply agreed availability case | Distinguish efficiency from reliability |
| Membrane condition | Normalised permeability and rejection | Establish degradation curve | Define replacement counterfactual |
| Power | Revenue-grade electrical meter | Include agreed auxiliary loads | Calculate verified avoided energy |
Generic measurement structure; plant-specific engineering determines valid corrections.
19. Metering
Measurement accuracy should be proportionate to the expected saving. Flow, pressure, conductivity, temperature and electrical meters need calibration, time alignment and data-quality rules. Small errors can overwhelm a narrow efficiency improvement.
The protocol should define missing data, drift, aggregation and retention. Independent witness testing can support performance acceptance. Continuous monitoring can establish persistence after completion.
20. Normalised specific energy
Specific energy is net electricity divided by compliant water produced. The numerator and denominator must share a time interval and boundary. Start-up water, rejected product and recirculation should be treated consistently.
Normalisation should correct variables that neither party controls while preserving risks assigned by contract. Over-correction can turn the test into a model result rather than an operating result. The calculation should be auditable from meter data.
21. Capacity recovery
An upgrade can recover lost output, not only reduce energy per cubic metre. The value of recovered capacity depends on offtake, tariff, storage, network need and the cost of alternative water.
The financial model should avoid counting both energy saving and revenue from the same water incorrectly. It should identify the marginal energy, chemicals and maintenance associated with additional output. Capacity has value only when it can be delivered or reduces an existing shortfall obligation.
22. Reliability value
New equipment can reduce forced outages, improve train stability and lower spare-part risk. Reliability value is the probability-weighted cost of avoided events, including replacement water, deductions, labour and damage.
Historical event records should support the estimate. A generic reliability premium is unverified. Warranty and service response can transfer part of the risk, while consequential losses are often capped or excluded.
23. Degradation curve
Savings should be assessed over time. Membranes foul, pump clearances change and control performance can drift. The initial test is one point on a lifecycle curve.
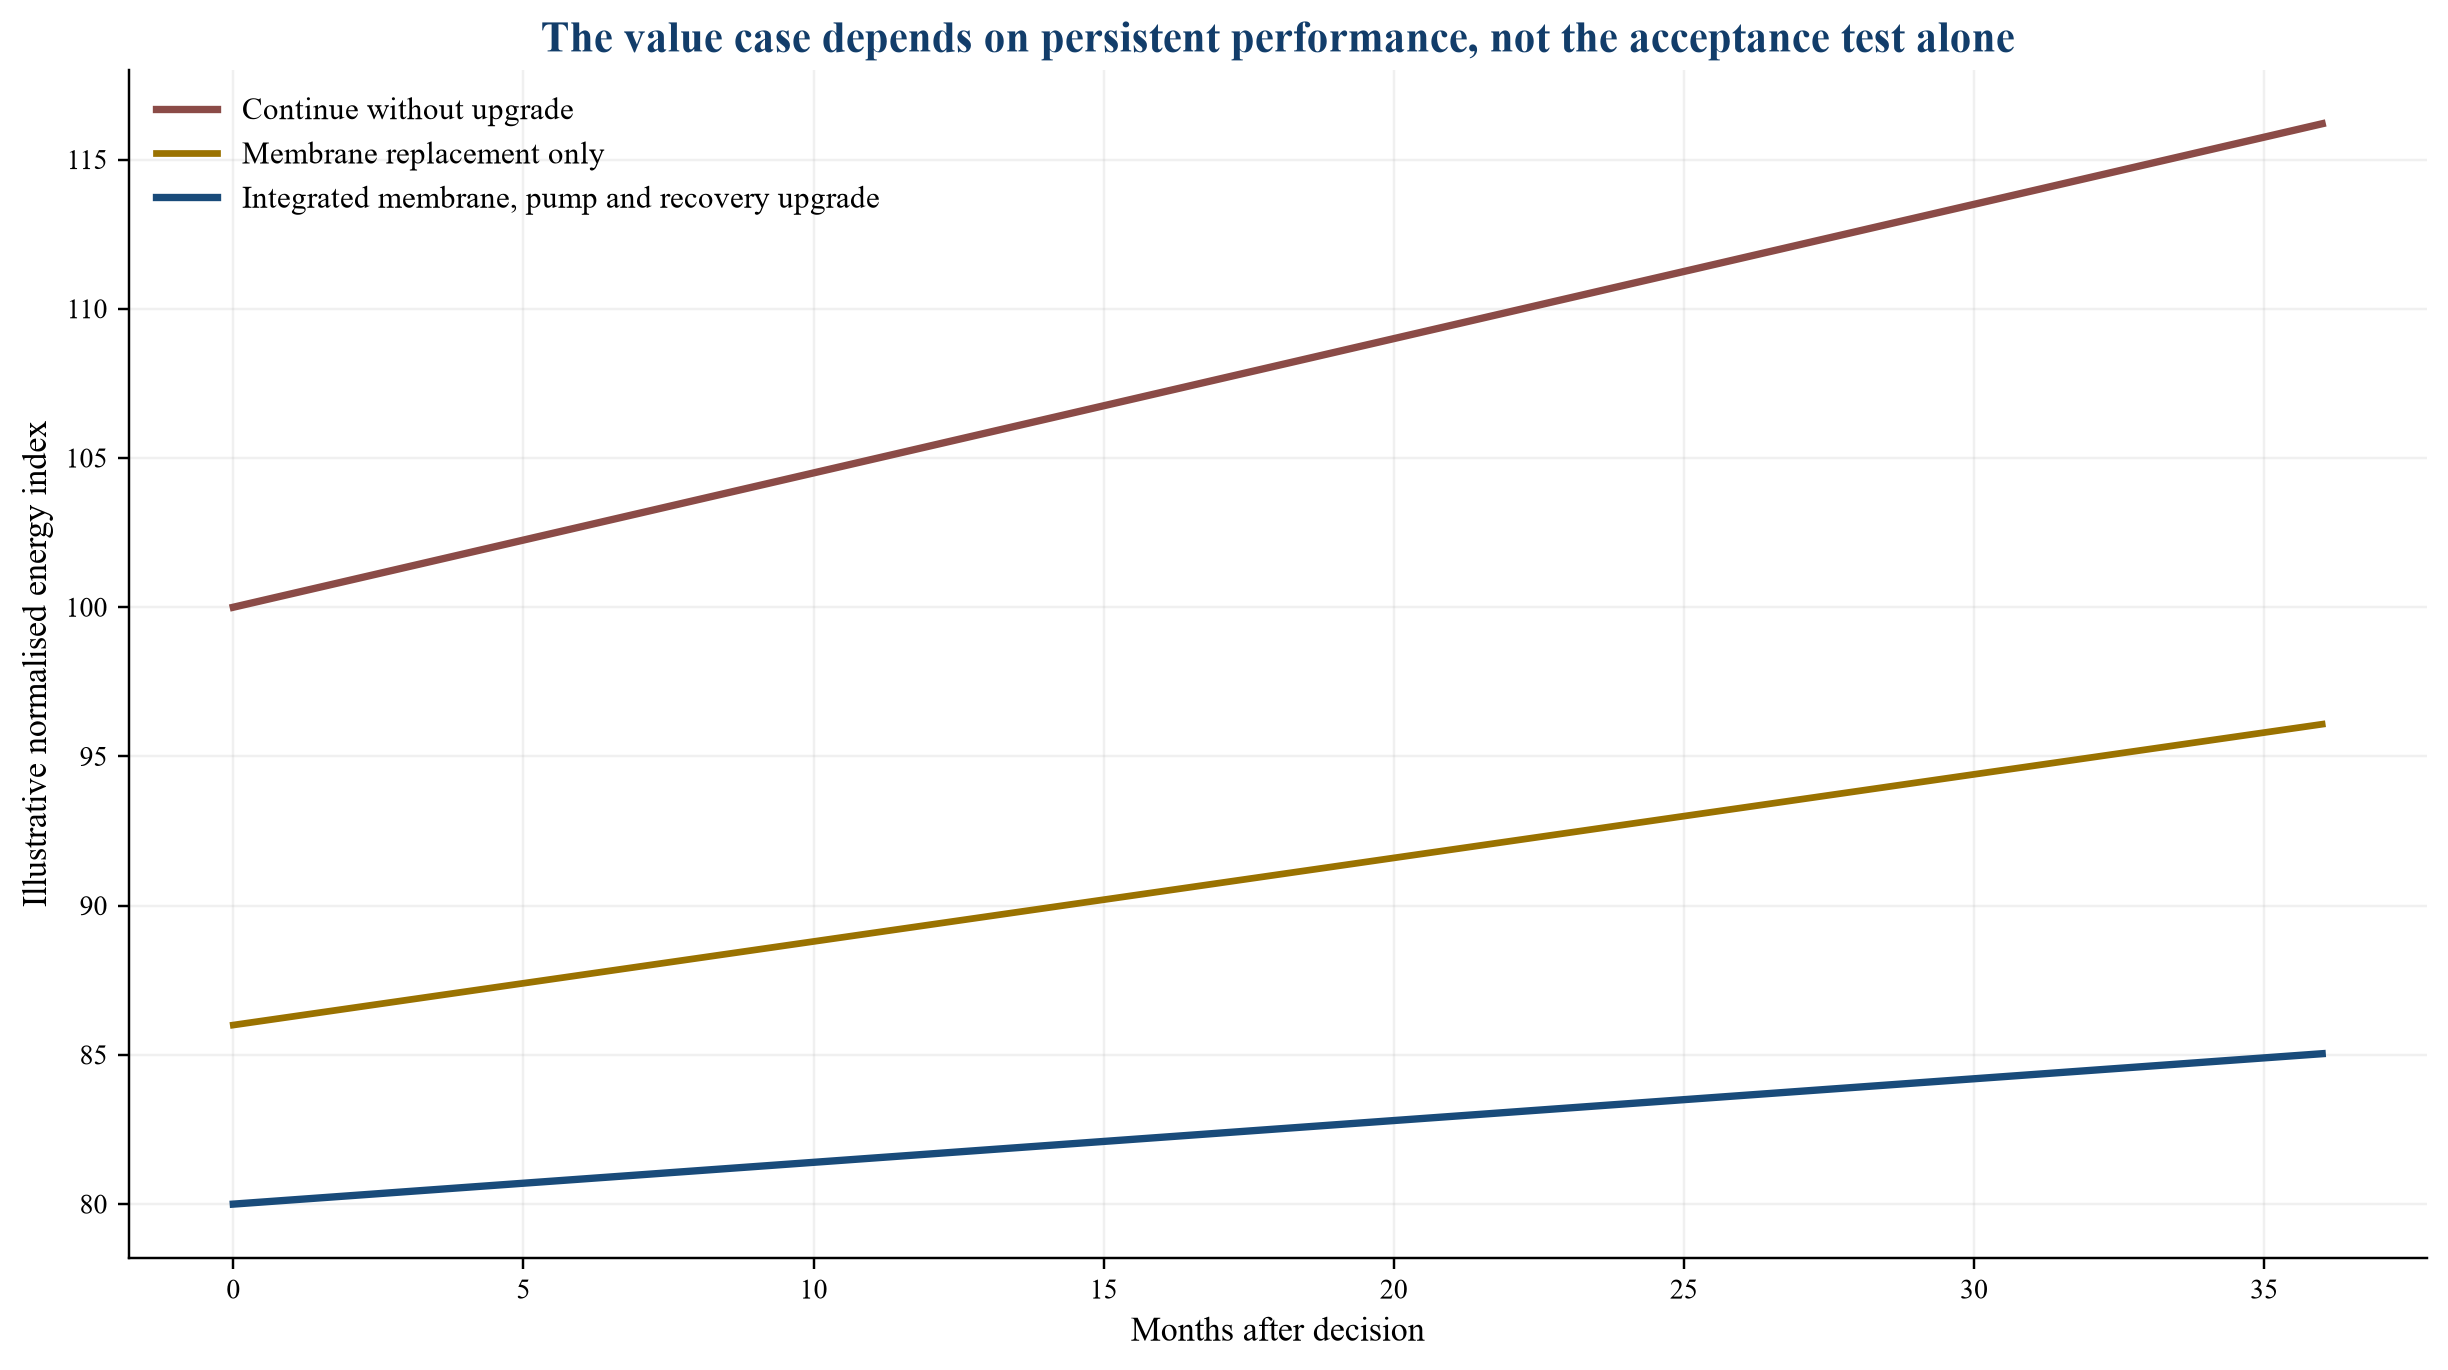
Hypothetical indices for methodology only; not operating data or an equipment forecast.
24. Counterfactual maintenance
The no-upgrade case still requires maintenance and eventual replacement. Incremental capex should be compared with the timing and cost of those unavoidable actions. Replacing equipment early consumes remaining life.
The model should credit avoided baseline maintenance only once. Deferred spend can have present-value benefit while increasing operating risk. The board should see both cash timing and service consequence.
25. Energy-price exposure
Avoided energy value equals verified kilowatt-hours multiplied by the project's marginal or contracted energy cost. A blended average tariff can be wrong when savings occur in specific hours or affect demand charges.
The model should state escalation, pass-through and hedge treatment. If energy cost is passed to the water offtaker, the project company may receive limited direct benefit unless a sharing mechanism exists. Contract economics determine who owns the saving.
26. Carbon and renewable attributes
Lower electricity use can reduce emissions and renewable-generation requirements. The environmental value depends on the marginal power source, applicable accounting method and ownership of attributes.
Carbon value should be separately disclosed and included only where a price, compliance requirement or approved internal policy applies. Avoided emissions alone do not create project cash. They can support green-finance reporting and procurement objectives.
27. Capital cost
Installed cost includes equipment, engineering, owner work, transport, duties, foundations, piping, electrical, controls, spares, commissioning, outage and contingency. A quotation is not an installed budget.
Brownfield uncertainty requires surveys and tie-in planning. The estimate should state maturity and exclusions. Contingency should correspond to unresolved scope and interface risk rather than a generic percentage.
28. Outage cost
Retrofits can reduce production during tie-in and commissioning. Outage cost depends on storage, alternative supply, season, tariff deductions and replacement-water arrangements.
The schedule should seek a low-demand window and coordinate planned maintenance. Parallel installation and bypass can reduce outage at additional cost. The model should compare alternatives on total value.
29. Lifecycle cost
Membrane life, pump overhaul, drive replacement, energy-recovery service, chemicals, labour and spares belong in the lifecycle model. A lower initial price can create a higher total cost.
The owner should use a consistent horizon and residual value. Supplier service agreements should be included where required to maintain guarantees. Foreign-currency and obsolescence exposures need sensitivity.
30. Hypothetical value bridge
The financial case should reconcile the existing asset to the upgraded asset. The exhibit below shows the logic with hypothetical indices.
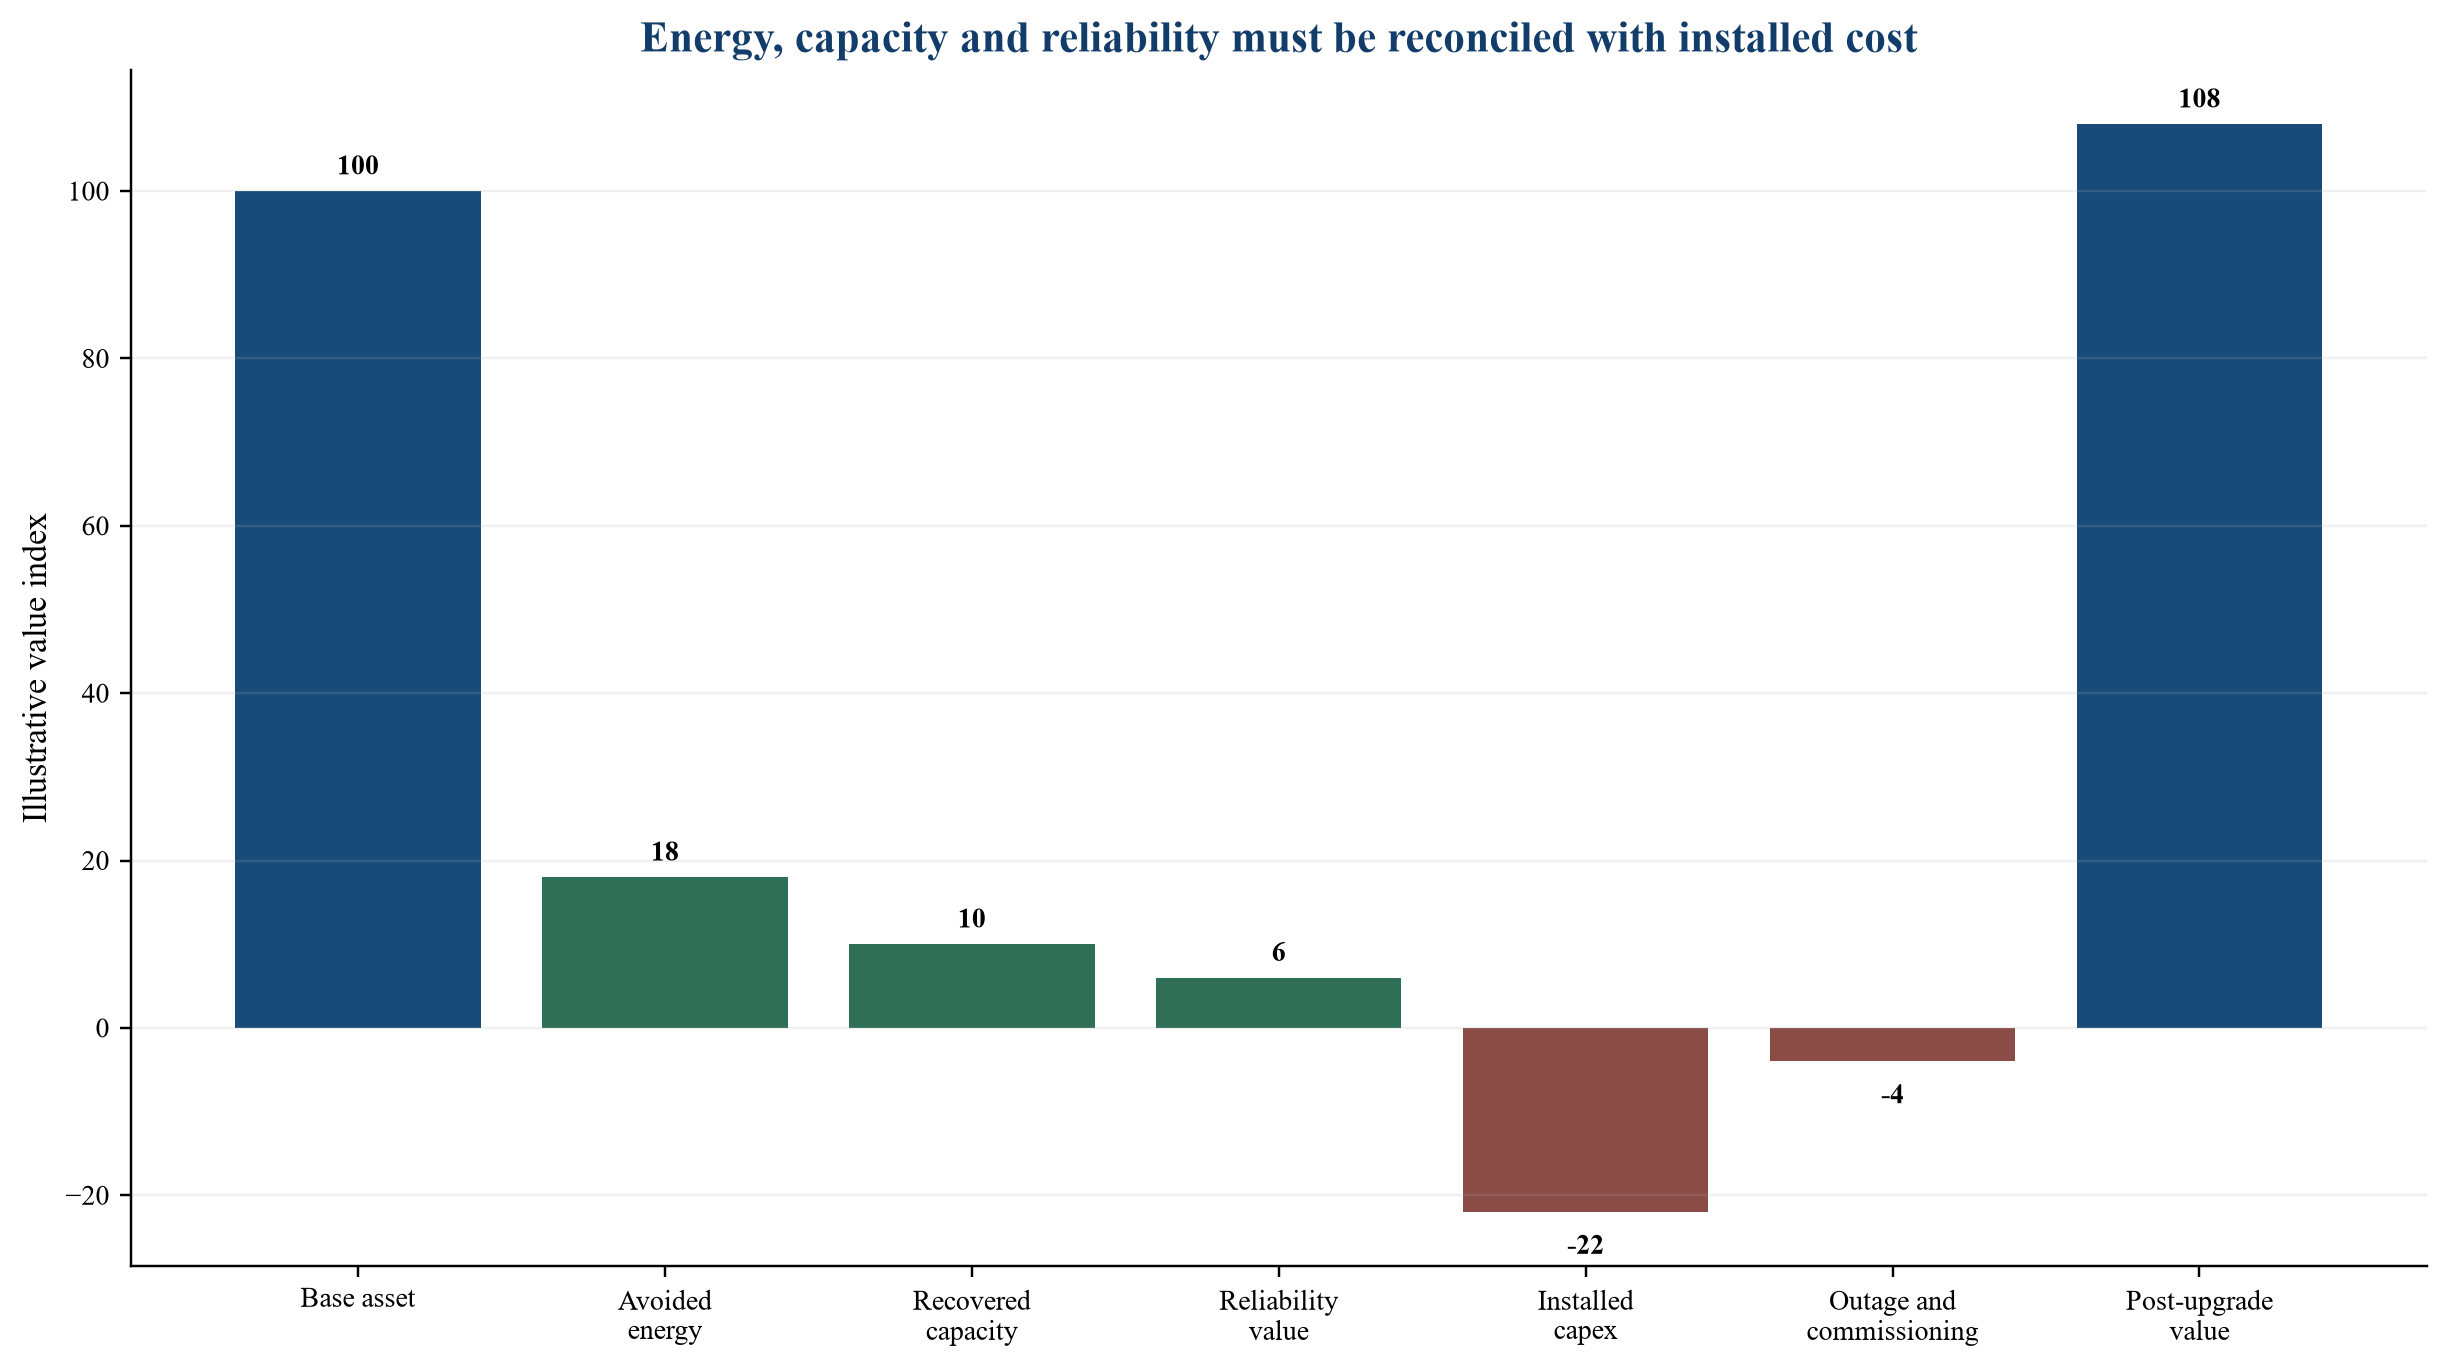
Hypothetical values; not a project valuation, tariff, forecast or supplier claim.
31. Discounted cash flow
The upgrade model should use incremental cash flows, taxes, working capital, replacement and residual value. Savings begin after commissioning and decline or persist according to the degradation case.
The discount rate should reflect contract and operating risk. Scenario-weighted cash flows can make technical uncertainty explicit. A single payback period hides performance persistence and terminal assumptions.
32. Payback and hurdle rates
Payback is useful for liquidity and technology-risk screening. It should not replace net present value or service analysis. A short payback based on unnormalised savings can still destroy value.
The board should set approval thresholds by risk, strategic importance and capital availability. Mandatory compliance or water-security work can require a different decision framework from discretionary efficiency capital.
33. Debt and covenant implications
An upgrade can improve debt-service coverage by reducing operating cost or increasing availability. It can also require new debt, restricted-payment consent or a reserve draw. Existing finance documents may limit additional capex and security.
Lenders should receive the technical case, contract package, outage plan and downside model. Debt sizing should rely on verified or guaranteed performance, with equity absorbing unproven upside.
34. Performance contract
The supplier or integrator can guarantee energy, output, quality, availability or equipment efficiency. The metric should match the owner's economic case. A component guarantee may not cover system savings.
Acceptance conditions, correction curves, exclusions, liquidated damages and caps require alignment. The owner should retain access to data and test calculations. The supplier needs relief for feedwater and operating conditions outside the agreed envelope.
Table 2. Upgrade commercial structure and value protection
| Element | Owner objective | Supplier or contractor obligation | Financeability control |
|---|---|---|---|
| Baseline | Establish credible counterfactual | Accept data and correction method | Frozen protocol and raw-data archive |
| Completion | Integrate equipment safely and on time | Meet schedule, capacity and quality tests | Security, damages and long-stop date |
| Efficiency | Deliver persistent energy reduction | Guarantee corrected system performance | Metered boundary and repeat tests |
| Capacity | Recover compliant output | Meet flow and rejection requirements | Exclude off-specification water |
| Availability | Preserve service | Support response and spares | Availability test and service-level regime |
| Degradation | Maintain lifecycle value | Meet persistence or element-life conditions | Warranty, monitoring and retest rights |
| Interface | Avoid gaps between packages | Coordinate controls, hydraulics and commissioning | Single integration responsibility or interface matrix |
| Savings ownership | Allocate economic benefit | Provide measurement evidence | Tariff, sharing and pass-through alignment |
Generic framework; enforceability and allocation depend on transaction documents and law.
35. EPC or multi-package delivery
A single retrofit integrator can wrap membrane, pump, drive, recovery and control performance. The price includes interface risk. Separate packages can preserve specialist competition while leaving integration with the owner.
The procurement strategy should reflect the owner's engineering capability and outage risk. A detailed interface matrix is essential where several suppliers participate. Completion testing must cover the integrated plant.
36. Warranty security
Warranty value depends on the obligor's credit, duration, exclusions and remedy. Parent support, performance security, retention or escrow can strengthen recovery. Warranty caps should reflect the owner's downside.
Long membrane or equipment warranties can require prescribed operation and consumables. The owner should verify that those conditions fit the plant. A warranty that cannot be maintained under normal duty has limited value.
37. Measurement and verification
Post-completion measurement should repeat the agreed normalisation and include a sufficient operating period. The protocol can draw on investment-grade energy assessment principles reflected in DOE tools such as MEASUR and PSAT [6][7].
Persistence testing after six or twelve months can protect lifecycle value. The contract should state remedy if initial performance passes and later performance falls below the guaranteed curve.
38. Data governance
Owner, operator, EPC contractor and equipment suppliers may hold different data. The upgrade requires access to historian tags, calibration records, laboratory results, maintenance and control logic.
The contract should establish data rights, cybersecurity, retention and independent access. Supplier algorithms can remain confidential while exposing inputs, outputs and acceptance calculations needed for verification.
39. Digital optimisation
Controls can optimise pump loading, train sequencing, recovery and cleaning. Their value depends on sensor quality, operating authority and validated constraints. A software recommendation that operators routinely override has limited value.
The owner should pilot control changes, log overrides and protect water-quality limits. Savings from software should be measured separately from hardware where possible. Cybersecurity and fallback modes require testing.
40. Procurement comparison
Bids should use a common baseline, duty profile, energy price, outage window and lifecycle horizon. Suppliers should disclose exclusions and the source of each claimed saving.
Evaluation should compare installed net present value, guaranteed performance, implementation risk, supplier credit and service capability. A lower equipment price can be inferior when integration and outage sit outside the quote.
41. Risk allocation
Risk should sit with the party that controls or can price it. Feedwater and demand may remain with the owner or offtaker. Equipment design and workmanship can sit with the supplier. Integration can sit with the EPC contractor or owner according to scope.
Table 3. RO upgrade risk register and decision response
| Risk | Evidence required | Commercial response | Investment response |
|---|---|---|---|
| Baseline bias | Raw history and frozen protocol | Independent verification | Reduce recognised savings |
| Fouling root cause unresolved | Autopsy, feedwater and pretreatment review | Performance condition and pretreatment scope | Defer membrane order |
| Pump duty mismatch | Field curve and hydraulic model | Wire-to-water guarantee | Re-rate before replacement |
| Energy recovery underperforms | Flow, pressure and transfer test | Device and system guarantee | Price downside case |
| Outage exceeds plan | Integrated schedule and contingency | Delay damages and recovery plan | Fund replacement-water exposure |
| Savings do not persist | Degradation and cleaning model | Retest and warranty remedy | Holdback or staged payment |
| Power price changes | Tariff and hedge review | Sharing or index mechanism | Separate kWh and price risk |
| Supplier concentration | Spares, alternatives and credit review | Inventory and support covenant | Reserve and dual-source plan |
| Existing-finance restriction | Facility and security review | Lender consent | Condition precedent |
Generic framework; probability, impact and remedy require plant-specific diligence.
42. Pilot and train strategy
A full-plant retrofit may be unnecessary for proof. One train can establish membrane, pump-control and recovery performance while limiting outage and capital. The pilot should represent the intended duty.
Success criteria should include persistence and operating practicality, not only a short acceptance test. The owner should preserve the option to stop, redesign or scale. Common infrastructure may still need early commitment.
43. Implementation sequence
The sequence begins with data validation and root-cause diagnosis. It then develops the hydraulic model, screens alternatives, pilots material uncertainty, freezes the baseline, procures integrated performance and plans the outage.
Construction, commissioning, acceptance and persistence testing follow. Each gate should have evidence, cost and decision rights. Capital should be released when the preceding gate resolves the uncertainty needed for the next commitment.
44. Operations readiness
New equipment changes procedures, spares, controls and training. Operators should participate in design and hazard review. Commissioning should include abnormal operation and fallback modes.
The owner should update preventive maintenance, critical-spares lists, drawings and control narratives before handover. Warranty responsibility should remain clear when the operator intervenes.
45. Environmental implications
Energy reduction can lower emissions and renewable-generation needs. Higher recovery can reduce intake per unit of product while concentrating brine. Chemical and cleaning changes can affect discharge.
The environmental assessment should examine net effects across energy, intake, chemicals, waste and brine. A narrow energy metric can hide a worse water or discharge outcome. Permit changes require early review.
46. Supplier diligence
Supplier assessment should cover technical record, financial strength, manufacturing, quality, warranty history, service footprint, spares and cybersecurity. A specialised component can create long-term dependence.
Public disclosures can inform market context. Energy Recovery's Form 10-K states that lifecycle cost is important in large desalination procurement and describes retrofit exposure as part of its market [8]. Company claims should be verified for the specific site.
47. Red flags
Red flags include savings based on design rather than measured baseline, membrane replacement without fouling diagnosis, pump comparison at different duty, energy-recovery efficiency quoted without system losses, and capacity value without offtake.
Other warnings include outage omitted from capex, supplier-only verification, missing raw data, a guarantee that excludes normal feedwater, and debt service dependent on unguaranteed savings. Each issue needs correction, risk price or a smaller staged investment.
48. Investment-committee scorecard
The committee should ask whether the baseline is reproducible, the root cause is established, the option set is complete, the retrofit is integrated, savings are contractually owned, and the downside preserves water service.
Approval conditions can include pilot results, lender consent, independent engineer sign-off, guaranteed installed cost, outage contingency, measurement protocol and supplier security. The decision record should state which value components are guaranteed, expected or excluded.
49. Reporting after completion
Monthly reporting should show normalised specific energy, compliant water, recovery, permeability, salt rejection, differential pressure, pump efficiency, energy-transfer performance, availability, cleaning and lifecycle spend.
The finance team should reconcile verified kilowatt-hours, capacity and reliability to cash. Variances should identify operating, price and volume causes. This protects the investment case from narrative drift.
50. Portfolio replication
A successful retrofit can create a repeatable programme across trains or plants. Replication should use the verified baseline and lessons from the first installation. Feedwater and duty differences still require local adjustment.
Framework procurement can reduce engineering and spare costs. The owner should preserve competition and avoid locking in a design that later data contradict. Each subsequent asset needs its own acceptance evidence.
51. Limits of the framework
This paper does not price a named upgrade or recommend a supplier, membrane, pump, drive or energy-recovery device. Public materials do not disclose every operating condition, contract or failure. Supplier disclosures are identified as such.
A specific decision requires plant data, calibrated measurements, independent engineering, executed contracts, environmental review and a fully audited financial model. Hypothetical exhibits are methodology only.
52. Conclusion
RO efficiency capital should be priced from a normalised power-to-water baseline. Membrane, pump, drive, energy-recovery, pretreatment and control measures should be evaluated as an integrated portfolio. Root-cause diagnosis prevents capital from being spent on a recurring symptom.
The recommended discipline is to measure the complete boundary; freeze the counterfactual; value energy, capacity and reliability separately; include installed cost, outage and lifecycle replacements; obtain system-level guarantees; test persistence; and reconcile verified performance to cash. This turns an equipment upgrade into an auditable infrastructure investment.
53. Board decision record
The board paper should state the current condition, root cause, alternative interventions, frozen baseline, expected operating range, installed cost, outage, guarantee, measurement method, scenario returns and service impact. It should disclose which assumptions rely on supplier statements and which have been independently verified.
The approval should define hold points and change control. A materially different feedwater case, scope, tariff or outage should return to the decision authority. This prevents the project from retaining approval after the evidence supporting it has changed.
54. Future optionality
An upgrade can create data, control capability and hydraulic headroom that support later renewable integration, capacity expansion or advanced membranes. These options should be described without assigning value until the enabling evidence and rights exist.
The owner can preserve optionality through spare tie-ins, modular controls, data access and equipment envelopes. Optionality should not burden the base case with speculative capital. The first investment should stand on verified water, energy and reliability economics.
55. Funding structures
The retrofit can be funded from owner equity, existing project reserves, additional senior debt, vendor finance, a green facility or a shared-savings arrangement. The appropriate source depends on asset ownership, covenant capacity, upgrade risk and who receives the saving. Capital with a lower headline rate can be expensive when it captures a large share of upside or restricts operations.
Funding terms should follow the evidence. Proven pump or motor replacements may support conventional debt. A novel membrane or control system may require sponsor capital, staged payment or supplier risk sharing. The model should compare all financing fees, reserves, security, tenor and termination costs with the same upgrade cash flows.
56. Shared-savings structures
A supplier or energy-service company can fund part of the work and receive a share of verified savings. This aligns payment with outcome and can preserve owner capital. It also makes the baseline, energy price and measurement rules central commercial terms.
The agreement should state minimum service, ownership of equipment, treatment of operating changes, buyout rights and what happens when water output changes. Savings should be calculated from verified kilowatt-hours before applying the agreed price. A shared-savings structure cannot repair a weak baseline; it raises the value of a precise one.
57. Operator incentives
The operator controls set points, cleaning, maintenance and response to alarms. An upgrade guarantee can fail when incentives reward production without lifecycle efficiency, or efficiency without water availability. The O&M regime should align these objectives.
Performance measures can include normalised energy, compliant volume, availability, membrane condition and planned maintenance. Incentives should use controllable measures and protect public-health limits. The owner should avoid overlapping penalties between the operator and supplier that leave the project unable to recover the same loss from either party.
58. Spare-parts strategy
Retrofits can make existing spares obsolete and introduce new critical components. The installed-cost model should include initial spares, specialist tools, firmware access and training. Lead time matters more than unit price when failure stops a train.
The owner should classify spares by failure probability, consequence and replenishment time. Shared inventory across a plant portfolio can reduce working capital. Supplier-held stock needs enforceable access and transport assumptions. Obsolescence notices and last-time-buy rights protect long-tenor value.
59. Foreign exchange and import exposure
Membranes, pumps, drives and energy-recovery devices may be priced in currencies different from water revenue. The investment case should map purchase, spares, service and future replacement exposure. A one-time construction hedge does not cover a long operating life.
The owner can use tariff indexation, reserves, framework pricing, local service or hedging. Each carries cost and basis risk. Local assembly may reduce logistics and build capability while retaining imported core components. The downside model should use the residual currency exposure after confirmed mitigations.
60. Tax, accounting and concession treatment
Capital allowance, depreciation, indirect tax and accounting treatment affect owner cash flow. A concession or project agreement may also determine whether the upgrade becomes part of the regulated or handback asset and whether costs are recoverable through tariff.
The board should obtain transaction-specific advice before including these effects. Management estimates should remain separate from engineering savings. Accounting earnings can differ from cash value, especially when existing equipment is retired early or a supplier-financed arrangement contains service and lease elements.
61. Change in water specification or duty
The plant may face tighter product standards, higher salinity, a different recovery target or new dispatch requirements during the upgrade life. The selected equipment should be tested against credible duty cases. Excess design margin has a cost, while a narrow design can lose value when conditions change.
The investment paper should identify which future cases are contracted, planned or optional. A change clause can allocate the cost of a later specification. The base valuation should include only approved or contractually supported duty, with optional capability shown separately.
62. Portfolio capital ranking
Owners with several plants should rank upgrades by verified value per unit of constrained capital. Comparable metrics can include present value, energy saved, compliant capacity recovered, outage exposure and confidence in the baseline. A single league table should retain plant-specific risk rather than reduce every opportunity to simple payback.
The portfolio can combine quick operational measures with larger integrated retrofits. Diversifying implementation teams and outage windows can reduce execution concentration. Capital should move when diagnosis changes the expected return; an early low-cost assessment can be more valuable than reserving funds for a weakly evidenced project.
63. Independent engineer role
An independent engineer can review baseline integrity, root cause, design, installed cost, schedule, guarantees and completion tests. The role is particularly valuable when the equipment supplier produced the savings model or the upgrade supports additional debt.
Independence does not remove owner responsibility. The scope should require access to raw data and document material assumptions. Reliance, liability and update obligations should align with the financing decision. The engineer's report should distinguish verified observations, management estimates, supplier claims and unresolved items.
64. Commissioning discipline
Commissioning should test individual components, integrated controls, protection systems, water quality, energy performance and fallback operation. The sequence should define temporary operating limits and authority to accept deviations. A short successful run is insufficient when the investment relies on sustained performance.
The completion file should contain calibrated meter records, test calculations, alarms, punch items, as-built documents and operator sign-off. Deferred items need owners and deadlines. Distribution or final supplier payment should follow the agreed evidence rather than mechanical completion alone.
65. Decision under uncertainty
Where data remain incomplete, the owner can stage the decision. It can fund additional instrumentation, one membrane train, a pump test or a temporary control trial before committing the full capex. Each stage should resolve a named uncertainty and preserve a stop option.
The value of staging is highest when the next test is inexpensive relative to the possible avoided mistake. The board should compare information value with delay and outage-window cost. A staged programme remains accountable through pre-agreed success, redesign and termination criteria.
References
- United States Department of Energy. Desalination Basics. https://www.energy.gov/cmei/ito/desalination-basics
- United States Department of Energy. Bandwidth Study on Energy Use and Potential Energy Savings Opportunities in U.S. Seawater Desalination Systems. 2017. https://www.energy.gov/sites/default/files/2017/12/f46/Seawater_desalination_bandwidth_study_2017.pdf
- United States Bureau of Reclamation. Counter Flow Reverse Osmosis: Innovative Desalination Technology for Cost Effective Concentrate Management and Reduced Energy Use. Report 247. July 2021. https://www.usbr.gov/research/dwpr/reportpdfs/report247.pdf
- United States Department of Energy. Reverse Osmosis Technology Evaluation. https://www.energy.gov/eere/femp/downloads/federal-energy-management-program-report-template
- United States Bureau of Reclamation. Developing a Deterministic Model for Predicting Cleaning Frequency Due to Inorganic Scaling on Reverse Osmosis Membranes. Project 792. https://www.usbr.gov/research/projects/detail.cfm?id=792
- United States Department of Energy. Pump Systems. https://www.energy.gov/cmei/ito/pump-systems
- United States Department of Energy. Pumping System Assessment Tool User's Manual. https://www.energy.gov/eere/iedo/articles/pumping-system-assessment-tool-user-manual
- Energy Recovery, Inc. Annual Report on Form 10-K for the Year Ended 31 December 2025. Filed 25 February 2026. https://www.sec.gov/Archives/edgar/data/1421517/000142151726000022/erii-20251231.htm
- International Renewable Energy Agency. Water Desalination Using Renewable Energy. March 2012. https://www.irena.org/publications/2012/Mar/Water-Desalination-Using-Renewable-Energy
- United States Bureau of Reclamation. Scaling Resistant RO/NF Membrane. Project 1855. https://www.usbr.gov/research/projects/detail.cfm?id=1855
- United States Bureau of Reclamation. Cost Modeling of Membrane Desalination Processes Using Reclamation's WaTER Model. https://data.usbr.gov/catalog/8131
- United States Department of Energy. MEASUR. https://www.energy.gov/cmei/ito/measur
- ACWA Power. Jubail 3A IWP Operating Efficiency Disclosure. https://acwapower.com/en/media-center/latest-news/acwa-power-inaugurates-jubail-3a-iwp-jazlah-water-desalination-company-the-first-large-scale-integrated-water-desalination-solar-pv-project-in-saudi-arabia/
- United States Department of Energy. Improving Pumping System Performance: A Sourcebook for Industry. https://www.energy.gov/sites/prod/files/2014/05/f16/pump.pdf
- National Renewable Energy Laboratory. Water Research Facilities. https://www.nrel.gov/water/facilities.html
About the Author
Chennakeshav (CK) is a corporate finance and investment banking executive with 25+ years of global experience in deal origination, structuring and execution across M&A, growth capital and corporate strategy. He has led value-creation mandates for founders, corporates and funds — bridging the boardroom view to hands-on execution and close.
His career spans Morgan Stanley, HSBC, Lloyds Banking Group, EWEC, ADQ portfolio companies and Emirates Growth Fund, across TMT, real estate, fintech, deeptech, cleantech, infrastructure and energy. He has partnered with C-suite leaders, private equity and venture funds, sovereign wealth funds and family offices to finance complex fund raises and scale-up ventures, and has led M&A due diligence, post-merger integration and business-transformation initiatives to create value.
At Matchpoint Partners he is Managing Partner, leading the firm's corporate finance, M&A and capital-raising practice. He holds an MBA from London Business School, an engineering degree from VTU and a Master of Laws (LLM, in progress) from UCL London.
An active start-up mentor, CK mentors at Techstars, DIFC FinTech Hive, Startup Grind, Founder Institute and IN5, serves as Entrepreneur Mentor in Residence (EMiR) at London Business School, and judges the Entrepreneurship World Cup.
LinkedIn: https://www.linkedin.com/in/ckadya/
Profile: https://www.matchpoint-partners.com/team/ck-adya.html
