

Introduction
Magnetic measurements support decisions from brain imaging to semiconductor failure analysis. Conventional methods already serve many of these decisions. Superconducting quantum interference devices deliver high sensitivity but require cryogenic operation. Fluxgate and Hall sensors offer robust measurement at different field strengths and frequencies. Electron and magnetic-force microscopy provide other forms of spatial characterisation. Quantum magnetometry creates commercial value only where a specific modality improves the total workflow enough to justify switching cost, validation and operational change.
Optically pumped magnetometers use atomic spins in vapour cells. They can measure very weak fields without cryogenic cooling and can be positioned close to a subject [6,9]. This property has enabled wearable magnetoencephalography systems that tolerate movement and can fit different head sizes. Peer-reviewed work has demonstrated multi-channel systems, free-movement paradigms and clinical research in epilepsy and neurodevelopment [10-16]. These results support a serious product thesis. They also expose system requirements beyond the sensor, including magnetic shielding, active field control, mechanical fit, co-registration, artefact management, source reconstruction and clinical interpretation.
Diamond nitrogen-vacancy magnetometers use spin-active defects in diamond. NIST describes operation across broad field and frequency ranges, room-temperature use, vector measurement and potential applications in biology, electronics and materials [1-4]. The commercial product may be a scanning probe, wide-field microscope, integrated chip-scale sensor or application-specific inspection system. Each form has a different resolution, field of view, acquisition time and sample-preparation burden.
Valuation therefore begins with workflow evidence. The investor or acquirer needs to know which customer decision the product improves, which alternative it displaces or complements, what evidence supports the claim, what additional capital is required and how reliably the installed base produces accepted results and cash. This paper supplies a structure for that assessment.
1 Define the decision before valuing sensitivity
The first question is what changes after the measurement. In healthcare, a research institution may seek higher-quality functional brain data from children, moving subjects or other populations poorly served by fixed cryogenic systems. A clinical team may investigate whether a measurement supports epilepsy localisation or another defined indication. In industry, a semiconductor engineer may need to identify current leakage, localise a failure, map a magnetic structure or verify a device without destructive preparation. A materials laboratory may need nanoscale information unavailable from its current instruments.
The decision should have a named owner, alternative method, acceptance threshold and economic consequence. A technically interesting image has limited commercial value when no customer process depends on it. A lower-cost sensor can still fail commercially when installation, shielding, operator time or analysis cost exceeds the saving. A higher-sensitivity instrument can be valuable even at a premium when it resolves a bottleneck that delays clinical research, product release or root-cause analysis.
The company should write a use-case claim in operational terms. It should state the sample or patient population, field range, bandwidth, spatial resolution, environmental condition, acquisition time, analysis method, output and intended decision. It should also state exclusions. Medical research use, clinical diagnosis and treatment planning are different claims. Laboratory material imaging, in-line quality control and field inspection are different industrial claims.
Commercial discovery should test the budget and adoption route. Hospital capital equipment, research grants, shared imaging facilities, industrial metrology budgets and semiconductor manufacturing tools follow different approval processes. Valuation should not combine them into one addressable market without showing how a product enters each workflow.
2 Separate modalities and application systems
Quantum magnetometry is a category, not a single product. Atomic-vapour magnetometers can deliver very high sensitivity and operate without cryogenic cooling, but they depend on optical pumping, cell conditions, field environment and control electronics. Diamond nitrogen-vacancy sensors can operate at room temperature, cover broad field and frequency ranges and provide fine spatial information, but sensitivity, collection efficiency, defect quality and readout architecture constrain performance [1-4]. Superconducting devices remain strong benchmarks for very weak fields.
An investable product includes more than the sensing element. An optically pumped magnetometer brain-imaging system may include dozens of sensors, a helmet or mounting system, magnetic shielding, active compensation coils, motion tracking, synchronisation, stimulus interfaces, acquisition software, source-modelling software and safety controls. An industrial diamond microscope may include the diamond probe or plate, lasers, microwave sources, optics, positioning, environmental control, sample fixtures, reconstruction software and reference standards.
The bill of materials and the evidence burden differ by architecture. A company that buys commercial sensors and focuses on system integration has different margins and defensibility from a company that manufactures vapour cells, diamonds or photonic readout. A vertically integrated company may control performance and supply but consume more capital. A software-led company may scale faster but depend on scarce hardware and third-party interfaces.
Diligence should map every critical component to its performance contribution, supplier, lead time, rights position and replacement path. Enterprise value should reflect the system that customers buy and operate, not an isolated laboratory sensitivity record.
3 Build distinct evidence ladders for healthcare and industry
The healthcare evidence ladder begins with calibrated sensor performance, then system-level phantom studies, healthy-volunteer research, representative patient studies, reproducibility across operators and sites, and evidence for the intended clinical claim. Regulatory submission, quality management, installation acceptance, training, post-market monitoring and continued clinical use follow when the product is a medical device. A research-use system should be described accurately and should not borrow the value of an unapproved diagnostic indication.
The industrial ladder begins with calibrated measurement, known reference samples, blind tests, repeatability across instruments and operators, representative customer samples, comparison with accepted methods, and a demonstrated effect on yield, diagnosis time or process control. A paid pilot is stronger than an internal demonstration. A repeat order across facilities is stronger than one enthusiastic laboratory.
Evidence should travel with configuration. Sensor generation, shielding, firmware, analysis code, calibration and sample preparation can all change the result. The company needs version control and a claim register that links marketing statements to the exact configuration and study.
Published studies can validate physical capability, system design and potential applications. They do not automatically validate the company's product, manufacturing consistency, regulatory status or customer economics. Diligence should identify whether the tested instrument is the commercial configuration and whether data were generated independently, under a pre-specified protocol and in representative conditions.
Financing milestones should use this ladder. Early equity can fund engineering and controlled studies. Later capital should require accepted workflows, stable product configuration, repeatable production and evidence that intended customers will pay.
4 Benchmark sensitivity inside the complete performance envelope
Sensitivity is normally expressed against frequency and measurement bandwidth. A useful benchmark also states dynamic range, linearity, vector capability, spatial resolution, field of view, dead time, drift, orientation sensitivity and environmental tolerance. For wearable magnetoencephalography, background-field variation during movement can create artefacts even when the sensor's intrinsic noise is low [11,13]. For diamond microscopy, stand-off distance, photon collection, microwave delivery, sample geometry and acquisition time influence the usable image [1-4].
The benchmark should compare the intended workflow with the best available alternative. Optically pumped systems can be compared with superconducting magnetoencephalography and electroencephalography for defined tasks. Diamond microscopy can be compared with magnetic-force microscopy, scanning superconducting sensors, electron-beam methods and electrical probing. The objective is not to declare a universal winner. It is to identify the customer conditions under which the new method provides additional information, faster results, lower operating burden or access to a previously excluded subject or sample.
NIST notes that nitrogen-vacancy sensors offer robustness, broad field and frequency operation and vector measurement, while the best devices have not universally exceeded atomic or superconducting magnetometers for weak-field sensitivity [2,3]. This kind of boundary is commercially useful. It prevents the sales pipeline from filling with unsuitable applications.
A product data sheet should report distributions, not only a best result. Manufacturing variation, sensor-to-sensor matching, calibration interval and field performance determine system yield and warranty cost. The valuation model should connect achieved performance to saleable units and accepted customer results.
5 Treat workflow productivity as a primary value driver
Customers buy completed studies, accepted images and decisions. The operating model should therefore measure setup time, calibration time, acquisition time, usable-data yield, analysis time, repeat scans, operator skill, report turnaround and instrument availability. A scientific improvement that doubles sensitivity may have limited commercial value when the workflow still requires long setup, scarce specialists or extensive manual correction.
For healthcare systems, useful measures include sessions per week, patient completion rate, proportion of channels accepted, motion tolerance, repeat examination rate, analysis turnaround and clinical or research utilisation. Different head sizes and movement patterns matter. A system positioned for paediatric or movement-enabled research should show evidence in those populations rather than extrapolate from stationary healthy adults.
For industrial systems, useful measures include samples per shift, area imaged per hour, first-pass result yield, time to localise a defect, automation rate, operator intervention, sample preparation and uptime. A research microscope sold to a specialist laboratory can sustain a different workflow from an instrument promised for a production line.
Service records create a leading commercial dataset. Installations, calibrations, support incidents, replacement modules, accepted sessions and repeat orders show whether product engineering has become an operating system. Management should report these measures by configuration and customer cohort.
6 Segment healthcare demand by claim and care setting
Healthcare demand should be segmented by use, purchaser and regulatory claim. Academic neuroscience laboratories may buy research systems to study cognition and disease. Specialist imaging centres may evaluate clinical research protocols. Hospitals may consider devices for epilepsy, pre-surgical mapping or other defined applications. Paediatric, neurodevelopmental and movement-disorder research can value wearable form factors because conventional fixed helmets and movement restrictions are limiting [6,10-16].
Each segment has a different economic case. A university may compare a purchase with shared-facility access, grant funding and publication output. A hospital needs evidence of patient benefit, workflow fit, training, reimbursement or budget impact, and regulatory authorisation. A specialist centre may value throughput and referral differentiation. Claims about lower operating cost should include shielding, facilities, service, quality control, staff and analysis.
An installed system does not prove adoption. The board should measure booked sessions, completed sessions, accepted datasets, active investigators, protocols supported, service revenue and renewal. A grant-funded installation can be strategically valuable, but recurring commercial value should be based on observed use and payment.
Clinical partnerships need clear ownership of data, protocols, publications and foreground intellectual property. The company should avoid dependence on one investigator or one institution by building repeatable training, configuration and evidence packages.
7 Segment industrial demand by cost of the bottleneck
Industrial customers pay when information changes a costly process. Semiconductor and electronics applications may include mapping current flow, finding defects, validating magnetic devices or inspecting hidden circuitry. Materials users may study magnetic domains, superconductors, batteries and novel devices. Biological and chemical research can use nanoscale magnetic measurements, but those workflows may remain research-led rather than routine [1-4].
The strongest early use cases combine a valuable sample, expensive delay and inadequate existing method. A failure-analysis team may accept a specialist instrument when it shortens root-cause analysis for a high-value device. A production line requires faster throughput, automation, repeatability and equipment integration. These are separate products even when the sensor physics is shared.
Commercial qualification should record sample type, expected field, required resolution, area, preparation, environment, current method, decision, throughput and value of time saved. It should identify whether the customer needs a measurement instrument, a managed service or an application study. Managed services can generate learning and revenue before customers are ready to operate the equipment.
Market sizing should build from qualified workflows and purchasing sites. A broad semiconductor or medical-imaging expenditure figure gives little guidance about reachable demand. Bottom-up analysis should use account counts, applicable tools per site, replacement cycle, price, service attachment and expected adoption.
8 Design the regulatory and quality pathway early
Medical-device status depends on intended purpose and jurisdiction. United States Food and Drug Administration records classify magnetoencephalographs within neurology and show prior 510(k) pathways for biomagnetometer systems [17]. The European Union Medical Device Regulation and United Kingdom guidance impose requirements that depend on product classification, intended purpose and market [19,20]. A quantum sensor does not receive a separate exemption from ordinary device obligations.
The regulatory plan should define intended use, claims, users, patient populations, comparison device, clinical evidence, software boundaries and significant modifications. Research-use positioning should be controlled so that sales material does not imply an authorised diagnostic claim. Quality management, risk management, human factors, electrical safety, software lifecycle and cybersecurity may all enter the evidence plan.
Regulatory strategy affects value through time, cost and addressable claims. A system may create research revenue while a clinical programme advances, provided the boundaries are genuine. A broad clinical claim can require more evidence and delay. A narrow claim may reach the market earlier but serve fewer decisions. Management should model these paths separately.
Industrial instruments can also face safety, electromagnetic compatibility, laser and export requirements. The diligence plan should identify every standard and approval that gates delivery. Compliance work should be scheduled alongside engineering rather than added after the product architecture is fixed.
9 Control data software and algorithmic claims
Signal processing, artefact rejection, co-registration, inverse modelling and visualisation can determine the value of a magnetometry system. Software may improve usability and reproducibility, yet it also creates model risk. The company should preserve raw data, calibration, preprocessing, parameter choices, code version and final output so that a result can be reproduced.
Healthcare software needs traceability from intended use to requirements, tests and release. Training and validation data should reflect intended populations and settings. An algorithm validated on healthy stationary adults may not support claims in moving children or neurological patients. Human review, uncertainty and failure conditions should be explicit.
Industrial reconstruction should be tested against known standards and independent measurements. Attractive images can hide inverse-problem ambiguity. The report should distinguish observed signal, processed output and interpretation. Customers should understand resolution limits and possible artefacts.
Data rights affect valuation. Contracts should address patient or sample data, derived models, benchmark datasets, publication, security and retention. A proprietary dataset can be valuable only when the company has lawful and durable rights to use it. Diligence should distinguish owned data, licensed data and customer-confidential material.
10 Build manufacturing and supply evidence
Commercial performance depends on repeatable components. Vapour cells, lasers, optics, heaters, coils, shielding materials, diamonds, microwave electronics, photodetectors and positioning stages can create yield and lead-time constraints. The company should maintain a bill of materials linked to qualified suppliers, alternates, acceptance tests and field failures.
Sensor yield should be measured at the specification that customers require. A broad internal pass criterion can overstate saleable output. System matching matters in multi-channel arrays. Replacement calibration, connector reliability, thermal stability and mechanical repeatability affect service cost and customer uptime.
Vertical integration should have a stated economic reason. Owning a critical fabrication step can protect performance and supply. It can also increase capital expenditure, fixed cost and execution risk. Outsourcing can release capital but may expose process knowledge and capacity. The decision should be supported by yield, cost, lead time, rights and strategic dependence.
Warranty reserves and spares should be connected to observed field data. Early systems often change rapidly, creating configuration complexity. Management should control variants and avoid promising support for experimental configurations that cannot be maintained economically.
11 Choose a business model that matches adoption
The company can sell equipment, lease systems, provide measurement services, charge for applications work, license software or combine these models. Equipment sales create upfront revenue but can be volatile and working-capital intensive. Service and software can create recurring revenue, yet recurrence should be based on contractual obligations and observed renewal rather than a label.
Healthcare customers may prefer a capital purchase, managed imaging service or collaborative research programme. A managed service can reduce the customer's operating burden and allow the vendor to control quality, but it requires trained staff and site capacity. Industrial customers may buy a microscope, send samples to a service laboratory or fund an application-development programme before purchase.
Pricing should reflect the decision and delivered workflow. Research discounts and strategic reference sites should be accounted for transparently. A nominal list price has little valuation relevance when most systems are grant-funded, discounted or bundled with unpaid development.
Revenue quality should separate product, installation, service, software, consumables, applications and grants. Contract assets, acceptance conditions, returns, warranty, deferred revenue and customer concentration should be visible. IFRS 15 provides the accounting framework for identifying performance obligations and recognising revenue [29].
12 Model unit economics by product line
Unit economics should be constructed separately for clinical-research systems, industrial instruments and services. Product contribution includes sale price less sensor modules, optics, electronics, mechanics, shielding or sample stages, assembly, test, installation, freight, warranty and sales commission. Recurring contribution includes service labour, replacement parts, cloud or software delivery and customer support.
The wholly hypothetical central case assumes three clinical-research systems at USD 1.25 million each, eight industrial systems at USD 480,000 each, recurring software and service of USD 2.22 million, and paid application studies of USD 1.10 million. Total revenue is USD 10.91 million. Direct product, installation, support and delivery cost is USD 6.18 million, producing contribution of USD 4.73 million before central research, sales and corporate overhead.
The model should reconcile bookings, shipments, acceptance, revenue and cash. Deposit and milestone terms determine working capital. Long component lead times can consume cash before customer acceptance. A product business can show accounting growth while liquidity deteriorates.
Installed-base metrics should include active systems, utilisation, service attachment, renewal, uptime and expansion orders. A system placed with a customer but rarely used should not receive the same valuation treatment as a productive reference installation.
13 Convert pilots into repeatable customer adoption
Pilots should be designed around a purchase decision. The protocol should define sample or subject, comparator, success measure, data rights, acceptance, timeline, decision owner and next commercial step. A pilot without procurement sponsorship can become an open-ended research project.
Healthcare conversion may require ethics approvals, clinical champions, procurement, information security, facilities and regulatory review. Industrial conversion may require application engineering, reference samples, operator training, equipment qualification and integration with existing analysis. The sales cycle should include these steps and their owners.
The company should report cohort conversion: qualified opportunities, funded evaluations, accepted pilots, purchase orders, installed systems, active use, service renewal and expansion. Time between stages matters. A growing pipeline with lengthening conversion can signal weak product fit or an incomplete evidence package.
Reference customers can accelerate trust when permission and claims are controlled. Case studies should state configuration, setting, comparator and outcome. An anonymous or selective example should not be presented as universal evidence.
14 Protect intellectual property without losing operational knowledge
Potential intellectual property includes sensor architecture, vapour-cell or diamond processing, optical and microwave design, magnetic shielding, calibration, field-control algorithms, reconstruction, fixtures, application methods and datasets. A patent count does not establish freedom to operate or product coverage. Claims should be mapped to the commercial configuration and important jurisdictions.
University licences, sponsored research, inventor assignments and government funding can create obligations. Diligence should examine field restrictions, sublicensing, improvements, diligence milestones, royalties, publication rights and change-of-control provisions. Trade secrets require access controls, documentation and practical containment.
Operational knowledge often sits with physicists and application engineers. The company needs reproducible build records, calibration procedures, analysis pipelines, customer protocols and service manuals. Key-person dependence reduces value even when patents are strong.
Data and software rights should be reviewed separately from patents. Open-source components, third-party libraries and model licences can affect distribution. Customer data may support product improvement only under explicit rights. WIPO resources help identify international patent records, but legal analysis remains transaction-specific [30].
15 Address safety security and export controls
Quantum magnetometry systems can contain lasers, microwave electronics, strong compensation coils, sensitive health data and technologies subject to export review. The company should classify products and components, identify controlled destinations and users, and document licences where required. United States Export Administration Regulations provide one relevant framework for cross-border technology and equipment [31].
Healthcare deployments need privacy, cybersecurity, incident response and access controls. Safety analysis should cover electrical, thermal, optical, mechanical and magnetic interactions. Industrial deployments may involve proprietary device designs and critical-infrastructure samples. Customer confidentiality and secure data handling can be a purchasing condition.
Security claims should be evidence-based. A product used by defence or critical-industry customers may need restricted personnel, facilities and supply controls. These requirements can strengthen market access while increasing overhead and limiting collaboration.
The cost model should include compliance staff, testing, documentation and secure infrastructure. Valuation should treat them as part of the delivery system rather than optional central cost.
16 Finance the path through observable milestones
Research capital is appropriate while the principal risk is scientific performance. Product-development capital should fund system integration, reliability, representative studies and design controls. Regulatory capital should be tied to an intended claim and evidence plan. Growth capital should follow saleable configurations, accepted installations, contribution evidence and a qualified pipeline.
Milestones should be falsifiable. Examples include a multi-channel system meeting a stated sensitivity and dynamic-range specification in representative movement; an industrial instrument reproducing a reference map across operators; a completed medical-device submission; manufacturing yield above a defined threshold; or five independent customers renewing service.
Grant and development-contract income can finance valuable work. It should be separated from repeat commercial revenue. Rights, deliverables and cost-sharing matter. A funded programme may reduce dilution while imposing scope or publication obligations.
Working capital deserves explicit funding. Long-lead components, inventory, installation and acceptance can create a cash gap. Customer deposits, milestone billing, equipment finance and supplier terms should match the cycle. The board should retain a downside liquidity reserve rather than assume the next equity round arrives on schedule.
17 Use scenario valuation tied to evidence states
A single discounted-cash-flow model can hide technical and regulatory discontinuities. Scenario valuation should connect enterprise value to evidence states. A research-assets case may value transferable intellectual property, equipment and team. A validated-platform case adds reproducible system evidence. A commercial-instrument case adds accepted products, customers and contribution. A regulated or scaled platform case adds broader claims, installed-base economics and durable recurring revenue.
The hypothetical valuation cases are USD 35 million for research assets, USD 90 million for a validated application platform, USD 190 million for commercial instruments and USD 360 million for a scaled multi-market platform. Probabilities of 20, 35, 30 and 15 percent produce a probability-weighted value of USD 149.50 million. This illustration is not a valuation of any company.
The model should also deduct remaining capital, regulatory cost, warranty exposure, customer concentration, supplier dependence and execution risk. Strategic value should be supported by identifiable access, capability or time advantage. It should not be a plug used to reach a desired price.
Transaction structure can bridge uncertainty. Milestone payments, earn-outs, retention, licensing options and staged investment can link consideration to evidence. The selected mechanism should use measurable events within the relevant party's control and avoid creating incentives to defer investment or customer support.
18 Implement a ninety-day valuation operating system
Days one to thirty should establish the evidence register. Management reconciles product configurations, performance claims, studies, regulatory position, quality records, installed base, contracts, revenue and cash. Each public claim is linked to controlled evidence. Unsupported claims are withdrawn or qualified.
Days thirty-one to sixty should build the product-line economics and use-case qualification system. The team defines healthcare and industrial cohorts, comparator methods, bill of materials, yield, installation cost, service burden, utilisation, contribution and cash conversion. Commercial opportunities are scored against workflow fit and evidence readiness.
Days sixty-one to ninety should complete scenarios and financing gates. The board reviews remaining technical, regulatory, manufacturing and adoption milestones; downside liquidity; ownership of intellectual property and data; and the capital required to reach the next evidence state. Investment materials should show both the opportunity and the conditions that could disprove it.
The operating system continues after financing or acquisition. Monthly reviews reconcile installed systems, accepted results, service performance, pipeline conversion, warranty, contribution and cash. Quarterly reviews update the claim register, regulatory plan, technology roadmap and scenario value.
Conclusion
Quantum magnetometry can create valuable healthcare and industrial products. The route to value depends on translating scientific sensitivity into an accepted workflow. Modality, system architecture, shielding or sample handling, software, manufacturing, regulation, installation and service all affect the delivered outcome.
Investors, acquirers and boards should value evidence states. A healthcare company needs truthful intended-use boundaries, representative clinical evidence, regulatory execution and sustained utilisation. An industrial company needs traceable measurements, throughput, repeatability and an economic effect on the customer's process. Both need configuration control, supply continuity, protected rights, contribution evidence and cash discipline.
The valuation process should therefore remain application specific and milestone based. It should reconcile the claimed measurement advantage with the entire customer workflow, then test whether regulatory obligations, manufacturing capacity, field service and data controls can support the proposed scale. Scenario values should change when observable evidence changes. A successful blind comparison, an accepted regulatory submission, a repeat production order or a measurable reduction in customer downtime can support a higher evidence state. A missed specification, unresolved quality failure, unsupported clinical claim or uneconomic service burden should reduce the probability or value assigned to the affected scenario.
The practical test is whether customers repeatedly use and pay for a defined result. Financing and transaction value should increase as that result becomes reproducible, accepted and scalable.
Appendix A Minimum healthcare evidence schedule
Record intended purpose, user, patient population, environment, comparator, sensor configuration, shielding, field control, acquisition protocol, analysis version, safety controls, study approval, result, uncertainty and acceptance. Separate research use from clinical claims. Link each regulatory statement and marketing claim to its evidence owner.
Track installation acceptance, operator training, sessions booked, sessions completed, usable datasets, repeat examinations, support incidents, service time, active protocols and renewal. Review performance by site and configuration.
Appendix B Minimum industrial evidence schedule
Record sample, expected field, resolution, field of view, environment, preparation, comparator, acquisition time, reconstruction method, operator, result and decision. Use reference samples and blind tests where possible. Preserve raw data and versioned analysis.
Track samples per shift, first-pass yield, uptime, calibration interval, application support, service incidents, accepted pilots, instrument orders, active use and repeat purchases.
Appendix C Financial controls
Reconcile bookings, shipments, installation, acceptance, invoicing, revenue and cash by system. Allocate component, assembly, test, freight, installation, warranty, service and application-engineering cost to the relevant product line. Track deposits, inventory, work in progress, deferred revenue and receivables.
Separate grants, development contracts, product revenue, service, software and application studies. Stress unit yield, component lead time, acceptance delay, sales conversion, service burden and customer concentration.
Appendix D Commercial evidence ledger
For each use case record customer decision, modality, configuration, comparator, evidence state, delivered output, acceptance, economics, rights and next gate. Link the ledger to the claim register, regulatory plan, product roadmap, sales pipeline and financing milestones.
The board should distinguish measured performance, calculated operating metrics and hypothetical assumptions. Claims without controlled evidence should be removed.
Appendix E Decision figures and tables
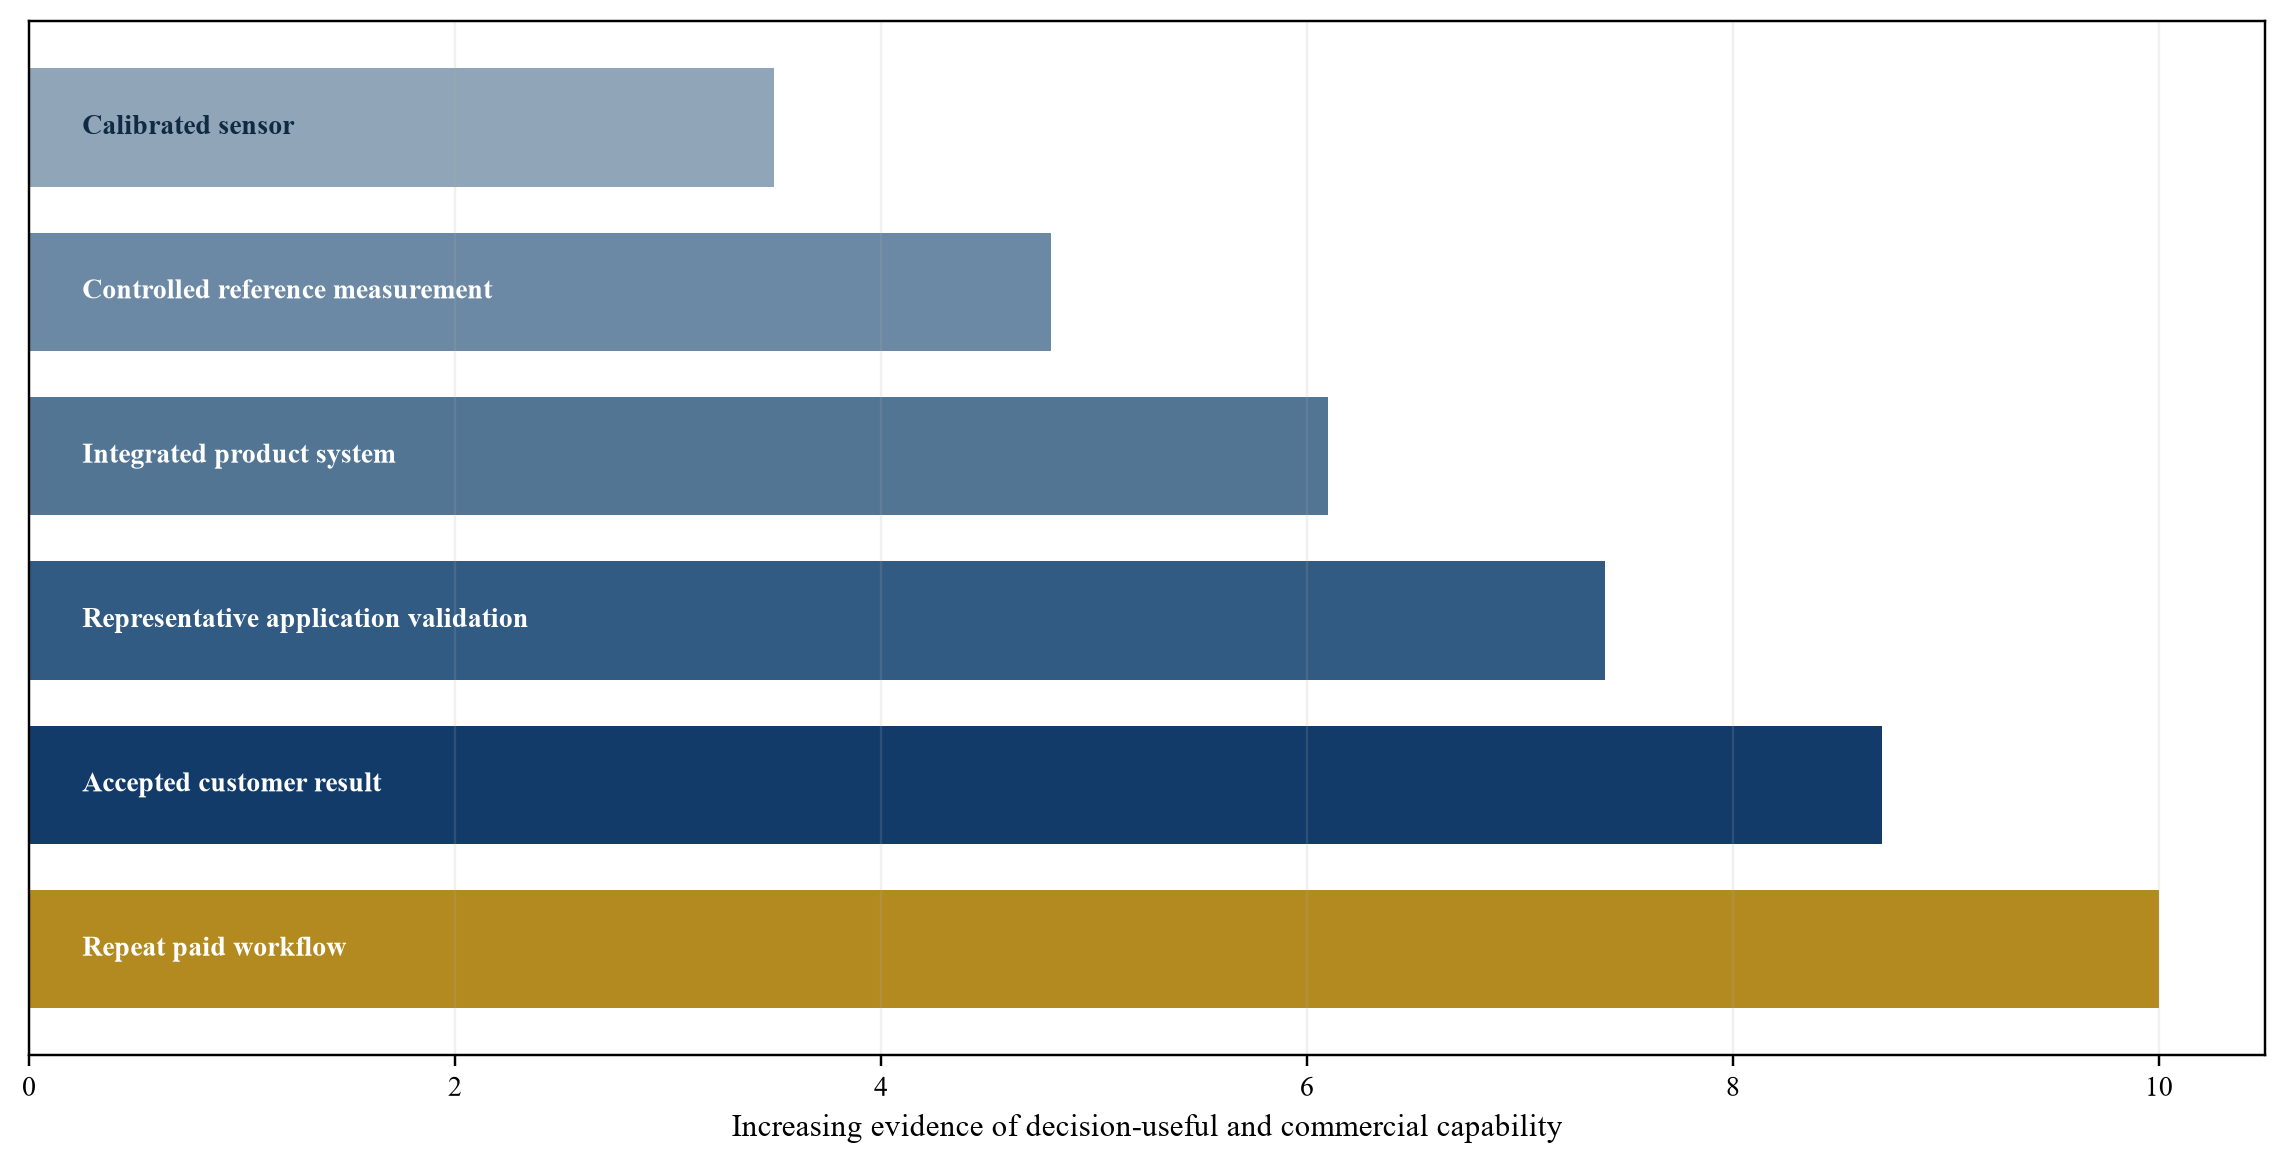
Proposed progression from calibrated sensor to repeat paid workflow.
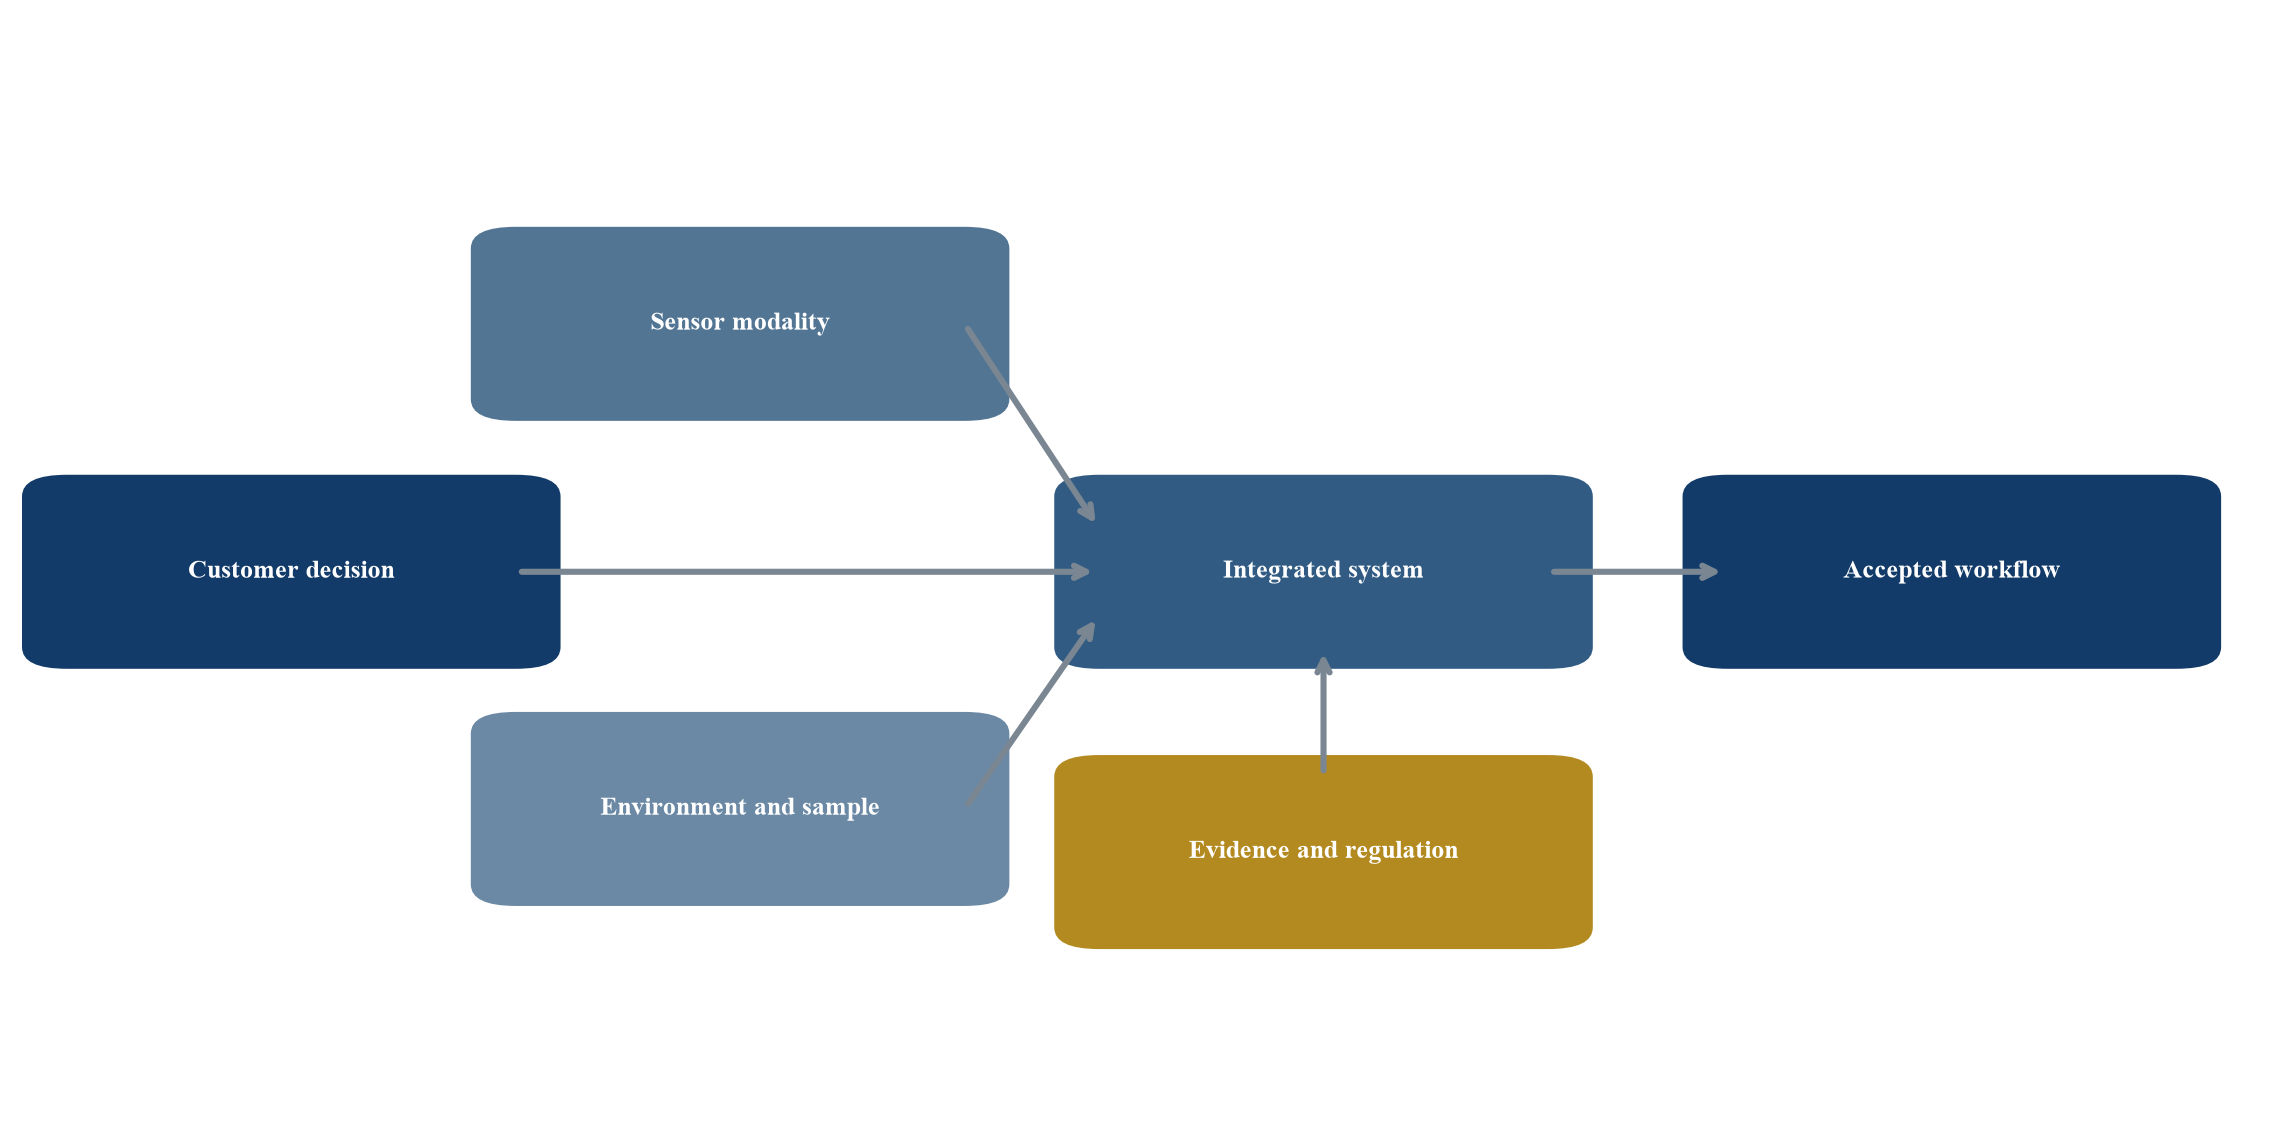
Value follows the complete application system and accepted customer result.
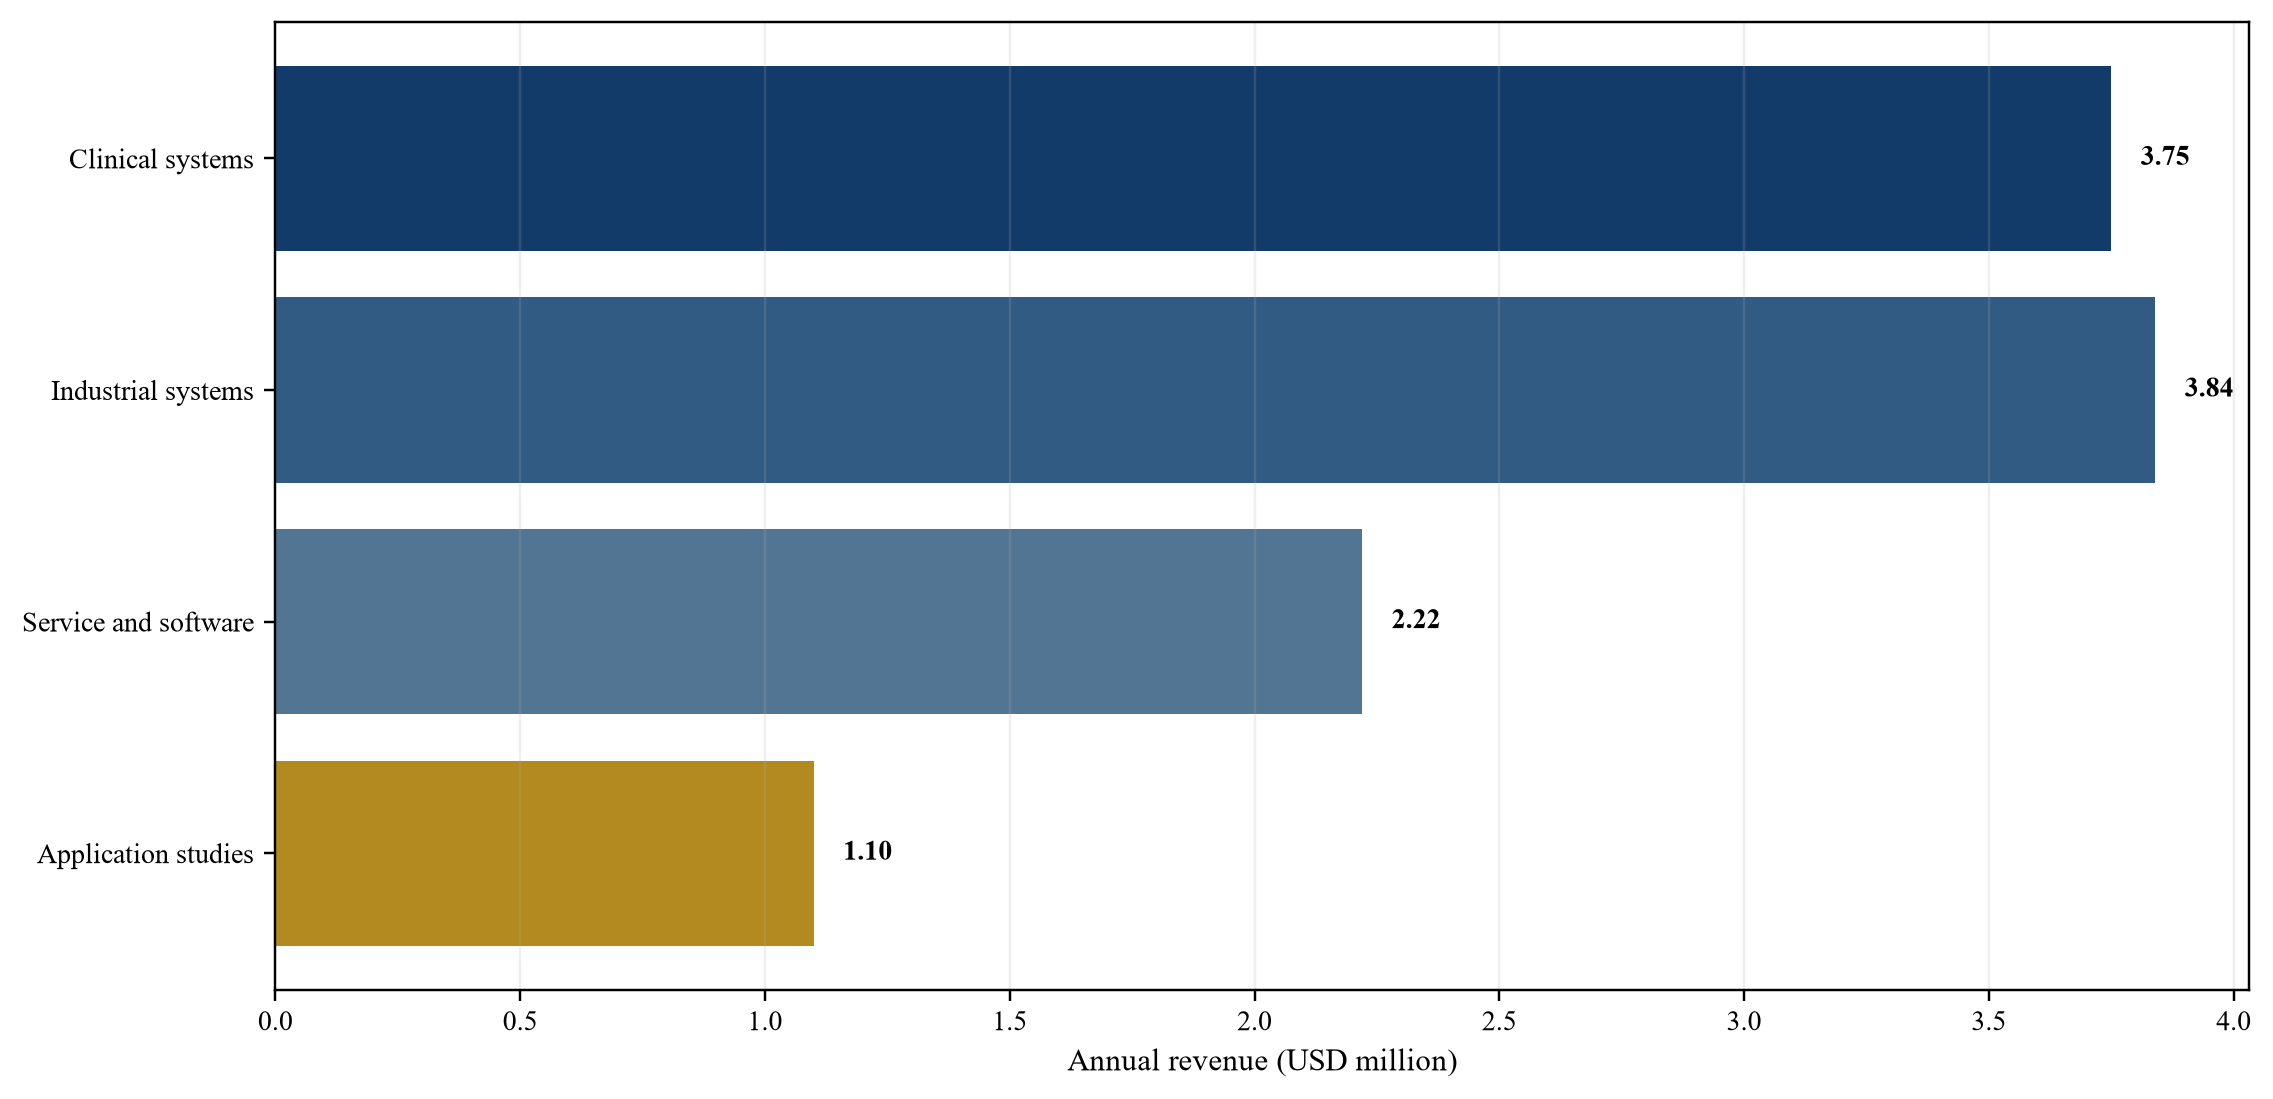
Wholly hypothetical management assumptions; USD million.
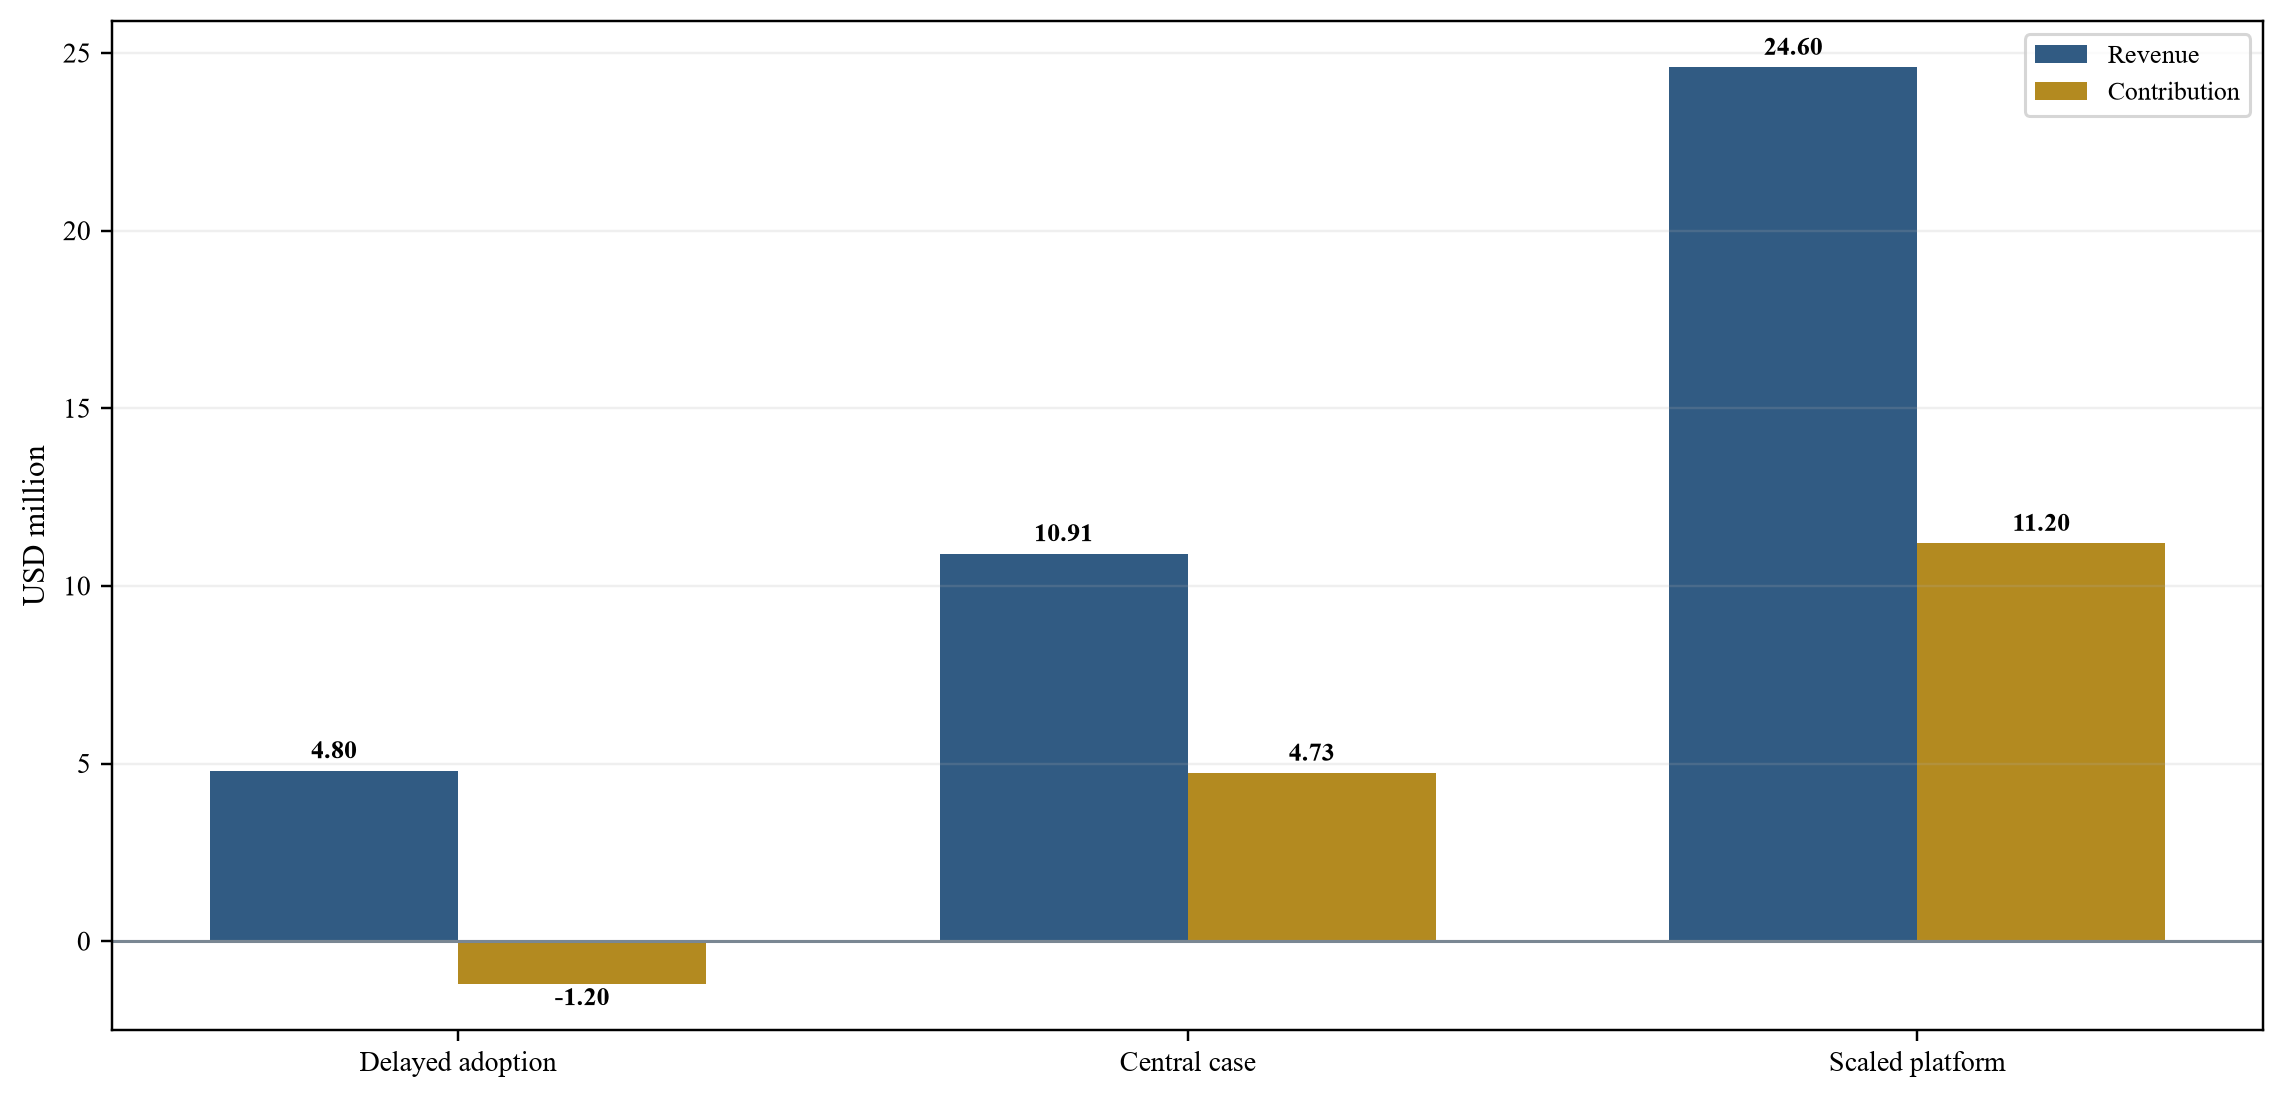
Wholly hypothetical management assumptions; USD million.
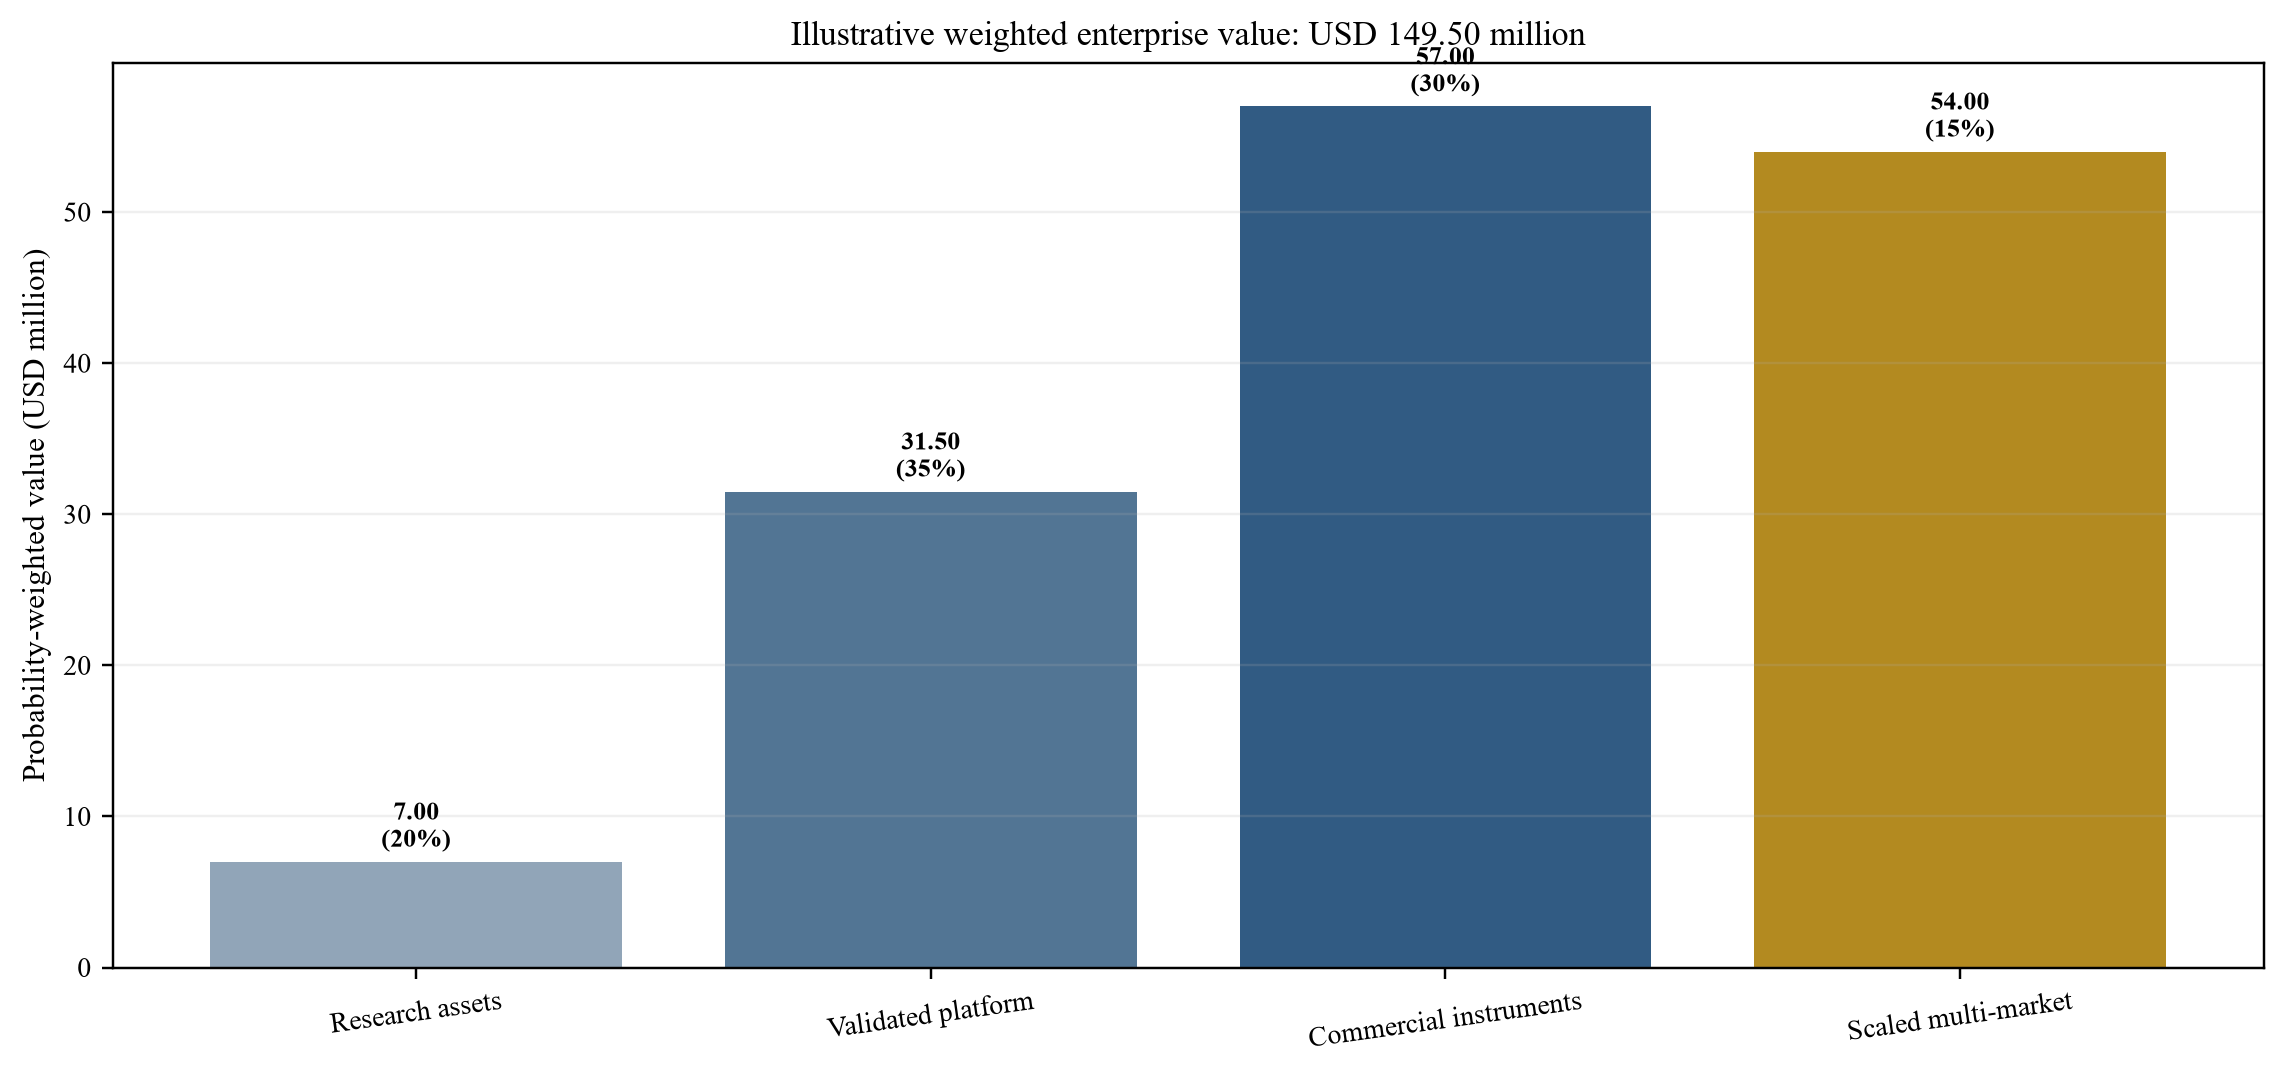
Wholly hypothetical management assumptions; USD million.
| Level | Required evidence | Principal residual risk | Capital treatment |
|---|---|---|---|
| Calibrated sensor | Traceable field measurement and controlled protocol | System performance unproved | Research capital |
| Controlled reference measurement | Known source or phantom and repeatability | Representative conditions | Product-development capital |
| Integrated product system | Complete hardware, environment and software | Workflow reliability | Integration capital |
| Representative application validation | Intended samples or populations and comparator | Generalisability and regulation | Validation capital |
| Accepted customer result | Paid work and documented acceptance | Repeat demand and contribution | Commercial capital |
| Repeat paid workflow | Multiple customers, operators and systems | Concentration and scaling | Growth capital |
Proposed financing and valuation classification.
| Dimension | Required evidence | Common weakness | Decision question |
|---|---|---|---|
| Decision | Named action and accountable owner | Interesting measurement without workflow | What changes after the result? |
| Modality | Performance envelope and comparator | Best sensitivity treated as universal | Why this sensor here? |
| Environment | Shielding, motion, sample and interference model | Laboratory assumptions applied to customer site | Can the system operate reliably? |
| Evidence | Representative protocol and acceptance | One demonstration or selected image | Is the result reproducible? |
| Adoption | Budget, procurement and implementation route | User interest without buyer | Who pays and how? |
| Economics | Delivered cost and measurable benefit | Broad market value attributed to one tool | Does the workflow create value? |
Proposed commercial qualification for healthcare and industry.
| Modality | Principal strength | Important limitation | Commercial fit |
|---|---|---|---|
| Atomic-vapour magnetometer | Weak-field sensitivity without cryogenic sensor | Environmental field and system-control demands | Biomagnetism and field sensing |
| Diamond nitrogen-vacancy sensor | Room-temperature operation, vector sensing and spatial resolution | Readout efficiency and application-specific sensitivity | Microscopy, electronics and materials |
| Superconducting quantum interference device | Established very-weak-field sensitivity | Cryogenic operation and fixed geometry | Conventional magnetoencephalography and metrology |
| Classical solid-state sensor | Robustness, cost and mature integration | Lower sensitivity or different bandwidth | General industrial field measurement |
General comparison; actual performance depends on configuration and use case.
| Revenue or cost item | Units or basis | Revenue | Direct cost |
|---|---|---|---|
| Clinical-research systems | 3 systems at 1.25 | 3.75 | 2.28 |
| Industrial microscopy systems | 8 systems at 0.48 | 3.84 | 2.16 |
| Service and software | Installed base and annual contracts | 2.22 | 0.92 |
| Application studies | Paid development and measurement work | 1.10 | 0.82 |
| Total | Central case | 10.91 | 6.18 |
| Contribution before central overhead | Revenue less direct cost | 4.73 |
Wholly hypothetical management assumptions; USD million.
| Scenario | Revenue | Contribution before central overhead | Principal condition |
|---|---|---|---|
| Delayed adoption | 4.80 | -1.20 | Pilots extend, product mix remains bespoke and utilisation is low |
| Central case | 10.91 | 4.73 | Accepted systems, service attachment and paid application work |
| Scaled platform | 24.60 | 11.20 | Repeat configurations, broader channels and productive installed base |
Wholly hypothetical management assumptions; USD million.
| Scenario | Evidence state | Enterprise value | Probability | Weighted value |
|---|---|---|---|---|
| Research assets | Transferable science, intellectual property and team | 35 | 20% | 7.00 |
| Validated platform | Reproducible representative application system | 90 | 35% | 31.50 |
| Commercial instruments | Accepted products, customers and contribution | 190 | 30% | 57.00 |
| Scaled multi-market platform | Durable installed base and repeat workflows | 360 | 15% | 54.00 |
| Total | Probability-weighted enterprise value | 100% | 149.50 |
Wholly hypothetical management assumptions; USD million.
| Decision question | Minimum evidence | Owner | Gate |
|---|---|---|---|
| Is the customer decision defined? | Intended use, comparator and acceptance | Commercial and application leads | Opportunity qualification |
| Does the complete system perform? | Versioned protocol, raw data and representative validation | Technical committee | Product claim |
| Is the regulatory boundary controlled? | Intended purpose, classification and evidence plan | Quality and regulatory lead | Market access |
| Can systems be produced and supported? | Yield, suppliers, installation, uptime and warranty | Operations leadership | Capacity release |
| Does adoption create contribution? | Accepted orders, utilisation, service and collected cash | Finance and commercial leads | Growth funding |
| Can downside liquidity be funded? | Runway, working capital and staged actions | Board and finance | Capital release |
Proposed governance control.
Sources
- National Institute of Standards and Technology. Diamond NV Center Magnetometry. Updated 26 March 2025. Read the primary source
- National Institute of Standards and Technology. Nitrogen-Vacancy Center Magnetometry. 2026. Read the primary source
- National Institute of Standards and Technology. Sensors for a Magnetic World. 2026. Read the primary source
- National Institute of Standards and Technology. Spectroscopy and Application of Solid-State Quantum Centers. 2024. Read the primary source
- National Institute of Standards and Technology. NIST Diamond Magnetometry Pathfinding Workshop. 2026. Read the primary source
- UK National Quantum Technologies Programme. Four ways quantum technologies are advancing the future of healthcare. 2021. Read the primary source
- UK Research and Innovation. Winners of Contracts for Innovation quantum funding announced. 11 November 2025. Read the primary source
- UK Research and Innovation. UK Quantum Technologies Challenge Project Directory. 2025. Read the primary source
- Tierney, T. et al. Optically pumped magnetometers From quantum origins to multi-channel magnetoencephalography. NeuroImage. 2020. Read the primary source
- Seymour, R. et al. Applications of OPM-MEG for translational neuroscience a perspective. Molecular Psychiatry. 2024. Read the primary source
- Brookes, M. et al. Magnetoencephalography with optically pumped magnetometers the next generation of functional neuroimaging. Trends in Neurosciences. 2022. Read the primary source
- Rea, M. et al. A 90-channel triaxial magnetoencephalography system using optically pumped magnetometers. Annals of the New York Academy of Sciences. 2022. Read the primary source
- Limes, M. et al. A Novel Robust and Portable Platform for Magnetoencephalography using Optically Pumped Magnetometers. 2024. Read the primary source
- Wang, X. et al. Performance of optically pumped magnetometer magnetoencephalography validation in large samples and multiple tasks. Journal of Neural Engineering. 2024. Read the primary source
- Brickwedde, M. et al. Optically pumped magnetometers enhance neuroimaging performance. 2026. Read the primary source
- Vivekananda, U. et al. Optically pumped magnetoencephalography in epilepsy. Annals of Clinical and Translational Neurology. 2020. Read the primary source
- United States Food and Drug Administration. MagView Biomagnetometer System 510k K152184. Updated 6 July 2026. Read the primary source
- United States Food and Drug Administration. Premarket Notification 510k. 2026. Read the primary source
- European Union. Regulation EU 2017 745 on medical devices. 2017. Read the primary source
- Medicines and Healthcare products Regulatory Agency. Regulating medical devices in the UK. 2026. Read the primary source
- United States Food and Drug Administration. Quality System Regulation and Medical Device Good Manufacturing Practices. 2026. Read the primary source
- United States Food and Drug Administration. Cybersecurity in Medical Devices Quality System Considerations and Content of Premarket Submissions. 2023. Read the primary source
- International Organization for Standardization. ISO 13485 Medical devices Quality management systems. 2016. Read the primary source
- Department for Science Innovation and Technology. National Quantum Strategy. Updated 14 December 2023. Read the primary source
- Department for Science Innovation and Technology. National Quantum Strategy Missions. Updated 14 December 2023. Read the primary source
- National Institute of Standards and Technology. Atom-Based Quantum Sensing of Electromagnetic Fields. 2025. Read the primary source
- National Institute of Standards and Technology. Machine Learning Driven Self-correcting Autonomous Metrology Systems. 2026. Read the primary source
- European Commission CORDIS. Portable Quantum Sensors for Neurosurgery. 2026. Read the primary source
- International Financial Reporting Standards Foundation. IFRS 15 Revenue from Contracts with Customers. 2026. Read the primary source
- World Intellectual Property Organization. PATENTSCOPE patent search. 2026. Read the primary source
- United States Department of Commerce Bureau of Industry and Security. Export Administration Regulations. 2026. Read the primary source
- International Financial Reporting Standards Foundation. IAS 38 Intangible Assets. 2026. Read the primary source
